
Factors Affecting the Determination of Density and ...
104
FACTORS AFFECTING THE DETERMINATION OF DENSITY AND MOISTURE BY NUCLEAR RADIATION TECHNIQUES JULY, 1963 NO. 18 w WlTCZAK PURDUE UNIVERSITY LAFAYETTE INDIANA / /77/ t
Transcript of Factors Affecting the Determination of Density and ...

FACTORS AFFECTING THEDETERMINATION OFDENSITY AND MOISTUREBY NUCLEAR RADIATIONTECHNIQUES
JULY, 1963
NO. 18
w WlTCZAK
PURDUE UNIVERSITYLAFAYETTE INDIANA
//77/ t


e
-
TO:
tr
FRQKs Eo L» j:.ichael;
P.
Joint Ei>
!frc MatthcReport entitled "Fac
Moisture by Nuclearthe research whichreported for his MSCE t
Shis repoivarious facte cs tha :sof soils "by nuclearprinciple u The inv< rise of radia I .reand density measurement is cc ng»
This report, will s led tcRoads through the Indiana Commiscomments inasaiuch as this - was per7?ormed as
The report is prese
HIM:he
Attach®
Copies:
F„ L AshbauciarJo Eo CooperWo L„ DclchW„ E, GoetzF„ To HaveyF So HillGo A Leonards
ughlinR«
R.
ttJ 5 To Srayt
Jo L„ 'baling
Bo Jc Yoder

Progress Report
FACTORS AFFECTING THE DETERMINATION OF
DENSITY AND MOISTURE BY NUCLEAR RADIATION
TECHNIQUES
by
Matthew WitczakGraduate Assistant
Joint Highway Research Project
File No: 6-10-
5
Project No: C-36-I6E
Purdue University-
Lafayette, Indiana
May 15, 1963

Digitized by the Internet Archive
in 2011 with funding from
LYRASIS members and Sloan Foundation; Indiana Department of Transportation
http://www.archive.org/details/factorsaffectingOOwitc
11
ACKNOWLEDGMENTS
The author sincerely expresses his gratitude to
Professor Eldon J. Yoder, who patiently guided and advised
In times when endeavor and endurance were most needed.
Grateful acknowledgment Is made for the assistance
to the research project by the Joint Highway Research
Project of Purdue University, Professor K. E. Woods,
Director, and financial assistance obtained from Purdue
University.
The author expresses his gratefulness to all those
who contributed to completion of the project. Also,
the critical review of this text by Professor V. Eergdolt
of the Nuclear Engineering Department is acknowledged.

Ill
TAELE OF CONTENTS
Page
LIST OF TABLES v
LIST OF ILLUSTRATIONS vi
ABSTRACT lx
INTRODUCTION 1
REVIEW OF LITERATURE 3
Historical 3Theory k
Principles of Moisture Gage . UPrinciples cf Density Gage 5
Summary of Physical Principles 7
PURPOSE AND SCOPE 8
MATERIALS 10
EQUIPMENT 16
Instruments 16Compaction and Measurement 16
PROCEDURES OF TESTING 18
General 18Material Group 1 19Material Group II 1?
DISCUSSION CF RESULTS 21
Substrate Material Properties 21Material Type 21Grain Size Distribution 33Moisture in Material Mass 37Depth of Penetration 38

lv
Page
Instrument Stability 42Temperature 42Timer 46Voltage 47Aging 49
Instrument Test Procedure 56Reliance of Self-Standard 56Use of Leveling Course 64Variations of Density Calibration Procedures. . . .73
CONCLUSIONS 76
Substrate Material Type 76Instrument Stability 77Instrument Test Procedure 73
SUGGESTIONS FOR FURTHER RESEARCH 79
BIBLIOGRAPHY. 80
APPENDIX A 83
Statistical Errors Based on a Polsson Distribution. .84
APPENDIX B 87
Summary of Statistical Errors of Density Tests. . . .88

LIST OF TABLES
Table Page
1. Physical Data of Materials Studied Ik
2. Quantitative Analysis of Material Group II . . . 15
3. Effect of Temperature Upon Counts 45
4. Number of Density Tests Within Standardand Reliable Errors 88
vl
LIST OF ILLUSTRATIONS
Figure > Page
1. Standard AASHO Compaction Curves . . .11
2. Grain Size Distribution Curves of MaterialGroup I 12
3. Grain Size Distribution Curves of MaterialGroup II 13
4. Density Calibration Curve for MaterialGroup I - Instrument A ; . . .22
5. Density Calibration Curve for MaterialGroup I - Instrument B. . . 23
6. Density Calibration Curve for MaterialGroup II - Instrument A 2^
7. Density Calibration Curve for MaterialGroup II - Instrument B ..25
8. Relations Between Mass Absorption Coefficientand the Energy of Gamma Radiation for ElementsCommonly Found in Soil 27
9. Moisture Calibration Curve for MaterialGroup I and II - Instrument A 30
10. Moisture Calibration Curve for MaterialGroup I and II - Instrument B..... 31
11. Effect of Clay Content on Moisture Measurements .32
12. Effect of Grain Size Distribution UponDensity Readings for Msterial Group II -
Instrument A 3^
13. Effect of Grain Size Distribution UponDensity Readings for Material Group II -
Instrument B 35

vil
Figure Page
14. Influence of Depth of Material on RelativeCount for Several Unit Weights - Instrument B . .39
15. Influence of Depth of Material on RelativeCount for Several Moisture Ranges 40
16. Approximate Depth of Penetration Versus BulkUnit Weight and Moisture - Instrument B 4i
1?. Influence of Depth of Liquids on Counts perMinute for Several Unit Weights - Instrument A .43
18. Approximate Depth of Penetration Versus BulkUnit Weight - Instrument A 44
19. Effect of Battery Voltage Upon Counts -
Instrument A 48
20. High Voltage Curves Showing Counts Per Minuteon Concrete Elock, Self-Standard , and CountRatio Over Variable Operating Voltages of thePlateau Region - Instrument A 51
21. Moisture Plateau Curves Showing Self-StandardCounts Per Minute Over Variable OperatingVoltages - Instrument A 52
22. High Voltage Curves Showing Counts Per Minuteon Concrete Block, Self -Standard, and CountRatio Over Variable Operating Voltages of thePlateau Region - Instrument B 53
23. Effect of Standard Air Gap Under DensityGage Upon Self -Standard Readings 58
24. Effect of Standard Air Gap Under MoistureGage Upon Self -Standard Readings 59
25. Density Calibration Results Expressed as CountsPer Minute and Relative Count for MaterialGroup I - Instrument A 6l
26. Density Calibration Results Expressed as CountsPer Minute and Relative Count for MaterialGroup I - Instrument B 62
27. Moisture Calibration Results expressed as CountsPer Minute and Relative Count for MaterialGroup I - Instrument B 63

vlll
Figure Page
28. Effect of Leveling Course Upon Density Readingsfor Fine Crushed Material - Instrument A . . . .66
29. Effect of Leveling Course Upon Density Readingsfor Open Graded Material - Instrument A 67
30. Effect of Leveling Course Upon Density Readingsfor Fine Crushed Material - Instrument B . . . .68
31. Effect of Leveling Course Upon Density Readingsfor Open Graded Material - Instrument B 69
32. Effect Upon Density Count Range When UsingLeveling Course for Material Group II -
Instrument A 71
33. Effect Upon Density Count Range When UsingLeveling Course for Material Group II -
Instrument B 72
3^. Comparison of Various Density CalibrationMethods - Instrument E 7k
35» Various Error Systems Associated with RadiationIntensity Levels for Corresponding ConfidenceLimits 85
36. Relative Count Errors Associated with ConfidenceLevels for Nuclear Density Gages of InstrumentA and B 86

lx
ABSTRACT
Witczak, Matthew, M.S.C.E., Purdue University, June
1963. "Factors Affecting the Determination of Density
and Moisture by Nuclear Radiation Techniques" . Major
Professor: Eldon J. Yoder.
This report contains, a laboratory Investigation of
various factors that Influence the determination of density
and moisture by nuclear radiation techniques that utilize
the backscatter principle.
A total of five materials were tested in the research
program. These materials were subsequently divided into
two material groups. This was done as an aid In employing
different procedures of testing to the groups. For one
group, a system of built-up material layers was tested for a
given type. The last group of tests were performed on
several gradlngs of a crushed limestone and a siliceous
gravel.
It was concluded that material type is a factor which
influences nuclear density determinations. For the moisture
unit, material type had no effect upon count readings for
all materials tested. Grain size distribution influenced
nuclear density readings for a given material type. Effect

of moisture In the substrate material upon ienslty readings
was considered negligible for the range In moisture
quantities studied.
Generally, Instrument stability was a function of
the Instrument In question. Adverse effects of temperature
were negligible for density and moisture self-standards
for Instrument A, while Instrument B was found to be
aInoperative at a temperature of F. Instrument A devia-
tions In density counts per minute were considered to be
adverse for battery supply voltage conditions , however
the use of a count ratio procedure eliminated this devia-
tion.
It was found that extreme care must be taken to Insure
that physical conditions surrounding the density gages
are the same when taking self-standard readings at diff-
erent times. If this Is not observed, validity of results
obtained are questioned even though a count ratio pro-
cedure Is used tc analyze the data. The Introduction of
a leveling course had greater effect on the density results
obtained on the open graded materials than on those for the
finer crushed materials.

INTRODUCTION
The determination of the soil density and moisture
content Is of the utmost Importance to the Civil Engineer.
Likewise, the speed, accuracy, and reliability of the
actual measurements are also of extreme Importance.
In the past several years, a new method of measur-
ing soil density and moisture was developed through the
use of radioactive attenuation. This method was developed
on the nuclear physics' principles that the attenuation
of gamma rays Is dependent on the density of the material
and fast neutrons can be directly moderated by the presence
of water.
However, the applications of radioactive scintilla-
tion methods to soil density and moisture measurement
have been limited because of uncertainties regarding methods
of calibration. Accuracies obtained from field usage
based on a single manufacturer's curve have been questioned
by some Investigators. In fact, difference in viewpoints
have been expressed as to the true connotation of accuracy
as applied to soil density and moisture measurements.
Eut in all eventualities, the nuclear system of
soil measurement is in Its Infancy. Undoubtedly, llmlta-

tions stemming from various factors are Imposed on the
usage of the equipment at present. However, through the
combined skills of the scientist and the engineer, the
applications will widen and the limitations will diminish.

REVIEW OF LITERATURE
Historical
The discovery of a neutral particle to possess the
capability of ejecting protons from a paraffin block by
collision was made by Sir James Chadwlck In 1932. In
1920, E. Rutherford suggested the presence of this particle,
which he called a neutron; however, It wasn't until Chad-
wlck* s work In the 1930' s before the first direct evidence
of Its existence was established.
As time progressed, research teams soon became
cognizant of the neutron moderating facility of the hydro-
gen atom and consequently water. In the late 19^'s the
Civil Aeronautics Administration set forth the first
attempt to establish soil density and moisture by nuclear
methods In the United States. Contracts were given to
Cornell University to establish the adaptability of nuclear
techniques to soil measurement.
Pleper (1), Krueger (2), and Belcher and Cuekendall (3)
Investigated the problem and the results were favorable.
Feasibility of nuclear techniques was established but
limited In nature due to the lack of portable Instrumenta-
tion. However, Improvements were soon devised by Carlton (k)
In 1953, and by Roy and Wlnkerkorn (5) in 1957. In 1956,
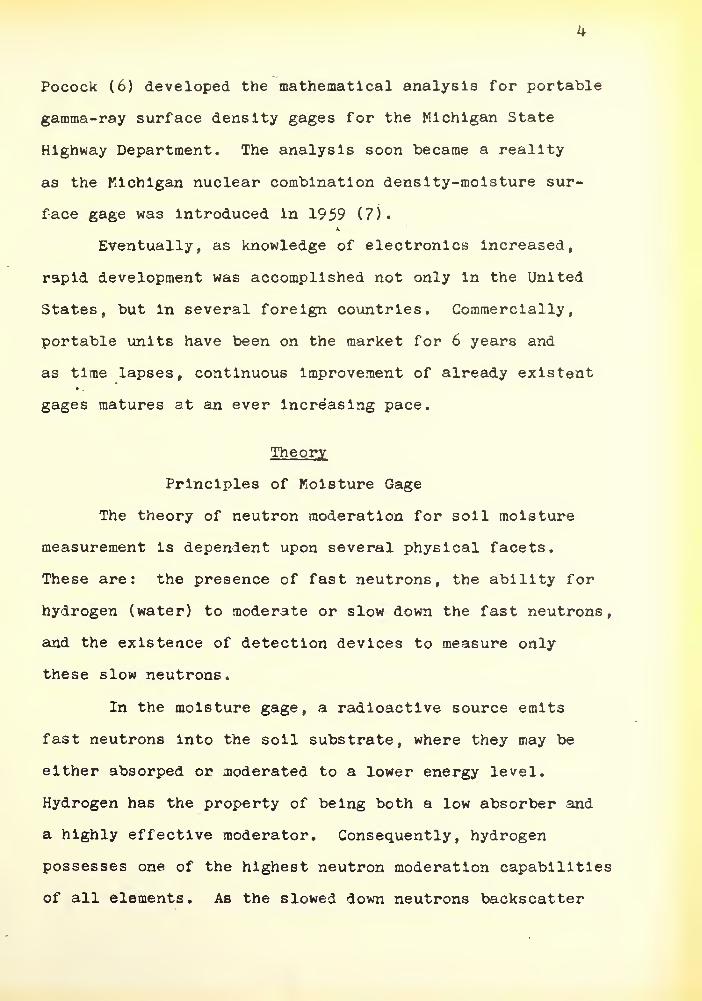
Pocock (6) developed the mathematical analysis for portable
gamma-ray surface density gages for the Michigan State
Highway Department. The analysis soon became a reality
as the Michigan nuclear combination density-moisture sur-
face gage was introduced In 1959 (7).It
Eventually, as knowledge of electronics Increased,
rapid development was accomplished not only in the United
States, but In several foreign countries. Commercially,
portable units have been on the market for 6 years and
as time lapses, continuous improvement of already existent
gages matures at an ever Increasing pace.
Theory
Principles of Moisture Gage
The theory of neutron moderation for soil moisture
measurement Is dependent upon several physical facets.
These are: the presence cf fast neutrons, the ability for
hydrogen (water) to moderate or slow down the fast neutrons,
and the existence of detection devices to measure only
these slow neutrons.
In the moisture gage, a radioactive source emits
fast neutrons into the soil substrate, where they may be
either absorped or moderated to a lower energy level.
Hydrogen has the property of being both a low absorber and
a highly effective moderator. Consequently, hydrogen
possesses one of the highest neutron moderation capabilities
of all elements. As the slowed down neutrons backs catter

In all directions throughout the substrate, some of them
are transmitted to the detecting device, Ionized, and
sent as a pulse signal to a recording device called the
scaler. Since the moderation is dependent upon the amount
of hydrogen present in a volumetric zone of Influence,
results are calibrated against the weight of hydrogen
(water) present In a certain volume; ususally taken as
a unit volumetric measurement.
Principles of Density Gage
Nuclear density units can be classified Into two
types: direct transmission and surface backscatter gages.
Since both Instrument A and Instrument B are of the latter
case; the following discussion Is primarily related to
the theory employed in the surface backscatter gage.
The theory involved in the operation of the back-
scatter device is extremely complex. As the photons
penetrate into the soil substrate, they can either be
absorbed by the mass (Photo Electric Effect) or can collide
with a loosely bound electron and scatter a reduced energy
photon in a different direction. (Compton Effect)
The concept introduced for these relatlvlstlc quan-
tum effects for expressing that any of these possibilities
will happen is the cross section 0". The cross section
represents an area which is proportional to the probabil-
ity of an event taking place. If the number of atoms
per unit volume is represented by i\; then the linear

absorption coefficient /x. is the product of 'A & a or:/*---"\v
The units of the absorption coefficient yU. are length
If the linear absorption coefficient Is divided by the
weight per unit volume of the material, a mass absorption
coefficient jul^ for the material is defined ( /^- "O, " ) •
The units are length2 x mass"^ for the mass absorption
coefficient.
The equation governing the intensity of a parallel
beam of photons passing through an absorber of thickness-/At
t can be represented by: I = I e where I is the intensity
of radiation incident to the absorber, and t is the thick-
ness of the absorber. If the linear absorption coefficient,
ju. is replaced by /^tf^ , then the general equation re-
lating intensity to substrate density is defined as:
For the Compton Effect, a mathematlc model was created
and experimentally Justified by Carey and Reynolds (6)
and (8). The expression Isk.V+k^ + kjO represented the
intensity recorded from a gage put on a material with
an infinite number of electrons available for collisions
but no absorption (8)
.
Since these relationships cannot exist Independently
of each other, due to a resulting absorption Increase
as the number of electrons Increase; the combined inten-
sity was stated as the product of the two effects, or:
1= I e (kVtkJf + V.zt ) where k^, k , k_, k^ represent
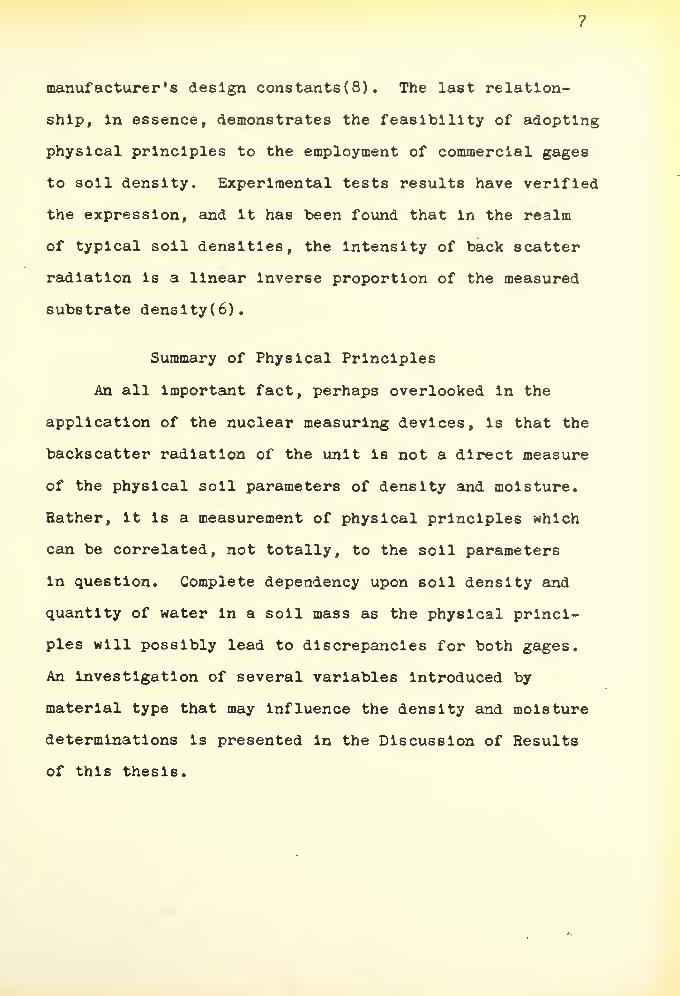
manufacturer's design constants(8) . The last relation-
ship, in essence, demonstrates the feasibility of adopting
physical principles to the employment of commercial gages
to soil density. Experimental tests results have verified
the expression, and it has been found that in the realm
of typical soil densities, the intensity of back scatter
radiation is a linear inverse proportion of the measured
substrate denslty(6).
Summary of Physical Principles
An all Important fact, perhaps overlooked in the
application of the nuclear measuring devices, is that the
backscatter radiation of the unit Is not a direct measure
of the physical soil parameters of density and moisture.
Rather, it is a measurement of physical principles which
can be correlated, not totally, to the soil parameters
In question. Complete dependency upon soil density and
quantity of water in a soil mass as the physical princi-
ples will possibly lead to discrepancies for both gages.
An investigation of several variables Introduced by
material type that may Influence the density and moisture
determinations is presented in the Discussion of Results
of this thesis.

8
PURPOSE AND SCOPE
The purpose of this study was to investigate various
factors affecting the nuclear density and moisture results
in laboratory tests. Two instruments were employed in
the research program; however, no attempt was made to
correlate the performance of one instrument with the other.
The selection .of variables used as the foundation
for the testing were categorized into: substrate material
properties, Instrument stability, and procedural factors.
There Is little doubt that the variables categorized in
each group are not all inclusive or complete in their
nature. However, it is felt that the major possible causes
of variances in test results were investigated.
For the category of substrate property effect, three
variables were Introduced. These were material type,
presence of moisture in the sample, and grain size dis-
tribution.
Also involved in this category was an investigation
relative to the determination of the effective depth of
penetration for density and moisture.
For investigations pertaining to instrument stability,
system checks were completed on the adverse effects of
battery voltage, timer accuracy, and the effect of tempera-
ture upon count readings. Also, aging effects of the
instrument were studied through the use of periodic
voltage plateau curves.
The variable of procedure includes methods of express-
ing final results as well as procedures employed in the
determination of count readings. Tests reflecting the
reliance of self-standards were accomplished to determine
their repeatability as instrument checks. The use of
self-standards in expressing results as a count ratio
was made. Effects upon density count readings when using
a leveling course between the instrument and material
were studied. Finally, densities were calculated by bulk
volume methods and correlated with sand cone densities.
10
MATERIALS
A total of 5 different materials were tested with
two commercial nuclear Instruments. The materials were:
I. Material Group I
A. Coarse Sand
B. Sand-Soil Mix
C. Sandy Gravel
II. Material Group II
A. Quartzlte
B. Limestone
For the materials In group II, a total of three
grain size distributions were used for both the quart-
zlte and limestone; with physical data appearing for
only gradation III.
Figures 1, 2, and 3 show the standard AASHC com-
paction curves and grain size distribution curves,
respectively. Table 1 summarizes the physical data of
the materials studied, while Table 2 presents a
quantitative analysis for the limestone and quartzlte.
11
140
h-ooL_
OCDIDo
UJa.
COQ2OQ_
I
XCD
UJ
>•
Q
130
120
10
100
LEGEND^ MATERIAL GROUP I
© COARSE SAND
© SAND-SOIL MIX
© SANDY GRAVEL
MATERIAL GROUP H"
@ QUARTZITE© LIMESTONE
©
NOTE^ COMPACTION CURVES(§) AND © APPLY TOGRADATION HI
8 12 16 20MOISTURE CONTENT-PERCENT
24
FIG. I STANDARD AASHO COMPACTION CURVES

12
ONISSVd !N30d3d
13
IDOo
NQ.3Ooro
m _iQ co <
UJ tr1- UJUl i-- 2 <_l 2_l
21
u.o
UJ 0)N UJCO >
m z or
< Oo
m
- o
oo
oCD CO
o o o8 8
NISSVd IN
8 2
CD
IT
UJN
<a:o
ou.

Ik
TABLE 1
PHYSICAL DATA OF MATERIALS STUDIED
Material Max. StdAASHC
Dry Densipcf
•
ty
OptimumMoistureContent %
PlasticityIndex
SpecificGravity
Sand-Soil Mix 121.4 11.6 16 2.67
Sandy Gravel 132.8 9.2 NP 2.65
Coarse Sand 113.7 1^.5 NP 2.71
Quartz lte * 130.7 7.2 NP 2.66
Limestone * 135.8 7.0 NP 2.75
* Note: Data apply to gradation III.

TABLE 2
QUANTITATIVE ANALYSIS OF MATERIAL GROUP II
Material Fe2 3A12 3
sio2
Quartz lte * - - 97.2%
Limestone * _ _ 12.1*
* Note: Data apply to gradation III.
15
CaO
47.156

16
EQUIPMENT
Instruments
Two commercially available Instruments were used
during the testing program. Throughout the entire text,
the Instruments have been referred to as Instruments
A and B.
Both instruments are portable type backscatter gages.
Basically, a complete measuring unit has three distinctive
component parts. They are the scaler, the density gage,
and the moisture gage.
The radioactive source and a detection system are
located In both the density and moisture gage. The
function of the scaler is to transfer pulses transmitted
from either surface gage Into counts to be recorded on
a series of glow tubes as the desired result.
Compaction and Measurement
For specimens obtained by a tamped compactive effort,
a pneumatic compactor with a k* diameter rubber tipped
foot was used. Operating pressures for the compactor
were between 60-80 psl. All samples were tested in a
split steel mold. The dimensions of the mold used were
2k* in diameter, 14£" in height, and |" thick. Bulk

17
weights were determined on a portable floor scale using
a lever-type balance. Accuracy of the scale was deter-
mined to be -0.5 of a pound.
18
PROCEDURES OF TESTING
General
All readings taken throughout the testing period were
Intended to be expressed as a count ratio with the Instru-
ment self-standards. However, during the course of the
testing program, wide dally variations In self-standards
were observed for Material Group I. This lead to an
investigation relative to the validity of a count ratio
analysis for Material Group I.
An average reading was defined with the Instrument
oriented a minimum of three directions and with a
minimum of two readings per direction. A minimum of six
standard readings were used to define the average self-
standard for a test. All readings were taken with the
high voltage constant throughout the testing program.
Concrete blocks were constructed and used periodically
as an equivalent check to the Instrument self-standard.
Soil preparation was usually completed by adding
water, completely mixing the water and soil, and placing
a cover over the soil overnight to prevent air drying.
The following day, the soil was placed in the container
* See page 56

19
and nuclear readings would commence. Moisture content
samples were taken Immediately after the test. Moisture
contents were determined using standard oven drying
procedures
.
Material Group I
The materials tested In this group were a sand-soil
mix, a coarse sand, and a sandy gravel. Variance In
density was achieved primarily by adding varying amounts
of water to each sample. In general, two densities,
poured loose and tamped, were utilized In the placement
for a given moisture content.
The materials were tested In the 24 Inch split mold.
The materials were built up In layers varying In thick-
ness from 3/4" to l£" , the unit weight of the total
sample being determined as each layer was placed. After
the total layer height was determined to be greater than
the depth of penetration for the Instrument being tested,
a count reading was obtained on each of the succeeding
material layers. This resulted In testing of from one
to four layers depending on the Instrument and type
of material under study.
Material Group II
The materials tested In this group were quartz lte
and limestone. Density variations were attributed to
two methods of placement, poured loose and tamped, and

20
the selection of 3 different gradations. Materials were
crushed and hand selected to yield desired ranges of
gradation.
For gradation I and II (see Figure 3) both methods
of placement were applied to the soil completely dry.
A third density condition was obtained by completelyK
saturating the sample. Distilled water was used In the
quartzlte tests, gradation I and II, as an aid in investi-
gating the effects upon density and moisture readings.
Tap water was used for both the quartzlte and limestone
for gradation III.
Nuclear density count readings were taken under
conditions of two different placement methods. The
first method was to place the gage directly over the
material and to make certain by visual observation that
no immediate air gaps existed between the gage and materi-
al. The second procedure consisted of crushing a portion
of the particular test material used, and placing it
directly on the surface of the soil to act as a leveling
course. The thickness of the leveling course used under
the gage was visually made as thin as possible.
Nuclear moisture count readings were taken Immediate-
ly after the density tests. Therefore, the moisture
measurements , in essence , were obtained through the
leveling course directly under the gage.
21
DISCUSS J CN OF RESULTS
Substrate Materiel Properties
Material Type
By far, the most important Item of conjecture In the
application of nuclear density gages to field use has -
been that of Influence of material type upon density
readings. A variety of opinions have been stated as to
the relative effect cf this parameter upon density deter-
mination.
Figures h and 5 show the results of density tests
of Material Group I for the two instruments. These curves
illustrate the data scattering for the three materials
tested within this group although their validity may be
questioned.* A single line of regression is shown for
the combined test results. Besults are expressed in a
relative count procedure for the last layer tested.
Figures 6 and 7 are density results, plotted using
the count ratio procedure, of Instrument A and Instru-
ment B for Material Group II. The difference between
calibration curves for the limestone and quartzlte is
quite obvious, with differences in densities for a given
* See page 56
22
.34
90 100 110 120 130 140 150
BULK UNIT WEIGHT-POUNDS PER CUBIC FOOT
FIG. 4 DENSITY CALIBRATION CURVE FOR
MATERIAL GROUP I- INSTRUMENT A

23
3oo
LU
>
2.00
.90
1.80
1.70
.60
< 1.50
UJen
.40
1.30
LEGEND^
X SAND-SOIL MIX
O SANDY GRAVELA COARSE SAND
NOTE: RESULTS OF LAST LAYERTESTED
_L
90 100 110 120 130 140 150
BULK UNIT WEIGHT- POUNDS PER CUBIC FOOT
FIG. 5 DENSITY CALIBRATION CURVE FORMATERIAL GROUP I -INSTRUMENT B

Zb
.34-
.32
.30 -
z .28 h
OOUl
> .26 h
UJen
.24 -
.22 -
.20
1 1 1 11
1
V
N. X\
—
>v o \X. X \
N.
\o\x
LEGEND: x QUARTZITEo LIMESTONE
~ NOTE GRADATION m
I l 1 1 1 1
90 100 110 120 130 140 150
BULK UNIT WEIGHT- POUNDS PER CUBIC FOOT
FIG. 6 DENSITY CALIBRATION CURVE FOR MATERIALGROUP H- INSTRUMENT A

25
c.co1 "T 1 1 1
2.10 " \2.00
X x\
1.90 h
=> 1.80ooUJ
i- 1.70<_jui
1.60
1.50
1.40
LEGEND X QUARTZITEo LIMESTONE
NOTE GRADATION M
1 190 '00 110 120 130 140 150
BULK UNIT WEIGHT-POUNDS PER CUBIC FOOT
FIG. 7 DENSfTY CALIBRATION CURVE FOR MATERIALGROUP H-INSTRUMENT B

26
reading being approximately 15 pcf for Instrument A and
approximately 35 pcf for Instrument B. It should be noted
that both the limestone and quartz lte shown have Identical
grain-size distribution curves (Gradation III).
The results show that the density count relationship
Is a function as the physical characteristics of the
substrate. It has been stated In the section of this
thesis dealing with the historical review that the general
equation of the nuclear density unit Is
I- I e"k^ {*?+*$* k/ ).*
For the absorption effect I e It Is assumed that the
mass absorption coefficient M.^ can be replaced by a design
constant k4 , Intrinsic to the circuitry of the unit.
However, the mass absorption coefficient Is hardly suit-
able for replacement by a design constant, as It Is a
function of both the photon energy and type of element.
The values of the mass absorption coefficient and Its
dependence upon elements commonly found In soils has been
given by Parsons and Lewis (9) and Is shown In Figure 8.
It can be seen from this graph that at energy levels lower
than 0.3 Mev,**a significant departure among the mass
absorption coefficients for various elements occurs.
EaBe has the major portion of its energy spectra at
two energy levels. These levels are at 0.6l Mev and 0.35
Kev. Since a portion of the Initial energy is lost due
* See Page 6*« Kev - Million Electron Volts
2?
0.2
GAMMA RAY0.4
ENERGY —
FIG. 8 RELATIONS BETWEEN MASS ABSORPTIONCOEFFICIENT AND THE ENERGY OF GAMMARADIATION FOR ELEMENTS COMMONLYFOUND IN SOIL (FROM PARSONS AND LEWIS)
28
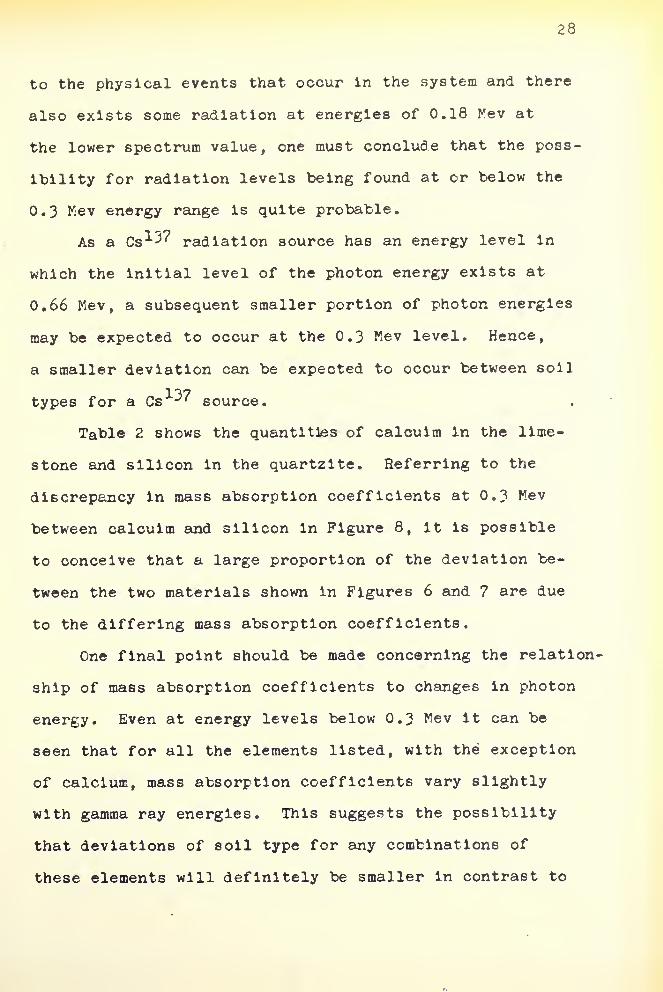
to the physical events that occur In the system and there
also exists some radiation at energies of 0.18 tfev at
the lower spectrum value, one must conclude that the poss-
ibility for radiation levels being found at or below the
0.3 Kev energy range Is quite probable.
As a Cs^? radiation source has an energy level In
which the Initial level of the photon energy exists at
0.66 Mev, a subsequent smaller portion of photon energies
may be expected to occur at the 0.3 Mev level. Hence,
a smaller deviation can be expected to occur between soil
types for a Cs <? source.
Table 2 shows the quantities of calcuim In the lime-
stone and silicon In the quartzite. Referring to the
discrepancy in mass absorption coefficients at 0.3 Mev
between calcuim and silicon In Figure 8, it is possible
to conceive that a large proportion of the deviation be-
tween the two materials shown In Figures 6 and 7 are due
to the differing mass absorption coefficients.
One final point should be made concerning the relation-
ship of mass absorption coefficients to changes in photon
energy. Even at energy levels below 0.3 Mev It can be
seen that for all the elements listed, with the exception
of calcium, mass absorption coefficients vary slightly
with gamma ray energies. This suggests the possibility
that deviations of soil type for any combinations of
these elements will definitely be smaller in contrast to

29
calcareous type material. However, the evidence of a
singular soil type deviation definitely hinders the adoption
of present backscatter gages to wide field usage.
Figures 9 and 10 present moisture calibration curves
for Instruments A and B. Material type had little effect
In the results for both Instrument's. Therefore, a single
line of regression was calculated for all soils. The
effect of testing with distilled water was a slight
decrease In counts when contrasted to results obtained by
using ordinary tap water. Since Just several tests were
made with moisture greater than 15 pounds of water per
cubic foot, conclusions regarding non linearity of the
calibration curve cannot be stated.
As a rule, soil type has little effect upon moisture
counts. Only when organic deposits are tested may devia-
tions occur as the carbon and nitrogen usually found In
these deposits exhibit a reduced neutron moderator
characteristic similar to hydrogen.
Partridge and Rlgden (10) have shown the effect of
clay content on moisture measurements, (see Figure 11)
It Is well to remember that a moisture gage will measure
all neutron moderation encompassed In the substrate
system. As the clay content Is Increased In a soil con-
taining water, an Increased resistance to the bound water
being driven out of the system by heat Is encountered.
Although a moisture unit will measure all forms of

30
z>ooUJ>
<
.60
.50
.40
.30
UJ
°= .20
.10
° %/
LEGENDx SAND-SOIL MIXa COARSE SANDo SANDY GRAVELa LIMESTONE• QUARTZITE© QUARTZITE (DISTILLED
WATER)
-L J_
4 8 12 16 20
MOISTURE-POUNDS PER CUBIC FOOT
24
FIG. 9 MOISTURE CALIBRATION CURVE FOR MATERIALGROUP I AND U -INSTRUMENT A

31
MOISTURE-POUNDS PER CUBIC FOOT
FIG. 10 MOISTURE CALIBRATION CURVE FOR MATERIALGROUP I ANDE- INSTRUMENT B

32
3
UJCL
C/)
7000
6000
5000
4000
3000
3O° 2000
1000
LEGEND HEAVY CLAYMEDIUM CLAYSANDY SOIL
//
FIG. II
2 4 6 8 10 12
MOISTURE CONTENT % DRY WEIGHT(OBTAINED BY OVEN-DRYING)
EFFECT OF CLAY CONTENT ON MOISTUREMEASUREMENTS (FROM PARTDRIGE ANDRIGDEN)
v
'

33
hydrogen present, conventional oven drying tests under
standardized conditions do not effectively drive out all
the water present. As a result, the nuclear method measures
one quantity of water present while the conventional oven
test measures a reduced quantity of water.
Grain Size Distribution
Reference has been made to the Importance of mass
absorption coefficients of various soil elements for
nuclear density determination. However, the concept of
this coefficient Is a mlcrophyslcal property assigned a
macrophyslcal value. This lead the author to Investigate
the effect of testing an open graded material which In
turn was crushed to a finer material. In essence, this
became an analysis of whether similar mass absorption
coefficients could be defined by the same soil element
composition at different grain size distributions, which
in turn, could posslbily be Indicative of the homogeneity
of the substrate.
The results of the above tests are shown In Figures
12 and 13. Both instruments indicated similar count
reductions for both materials tested as the open graded
distribution was crushed finer. However, several points
regarding the illustrations should be discussed.
It Is not the feeling of the author that for every
possible grain size distribution, at constant soil element
composition, deviations between calibration curves can be

34
3OO
UJ
>
£
.34
.32
.30
.28
.26
> 24
<
.22
.20
LEGEND:o GRADATION KCOARSE)x GRADATION IE(MEDIUM)^ GRADATION TJT(FINE)
LIMESTONEQUARTZ ITE
NOTE: READINGS TAKEN WITHOUT LEVELING COURSE
_L I
90 100 110 120 130 140 150
BULK UNIT WEIGHT— POUNDS PER CUBIC FOOT
FIG- 12 EFFECT OF GRAIN SIZE DISTRIBUTION
UPON DENSITY READINGS FOR MATERIAL
GROUP H- INSTRUMENT A

35
2.40
2.20
2.00
=>OoUJ
^ 1.80
<_lUJ
1.60
140
A-x
LEGEND^GRADATION I (COARSE)
X GRADATION n (MEDIUM* GRADATION m (FINE)
LIMESTONEQUARTZITE
NOTE^ READINGS TAKEN WITHOUT LEVELING COURSE
1100 110 120 130 140
BULK UNIT WEIGHT - POUNDS PER CUBIC FOOT
FIG. 13 EFFECT OF GRAIN SIZE DISTRIBUTION UPONDENSITY READINGS FOR MATERIAL GROUP II-
INSTRUMENT B

36
expected to exist. Rather, It Is felt that a certain state
of grain size distribution this effect Is negligible. To
an extent, the data illustrate this feeling. In figures
12 and 13, a characteristic humped point is evident for
all curves tested for Gradation II. It is telieved that
since this particular point was attained by compacting
the specimen with the pneumatic tamper, there is a poss-
ibility that particle segregation may have occurred, thus
leading to a subsequent smaller density of the top layer
closest to the gage. Extreme points about the tamped
point for the same gradation curve were tested on speci-
mens carefully placed by use of a hand scoop. It is
pointed out that lor these extreme test points of
Gradation II a relative proximity to the calibration
curve for Gradation III does exist for all illustrations.
One might logically argue the fact that if particle
segregation might be a possible cause of error fcv the
tamped point cf Gradation II, the large deviation of
Gradation I from Gradation III might te a result of the
identical error as it possesses a larger possibility of
segregation during the placement. Against this argument,
the relative positions of points obtained by hand place-
ment for Gradation Curve I is pointed out. With the
exception of the quartzlte curve for Instrument A, these
points are the initial low density results. The combination
of their deviation from the ether calibration curves and

37
the reduced possibility of segregatlonal effects contrasted
to a point obtained with a pneumatic tamper, make the
author believe that an effect of grain size distribution
for a given soil type does exist and Is dependent upon
a physical phenomena rather than a procedure type error
In placement of the soil In the mold.
Moisture In Material Mass
Hydrogen, like any other soil element, is respondent
to gamma ray absorption. This effect Is illustrated In
Figure 8. Subsequently, data was analyzed for all mater-
ials to see if pronounced effects were noticeable.
Upon an analysis of data, no trends showing the effect
of moisture on density counts were noticeable for either
Instrument. If existent, these deviations were confined
In the scatter of data for a given material at the range
of moisture contents obtained In testing.
Although hydrogen has the largest variation in mass
absorption coefficient to other soil elements, Its influ-
ence upon a density calibration curve can be expected to
be insignificant due to the relative proportion of the
weight of hydrogen to other soil elements. A report from
the Road Research Laboratory (9) states:
M It is estimated that the variation of calibrationdue to the hydrogen contained in water would not be morethan l-l£ pounds per cubic foot In bulk density for avariation In moisture content of 10 per cent."

38
Depth of Penetration
As radiation Is emitted from a source In a backscatter
gage, a limit of distance Is Imposed upon a radioactive
particle which can penetrate the substrate, undergo the
physical reactions of the system, and yet possess an
energy range capable of being registered by the detection
system of the nuclear unit In question.
For Instrument B, tests were made on Material Group I
to determine the approximate depth to which the Instru-
ments measured density and moisture. Layers were built
up in the mold and density and moisture counts were ob-
tained as a function of the depth of material present in
the mold.
The influence of depth of material upon the counts
obtained using both gages is shown in Figures Ik and 15
•
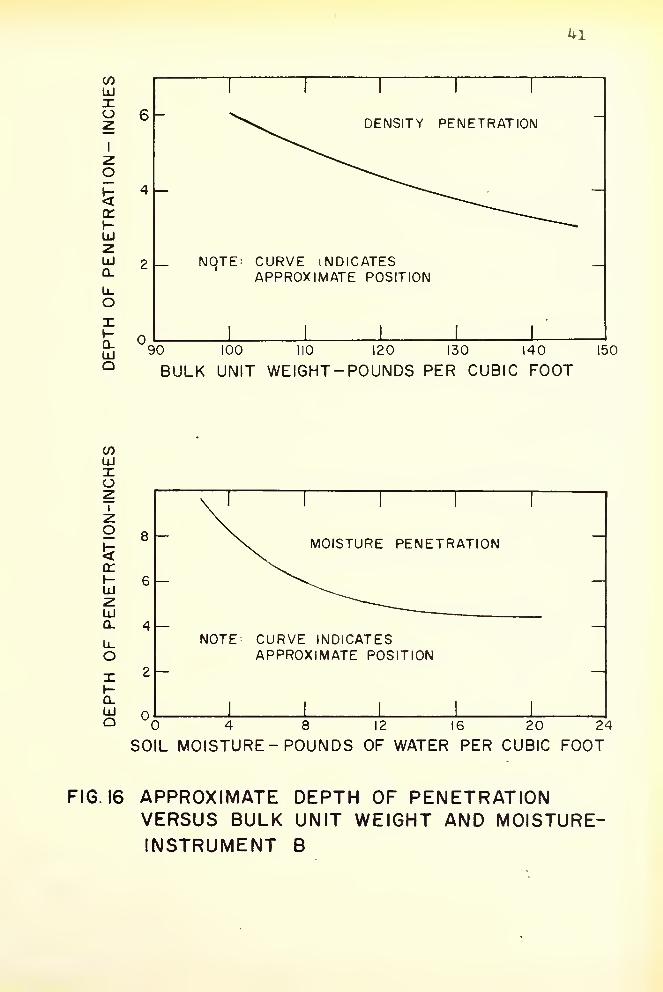
From these graphs, the approximate depth of penetration
for a given density or moisture value was defined as the
lowest depth at which a consistent count reading was
obtained regardless of material depth. Figure 16 repre-
sents the approximate depth of penetration curves for
density and moisture content obtained with Instrument B.
For the results obtained with Instrument B, an
average depth penetration of 8 inches occurred at ** pounds
of water per cubic foot contrasted to an average of 4£
inches at 20 pounds of water per cubic foot. For a density
of 100 pounds per cubic foot, a depth of approximately

39
oo
LU>
<-I
UJ
1.90
1.80
,70
.60
1,50
1.40
.30
120
"C"
103-3 PCF
NOTE
© SAND- SOIL MIX
• SAND -SOIL MIX
a COARSE SAND
x SANDY GRAVEL
NUMBERS ON CURVESINDICATE DENSITIES OF MATERIALS
ESTIMATED BEST FIT LINES1
8 10
FIG. |4
2 4 6
DEPTH — INCHES
INFLUENCE OF DEPTH OF MATERIAL
ON RELATIVE COUNT FOR SEVERAL
UNIT WEIGHTS— INSTRUMENT B

40
3OoUJ
>I-<_lUJcr
1.20
1.00 —12.4 # H
20/FT~
19.9 # H20/FT':
6.6 # H20/Fr
I o o
2.4 # HgO/FT—1-4
—
LEGEND x SAND-SOIL MIXA COARSE SANDo SANDY GRAVELA COARSE SAND
NOTE: NUMBERS ONCURVES INDICATEQUANTITY OFMOISTURE PER UNITVOLUME
ALL CURVES ESTIMATED FOR BEST FITX _L
4 6 8
DEPTH- INCHES
10
FIG. 15 INFLUENCE OF DEPTH OF MATERIAL ONRELATIVE COUNT FOR SEVERAL MOISTURERANGES- INSTRUMENT B
kl
en
Xo
I
zo
S3
a:\-LU
UJQ.
Li_
o
Q_UJQ
6 -
4 —
DENSITY PENETRATION
_ NOTE^ CURVE INDICATESAPPROXIMATE POSITION
190 100 110 120 130 140
BULK UNIT WEIGHT-POUNDS PER CUBIC FOOT150
UJXo
^ 8
i-LU
UJQ.
U_OXI-Q.LUQ
6 —
2 —
MOISTURE PENETRATION
NOTE CURVE INDICATESAPPROXIMATE POSITION
14 8 12 16 20 24
SOIL MOISTURE- POUNDS OF WATER PER CUBIC FOOT
FIG. 16 APPROXIMATEVERSUS BULKINSTRUMENT
DEPTH OF PENETRATIONUNIT WEIGHT AND MOISTURE-B

5 inches Is considered to be effective for the density
gage while at about 150 pounds per cubic foot a depth of
3 Inches results.
For Instrument A, the effective depth of penetration
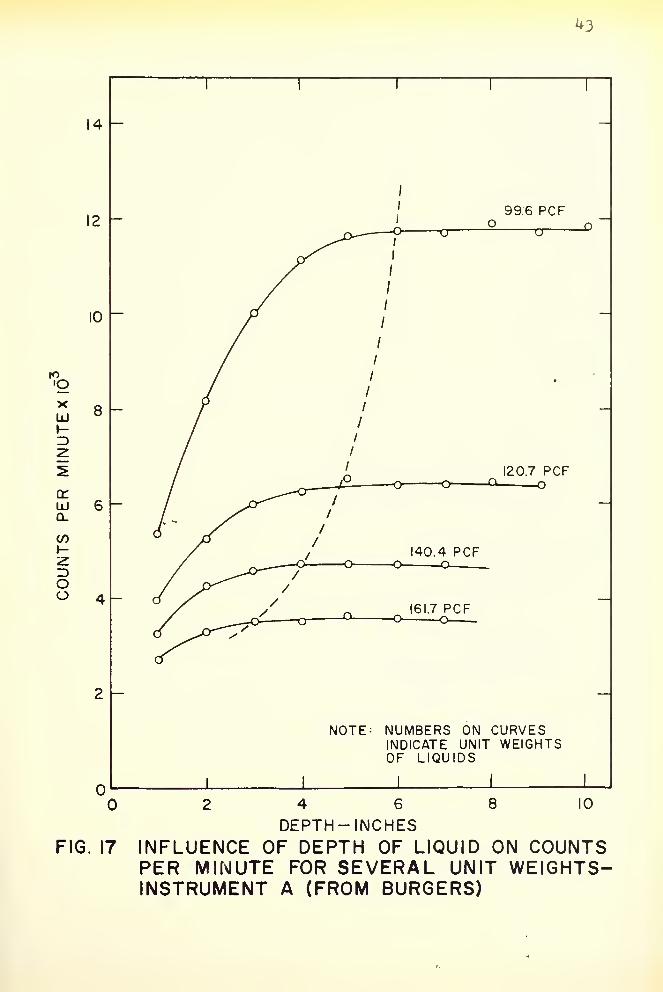
for the density gage was previously determined by Burgers(ll).
His results are based upon a study of heavy liquids and
their employment as a self -standard check. This data Is
shown in Figure 17.
Figure 17 shows the Influence of depth of liquid on
density counts for several unit weights, whereas Figure 18
Indicates the approximate depth of penetration for the
density device. These results indicate a depth of pene-
tration of approximately 6 Inches at 100 pounds per
cubic foot and 3& inches at a density of 150 pounds per
cubic foot.
Instrument Stability
Temperature
If a gage Is to consistently perform Its functional
use, the effect of temperature upon Its repeatability
becomes an Important matter. Tests were performed on
both instruments at two temperature extremes, 0°F and
o o75 F« For the test performed at F, instruments were
placed in a cold room for a period of 2 hours before the
tests were made. All readings were taken at constant
high voltage and after an arbitrary warmup time of 15
minutes.
*0
to'O
xLU
crLUQ_
CO
Z>OO
14
10
8
99.6 PCF
-crO X>
-O-120.7 PCF
140.4 PCFO-
161.7 PCF
NOTE: NUMBERS ON CURVESINDICATE UNIT WEIGHTSOF LIQUIDS
18 102 4 6
DEPTH-INCHESFIG. 17 INFLUENCE OF DEPTH OF LIQUID ON COUNTS
PER MINUTE FOR SEVERAL UNIT WEIGHTS-INSTRUMENT A (FROM BURGERS)

kk
<f)
LUXo 10
z1
o\- R<(T1-LU
2LUQ. B
U_oX1-
Q. 4UJQ
DENSITY PENETRATION
NOTE: CURVE INDICATES APPROXIMATEPOSITION
100 110 120 130 140 150 160
BULK UNIT WEIGHT- POUNDS PER CUBIC FOOT
FIG. 18 APPROXIMATE DEPTH OF PENETRATIONVERSUS BULK UNIT WEIGHT - INSTRUMENT A(INTERPOLATED FROM BURGERS)

45
The results of this test are shown In Table 3« For
Instrument A density gage, a decrease of 357 counts at
F existed from the self-standard determined at 75 ™«
An increase of 244 counts was recorded for the moisture
ounit when subjected to the temperature of F.
TABLE 3
EFFECT CF TEMPERATURE UPON COUNTS
Temperature
F75 P
Temperature
F
Instrument A
Density GageStandard
Moisture OageStandard
4166542022
1948119237
Instrument B
Density GageStandard
Moisture GageStandard
ige Inoperative19195
Gage Inoperative224075 F
Note: Both instruments placed in cold room 2 hours and
"warmed up" for 15 minutes prior to testing at F.
The reliable error for the density standard obtained
at 75°F is 344, consequently a reliable lower limit for
the reading can be established at 42678, Just 13 counts
above the reading obtained at 0°F. A reliable error for
the moisture standard at 75°F gives an upper limit of
19469, in contrast to the reading of 19481 obtained at 0°F,

k6
Therefore , due to the fact that for a temperature
range of 75 F°, standard count variations were nearly con-
fined to a reliable error for Instrument A; the effect of
temperature upon count variation Is considered negligible
for this Instrument.
When Instrument B was subjected to tests at P, the
gage became Inoperative. First, the automatic timer
mechanism failed to stop at a one minute Interval and
counts became continuous for several minutes. After
stopping and starting the Instrument again, only the first
glow tube was operative. To avoid damage to the machine,
tests were discontinued and the Instrument was removed
from the cold room.
Although definite conclusions for a defined count
variation existing between the tested temperature range
cannot be made for Instrument B, Parsons and Lewis (9)
have shown that for a similar model of manufacturer B,
density count variations can be considered negligible
for temperatures ranging from 0°C to ^0 C. For the
moisture unit, count stability was more critical; as
o
count Increases were noted for temperatures below 7 C
and a consequent count reduction for temperatures In
excess of 30 C.
Timer
The ability of a timer to consistently and accurately
measure a one minute Interval Is undoubtedly Important.

^7
However, It may te noted that If a count ratio procedure
Is adapted, consistency of the time Interval rather than
accuracy of measurement is of most importance since any
deviation in time will te the same for both the self-
standard and reading obtained. If the timer is Inconsis-
tent In measuring the time Interval, both procedures, count
per minute and a count ratio, will te In error.
Throughout the testing period, both instruments
were periodically checked with a 0.1 second calibrated
stopwatch. The results showed a high degree of accuracy
and repeatability for a 1 minute time interval.
Voltage
Eoth instruments tested are equipped with an Internal
6 volt battery for portable operation. As some deviation
can be expected from the 6 volt supply throughout the
use of the equipment, an investigation relative to the
effect of voltage upon count readings was conducted.
Voltage variation was achieved ty use of a 5C watt, 2 5 ohm
rheostat connected to a 12 volt external tettery with
sutsequent leads to the Internal battery terminals.
Figure 19 is an illustration of the effect of battery
voltage upon count readings for Instrument A. It can be
seen for the density gage, that the change In self-stand-
ard was found to be 495 counts. However, the count ratio
for readings taken on the concrete calibration tlcck were
practically constant at all voltage levels. The variation

48
z3o(_>
LlI
>
Id5.5 6.0 6.5
BATTERY VOLTAGE7.0
UJ
3
42 500
42000 -cr
UJ
Q.
§ 41500o
UJ
3
UJ
in
3Oo
5.0 5.5 6.0 6.5 7.0
BATTERY VOLTAGE
19500
190005.0 5.5 6.0 6.5 70
BATTERY VOLTAGE
FIG. 19 EFFECT OF BATTERY VOLTAGE UPONCOUNTS -INSTRUMENT A

^9
of self-standard for the moisture unit was considered
negligible. It should be noted however, that at $»?> volts
the moisture unit ceased functioning for the fourth count
reading.
Data for Instrument B were not attainable due to an
Instrument malfunction, however, Parsons and Lewis (9)
state In their discussion of a similar model that for the
density gage,
"the 'density' circuit registered reasonably consis-tent Intensities of radiation between voltages 6.0and 6.6"
'For the moisture unit, they report;
"The moisture circuit gave consistent results forvoltages between 5»6 and 6.0"
Their conclusion as to the overall effect of both gages
states
:
"Thus for consistent operation of the apparatus forboth density and moisture content determination a supplyvoltage very close to 6 volts would be required."
During the research program, correspondence from the
manufacturer advised that a more stringent control of
supply voltage was necessary than Initially Indicated for
the Instrument. Consequently, control was exercised to
ascertain that all readings were taken at or very close
tc 6 volts.
Aging
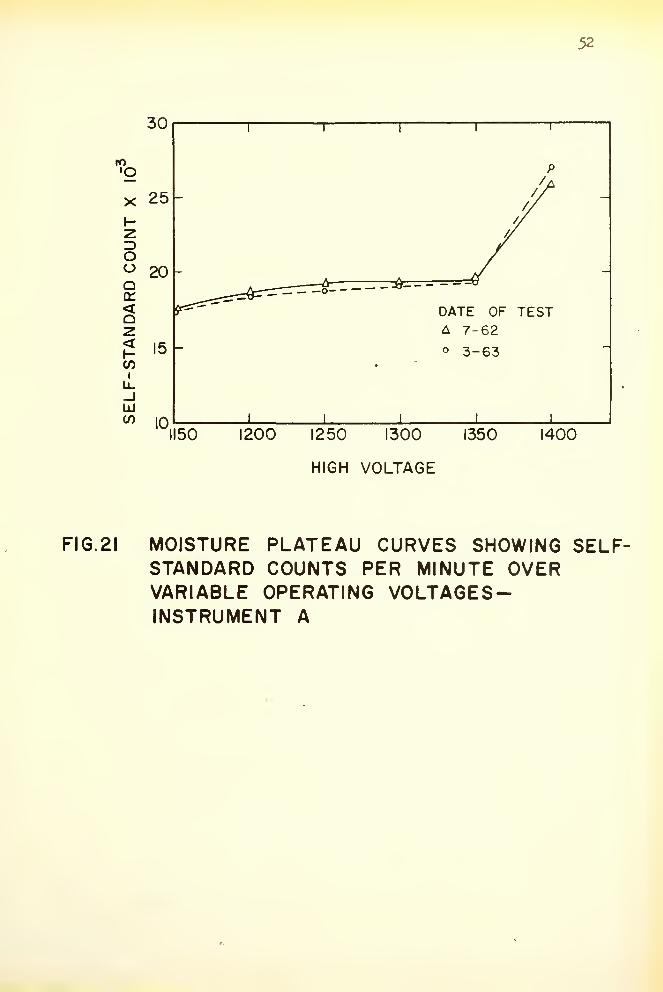
A high voltage, or plateau curve, Is obtained by
varying the high voltage on the scaler and taking count

50
readings over the high voltage range. If the counts are
then plotted as a function of the high voltage; a region,
or plateau, will appear where only a slight Increase In
the counts will occur through a defined voltage range.
The desirable operating voltage of the gage In question
Is then usually chosen as an Intermediate voltage of the
plateau voltage range.
Periodic high voltage plateau curves give an Indica-
tion of the trend of count readings as a function of
the time used. Also, by taking count readings on another
standard system ( a concrete block for example ) a trend
of the count ratio or relative count can be observed
on the combined systems over a period of time.
Each density Instrument used was assigned a seperate
concrete block. On each block a permanent outline of
the Instruments was formed by glueing a piece of weath-
strlpplng onto the block. By placing the instrument with-
in the outline and in the same orientation each time a
reading was obtained, and variations In day to day tests
due to different placement and direction were eliminated.
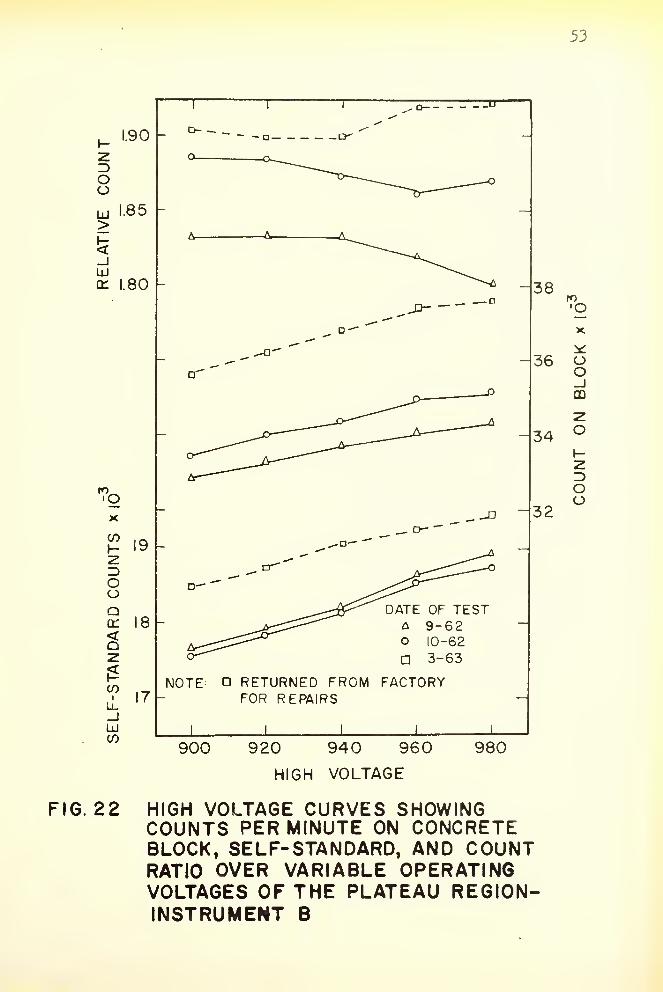
High Voltage curves for both Instruments are shown
In Figures 20, 21, and 22. Figures 20 and 22 only in-
dicate the "plateau" region of the curves. It should be
noted that the standard air gap was used to obtain only
#the final plateau curves for each instrument. Also, for
* See Page 56

51
900 950 1000 1050HIGH VOLTAGE
MOO
FIG. 20 HIGH VOLTAGE CURVES SHOWINGCOUNTS PER MINUTE ON CONCRETEBLOCK, SELF-STANDARD, AND COUNTRATIO OVER VARIABLE OPERATINGVOLTAGES OF THE PLATEAUREGION -INSTRUMENT A
52
30
to'O
X 25
1-
23OO 20Qq:<QZ<1- 15
(0
u__iUJc/> 10
1150 1200 1250 1300 1350
HIGH VOLTAGE
1400
FIG. 21 MOISTURE PLATEAU CURVES SHOWING SELF-STANDARD COUNTS PER MINUTE OVERVARIABLE OPERATING VOLTAGES-INSTRUMENT A
53
1.90
oouj 1.85>
LUa: 1.80
'O
ooI-
=>ooQtr
<Qz
CO
CO
FIG. 22
19 -
18 -
17 -
i
O—
u
- -a cr
—
o
—o-
__D
38
36
-34
32
NOTE RETURNED FROMFOR REPAIRS
I
DATE OF TESTA 9-62o 10-62
a 3-63
FACTORY
to'O
Oo_lCD
2=>Oo
900 920 940 960
HIGH VOLTAGE
980
HIGH VOLTAGE CURVES SHOWINGCOUNTS PER MINUTE ON CONCRETEBLOCK, SELF-STANDARD, AND COUNTRATIO OVER VARIABLE OPERATINGVOLTAGES OF THE PLATEAU REGION-INSTRUMENT B

Instrument E, the plateau curve used with the standard
air gap was obtained after the instrument was received
from the factory where it was sent for repair of a faulty
linkage system in the handle.
For the density gage of Instrument A, a large drop
In the self-standard occurred Immediately following the
commencement cf tests on Material Group I. This is Illus-
trated in Figure 2C for the curves dated 6-62 and 9-62.
Although the standard air gap was not used for these tests,
it is believed that this large deviation cannot be attri-
buted to the air gap due to the consistency of the ensuing
day to day self -standards occurring below 430CC (See Fig-
ure 23). The reason for this occurrence was not explain-
able by the manufacturer. Consequently, since a possibility
of permanent Instrumentation malfunction may have occurred,
a reservation as to the validity of the results of the
sandy-gravel material may be necessary.
Although, validity of the self-standards ana relative
count results of the plateau curve may be questioned due
to the non use of the air gap, a trend in count readings
can be safely observed for the readings taken on the
concrete block. They Illustrate that, a count reduction
of a system tested can be expected to occur over a period
of time. In general, the use of a count ratio procedure
will eliminate any variation due to age effects of the
counter tutes . However, Pocock (6) has shown mathematically

55
that the use of a count ratio procedure will not eliminate
any variations due to source deterioration. This fact
suggests that periodic recallbratlon cf the Instrument
is necessary regardless cf which method of analysis, count
ratio or direct counts per minute, Is used. This recall-
bratlon is very Important for Instruments employing 0^37s
137source since the half-life of Cs
is 33 years, in con-
trast to the 1620 year half-life of Ra-Be. Since a
count ratio procedure was adopted, and the entire testing
program was completed in 6 months, the effect of aging
was considered to be negligible.
For the moisture gage of Instrument A, the obvious
stability of the gage is evident over the entire test-
ing program. Although the standard air gap was not used
for the initial curve, its effect upon the moisture
self-standard is pointed out on page 60 as being negligible.
The reader is referred to page 60 for a further discussion
of this occurrence.
Even though the counts obtained on the concrete block
show an increase for Instrument B for the curves dated
9-62 and 10-62; the relative small time interval, the type
source used, and the fact that the two curves are very
slightly In excess of the reliable error limits compel
the author to feel that this Increase is not attributable
to any aging effect of the Instrument.

56
The fact that a different plateau curve was obtained
on Instrument B after the Instrument was returned from
the factory for repairs, points out that new calibration
curves should be obtained each time a serious Instrument
defect warrants shipment to the manufacturer for repairs.
Instrument Test Procedure
Reliance of Self-Standard
The accuracy and repeatability of the Instrument
self-standard reading for dally use Is of extreme Import-
ance. The purpose of this reading Is to give the user
an Immediate check on the overall stability of the gage
and It serves as a reference count for the count ratio.
Self -standard readings are usually taken on standard blocks
(concrete for example) or the Instrument Itself may have
an Internal standard.
Self-standard readings, for both density and moisture,
were taken for each test performed throughout the entire
testing program. For the Material Group I tests, extreme
variances In the self-standard were noticed between dally
tests. As self-standard readings were taken with the
gage placed on the laboratory floor, a wooden stand,
12" in height, was constructed to permit an air gap to
exist between the floor and bottom of the measuring de-
vice. This stand (referred to hereafter as the standard
air gap) was used for all tests In Material Group II. A
plot of the standard readings versus test number Is shown

57
In figures 23 and 24.
It can be seen that the Materia] Group I tests had
a larger variation In self-standards than for the tests of
Material Group II. Although It might be logically deduced
that the reduction of the self-standards was attributable
to the standard air gap, there Is a possibility that instru-
ment malfunction may have Influenced these readings.
It has already been stated for Instrument A that a
question as to the validity of the Initial density results
due to instrument stability exists. For Instrument B,
the gage was sent to the manufacturer after a discussion
pertaining to the self -standard .variation. It was suggest-
ed that a linkage which is used to raise and lower the
radioactive source in the gage was faulty. However, latter
correspondence from the manufacturer was received acknow-
ledging the effect of an air gap in reducing self-standard
variations.
Unfortunately, the exlstance of these two possibilities
leads to conflicting methods of results analysis. If it
is due to the standard air gap, then It could be concluded
that a count ratio analysis would be invalid due to the
uncertainty of the standard determined as the reference
count. However, if an instrument effect reflecting the
electronic stability is assumed, a count ratio analysis
would tend to reduce the data scattering about a line of

58
oooro
_\
. N^q
>>\
\
?\^ 1
Iv" crN I o
1^ 1
cr
•s. cr
1 ^ ^1
UJ
1 <* \'
|
UJ_
0}
1
^>
^ 1
13
>cr
o
_lCD<
Ul/
i h- crv Oa.
'">1 < 2 CO
UJ
1 ^ 2 <
^> 1 £i <
Ocr
u
QC'' z -
I^'-^
1 a Q1v cr UJI
> < 2 1
'-1 1
cr1
CD
1 ^3t-UJ
1
i
<" cr UJK
,t-
Z -^ i 1 oUJ
"*"1 zZ iO£Ch-COz
1i
1
U-I
I
1
1 SiCM
1
1
-
o oo oIf) oCM CO<fr
<*
ooooCM
ooinCD
o
CDm
(XI
ro
(XI
_ CM
- CO
3
oomCD
O<
cozUJQcrUJQ
CL<
cmCT oUJCD
3£z <
co CCu <»- Q
UJ
roCM
o <2
CO
z
<UJcr
acr<QZ<HCO
I
UJCO
CO ZoU_ CLO 3
oUJ
3inNIW H3d SJJMnO0-S9N«aV3H OdVQNVlS -:TI3S

59
zu
CO
\
liJ
CO
oo oo 8
IT) o oCT> 0> to
CMro UJ
o<o
COUJ
BinNHrt «3d S1N0O0
— s£>Niav3a aavaNvis-ji3S
a:
<rUJQzZ>
a.<oQC
<aa:<
CO
U-
o
oUJu_U-UJ
CM
o
<UJcr
aa:<a<co
I
U__lUJCD
Oa_ZD
60
regression for the calibration.
Consequently, the data were analyzed for both methods
of expressing results. This analysis Is shown In Figures
25, 26, and 27. It was found that It was not necessary
to show the difference In results for the moisture gage
of Instrument A; due to the consistency of the self-stand-
ards throughout the entire testing program. It should
be noted that this particular gage has an air gap built
into Its standard block.
In figure 27, It Is obvious that the use of a relative
count procedure reduced the data scattering from results
obtained with a count per minute analysis for the moisture
gage of Instrument B.
In general, the moisture gage self-standards would
be expected to have a small proportion of the variation
attributable to Interference with the substrate system
upon which the gage is placed. The reason for this being
that the system for density readings Is dependent upon
mass; while moisture methods utilize fast neutron moder-
ators. Since the concrete floor on which the gages where
placed to determine the self-standards for Material Group I
tests can be classified as a mass system moreso than a
moderating system, it follows that the floor would be
expected to Interfere more with a density backscatter
device than with a moisture unit.
A count ratio procedure was chosen for use in plotting

61
*o
UJ
orUJQ_
(/)
\-
Oo
16
14 -
12 -
10-
8
_ —^^ -i
90 100 110 120 130 140 150
BULK UNIT WEIGHT- POUNDS PER CUBIC FOOT
40
.36-
=>Oo
.32UJ>1-<UJ .28or
'2490 100 110 120 "30 140 150
BULK UNIT WEIGHT - POUNDS PER CUBIC FOOT
FIG.25 DENSITY CALIBRATION RESULTS EXPRESSED
AS COUNTS PER MINUTE AND RELATIVE
COUNT FOR MATERIAL GROUP I -
INSTRUMENT A
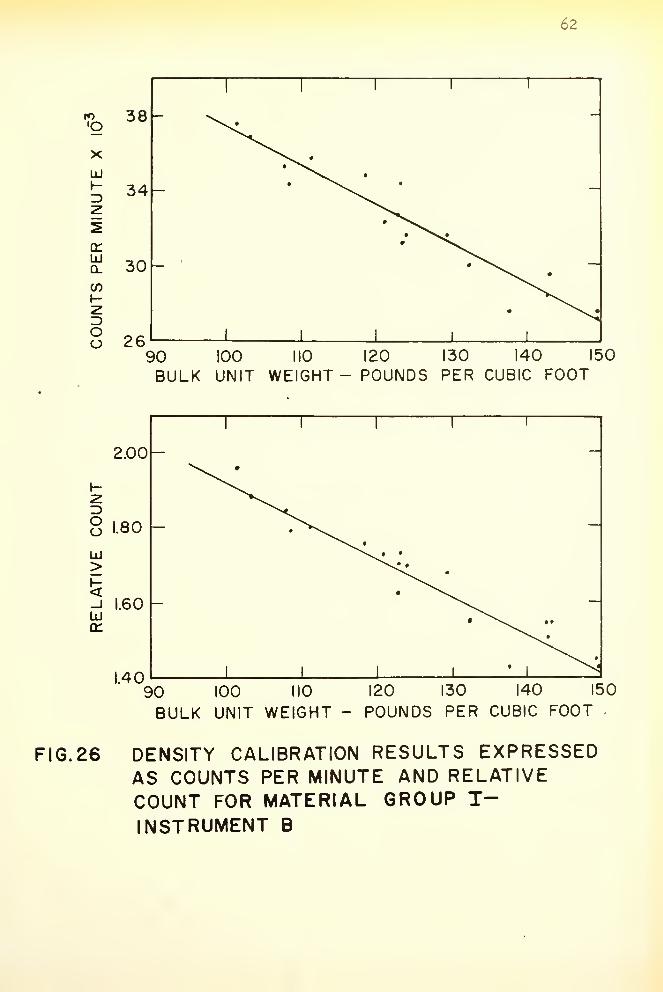
62
ro'O
UJI-3
trUJ
CO
oo
38
1 11
•
1
"
34• ^^^ 9
X.••
"^^
30
1 1
1
•
1
9
1
•
^N. •
90 100 110
BULK UNIT WEIGHT120 130 140 150
POUNDS PER CUBIC FOOT
FIG.26
1.4090 ioo no
BULK UNIT WEIGHT120 130 140 150
POUNDS PER CUBIC FOOT
DENSITY CALIBRATION RESULTS EXPRESSEDAS COUNTS PER MINUTE AND RELATIVECOUNT FOR MATERIAL GROUP T-INSTRUMENT B

63
! 1 1
h-
3O
Q 3
OI
CL<
zo 3 cc< o° 1- z <
<S) z LU—*: Q
o — £/)
<t- <
llJ ^CO -> o
o o £^2
(- <<t 1-Q- co
<%
„° o
1 -L1 1
ooC\i
o o o O
INnOO 3AllV13a
oOJ
m
_ m
oo
oCDIDo
orUJQ.
en
oen
UJ oQ. UJ
eno: enUJ UJI-< or
0.X
ii UJ
en
I
O
orUJ
<
orOu.
en zLU 3* O2 °o UJ
f= >or <GO _i
< *
UJ
or
CO 3o ?2 2
CD
< UJ
3or
en
£0I X31HNIW U3d SINHOO e\j
64
Material Group I tests. As a question of uncertainty exists
as to the relative amount of variation contributed for
each possible cause; the possibility of an Inherent error
due to substrate interference may be expected.
In conclusion, it can, however, be stated that extreme
care must be taken to insure that Identical systems sur-
rounding the density and moisture gage are present. If
this is not observed and dependency is placed upon the
standards taken; regardless of a count ratio procedure
or counts per minute analysis, deviations from the true
count will be attained.
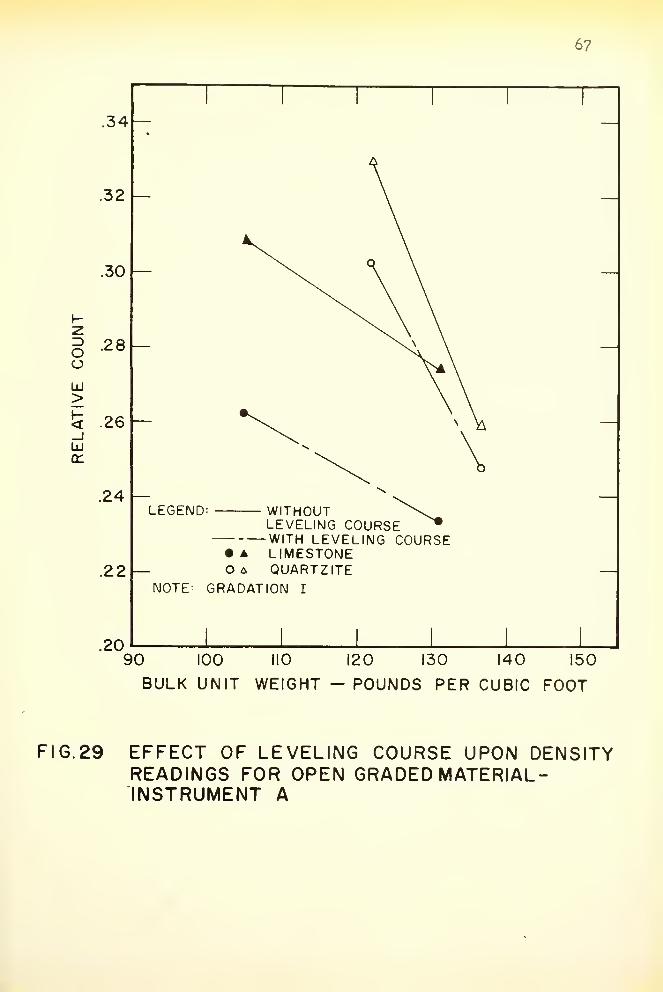
Use of Leveling Course
When a measuring gage Is placed upon a substrate, it
is imperative that its position is such as to allow a
minimum of voids to form between the top of the soil and
the bottom of the gage. Divergence from this procedure
will lead to erroneous count readings.
To minimize this effect, it has been suggested that
a fine layer of material be distributed on the soil to
act as a leveling course between the soil and instrument.
To find the effect of the leveling course, a series of
readings were taken on the materials in Group II with
and without a leveling course. First, density counts
were recorded with the gage placed directly on the soil
top; with no apparent air gaps visually noticeable. Then
a leveling course was uniformly distributed over the

65
substrate as thin a possible. The leveling course used
was the exact material type tested crushed to a fine size
(pass No. 40 sieve and retained on a No. 200 sieve). Density
counts were then obtained in as nearly the identical
orientation on the soil as the tests completed without the
aid of a leveling course.
A comparison of the relative effects between count
ratios for an open graded material (Gradation curve I;
3/4" maximum aggregate size) and a fine crushed material
(Gradation curve III; No. 4 maximum aggregate size) are
shown for both Instruments in Figures 28 through 31. These
figures suggest that the leveling course has a larger
effect on results for open graded materials than for a fine
crushed material. The reason for this Is a combination
of two facts. First, it Is known that for a backscatter
device the material closest to the gage will have a great-
er effect on the particular count registered than material
farther away from the gage. Second, for a more open
graded material the possibility of segregation of a fine
leveling course becomes greater than for the fine material."
Therefore, a larger quantity of the leveling course is
necessary for open graded materials which consequently
affect the count to a greater degree due to its closeness
to the instrument.
The primary function of a leveling course is to min-
imize the effect of air voids upon count readings. If,

66
3OoUJ>
.34
.3 2
.30
.28
< .26_jUJor
.24
LEGEND
.22
NOTE:
WITHOUT LEVELINGCOURSE
WITH LEVELINGCOURSE
•A LIMESTONEot± QUARTZITE
GRADATION M.20
90 100 110 120 130 140 150
BULK UNIT WEIGHT -POUNDS PER CUBIC FOOT
FIG. 28 EFFECT OF LEVELING COURSE UPON
DENSITY READINGS FOR FINE CRUSHEDMATERIAL-INSTRUMENT A
67
3OCJ
UJ>h-<_JLu
.34
.32
.30
.28 —
.26
.24 —
.22
.20
LEGEND:
NOTE
WITHOUTLEVELING COURSEWITH LEVELING COURSE
• A LIMESTONEOa QUARTZITE
GRADATION I
90 100 110 120 130 140 150
BULK UNIT WEIGHT - POUNDS PER CUBIC FOOT
FIG. 29 EFFECT OF LEVELING COURSE UPON DENSITYREADINGS FOR OPEN GRADED MATERIAL-INSTRUMENT A

68
3OOUJ>
<_J
UJ01
2.20
2.10
2.00-
.90
1.80
1.70
.60
.50
LEGEND^
o A
NOTE GRADATIDN
WITHOUT LEVELINGCOURSE
-WITH LEVELINGCOURSE
LIMESTONEQUARTZITE
m
1.4090 100 110 120 130 140 150
BULK UNIT WEIGHT-POUNDS PER CUBIC FOOT
FIG. 30 EFFECT OF LEVEL ' NG COURSE UPONDENSITY READINGS FOR FINE CRUSHEDMATERIAL-INSTRUMENT B

69
OoUJ>
_JUJ
2.20
2.10
2.00
1.90
1.80
1.70
1.60
1.50
V
— LEGEND:
1.40
O A
WITHOUT LEVELING COURSE-WITH LEVELING COURSELIMESTONEQUARTZITE
NOTE- GRADATION I
'90 100 110 120 130 140 150
BULK UNIT WEIGHT - POUNDS PER CUBIC FOOT
FIG. 31 EFFECT OF LEVELING COURSE UPON DENSITYREADINGS FOR OPEN GRADED MATERIAL-INSTRUMENT B
70
for example, a reading was obtained with the gage In a
certain fixed number of orientations without the use of a
leveling course, extremities of readings could be found
and consequently differences or count ranges obtained.
This reading would therefore be a function of the system
composed of soil type, homogeneity of the soil at each
orientation, and the soil-instrument contact status, or
the amount of air voids present under the gage. Consequently,
if a leveling course was added and assuming that similar
orientations were obtained and therefore similar soil
volumes were "seen" by the bsckscatter radiation; a com-
parison of the count ranges for both methods of placement
would generally indicate the effectiveness of a leveling
course.
A graphical analysis of this comparison is shown in
Figures 32 and 33. For Instrument A it can be seen that
45 per cent of the readings taken for Material Group II
showed a decrease in the count range, or 55 per cent of
the readings showed an Increase in count range. However,
for Instrument E, ?5 per cent of the readings showed a
decrease in the count range. Consequently, it should be
noted that the effectiveness In count range reduction will
not always be dependent upon the use of a leveling course,
but rather is a function of the instrument type.
Therefore, it can be concluded that the use of a
leveling course can have two effects upon an average

71
600-
o
500 -Q<UJUJ*co
tico 8 400UJ CD
uj>30°
z<x
ZZ)oo
100 -
-
1 1 1 1
o
1 1 >
o
o
oo
"
o /^ •
/ *
o
1
NOTE MATERIAL GROUP II
i 1 1 1 1
100 200 300 400 500 600COUNT RANGE OF DENSITY READINGS
WITHOUT LEVELING COURSE
FIG. 32 EFFECT UPON DENSITY COUNT RANGE WHENUSING LEVELING COURSE FOR MATERIALGROUP H- INSTRUMENT A

72
coo-z.
Q<UJa:
C co!= q:co 32 oUJ (JQO
U- 2o -,
UJO<
UJ>UJ
Z>Oo
2400
2000
1600 -
1200
800-
400-
400 800 1200 1600 2000COUNT RANGE OF DENSITY READINGS
WITHOUT LEVELING COURSE
2400
FIG. 33 EFFECT UPON DENSITY COUNT RANGE WHENUSING LEVELING COURSE FOR MATERIALGROUP H- INSTRUMENT B
73
reading. First, the Introduction of a leveling course
will cause larger deviations from density results obtained
without a leveling course for a more open graded material
than for a finer crushed material. Second, the use of a
leveling course In reducing the effect of count ranges
is dependent upon the Instrument used.
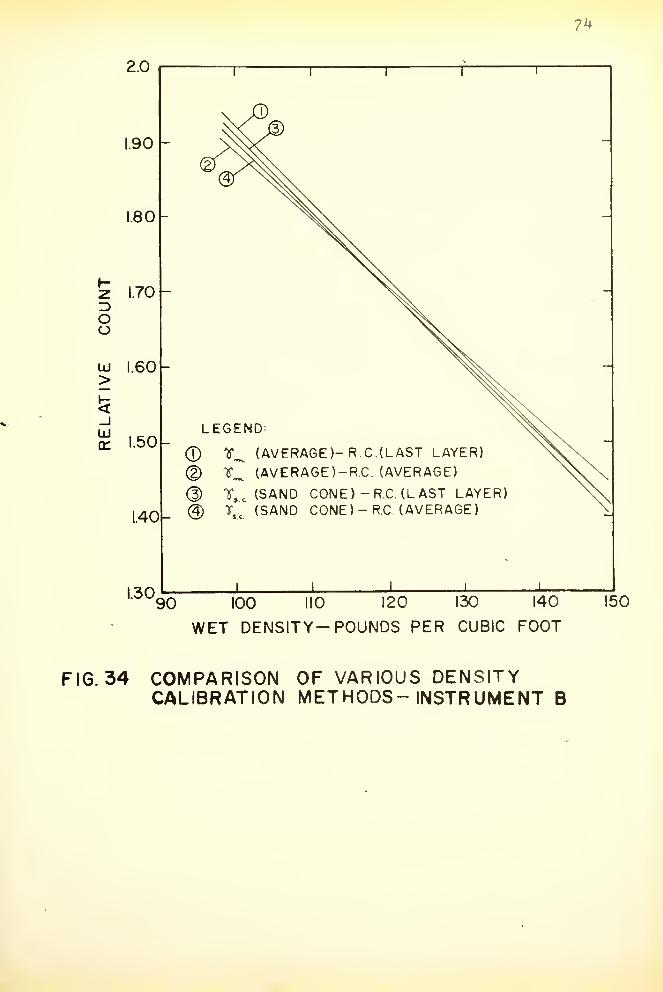
Variations of Density Calibration Frocedures
It has been previously stated that the recorded
gamma-ray intensity for a nuclear density gage Is not only
dependent upon the density but It Is also a function of
the effective depth of penetration.
It must be assumed that the measured density Is an
average density of the volumetric zone used in Its deter-
mination. Consequently, an Investigation was completed
for Material Group I as to the expected deviations of
calibration curves for density determined in a variety of
ways.
By utilizing densities determined by the sand cone
method and by direct measurments , along with an average
of count readings for several consecutive built-up layers
and a count reading for the last layer tested, it was
possible to establish 4 different calibration curves.
Figure 34 represents a summary of these calibration curves
for Instrument E.
At densities near 100 pcf , the maximum deviation
* See Page 38
7^
zIDOo
UJ
>
UJ
'90 100 110 120 130 140
WET DENSITY- POUNDS PER CUBIC FOOT
FIG. 34 COMPARISON OF VARIOUS DENSITYCALIBRATION METHODS- INSTRUMENT B

75
between curves was 3^5 pcf. A deviation of 1.5 pcf occurred
for an intermediate density of 120 pcf while at a density
of 150 pcf a difference of 4.5 pcf was found to be exist-
ant.
It Is Interesting to note that a comparison of curves
determined by the sand cone method versus the count on
the last layer showed a consistent deviation of 1.0 pcf.
However, In all eventualities, a resultant calibration
curve Is the final objective for field employment of the
nuclear Instruments. Therefore, the various methods
of determination and their related divergencies between
procedures must be understood.

76
CONCLUSIONS
The following conclusions apply to the laboratory
research program Investigating possible parameters that
can affect results of density and moisture determination
by nuclear radiation techniques.
Substrate Material Properties v
1. Both nuclear density gages showed higher counts
per minute at a given density for the sllaceous
material then for the calcareous material.
2. Material type had no effect on the moisture
counts per minute relationship for both instru-
ments .
3. Eoth nuclear density gages showed higher counts
per minute for the coarse gradation than for
the fine gradation at a given density for the
same material type.
k. Moisture In the material mass did not affect
the nuclear density results appreciably.
5. The effective depth of penetration for the density
gages decreased as the density of the substrate
was increased.
6. The effective depth of penetration for the moisture
77
gages decreased as the quantity of moisture In
the substrate was Increased.
Instrument Stability
1. The difference between moisture and density-
self-standards taken at 0° F and 75 F for Instru-
ment A was found to be negligible.
2. Instrument B was Inoperative at a temperature
of 0°P.
3. Errors attributable to a faulty timer mechanism
were negligible throughout the entire testing
program for both Instruments.
4. Density self-standard readings varied outside
the reliable error for Instrument A when tested
through an Internal battery voltage range of
5.5 volts to 6.5 volts; however, the use of a
count ratio analysis reduced the variation to
within the allowable limits of error.
5. Moisture self-standard readings for Instrument
A were confined to the allowable limits of
error when taken through an Internal battery
voltage range of 5*5 volts to 6.5 volts.
6. Count readings for nuclear density Instrument A
obtained upon a concrete block decreased con-
tinually throughout the test program time Inter-
val.
7. Differences between moisture self -standard read-

78
ings taken at the commencement and conclusion
of the research program were confined to the
allowable limits of error for Instrument A.
Instrument Test Procedure
1. Identical physical conditions surrounding the
nuclear gages are necessary for accurate self-
standard determination.
2. The use of a count ratio will reduce data scatter
caused by a variation In Instrument stability.
3. The use of a leveling course will cause larger
deviations from results obtained without the
use of a leveling course for a more open graded
material than for a finer crushed material.

79
SUGGESTIONS FOR FURTHER RESEARCH
The following recommendations are suggested as
research projects to help broaden the knowledge of nuclear
methods of determining density and moisture.
1. A collective analyzatlon of data for material
type should be undertaken by an agency capable
of the immensity of this task to ascertain If
these parameters can be quantitatively categoriz-
ed In their behavior departure from a single
calibration curve.
2. Further Investigations to determine the effect
of grain size distribution on the density
calibration curves should be accomplished.
3. The effect of long term usage on count readings
and relative counts for a defined standard system
should be evaluated.
4. An extensive field project should be undertaken
to evaluate the possibility of using nuclear
techniques for measuring density and moisture
for construction control.

80
BIELIOGHAPHY

81
EIBLIOORAPHY
1. Pieper, Jr. G. F. "The Measurement of Moisture Contentof Soil by the Slowing of Neutrons," Master's Thesis,Cornell University, June 19^9-
2. Krueger, P. G. "Soil Density by Gamma Ray Scattering,"Thesis, Cornell University, June 1950.
3. Belcher, D. J., Cuekendall, T. E. , and Sack, H. S.
,
"Nuclear Meters for Measuring Soil Density and MoistureIn Thin Surface Layers," Civil Aeronautics Administra-tion, Technical Development Report No. 127, October 1950
4. Carlton, P. F. "Modifications and Tests of RadioactiveProbes for Measuring Soil Moisture and Density," CivilAeronautics Administration, Technical DevelopmentReport No. 19^, March 1953.
5. Roy, S. E. and Wlnterkorn, H. F., "ScintillationMethods for the Determination of Density and MoistureContent of Soils and Similar Granular Systems," HighwayResearch Board, Bulletin 159, 1957.
6. Pocock, B. W. "An Analysis of Certain MathematicalAssumption Underlying the Design and Operation ofGamma Ray Surface Density Gages," Michigan StateHighway Department, July 1956.
7. Pocock, E. W., Smith, L. W., Schwartje, W. H., andHanna, R. E. , "The Michigan Nuclear Combination DensityMoisture Surface Gage," Presented to Committee onElectronics, American Association of State HighwayOfficials, Report No. 316, October 15, 1959.
8. Carey, W. N. Jr., Reynolds, J. F. , "Some RefinementsIn Measurement of Surface Density by Gamma RayAbsorption," Highway Research Board Special Report No. 38,1958.

82
9. Parsons, A. W. , Lewis, W. A. "Investigation of aBack-Scatter Gamma and Neutron Radiation Apparatus forDetermining the Bulk Density and Moisture Content ofSoil and Base Materials," Department of Scientificand Industrial Research, Road Research Laboratory,August 1962.
10. Partridge, T. B. , Eigden, P. J., "Developments inRadioisotope Measurement of Soil Moisture Content andDensity" Highway Research Eoard Bulletin 309, 1961.
11. Burgers, A. "Influence of Selected Material Propertieson Nuclear Determination of Density and Moisture,"Master's Thesis, Purdue University, August 1962.
12. "Symposium on Nuclear Methods for Measuring Soil Densityand Moisture," American Society of Testing Materials,STP No. 2 93, June I960.
13. Blanchard, C. H. , Burnett, C. R. , Stoner, R. G.
,
Weber, R. L. , "Introduction to Modern Physics" 1stEdition, Prentice-Hall, Inc., 1958.
14. Gray, H. "Nuclear Energy for Quality Control of HighwayMaterials," Engineering Experiment Station, Ohio StateUniversity, May I96I.
15. Chamblln, B. S. "Working Plan-Nuclear Measurement ofSoil Properties," Virginia Council of Highway Investi-gation and Research, February 1962
.
16. Deen, R. C. , Shackelford, J. D. "The Application ofNuclear Techniques to the Measurement of Moisture andDensity of Highway Construction Materials," KentuckyDepartment of Highways , May 1962
.
17. "Non-Destructive Radioactive Techniques Correlatedwith Standard Methods of Determining Density andMoisture Content In Highway Construction," ColoradoDepartment of Highways, December i960.
18. Eeullnk, E. R. , Szendrel, M. E. "An Estimate of theProbable Accuracies of Density and Moisture Measure-ments," South African Council for Scientific andIndustrial Research, November 1962
.
19. Brown, W. R. , "Nuclear Testing Correlated and Appliedto Compaction Control In Colorado," Colorado Depart-ment of Highways
.
83
AFPENDIX

84
STATISTICAL ERRORS BASED ON A
POISSON DISTRIBUTION
Figures 35 and 36 Illustrate the various error systems
due to a Polsson distribution for Instrument A and Instru-
ment B. In figure 36, a count of 42,250 was taken to be
representative of the density self-standard for Instru-
ment A; while for Instrument B, the density self-standard
was taken as 19,500 counts per minute.

85
E=K WK=0.6745 -50% CONFIDENCE LEVELK= 1.000 -68% CONFIDENCE LEVELK= 1.6745-90% CONFIDENCE LEVEL
i i I I i
2 4 6 8 10 20 40
(N) TOTAL NUMBER OF COUNTS PER MINUTE * I03
FIG.35 VARIOUS ERROR SYSTEMS ASSOCIATED WITHRADIATION INTENSITY LEVELS FORCORRESPONDING CONFIDENCE LIMITS

86
.0 4
.02
3OoUJ
>
01
008
.006
tr.
i.004Oa:
UJ
.002
.001
T l r
LEGEND^ STANDARDINST. A 42,250 = SINST. B I9,500 = S
INSTRUMENT B
INSTRUMENT A
8 10 20
TOTAL NUMBER OF COUNTS PER MINUTE « 10
40^3
FIG. 36 RELATIVE COUNT ERRORS ASSOCIATEDWITH CONFIDENCE LEVELS FOR NUCLEARDENSITY GAGES OF INSTRUMENTS A AND B

87
AFPENDIX E

88
SUMMARY OF STATISTICAL ERRORS OF DENSITY TESTS
Table k summarizes the statistical errors for all
the density tests taken during the research program.
Included are tests determined with the use of a leveling
course as well as those taken without a leveling course.
TABLE k
NUMBER OF DENSITY TESTS WITHIN
STANDARD AND RELIABLE ERRORS
Instrument A
1.
2.
W.I..C.
W.O.I..C.
Total Numberof Tests
21
75
Number WithinStandard Error
3
11
Number WithinReliable Error
9
36
Instrument B
Total Number Number Withinof Tests Standard Error
1. W.L.C. 24 3
2. W.O.L.C. 62 9
Note: W.L.C- With Leveling Course
W.O.L.C. - Without Leveling Course
Number WithinReliable Error
10
16


