Understanding Loan Repayment Plans and Alternative Repayment

FACTORS AFFECTING LOAN REPAYMENT PERFORMANCE OF
SMALLHOLDER FARMERS IN EASTERN HARARGHE, ETHIOPIA
BY
Million Sileshi Haile
A thesis submitted to the University of Nairobi in partial fulfillment of the
requirements for the degree of Master of Science in Agricultural and Applied
Economics
University of Nairobi
KENYA
Umverwty o< NAIROBI LOriryihi mill-0400884 3
January, 2012
UNIVERSITY OF NAIROBIKAEETfc LIBRARY

DECLARATION
This M.Sc. thesis is my original work and has not been presented for a degree in any other
university.
.l2.lol.JiL....
This M.Sc. thesis has been submitted to the Board of Postgraduate Studies, University of Nairobi
with our approval as university supervisors:
Dr. Rose Nyikal......................................................Date............................
Dr. Sabina Wangia . .Date. "2-
n

ACKNOWLEDGEMENTS
I wish to thank my supervisors, Dr. Rose Nyikal and Dr. Sabina Wangia, for their commitment,
advice and guidance. They gave generously o f their time and suggestions that have shaped this
work from its inception as a concept to the proposal stage and to the final report. 1 am indebted to
them for their kind and tireless efforts that enabled me to finalize the study.
My deepest gratitude goes to Mr. Fekadu Gelawu, Dr. Tekalign Tsegawu and Dr. Abebe Beyene
for their useful and valuable comments, which led to the considerable improvement of the thesis.
They spent their valuable time shaping the questionnaire survey and in the production of the
draft of the thesis, in addition to providing me with relevant information.
I appreciate the respondent households, Mr. Belete Teshome, the Branch Manager of the
Combolcha district Micro Finance, and other individuals who collaborated in the study; they
gave invaluable support during data collection.
I would like to express my gratitude to the Department o f Agricultural Economics. I also would
like to thank the Collaborative Masters Program in Agricultural and Applied Economics
(CMAAE) management, Prof. Willis Oluoch-Kosura (Program Director), Mrs. Joyce Isiaho,
Program Administrator, and all the staff in the CMAAE office for their patience in helping me to
successfully complete the program.
Finally 1 would like to express my sincere appreciation and gratitude to my father Sileshi Haile
and my mother Birknesh Ayele for their special, sincere and heartfelt support, and their
encouragement and inspiration, which made the study a success.
in

DECLARATION.................................................................................................................................. ii
ACKNOWLEDGEMENTS................................................................................................................iii
LIST OF FIGURES............................................................................................................................vii
LIST OF APPENDICES................................................................................................................... viii
ABBREVIATIONS AND ACRONYMS.......................................................................................... ix
ABSTRACT.......................................................................................................................................... x
CHAPTER ONE: INTRODUCTION..................................................................................................1
1.1. Background............................................................................................................................... 1
1.2. Statement of the Problem.........................................................................................................3
1.3. The Purpose and Specific Objectives....................................................................................4
1.4. Hypotheses of the Study.........................................................................................................5
1.5. Significance of the Study......................................................................................................... 5
1.6. Scope and Limitations of the Study........................................................................................ 5
1.7. Organization of the Thesis........................................................................................................6
CHAPTER TWO: LITERATURE REVIEW.....................................................................................7
2.1. Definition of Credit................................................................................................................... 7
2.2. The Need for Credit.................................................................................................................. *
2.3. Theoretical Perspective of Credit Market............................................................................ 10
2.4. Financial Institutions in Ethiopia............................................................................................11
2.4.1. Formal Financial Sector...................................................................................................... 11
2.4.1.1. Public Banks and Insurance Corporation............................................................14
2.4.1.2. Private Banks and Insurance Companies.............................................................14
2.4.1.3. Micro-Finance Institutions (MFIs)...................................................................... 14
2.4.1.4. Oromiya Credit and Saving Share Company......................................................15
2.4.2. Informal Financial Sector in Ethiopia................................................................................ 10
2.5. Empirical Studies on Loan Recovery and Defaults...............................................................17
2.5.1. Loan Repayment Performance Globally............................................................................ 17
2.5.2. Loan Repayment Performance in Ethiopia........................................................................20
2.5.3. Methodological Issues..........................................................................................................22
TABLE OF CONTENTS
iv

CHAPTER THREE: METHODOLOGY..........................................................................................24
3.1. Conceptual Framework........................................................................................................... 24
3.2. Description of the Study Area................................................................................................ 26
3.2.1. Description o f Babile District............................................................................................. 26
3.2.2. Description o f Combolcha District..................................................................................... 27
3.3. Sample Size.............................................................................................................................. 29
3.4. Data Needs, Sources, and Collection Procedures................................................................. 30
3.5. Method of Data Analysis........................................................................................................32
3.5.1. Descriptive Statistics...........................................................................................................32
3.5.2. Empirical M odels................................................................................................................ 33
3.6. Variable Specification and Expectation................................................................................37
3.7 Preparation of Variables in the Empirical Model................................................................ 44
3.7.1 Multicollinearity Diagnosis..................................................................................................44
3.7.2 Assessing the Goodness of Fit and Heteroscedasticity......................................................46
CHAPTER FOUR: RESULTS AND DISCUSSION...................................................................... 47
4.1. A Comparison o f Characteristics of Defaulters and Non-Defaulters in East Hararghe .... 47
4.1.1. Socio-economic and Institutional Characteristics Among Defaulters andNon Defaulters....................................................................................................................... 47
4.1.2. Socio-economic and Institutional Characteristics among Defaulters and Non Defaultersin Babile District.................................................................................................................... 53
4.1.3. Socio-economic and Institutional Characteristics among Defaulters and Non Defaultersin Combolcha District............................................................................................................ 58
4.2. Determinants o f Loan Repayment Performance in East Hararghe....................................62
CHAPTURE FIVE: SUMMARY, CONCLUSIONS AND RECOMMENDATIONS................ 68
5.1. Summary...................................................................................................................................6®
5.2. Conclusions and Policy Recommendations...........................................................................69
REFERENCES....................................................................................................................................72
APPENDICES.....................................................................................................................................77
v

LIST OF TABLES
Table 1 Financial Institutions in Ethiopia......................................................................................14
Table 2 List of Credit Centers and Number o f Farm Households Selected for the Survey.........30
Table 3 Summer of Expectation and Hypothesis Test.................................................................. 38
Table 4 Variance Inflation Factor for Continuous Explanatory Variables...................................45
Table 5 Contingency Coefficients for Discrete Explanatory Variables...................................... 46
Table 6 Socio-economic and Institutional Characteristics Among Defaulter and Non Defaulters
for All Respondents (Continuous Variables)................................................................... 48
Table 7 Socio-economic and Institutional Characteristics Among Defaulter and Non Defaulters
for All Respondents (Discrete Variables)........................................................................ 49
Table 8 Socio-economic and Institutional Characteristics Among Defaulter and Non Defaulter
in Babile District (Continuous Variables)........................................................................ 54
Table 9 Socio-economic and Institutional Characteristics Among Defaulter and Non Defaulter
in Babile District (Discrete Variables)..............................................................................55
Table 10 Socio-economic and Institutional Characteristics Among Defaulter and Non Defaulter
in Combolcha District (continuous Variables)................................................................ 59
Table 11 Socio-economic and Institutional Characteristics Among Defaulter and Non Defaulter
in Combolcha District (Discrete Variables)......................................................................61
Table 12 Two-Limit Tobit Model Estimates and Marginal Effect o f Factors Influence Rate
Repayment and Probability of Being Non-Defaulter for All Respondents................... 62
VI

LIST OF FIGURES
Figure 1 Conceptual Framework......................................................................................................25
Figure 2 Map of Eastern Hararghe Zone, Combolcha and Babile District.................................. 29
VII

Appendix 1 Conversion Factors used to Estimate Tropical Livestock Units (TLU).................... 77
Appendix 2 Microfinance Institutions Operating in Ethiopia as of June 2009 (In Thousands of
B irr)..............................................................................................................................78
Appendix 3 Survey Questionnaire....................................................................................................79
LIST OF APPENDICES
viii

a b b r e v ia t io n s a n d a c r o n y m s
ACORD Agency for Co-operation in Research and Development
ARDO Agricultural and Rural Development Office
AIDB Agricultural and Industrial Development Bank
CBB Construction and Business Bank
CBE Commercial Bank of Ethiopia
CSA Central Statistics Authority
I) BE Development Bank o f Ethiopia
EIC Ethiopia Insurance Corporation
GDP Gross Domestic Product
IFAD International Fund for Agricultural Development
LDCs Less Developed Countries
LPM Linear Probability Model
MFI Micro Finance Institution
NBE National Bank of Ethiopia
OBPED Oromiya Bureau of Planning and Economic Development
OLS Ordinary Least Squares
OSCSC Oromiya Saving and Credit Share Company
TLU Tropical Livestock Unit
IX

ABSTRACT
The use of credit has been envisaged as one way of promoting technology transfer, while the use
o f recommended farm inputs is regarded as key to agricultural development. Credit repayment is
also of paramount importance to have viable financial institutions. In Eastern Hararghe,
Oromiya Zone, the Regional Government and Non-Governmental organizations are extending
credit facilities to farming households in order to narrow the gap between the capital required
and the capital that the households possess, for the improvement o f agricultural technologies that
would increase production and productivity. However, there is a serious loan repayment problem
in the area, which discourages rural finance organizations from promoting and extending credit.
Loan defaults are estimated at 23.85 percent OSCSC (2009). Therefore, the objective of this
study was to identify the factors affecting the loan repayment performance of farmers in Eastern
Hararghe zone.
Primary data was collected through structured questionnaires, from 140 randomly selected farm
household users of credit in two agro ecological zones of Eastern Hararghe . Secondary data was
obtained from publications, seasonal and annual reports of the district, zonal and regional offices
o f the Ministry of Agriculture and Rural Development, Development Bank of Ethiopia, Micro
Finance Office and other related organizations. Descriptive statistics were used to describe the
socio-economic characteristics of the respondents, and the two-limit I obit model was used to
analyze the factors influencing loan repayment of smallholder farmers in the study area.
The results of the descriptive analysis revealed a significant mean difference between the
defaulter and non-defaulter households in terms of education, experience of credit use, distance
from credit source, technical assistance, livestock units, total annual income and total land.
Moreover, off farm income, crop and livestock disease, social ceremonies and education level
were systematically associated with loan repayment. However, other variable such as age, family
size, amount of loan, were not significantly different between the defaulters and the non
defaulters.
The two limit Tobit model results indicated that seven out o f the 16 explanatory variables
considered influenced loan repayment performance in the area. Agro ecological zone, off-farm
activity, and frequency of contact with extension agents positively and significantly influenced
x

The study recommends increasing the number of development agents to change the farmers'
attitude toward agricultural transformation and timely settlement of debt. Rural development
strategies should not only emphasize on increasing agricultural production but simultaneous
attention should be paid to promoting off-farm activities in the rural areas. The social ceremonies
w hich are commonly celebrated, require a great deal of investment ,beyond what the farmers can
afford, and were found to be one of the major causes o f delinquency in the payment of formal
loans. Thus, there should be some sensitization for the elders, community leaders, local
associations and religious organizations to realize the need to minimize these traditional
ceremonies and mitigate the associated expenditure through time. The agro-ecology zone is one
o f the factors that affect the type and range o f crops to be grown and animals to be kept.
Therefore, policies and strategies geared towards the development and promotion of new
technologies, suitable to moisture deficit areas, should be given adequate emphasis in order to
improve the loan repayment capacity of smallholder farmers living in such drier areas of the
zone. In addition membership of specific groups should be optional, to allow individual members
to screen each other effectively, a phenomenon of group advantage for information symmetry
that is not available in the emerging micro finance set ups which fix members to groups.
loan repayment while, production loss, informal credit, social ceremonies, and loan-income ratio
negatively influenced the loan repayment performance of small holder farmers in the study area.
XI
CHAPTER ONE: INTRODUCTION
1.1. Background
The economic growth of developing countries depends to a great extent on the growth o f the
agricultural sector. Ethiopia is one example of a developing country, characterized by a
predominantly subsistence agrarian economy. The nature of farming in Ethiopia is dominated by
traditional micro holdings of the subsistence type, with less than two hectares of land being the
average holding (CSA, 2007). The principal components of the output of the sector are food
crops, livestock and livestock products. Small farmers work on 96.3 percent of the total
cultivated area and produce over 95 per cent of the national crop production, whereas private
investors and state farms work on the rest (CSA, 2007).
Out of the total population, 83.8 percent live in rural areas and agriculture provides employment
for not less than 80 percent of the total population (CSA, 2007). In 2008/09, this sector generated
about 42.6 percent of the Gross Domestic Product (GDP) (NBE, 2009). Agriculture is also the
life line of the export earning sector of the country, covering about 90 percent of all exports. The
four major agricultural commodities: coffee, oilseeds, hides and skins, and pulses, accounted for
65 percent o f the total export earning of the country between 2006 and 2009.
The Agricultural sector, however, is under performing, and several factors have been identified
as being responsible for the situation. The factors include: use of traditional agricultural practices
and implements; low inputs and lack o f effective extension services; over grazing; serious
erosion and depletion of soil fertility; lack of adaptive research; and the inadequacy of
agricultural credit. Other factors include: deficient communication infrastructure; ecological
1

imbalance; inappropriate agricultural policies; poor market integration and political instability
(Belay, 2002).
These factors condemn Ethiopia’s agricultural sector to produce at subsistence level with
incomes not adequate to cover the farmers' consumption and expenditures and allow them to
invest back in to their farms. The low disposable incomes available at household levels have
exacerbated the inability of smallholder farmers to improve agricultural production through
acquisition and use o f modem technologies.
In countries like Ethiopia where subsistence agriculture prevails and where small-holder farming
dominates the overall national economy, farmers often face a scarcity of capital (saving) to adopt
new agricultural technologies. Hence, short-term credits with favorable terms for seasonal inputs
like fertilizer, improved seeds, pesticide and herbicides would generally be favored because
better return would be achieved quickly within the crop season.
The use of credit has been envisaged as one way of promoting technology transfer, while the use
o f recommended farm inputs is regarded as key to agricultural development ( I omoya and
Takashi, 2010). Therefore, the provision of sustainable credit for agricultural inputs is one of the
most effective strategies for improving productivity among the resource poor farmers.
Delivering productive credit to the rural poor has been a hotly pursued but problem-plagued
undertaking. Providing low-cost, efficient credit services and recovering a high percentage of the
loans granted, is the basis for rural finance (Wenner, 1995), yet the combination has often been
an illusion.
2

1.2. Statement of the Problem
In the subsistence agriculture sector, in low income countries such as Ethiopia, where
smallholder farming dominates the overall national economy, smallholder fanners face a severe
shortage of financial resources to purchase productive agricultural inputs. The prices o f inputs
rise very rapidly every year and consequently, the hope of the subsistence fanners on financial
institutions for credit has become substantially higher in the recent times.
In Ethiopia, the importance of agricultural credit in the development of the sector has been
emphasized strongly by various authors (Sonja and Nick, 2002; Anbes, 2007; Lenis etal., 2009;
Tomoya and Takashi, 2010). All these authors had concluded that credit helps to bring about the
required productivity and food self sufficiency through the adoption of new and improved
technologies.
It is important that borrowed funds be invested for productive purposes, and the additional
incomes generated, be used to repay loans in order to sustain and make the production process
and credit institutions viable. But failure by farmers to repay their loans on time, or to repay
them at all, has been a serious problem facing both agricultural credit institutions and
smallholder farmers. Poor loan repayment in developing countries has become a major problem
in agricultural credit administration, especially by smallholders who have limited collateral
capabilities (Aja Okorie, 2004).
The loan default problem has had tragic effects leading to systems failure in the implementation
o f appropriate lending strategies and credible credit policies. In addition, it discourages the
financial institutions from refinancing the defaulting members, which pits the defaulters in a
vicious cycle of low productivity. Therefore, a thorough investigation of various aspects of loan
defaulting is important for both the policy makers and the lending institutions.
3

Eastern Hararghe is part of the autonomous zone of the Oromiya Regional State. In this zone,
widespread poverty and food insecurity are prevalent. It has been assumed that the lack of well-
established and sustainable financial institutions is one of the root causes of the perennial poverty
in the rural areas of the zone. Indeed, lack o f access to financial services, reduces the availability
o f new technologies to rural households, leading to low agriculture productivity and food
insecurity.
In Eastern Hararghe, Oromiya Zone, the Regional Government and Non-Govemmental
organizations are extending credit facilities to farming households in order to narrow the gap
between the capital required and the capital that the households possess, for the improvement of
agricultural technologies that would increase production and productivity. However, there is a
serious loan repayment problem in the area. For instance, according to the East Hararghe Saving
and Credit Share Company, in 2008/2009 and 2009/2010 up to the third quarter report, about
2,389,847.58 and 1,490,278.88 Birr (Ethiopian currencies, one Birr = 16.85 USD) in loans
respectively, has not been repaid. This means that the recovery rate of credit for the year
2008/2009 of the Oromiya Saving and Credit Share Company (OSCSC) was 73.6 percent. As
compared to other micro finances this loan recovery rate is very low during the study period.
Although there are such severe problems, the factors that contribute to this situation are not
known and have not been studied in the different agro ecological zones.
1.3. The Purpose and Specific Objectives
The purpose o f this study was to examine the factors affecting the loan repayment performance
o f smallholder farmers in Eastern Hararghe, Ethiopia.
4

The specific objectives of the study were to:
1. Characterize the loan repayment performance across different prevailing institutional and
socio-economic platforms; and
2. Analyze the factors that are likely to affect the loan repayment performance among
smallholder farmers in Eastern Hararghe zone.
1.4. Hypotheses of the Study
The study delineated the following hypotheses:
1. The socio-economic and institutional factors are similar among defaulter and non defaulter
of small holder farmers.
2. The environmental, socio-economic and institutional factors have no effect on loan
repayment in Eastern Hararghe zone.
1.5. Significance of the Study
It was envisaged that the study would provide information that will enable effective measures to
be undertaken to improve the loan repayment performance and the success of rural credit
programs. It would also enable lenders, such as non-govemmental organizations, and policy
makers, to appreciate and understand where and how to channel efforts to minimize loan
defaulting. The study was also expected to contribute towards better credit administration with a
possible pay-off in improved loan repayment.
1.6. Scope and Limitations of the StudyThe study was conducted in Eastern Hararghe Zone, of the Oromiya Regional State, in Ethiopia.
As stated in the objectives, the main aim o f the study was to identify important demographic,
socio-economic and institutional factors that affect loan repayment performance of smallholder
farmers who borrow from formal credit sources. Accordingly, the study was conducted in two
5

districts of the Eastern Hararghe Administrative Zone, Combolcha and Babile districts, which
represent the highlands and lowlands respectively. The study randomly selected 70 households
for each region; these were the users of credit from formal sources during the 2008/2009
agricultural production year.
The study was concerned with the analysis o f the main determinants of formal loan repayment
performance of Eastern Hararghe Administrative Zone small-scale farmers and therefore did not
consider borrowers from informal credit sources. This limitation is attributable to the time
constraint and the relatively higher asymmetry of information in informal circles. Therefore, the
study was undertaken to meet its objectives within the above limitations.
1.7. Organization of the Thesis
This thesis is organized into five chapters. Chapter one provides the introduction, the
background, statement of the problem, objectives, hypotheses o f the study, the scope and
limitations, and the significance of the study. Chapter two presents a review of the theoretical
and empirical literature pertinent to the concern of the thesis. Chapter three describes the
research methodology including a brief description of the study area, data collection procedures
and analytical techniques. Chapter four reports the results of the study, and the discussion.
Finally, a summary o f the major findings, conclusion and recommendations are presented in
Chapter five.
6

CHAPTER TWO: LITERATURE REVIEW
2.1. Definition of Credit
The Concise Me Graw-Hill Dictionary of Modem Economics defines credit as. an exchange of
goods and services, for the promise of a future payment. It also indicates that credit is necessary
in a dynamic economy because of the time that elapses between the production of a good and its
ultimate sale and consumption; credit thus bridges this gap. The risk in extending credit is the
probability that future payment by the borrower will not be made (Greenwal & Associates,
1983).
Financial institutions are private or governmental organizations, which serve the purpose of
accumulating funds from savers and channeling them to individual households, and business
looking for credit. Financial institutions are composed of deposit-type institutions (bank and non
bank contractual saving institutions), personal and business financial companies, government and
quasi-government agencies, and miscellaneous lenders. Financial institutions that receive funds
from savers and lend them to borrowers are called financial intermediaries. In a broad sense, the
term, financial intermediary, is applicable to all financial institutions including commercial
banks. These intermediaries pool money from savers and channel them to individuals, mutual
saving banks, saving and loan associations, insurance companies, and pension trusts. In a narrow
sense, however, it excludes commercial banks (Greenwald & Associates, 1983). Formal
financial institutions can be defined as institutions that are regulated by central bank supervisory
authorities, for licensing and credit policy implementations. They usually use legal
documentation, or the legal system, to enforce contracts. On the other hand, informal financial
intermediaries are those which are not licensed and regulated by the central banking system and
they rarely use legal documentation or the legal system to enforce contracts.
7

2.2. The Need for Credit
Credit is the key means to have access to inputs in many development programs. This is
particularly true for rural development because, so long as sufficient credit is not provided to
support the development programs of the weaker sections of the society, the goal of development
may not be achieved.
As a result o f high population pressure in the rural areas of developing countries, such as
Ethiopia, getting additional productive land is difficult, implying the need to improve farm level
productivity through intensification. This involves, as pointed out by Tenaye (2010). the use of
improved farm inputs such as fertilizers and improved seeds, besides improved tillage and
husbandry practices. These inputs are not available on the farm and most farmers are not able to
purchase them due to lack of finance. Moreover, most o f the commercial inputs are expensive
and hence, smallholder farmers cannot afford to buy them, from their own cash earnings. It is.
therefore, generally acknowledged that agricultural credit to smallholder farmers can help to
improve their farm productivity through use o f improved farm inputs.
A number of researchers (Mark and Khandker, 2001; Chang, 2005) independently reported the
requirement of credit facilities to small holders of less developed countries (LDCs) for
production and consumption smoothing. Governments o f LDCs and aid agencies have spent
large amounts of money in this sector. The motivation has been the belief that loans are an
essential part of various input packages, prescribed as part of the agricultural investment projects
designed to introduce modem technologies and thus stimulate change and growth in agriculture
in the third world.
Joseph and Robert, (2009) , reporting on a study of Thailand, also indicated that credit has
impact, increasing consumption, agricultural investment, income growth (from business and
8
labor), and also a positive impact on wages, which is an important general equilibrium effect.
Moreover, while income accrues during a limited period of the year, their expenses are spread
throughout the year. This implies that, expenditures on inputs, have to be incurred, much in
advance, of the income from resulting outputs. Producers meet these expenditures out o f their
past savings and when these savings fall short of the requirement, they borrow. Some studies of
Ethiopia indicated that credit increased productivity in agriculture, enabling farmers to adopt
improved technologies. For instance, the study by Tomoya and Tokshi, (2010) demonstrated that
farmers who had access to credit were more likely to use improved seeds than those who had no
access to credit.
According to Tenaye (1995), credit makes traditional agriculture more productive; through the
purchase of farm equipment and other agricultural inputs, the introduction of modem irrigation
system and other technological developments. Credit can also be used as an instrument for
market stability. Rural farmers can build their bargaining power by establishing storage facilities
and providing a transport system through credit. Credit plays a key role in covering the
consumption deficits o f farm households. This would, in turn, enable the farm family to work
efficiently in agricultural activities. Credit can further be used as an income transfer mechanism
to remove the inequalities in income distribution among the small, middle, and big farmers.
Moreover, credit encourages savings and therefore, savings held with rural financial institutions
could be channeled to farmers for use in agricultural production. Credit also creates employment
opportunities for rural farmers.
Rural households in Ethiopia need credit for investment for a range o f on-farm, off-farm and
non-farm activities. Indeed, about ten years ago, it was estimated that 10 to 12 million families
9

required credit (IFAD, 2001). Most productive activities are seasonal and there is equally strong
credit demand for consumption smoothing.
2.3. Theoretical Perspective of Credit Market
A major economic problem in developing countries is financial intermediation, the mobilization
o f capital from one group (savers/lenders) and its simultaneous allocation to meet the needs of
another group (borrowers/entrepreneurs) (Christensen, 1993). Financial intermediation is critical
for efficient capital mobilization and allocation. Financial intermediation can be performed
through various forms o f instruments; the three most important ones are equities (stocks), long
term (bonds), and short-term loans (credit) (Stiglitz, 1989). In most developing countries,
because of the relative under-development o f the first two forms o f instruments, credit markets
for short term loans become the major means of financial intermediation. The capital
mobilization function o f credit markets is, however, constrained by several factors. First when
there is a lack of macroeconomic stability, as experienced by many Latin American countries
during the 1970s and 1980s, people prefer to invest in fixed assets such as real estate and
jewelry, or to save in foreign currencies, out o f the country, instead of depositing local currencies
in domestic institutions.
Secondly, savers are willing to deposit money in saving institutions only if they believe that they
will be able to withdraw the money according to pre specified terms. The risk of bank closure
and the availability of deposit insurance become important considerations for potential
depositors. In many countries, governments establish banking regulations such as capital and
reserve requirement to ensure the ability of banks to meet withdrawal demands.
Thirdly, government regulations create opportunities for political abuses. In some developing
countries, for instance, the banking system is tightly controlled by government officials who
10

view it as a convenient source of cheap credit for their own expenditure projects and their
favored political clients (Hanke and Walters, 1991). Thus, by offering mostly negative real
interest rates to depositors, the banking system is not an attractive saving avenue for most people
(McKinnon, 1973). The limitations of the formal banking system may be compensated for by
informal credit arrangements that offer higher returns for depositors, but these informal
arrangements are usually limited in scale and lack legal protection for the depositors.
In addition to overcoming the obstacles for capital mobilization, credit markets need to
overcome the information problems associated with credit allocation (Stiglitz, 1989). First,
because of the potential for default, lenders need to solve the selection problem; by screening
loan applications based not just on how much interest the borrowers are willing to pay, but also
the probability of default. Second are the enforcement problems related to the ability of lenders
to ensure that the borrowers will actually repay the principal and interest, at specific times. Third,
is that loan contracts need to include a variety of provisions other than interest rates. Non-price
terms such as collateral and other kinds of restrictive covenants, such as market inter linkage, are
often needed to create appropriate incentives for loan repayment.
2.4. Financial Institutions in Ethiopia
2.4.1. Formal Financial Sector
The formal financial institutions include the National Bank of Ethiopia (NBE), Commercial
Bank of Ethiopia (CBE), Development Bank of Ethiopia (DBE), Construction and Business
Bank (CBB), and the recently proliferating private commercial banks such as Dashen, Wogagen.
Abyssinia, Awash International, and Nib-International; and the non-banking financial institutions
such as the public and private insurance companies (Ethiopian Insurance Corporation (EIC),
Nice, Nyala, Africa, and Awash).
11
In the Ethiopian context, farm credit has been made available through public financial
institutions o f which the Commercial Bank o f Ethiopia (CBE) and the Development Bank of
Ethiopia (DBE) are the two major providers o f credit for inputs such as fertilizer, improved seed,
herbicides, and farm tools. However, the DBE sharply reduced its supply of fertilizer loans in
the early 1990s when its existence was threatened by massive default. The Development Bank of
Ethiopia (DBE) stopped extending input credit in 1997. Currently, the major source o f input
credit is the CBE; there is also the limited participation of the emerging rural micro finance
institution and the Amhara Credit and Savings Institution
The financial institutions, however, do not have contact with the farmers on an individual basis.
Instead, the regional governments facilitate the loan provision, along with signed agreements
with banks on the amount, duration and security of the loan. The amounts of the loans are
estimated by each regional government, and in fact are estimated, based on information obtained
from zonal- and district-level demand for the previous years. The loans are short-term credits,
which should be paid back within one year; the banks use the regional government's budget as
collateral.
Twenty seven micro-finance institutions have been officially recognized by the National Bank of
Ethiopia (NBE, 2010). These institutions, deal directly with individual farmers, who fulfill the
loan provision criteria set by their management. Though figures on the amount of credit they
provide are not available, it is believed that these institutions play an important role in narrowing
the gap between demand and supply of credit in rural areas. The advantage of these financial
institutions is that, farmers can get loans in cash and use them to purchase the most limiting
production resources.
12

Due to the large number of defaulters, the Agricultural and Industrial Development Bank (AIDB)
and the Development Bank of Ethiopia (DBE), since the early 1990’s have not been interested in
extending input credit to farmers. Regions have now come into the picture of credit
administration, to fill the gap. According to Mulat (1994), the majority of farmers in Ethiopia
(over 80 percent) bought fertilizer on credit. Since the farmers were forced to re-pay their
fertilizer loans immediately after harvest when the grain prices had dropped to very low levels
because of oversupply, many farmers became defaulters. By the power vested in it, the National
Bank of Ethiopia has licensed and has been regulating several financial institutions since the
introduction o f market reforms in 1994 (Proclamation No. 83/1994). By January. 2009. 16
commercial banks, nine insurance companies, 29 micro-finance institutions, and one
development bank had been recognized by the National Bank (NBE, 2010). Both the number
and branch offices o f financial institutions increased after the liberalization, for instance, the
number of commercial banks increased from 5 to 16 between 1995 and 2009. Similarly, the
number of branch offices of the commercial banks increased from 202 to 681 in the same period,
although 38.9 percent o f the branch offices are found in and around the capital city, Addis Ababa
(NBE, 2010).
The formal financial institutions in Ethiopia can be categorized into three based on ownership,
viz., public banks and insurance companies, private banks and insurance companies, and micro-
finance institutions. Table 1 presents a situation picture of the financial institutions in Ethiopia.
13

Table 1: Financial institutions in Ethiopia
Description Number Number owned by the state
Total number of branch offices
Commercial Banks 16 3 649
Development 1 1 32
Insurance Companies 12 1 207
Micro finance Institutions 27 - 715
Source: National Bank of Ethiopia (NBE), 2010.
2.4.1.1. Public Banks and Insurance Corporation
These are state-owned financial Institutions which include three banks and one insurance
corporation namely: the Commercial Bank of Ethiopia, the Development Bank of Ethiopia, the
Construction and Business Bank (CBB) and Ethiopian Insurance Corporation (EIC). One of the
peculiar characteristics of these institutions is that all of them existed before the market reforms
and thus, have long years of service, large fixed as well as working capital and widespread
branch offices all over the country, as compared to other financial institutions.
2.4.1.2. Private Banks and Insurance Companies
These financial Institutions include those established by the private sector after liberalization of
the market. Almost all of them are in the stages of growth and have limited number of branch
offices. Currently, there are 13 private banks and 11 private insurance companies in Ethiopia.
2.4.1.3. Micro-Finance Institutions (MFIs)
The number o f micro-finance Institutions (MFIs) operating in the country reached 27 at the end
o f the fiscal year 2008/2009 (NBE, 2010). Their total capital stood at Birr 1.7 billion, they
mobilized deposits of Birr 2 billion, advanced loans of Birr 4.9 billion and total assets of Birr 6.6
14

billion, by the end of the fiscal year. Of the total MFI’s, 14 were operating in Addis Ababa,
seven in Oromiya, three in Amhara and the other three in different regional states. The biggest
MFI’s namely: Amhara Credit and Saving Institution, Dedebit Credit and Saving Institution and
Oromiya Credit and Saving Institution are the first, second and third biggest MFIs .respectively.
(Appendix 2).
2.4.1.4. Oromiya Credit and Saving Share Company
The Oromiya Credit and Savings Share Company(OCSSCO) was established in 1995, formerly
known as Oromiya Rural Credit and Saving Scheme Development Project. It was an offshoot
o f the Oromo Self Help Organization until August 4. 1997, when the project was phased out and
the company established. At its establishment, the project had almost the same mandate as that of
OCSSC today, and commenced its operations in four districts/branches of four Oromiya zones in
February 1996. The branches were Kuyu o f North Showa zone, Sinana-Dinsho of Bale zone.
Hetosa of Arsi zone, and Shashamene of East Showa zone.
After one and a half years of operation, the Oromiya Rural Credit and Saving Scheme
Development project was transformed into a company, following Proclamation Number 40/96
issued by the National Bank of Ethiopia, the licensing authority, to regulate the business o f micro
finance in the country. Through time, the company has increased its area and client outreach in
the region. The company made an effort to expand its services to urban areas, but was not as
effective as intended. As a result, 99 percent of its clientele are from rural areas; whereas only 1
percent is from the urban. Female clientele comprise 12 percent. The current outreach of the
company is a clientele o f 458,762, with a total loan capacity of 708 million Birr.
15

2.4.2. Informal Financial Sector in F.thiopia
According to Yohannes (2000), informal lending, in comparison to formal financial institutions,
informal lending is by far, the most important source of finance for the rural and urban
population. In recent years, the informal sector has continued to assume an increased prominence
mainly due to the restrictive rules and regulations of the formal financial sector. The operations
o f the informal sector derive their rules and regulations from the country’s culture and customs.
Informal sector transactions are conducted on the basis of trust and intimate knowledge of
customers. The common cultural background and the mutual obligations and fervent bonds of
family and kinship, operate to promote the trust, accountability and moral responsibility that is
lacking in the official banking system.
Besides, the informal lenders have easy access to information (at reasonable cost) about the
borrowers, with whom they have social relations. This permits credit contracts to play a more
direct role in enforcing repayment. Also, the fact that collateral is rarely used in the informal
sector enables the sector to flexibly satisfy the financial needs that cannot be met by the formal
financial institutions (Yohannes, 2000).
Nevertheless, the informal sector is not without its limitations. Despite its flexibility, rapidity and
transparency of procedures, not only are there scarcities of loan funds for investment, but also,
the interest rates charged on these loans are often exorbitant. The informal financial sector often
embraces a wide group of individuals and institutions whose financial transaction are generally
not subject to direct control by the country's key monetary and financial policy instruments.
Individual economic entities in the informal sector include moneylenders, money-keepers,
tradesmen, friends and relatives, and neighbours.
16
2.5. Empirical Studies on Loan Recovery and Defaults
Knowledge on the determinants of loan repayment is undoubtedly important because it provides
information to the lender about the incentives that are amenable for the borrower to comply with
repayment schedules. Empirical studies, in this connection, however are limited in Ethiopia,
although recently, researchers are indicating interest and carrying out relevant studies. Indeed,
there are several studies from various parts of the world on loan repayment issues, but the
methodologies applied and the results are not, strictly, similar.
2.5.1. Loan Repayment Performance Globally
Several studies have analyzed loan repayment performance from different perspectives, upon
which upcoming initiatives need to draw reference. Zeller (1996), investigated the determinants
o f repayment performance in credit groups. The study focused on the effects of program design,
community and group characteristics on the repayment performance of groups, using a data set
on groups from six different lending programs in Madagascar. The study found that socially
cohesive groups pool risks by diversifying the members' asset portfolio so that their repayment
performance is improved, even in communities with high-risk exposure. Indeed, the evolution of
microfinance services all over the world has tended to focus on group programs.
Chirwa (1997), investigated the probability o f agricultural credit repayment utilizing data from
five agricultural development divisions in Malawi, using a probit analysis. The results, based on
1,237 sample farmer club members, indicated that, the availability o f resources from crop sales
and income transfers, the size of the club, the degree of diversification and the quality of
information determined the probability o f repayment. In contrast, other factors such as the
amount of loan, gender of household head, and size of household and club experience were not
statistically significant. Crop sales, income transfers, degree of diversification and quality of
17

information were positive and significant, while size of club was negatively related with the
probability of repayment. However, the study only analyzed farmer’s probability o f loan
repayment rather than, the actual performance of loan repayment. This may be a loss of
information because the dependent variable that the study used was dichotomous.
A study of South Africa, carried out by Kuhn and Darroch (1999), using a multinomial logit
model associating loan default to various factors, indicated that, clients with larger loans were
less likely to default. This is because such loans tended to be associated with more (verifiable)
collateral, lower administration costs per unit o f credit and probably better quality information on
potential investment returns.
The study by Nitin and Shui-Yan (2002) in the United States of America used the logit model to
associate loan default to various factors. The study found that education and entrepreneurs'
businesses located in the same zip code as the lending agency significantly influenced loan
repayment at 5 and 1 percent error levels respectively. However, this study also used the binary’
model and did not consider the smallholder farms in rural areas.
Mosley (1995, cited in Belay, 2002) investigated what was called optimal incentives to repay in
institutional lending to low income groups in Indonesia. The study identified three types of
incentives and tried to find out the optimum levels of these incentives to optimize the payoffs of
lenders and borrowers from the game. The optimum levels of these incentives were: incentives to
the borrower to pay on time, consisting of a discount on interest payments, which are refunded
when all payments due have been made; an incentive to the borrower consisting of a credit limit,
which is expanded at the rate proportionate to repayment performance of the previous loan; and.
incentives to the staff of lending institution to optimize their efficiency in monitoring and
18

securing repayment by making a portion o f income dependent on some indicators o f the
performance of the institution, usually profit or loan recovery.
Oladeeba and Oladeeba (2008) examined socio-economic factors influencing loan repayment
among small scale farmers in the Ogbomoso agricultural zone of Oyo State, Nigeria. The data
used in this study was gathered from 100 farmers drawn from ten villages, and the Ordinary
Least Square multiple regression was used. The study found that the amount of loan obtained by
farmers, years of farming, experience with credit use and level o f education were the major
factors that positively and significantly influenced loan repayment while, age of farmers
influenced loan repayment negatively and significantly. However, two limit Tobit model was
applied in the current study because of the limitation of the Ordinary Least Square multiple
regression cannot applied for the continues but limited dependent variable which otherwise will
leads to biased and inconsistent parameter estimates.
The study carried out by Ugbomeh M. el al. (2008) in Nigeria, examined the determinants of
loan repayment performance among women’s self help groups. The study used ordinary least
square (OLS) of multiple regression analysis to identify the factors affecting loan repayment.
The results indicated that women as household heads, interest rates and household size,
negatively and significantly affected the loan repayment performance of women farmers, while
the price stability o f farm proceeds and commitment to self help groups, positively and
significantly affected the loan repayment o f women farmers in self help groups in the area.
However, like the previous study, this author also used the ordinary least square method and it
did not consider important institutional and socio-economic variables those that more likely
affect loan repayment performance rather than cost of loan recover, women as household heads,
19

interest rate, household size, price stability o f farm proceeds, and commitment. In addition the
study was limited its scope to only women’s self help groups.
Roslan and Abdkarim, (2009) investigated the determinants o f loan repayment among
microcredit borrowers in Malaysia. The data, used in this study, was gathered through a survey
of 2,630 respondents, drawn from 86 branches of the Agrobank in Malaysia. The study
employed the probit and logit models to identify the main determinants that influence
microcredit repayment. The study found that type of business activity; amount o f loan;
repayment period and training were the major factors that negatively and significantly influenced
repayment. On other hand, the gender of the borrower influenced the probability of loan default
positively. However, this study also used the binary model and did not consider the small holder
farms that couldn’t pay collateral in rural areas.
2.5.2. Loan Repayment Performance in Ethiopia
Ethiopia has had its share of agricultural loans over the years, and equally, its share o f loan
defaulters. A number o f studies have investigated the phenomena. Abebe (1998) hypothesized
that 21 socio-economic variables influenced the loan repayment performance of smallholder
farmers, in Alemgena district, Ethiopia. Accordingly, his fitted multiple linear regression
analysis revealed that factors such as experience in own farm, experience in credit use,
proportion of area under teff and wheat production, annual farm revenue, number of draught
oxen owned, ownership of livestock in the livestock unit, number o f contacts with development
agents and the location of the farmers from the development agents’ centre were the most critical
variables contributing to loan repayment. However, the current study, done in a different area
used the two limit Tobit model to determine the factors affecting loan repayment among
smallholder farmers to solve the limitation o f multiple OLS method.
20

Bekele (2001) hypothesized 15 demographic, socio-economic, natural and institutional variables
to explain the loan repayment performances o f smallholder farmers in the Amhara and Oromiya
regions of Ethiopia. His logit regression model results indicate that, timeliness o f input supply,
amount of formal loan per hectare, total grain production, participation in ofT-farm activities,
total livestock owned in monetary terms, informal loan and yield loss due to bad weather, were
significant, while the remaining eight variables, were less powerful in explaining the variations
in the dependent variable. However, the study only analyzed farmer’s probability o f loan
repayment rather than, the actual performance of loan repayment. This may be a loss of
information because the dependent variable that the study used was dichotomous. Therefore, the
current study has measured the performance o f loan repayment among small holder farmers by
using two limit Tobit model.
Belay (2002) examined the socio-economic factors influencing loan repayment in Diredawa.
Ethiopia. Data was collected from 92 randomly selected borrowers, drawn from 23 savings and
credit groups. The study used a binary logit model to analyze the factors influencing loan
repayment performance of rural smallholder fanners. The Study included 12 explanatory
variables in the empirical model, out of these, six were found to be statistically significant.
Location of bonowers from lending institution, loan diversion, annual farm revenue and
celebration o f social ceremonies were highly important in influencing loan repayment
performance among smallholder fanners. However, the current study used two limit Tobit
model, to minimized inadequacies of a binary logit model because the dependent variable
measure the performance of loan recovery rather than probability loan recovery.
Abreham (2002) examined the determinants of loan repayment performance among small
scale enterprises with particular reference to the Development Bank of Ethiopia. The study used
21

the Tobit model and the findings revealed that having other sources o f income, education, and
work experience in related economic activity before the loan, and engaging in economic
activities other than agriculture, are enhancing, while loan diversion, male borrowers , and
extended loan repayment periods were undermining factors in the loan recovery' performance of
projects. This study used an appropriate model to analyze loan repayment performance, but, only
investigated small-scale enterprises with particular reference to the Development Bank.
However, the current study has examined smallholder farmers, who had no collateral.
Samsom (2003) investigated the financial arrangements and determinants of consumption credit
use by rural households in Ethiopia. The data used in the study was gathered from 100 rural
households drawn from eight Peasant Associations. A multivariate tool and, linear discriminate
analysis was applied. The results reveal that the probability of loan repayment default was
influenced by the gender of the borrower, the type of business activity engaged in. the amount of
the loan, repayment period, and training at 5 percent level of significance. This study therefore
focuses on determinant of consumption credit loan repayment performance in rural household
while the current one investigated the performance of loan repayment among the small holder
farmers who received loan for production purpose.
2.5.3. Methodological Issues
Various studies on loan repayment performance (for example, Chirwa (1997). Kuhn and Darroch
(1999), Bekele (2001), Kebede (2002), Oladeeba and Oladeeba (2008) and Roslan and
Abdkarim, (2009)) were variously analyzed using logit, probit, and Ordinary Least Square
multiple regression models. Most of the studies conducted on modeling the determinants o f loan
repayments, have used dichotomous discrete choice models (Logit and Probit) where, the
dependent variable is a dummy that takes a value of zero or one, depending on w hether or not a
22

farmer has defaulted. However, Lynne el al. (1988) pointed out the possible loss of information
if a binary variable is used as the dependent variable. In addition, binomial models explain only
the probability that an individual made a certain choice (i.e. defaulted or has not defaulted); they
fail to take into account the degree of loan recovery. The linear probability model (LPM), even
though computationally and conceptually simpler and easier to use than the binary choice
models, depends on the use of ordinary least squares (OLS) approach. Application of OLS to
censored model however, inherently produces a heteroscedastic disturbance term (e,) and as a
result, the standard deviations of the estimates are biased. These inadequacies are minimized
with the use of the Tobit Model (Tobin, 1958). Therefore, this study used the two limit Tobit
economic model to analysis factors affecting loan repayment performance.
23

CHAPTER THREE: METHODOLOGY
3.1. Conceptual Framework
It is conceptualized that loan repayment is influenced both directly and indirectly by various
factors. Government policy, institutional and environmental factors are generally out o f the
control of farmers’. Government policy and environmental factors indirectly influence loan
repayment and directly influence a farmer’s efforts but, institutional factors influence directly
and indirectly the loan repayment. Other factors such as demography and farmer attributes
directly influence loan repayment. These relationships are presented in Figure 1 below.
The perceived or hypothesized relationships, however, need to be tested for authenticity, hence
this study.
24

INSTITUTIONAL FACTORS
4 Group lending 4. Agriculture Extension 4 Inflexible repayment
period4 Social ceremonies
GOVERNMENT POLICY AND
4 Poverty reduction 4 Interest rate policy 4 Collateral policy 4 Repay ment period
ENVIRONMENTALFACTORS
4 Drought 4 Crop failure 4 Flood4 Crop disease and pe
Animal disease
DEMOGRAPHIC FACTORS
4 Age 4 Education 4 Gender
FARM ATTRIBUTES4 Farm size4 Experience credit use4 Income4 Family labour4 Types of product4 Livestock ownership
1
Figure 1 Conceptual Framework
Source: - Conceptual Idea Adopted from New Institutional Economics Perspectives on African Agricultural Development (Dorward and Omamo, 2009)
25

3.2. Description of the Study Area
The Oromiya Regional State lies in the central part of the Federal Democratic Republic of
Ethiopia, with the large protrusions towards the south and the west directions. It extends from 3°
40'N to 10° 46' N latitude and from 34°08E to 42°55'E longitude (OBPED, 2000). The region
has an area of 363,007 square kilometers, and accounts for 32 percent o f the country's land area.
The region has a total border line of 5,672-kilometre and maintains physical contacts with all
regional states, except the Tigray. The region also has international borderlines with the
Republics of Kenya and Sudan. The political administration of the region consists o f 17
administrative zones, 197 districts, and about, 5,968 and 483 peasant and urban dwellers
association, respectively (RADSO, 2003).
Eastern Hararghe Zone is among the 17 Zones of the Oromiya Regional State and is located
between 70° 32’N and 90° 44’N latitudes and 41°12’E and 42°53’E longitudes. East Hararghe
Zone has an average altitude of 1,750 meters above sea level. The Zone has a total area of about
24,900 square kilometers. The total population of the East Hararghe Zone, based on the 2007
national census, is 2,723,850 of which 1,383,198 are males and 1,340,652 are females. Babile
and Combolcha are among the 17 districts of the zone.
3.2.1. Description of Babile District
Babile district is located in East Hararghe zone of Oromiya Regional State. It has a total area of
3,169 square kilometers, accounting for about 14 percent o f the total area of East Hararghe. The
district town, Babile, is located 35 km from Harar town in the south east. Geographically. Babile
district is located at 90°8’N latitude and 42°21’E longitude. It is among the 17 districts o f the
East Hararge Zone, and is bordered by Gursum and Feddis districts, and Harari and Somali
Regional states.
26

Agro-ecologically, Babile district is characterized by plains and low lands. The altitude stretches
between 950 and 2000 meters above sea level. Babile district falls under the lowland agro
climatic zone, which covers 90 percent of total area, and the mean annual rain fall varies from
450 to 600 millimetres.
Babile district had a total population of about 93,674. Out o f the total population 75,970 live in
rural areas, 47,153 are male and 46,521 are females. Cultivable lands, pasture lands, and forest
occupy about 21.1, 3.9, and 3.7 per cent, respectively. Agricultural production (both crop and
livestock) is the main source of income and employment o f the people. Mixed farming is also
practiced and the most commonly produced cereals are sorghum and maize. Groundnuts are also
an important crop grown in the area.
3.2.2. Description of Combolcha District
Combolcha district is located in the eastern part of Ethiopia, and is one o f districts in the Eastern
Hararghe Zone. Combolcha district is located 541 kilometers from Addis Ababa and the capital
city of the district is located a distance of 18 kilometres away from Harar town in the north
direction. The district is bounded on the south by Harari Region, to the southwest by Haramaya
district, to the north by Dire Dawa and to the east by Jarso. The total area of the district is about
441.4 square kilometers, divided into 19 rural peasant associations and one urban kebele.
The total areas of Combolcha district in general, is categorized into two major climatic
conditions: highland and lowland, which accounts for 74 and 26 percent respectively. The
average annual rainfall varies from 600 to 900 mm. Combolcha district consists of diversified
topographical features with an altitude varying from 1,600 to 2.400 meters above sea level.
27

According to information obtained from the District Agricultural and Rural Development Office
(A & RDO), based on 2007 national census, the current population o f the district is 140,769,
comprising of 71,288 male and 69,481 females. About 93 percent of the total population
(108,347) are living in the rural areas. The majority of the population in this district belongs to
the Oromo ethnic group, and the dominant religion is Islam. The land coverage comprises of
cultivated land (35.5 percent), grazing land (1.19 percent), forestland (7.79 percent), shrubs
(16.66 percent), stony hills (13.5 percent), gully land (13.8 percent), and the rest is used for
residential houses (11.56 percent). The major economic activities o f the population in the study
area are domestic crop production and animal husbandry. From the main economic earning of
the area, khat ranks the first, followed by cereals and vegetables. From cereal production maize
constitutes (50 percent) followed by sorghum (45 percent) and wheat (5 percent).
According to information obtained from the district Agricultural and Rural Development Office
(ARDO, 2005), out of the total areas covered by perennial crop (12,340 ha), 80 percent is
covered by the khat crop, and farmers commonly use irrigation for vegetable and khat
production. Intercropping cereals with khat is the common farming system in the study area.
Agricultural production in both districts is basically subsistence, as most farmers often have
inadequate resources for the development of agriculture. The farmers however, are trying to
commercialize but the severe shortage of financial resources to purchase productive agricultural
inputs is a drawback.
The Oromiya Credit and Savings Share Company, extends credit and savings facilities to
farming households in the two districts in order to narrow the gap between the capital required
and the capital that the households possess, for the improvement of agricultural technologies that
28

would increase production and productivity. However, there are there are severe loan repayment
problem in both districts.
Figure 2 below presents the Map of Eastern Hararghe zone, showing Combolcha and Babile
districts
Sourer: Agricultural offtcr 12006)
Figure 2 Map of Eastern Hararghe zone, Combolcha and Babile district
3.3. Sample Size
The study used a random sample, selected from smallholder farmers who received loans in the
2008/09 fiscal year. The sample size was estimated using Cochran's (1963:75) method. This
study used a 95 percent confidence interval (Z=1.96) for a two tail test, and assuming that P=0.1,
with an allowable error o f 5 percent. Therefore, based on this formula, the sample size is 140.
29

, z2(ph)d 2
n = Sample size
Z = Statistical certainty, related to the error risk, equals 1.96 for an error risk of 5 percent level of
significance
p = Smallholder farmers who may access loan from OSCSC (10 percent)
q = The weight variable and is computed as 1-p
d = Desired precision or margin of error, expressed as a fraction of 0.05
3.4. Data Needs, Sources, and Collection Procedures
Primary and secondary data were used for this study. The primary data was collected from a
sample of borrower farmers, and a structured questionnaire was developed for the study.
Information pertaining to the respondents’ household, demographic and socio-economic
characteristics were obtained directly through interviews with formal borrowers in the
smallholder farmer communities. In addition to administering the structured questionnaires,
personal observation and informal discussions with the farmers was used to generate primary
data.
Secondary data were obtained from publications, seasonal and annual reports of the district,
zonal and regional offices of the Ministry of Agriculture and Rural Development, the
Development Bank of Ethiopia, Micro Finance Institutions, and other related organizations.
Multistage sampling procedure was used. First, the Oromiya region was selected purposively,
out of the nine regions of Ethiopia. This is because of the Oromiya region covers a
proportionally large part of the country with 36.7 percent of the total population. In addition, this
region has low loan recovery rate as compared to other regions. 1 hus, this region represents the
30

loan delinquency issue well. Oromiya region is sub divided into 14 zones and East Hararghe was
further selected using random sampling. East Hararghe zone is also sub divided into 23districts.
These districts are mainly categorized into two agro ecological zones, highland and lowland.
One district was randomly selected from each agro-ecological zone. Therefore, for this study,
Babile and Combolcha districts were randomly selected to represent the lowland and highland
areas, respectively.
In the 2008/2009 fiscal year, there were 12 credit centers in the Combolcha and 8 credit centers
in Babile. These credit centers were located in 17 and 21 Peasant Associations, in Combolcha
and Babile respectively. Out of a total 276 borrowers in Comobolcha and 270 borrowers in
Babile, 70 borrowers from each district were selected.
As indicated in Table 2, cluster sampling was employed, in order to select specific households,
which received a loan from the Oromiya Saving and Credit Share Company in the 2008/2009
fiscal year. To select specific households, the researcher first classified the households which had
received loans according to gender and credit centers, and then proportionally selected the
sample randomly from both agro-ecological zones.
31

Table 2 List of credit centers and number of farm households selected for the survey
Agro ecological Credit Number of Borrowers Number of sample Total sample
zone center Male Female Male Female
Center 22 32 31 8 8 16
Center 57 43 31 11 8 19
Center 66 6 1 2 - 2
Center 52 8 3 2 1 3
Center 44 4 16 1 4 5
Center 34 11 7 3 2 5
Center 32 8 2 2 - 2
Combolcha Center 68 2 8 - 2 2
Center 50 4 4 1 1 2
Center 69 4 5 1 1 2
Center 64 16 11 4 3 7
Center 58 4 15 1 4 5
Center 01 14 9 4 2 6
Center 02 18 13 5 3 8
Center 31 17 10 4 3 7
Center 48 23 16 6 4 10
Babile Center 13 14 13 4 3 7
Center 55 32 22 8 6 14
Center 09 17 10 4 3 7
Center 12 26 66 7 4 II
Total 303 243 78 62 140
Source: own computation
3.5. Method of Data Analysis
3.5.1. Descriptive Statistics
Quantitative data was analyzed using descriptive statistics such as mean, standard deviation and
percentage, in order to investigate the relative importance of major variables that, it had been
hypothesized, influenced the loan repayment performance of small holder fanners.
32
3.5.2. Empirical Models
One of the objectives o f this study was to select the variables which most significantly
distinguished between non-defaulters and defaulters of agricultural loans, from a set of personal
and socio-economic variables which, it was hypothesized, influenced repayment behavior. For
this purpose, the two-limit Tobit model was used.
There were several situations where the variable to be modeled was limited in its range. Because
of the restrictions placed on the values taken by the regressand, such models can be called
limited dependent variable regression models. When information on the regressand is available
for some observations, using OLS may result in a biased and inconsistent parameter estimates,
even asymptotically. The bias arises from the fact that, if we consider only the observable or ni
observations (that is, only observations for which the values of the dependent variable are
observed) and omit the others, there is no guarantee that the expected value of the error terms,
(E(uj)), will be necessarily zero. And without E(Uj) =0 we cannot guarantee that the O L S
estimates will be unbiased. It is intuitively clear that if we estimate a regression line based on
the nj observations only then, the resulting intercept and slope coefficients, are bound to be
different from that where all the (ni+n2) observations were taken into account (Greene, 2000).
There are three types of regression models, under the limited dependent variables models. These
are Censored or Tobit regression. Truncated regression and. Sample selected regression models.
Inferring the characteristics of a population from a sample drawn from a restricted part o f the
population is known as truncation. A truncated distribution is the part o f untruncated distribution
that is above or below, some specified value (Greene, 2000). A sample in which information on
the regressand is available only for some observation is known as censored sample.
33

I he use of Tobit models to study censored and limited dependent variables has become
increasingly common in applied social science research over the past two decades (Smith and
Brame, 2003). Tobit is an extension of the Probit model and. it is one approach for dealing w ith
the problem of censored data (Johnston and Dinardo, 1997).
In this study, the value o f the dependent variable is the repayment ratio, and it has been
computed as the ratio of the amount of loan repaid, to the total amount borrowed from formal
sources of credit. Thus, the value of the dependent variable ranges between 0 and 1 and a two-
limit Tobit model has been chosen as a more appropriate econometric model.
The two-limit Tobit was originally presented by Rossett and Nelson (1975) and discussed in
detail by Maddala (1992) and Long (1997). The model derives from an underlying classical
normal linear regression and can be represented as:
y* = P'xj + ej, 0 )
e ~ N [0,ct2].
L if Y* < L
Yj= -< Y*= pX + 6j if L < Y* <U
U if Y* > U
(2)
Where,
Yj = the observed dependent (censored) variable, in our case repayment rate (ratio of amount
repaid to the amount borrowed)
Yj* = the latent variable (unobserved for values smaller than 0 and greater than 1).
Xj = is a vector of independent variables (factors affecting loan repayment and
intensity o f loan recovery)
34
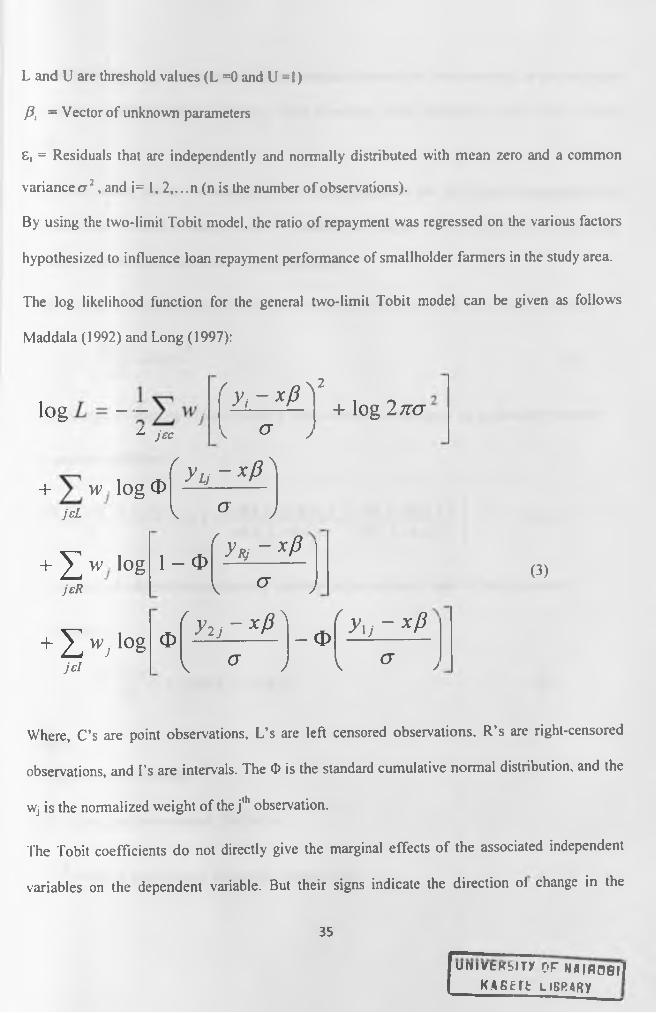
L and U are threshold values (L =0 and U =1)
P, = Vector of unknown parameters
£, = Residuals that are independently and normally distributed with mean zero and a common
variance a 2, and i= 1, 2 ,...n (n is the number of observations).
By using the two-limit Tobit model, the ratio of repayment was regressed on the various factors
hypothesized to influence loan repayment performance of smallholder farmers in the study area.
The log likelihood function for the general two-limit Tobit model can be given as follows
Maddala (1992) and Long (1997):
>°g L =^ jec
r
+ w log OjeL
f y , - * P yk o- >
\
+ log 2K G
y Lj - * P
v o- jf
+ ^ w log 1 - 0jeR
+ ^ Wj log Oje l
ynj - xp
\ G J
/ y u - x P ) J y ^ - x p
\ ° j
- oV ^ J
(3)
Where, C’s are point observations, L’s are left censored observations. R’s are right-censored
observations, and I’s are intervals. The O is the standard cumulative normal distribution, and the
Wj is the normalized weight of the j’h observation.
The Tobit coefficients do not directly give the marginal effects of the associated independent
variables on the dependent variable. But their signs indicate the direction of change in the
univtRbiTy of Nairobi]_ kabeteilibrary
35

probability of being a non-defaulter and the marginal intensity of loan recovery, as the respective
explanatory variable change (Amemiya. 1984; Goodwin. 1992; Maddala, 1985, cited in Amare,
2006).
The Tobit model has an advantage in that; its coefficients can be further disaggregated to
determine the effect of a change in the iIh variable, on changes in the probability of being non-
defaulter (Me Donaled and Moffit, 1980) as follows:
1 The change in the probahility of repaying the loan as an independent variable X, changes is:
dd>(S)dXi
(4)
2. The change in intensity of loan recovery with respect to a change in an explanatory variable
among non-defaulters is:
dE(Y,IU >Y; > L,X)dX, \ o K - U - f f o )
(5)
3. The marginal effect of an explanatory variable on the expected value of the dependent
Variable is:
dE(Y' Xj^ = - <t>{SLj) (6)oX
Where,
Xj = explanatory variables,
O (6) = the cumulative normal distribution
n x8 = = the Z-score for the area under normal curve
a
36

pi = a vector of Tobit maximum likelihood estimates
a = the standard error o f the error term.
U - X f iov —a
L and U are threshold values (L =0 and U =1)
<{> and O are probability density and cumulative density functions of the standard normal
distribution, respectively.
3.6. Variable Specification and Expectation
Table 3 presents a summary of the expectation model results and hypothesis test. In order to
determine whether to reject or fail to reject, we compared t calculated1 to t critical ~(t tabulated).
If t calculated is greater than t critical, then the H0 will be rejected; that means, the explanatory
variables significantly influence the dependent variable.
11 calculated= J3]SE
: t critical too23 df=l .96 df: degree of freedom
37

I able 3 Summary of expectation and hypothesis test
Variable_______________________ Expectation Hypothesis
AGRO-ECO +ve Ho P,=0, Hi: Pi>0AGE -ve or +ve Ho p2=0, H,: p2#0GENDER -ve or +ve Ho P3=0, Hi: pj#>EXPCRED1T +ve Ho P4=0, H i: P4->0FAMSIZE -ve or +ve Ho p5=0, H,: p5*0OFF-FARM +ve Ho p6=0. Hi: Po>0PROLOSS -ve Ho P7=0, Hp p ?^INFORCRED -ve Ho P*=0, Hi: pg<0MEMEXTE +ve H0 P,=0, H,: p9>0DISCRESOU -ve Ho pio=0, H|: P,o<0SOCCEREM -ve Ho Pii=0, Hi: pn<0NUMTEASS +ve Ho Pi2=0, Hi: Pi2>0TLU +ve Ho Pu=0, Hi: Pi3>0LOANINCOM -ve Ho Pl4=0, H|I Pu<0LANDS1ZE +ve Ho Pi5=0, Hi: pi5>0EDU +ve Ho pi6=0, Hi: Pi6>0
Source: Author
The dependent variable o f the econometric model for this study is the proportion of formal loans
repaid during the specified repayment period. This was calculated as the ratio of the total amount
of credit repaid to the total amount due. Its value ranged between 0 and 1. Those farmers who
borrowed but did not repay the full amount of money that they had borrowed are considered as
complete defaulters (i.e. the value of the repayment ratio in this case is zero), and those who had
repaid only partly are still defaulters. On the other hand, those farmers that repaid back all the
money that they had borrowed within the stated time are considered non-defaulters.
Based on the literature review and the discussions held with stakeholders, the explanatory
variables selected for this study were broadly categorized under socioeconomic, institutional and
natural factors. A brief description of the explanatory variables selected for this study and their
likely influence on the loan repayment performance is presented next.
38

Agro-ecological zone differentials (AGRO-ECO): this variable takes a value of 1 if the area
belongs to an adequate rain receiving agro-ecology or Combolcha district and 0, otherwise (if the
agro ecology of the area is moisture deficit). An agro ecological difference may influence the
rate o f loan recovery due to its direct relation to the farmers’ economic situation. For instance,
tarmers in districts with sufficient rainfall districts produce different types of food and cash
crops, and thus, have diversified sources of income. Therefore, farmers who were living in
districts with adequate rainfall were expected to have lower loan default rates as compared to
those farmers who were living in moisture deficit districts. The hypothesis that an agro
ecological zone does not significantly affect loan repayment will fail to be rejected if the beta (P)
of AGRO-ECO is zero.
Age of the borrower (AGE): This was defined as the period from the respondent's birth to the
time of the interview and was measured in years. Through time, household heads acquire
experience in farming and/or credit use. Moreover, older borrowers may accumulate more wealth
than younger ones. Therefore, this variable is hypothesized to have positive impact on the loan
repayment performance of respondents. However, if they have insufficient labor within their
households, given that older household heads in rural areas are in a disadvantaged position when
it comes to undertaking the heavy physical labor required in agriculture, then, each additional
unit increase in age after some point would thus add less to household income and may even
reduce household income leading to low repayment performance. The hypothesis that the age of
the borrower does not affect loan repayment will fail to be rejected if the beta (P) of AGE is zero.
Gender of the household head (GENDER): This is a dummy variable in the model, which
takes a value of 1 if the household head is male and 0, if the household head is female. Gender
differentials in the farm households play a significant role in the economic performance of a
39

given household. Gender differentials can be related to access to credit and indeed, one may
expect that female-headed households are less experienced in formal credit and hence will be
defaulters because they know little about the consequences of loan defaulting. The opposite
expectation may be that, female borrowers tend to be more loyal to the lenders than male
borrowers. This may arise from the fact that females are more responsible for childcare and
home management and hence they may be more concerned than males, about the possible
undesirable consequences arising from the default. Therefore, it is expected that the Gender of
the household head would have either a positive or a negative impact on the loan repayment
performance of the respondents. The hypothesis that gender of the household head does not
affect loan repayment will fail to be rejected if the beta (P) of GENDER is zero.
Number of livestock ow ned (TLU): This variable, was defined in terms of Tropical Livestock
Unit (TLU) and may serve as a proxy for the capacity to bear the risks of using credit for the
purchase of new technology such as fertilizer, it will also capture the wealth effect. Livestock
may also serve as a proxy for oxen ownership, which is important for farm operations. It is
expected that this variable would have a positive influence on the loan repayment performance.
The hypothesis that the number of livestock owned does not affect loan repayment will fail to be
rejected if the beta (P) of TLU is zero.
Education level (EDU): This is a dummy variable, which takes a value of 1 if the household
head is literate and 0 if illiterate. If the farmers can read and write, they increase their ability to
obtain, process, and use information. For example, literate farmers may seek information on
prices more than the illiterates ones and consequently, will be able to sell their produce at
reasonable prices. Moreover, education may enable farmers to be more aware of the importance
of formal loans and hence may reduce willful default. Therefore, all things being equal.
40

education is expected to reduce the rate of loan default. The hypothesis that the education level
does not affect loan repayment will fail to be rejected if the beta (P) of EDU is zero.
Experience in formal credit use (EXPCREDIT): this is the number o f years during which he
respondents have borrowed from formal credit institutions. Farmers, who have experience in
formal credit use, develop a reputation for creditworthiness and become trusted clients of micro
finance institutions, therefore, they are more likely to pay their debt on the due date, as opposed
to the inexperienced farmers. The hypothesis that experience in formal credit use does not affects
loan repayment will fail to be rejected if the beta (P) of EXPCREDIT is zero.
Family size (FAMSIZE): Refers to the number of people who eat from the same source/pot.
The larger the family size, the more the labor force available for production purpose. Therefore,
there is the possibility o f having more alternative sources o f income to overcome credit risks
(Schereiner & Nagarajan, 1997). Based on this assumption, families with sufficient labor-force
would be expected to have a low probability of defaulting. On the other hand, large family size
may imply insufficiency in terms of food consumption because; large households consume more
than do small households. This is usually true if the dependency ratio o f the household is large.
Therefore, the effect of family size, on formal loan repayment capacity may be indeterminate a
priori. The hypothesis that family size does not affect loan repayment will fail to be rejected if
the beta (P) of FAMSIZE is zero.
Off-farm activities (OFF-FARM): This is a dummy variable, which takes a value of 1 if any
member of the household was involved in off-farm activities and 0, if not. Off-farm activities
generate additional sources of income for smallholder farmers. The cash generated from these
activities would back up the farmers’ income and enable them to settle debt even during bad
harvesting seasons when the repayment period coincides with low agricultural prices. Hence,
41
households involved in off-farm activities tend to be more capable o f repaying loans in time.
Therefore, off-farm income is hypothesized to have positive impact on loan repayment rate. The
hypothesis that an off-farm activity does not affect loan repayment will fail to be rejected if the
beta (P) of OFF-FARM is zero.
Land holding (LANDSIZE): Refers to the total farm size (in hectares) owned by the family. A
farmer with more hectares of land is expected to be better off in terms o f loan repayment
performance. This is because, if augmented with other factors o f production, large farm size will
give higher production that will enable the borrower to repay his/her loan. Therefore, this
variable is expected to have a positive relation with the dependent variable. The hypothesis that
land holding does not affect loan repayment will fail to be rejected if the beta (P) of LANDSIZE
is zero.
Animal disease and crop failure (PROLOSS): This is a dummy variable, which takes a value
of 1 if there is animal disease or crop failure as happened in the 2008/2009 production year and
0, otherwise. The farmer’s crop loss or animal loss leads to a reduction of the total income
generated from agriculture. Therefore, animal disease and crop failure are expected to reduce a
borrowers' capacity to repay their loans in time. The hypothesis that animal disease and crop
failure do not affect loan repayment will fail to be rejected if the beta (P) of PORLOSS is zero.
Borrowed from informal sources (INFORCRED): This is a dummy variable which takes the
value of 1 if the farmer received a loan from an informal source such as relatives, shopkeepers
and other money-lenders, and 0, if not. A household receiving a loan from informal sources
would tend to be a defaulter of the formal institution as compared to those households which, do
not borrow from informal services. The hypothesis that borrowing from informal sources does
not affects loan repayment will fail to be rejected if the beta (p) of INFORCRED is zero.
42

Distance from credit source (DISCRESOU): This is measured by the time that it takes the
household to reach the credit source. Borrowers residing near the lending institution have a
location advantage and can contact the lender more easily and frequently than those who live in
more distant locations. Therefore, location advantage is expected to increase the loan repayment
performance. This variable is measured in terms o f the walking time required to travel from the
respondent's residence to the lending institution. The hypothesis that distance from credit source
does not affect loan repayment will fail to be rejected if the beta (P) of DISCRESOU is zero.
Celebration of social ceremonies (SOCCEREM): These are ceremonies celebrated
occasionally and include weddings, funeral ceremonies, engagement, circumcision, Iddir/Iqqub
and others. The expenses incurred during these ceremonies are sometimes large, relative to the
borrowers' economic status. If a person has celebrated one or more o f these, celebrations o f
social ceremonies takes a value of 1, and zero if they have not taken part in a social celebration.
As this variable can be a proxy for the use of income for non productive purposes, it is expected
to have a negative impact on the loan repayment performance. The hypothesis that celebration of
social ceremonies does not affect loan repayment will fail to be rejected if the beta (P) o f
SOCCEREM is zero.
Contact w ith development agents (NUMTEASS): This is the number o f days per month that a
farmer contacts a development agent for technical guidance. The higher the linkage between
farmers and development agents, the more the information flow and the technological
(knowledge) transfer from the latter to the former. Farmers who have frequent contact with
extension workers are more likely to have up-to-date information on production technologies that
would help them to increase their production and productivity and thus generate better income.
Thus, those farmers who have frequent contacts with development agents are likely to settle their
43

debts on a more timely basis, as opposed to those who have non or few contacts. The hypothesis
that contact with development agents does not affect loan repayment will fail to be rejected if
beta (P) of NUMTEASS is zero.
Ratio of amount of loan received to income (LOANINCOM): This is the ratio of the amount
of loan received to the total income. High ratio means the farmer received a high loan relative to
their economic status. Thus, for farmers who have high ratio, we expect low repayment rates in
comparison to the low ratio of the amount of loan received to income. The hypothesis that ratio
of amount of loan received to income does not affect loan repayment will fail to be rejected if
beta (P) of LOANINCOM is zero.
3.7 Preparation of Variables in the Empirical Model
3.7.1 Multicollinearity Diagnosis
As already discussed, the two-limit Tobit model was used to identify the determinants of the loan
repayment performance in the study area. Prior to running the Tobit model, the hypothesized
explanatory variables were checked for the existence of multicollinearity. Multicollinearity
problem arises when at least one of the independent variables is perfect or is an exact linear
relationship of the other independent variable (Gujarati, 2003). The existence of multicollinearity
might cause the estimated regression coefficients to have the wrong signs and smaller t-ratios
that might lead to drawing the wrong conclusions. Therefore, it was important to check whether
serious problems of multicollinearity existed among and between the potential continuous and
discrete explanatory variables, of the model estimation.
The technique o f variance inflation factor (VIF) was employed to detect the problem of
multicollinearity for continuous explanatory variables (Chatterjee and Price, 1991). If Rr is the
square of the multiple correlation coefficient that results when one explanatory variable (x,) is
44

regressed against all the other explanatory variables, VIF= (1-R,2) '1. Likewise, contingency
coefficients were computed to check the existence o f multicollinearity problem for discrete
explanatory variables, which assumes a value between 0 and 1. The contingency coefficients are
computed as follows:
Where, C= Coefficient of contingency
X2 = Chi-square random variable and
N = total sample size.
Value of VIF greater than 10 is often taken as a signal for the existence of multicollinearity
problem in the model. Similarly, the decision rule for contingency coefficients is that if
contingency coefficients approach 1, there is a problem of association between the discrete
variables.
Tables 4 and 5 below present the results of the tests for multicollinearity in the variables.
Table 4 Variance inflation factor for continuous explanatory variables
Variables Variance inflation factor (VIF) Ri2TLU 2.29 0.563LANDSIZE 2.09 0.522FAMSIZE 1.71 0.415AGE 1.59 0.371
EXPCREDIT 1.51 0.338
NUMTECASS 1.49 0.329
LOANINCOM 1.28 0.219
DISCRESOU 1.14 0.123
Source: Computed from survey data
45

Table 5 Contingency coefficients for discrete explanatory variables
AGRO
ECO
GEN
DER
OFFAR
M
INFOC
RED
MEME
XTE EDU
SOCCE
REM
PROL
OSS
AGRO-ECO 1.000 0.086 0.114 0.000 0.038 0.108 0.089 0.144
GENDER 1.000 0.083 0.181 0.024 0.243 0.123 0.009
OFF-FARM 1.000 0.068 0.063 0.215 0.224 0.349
INFOCRED 1.000 0.017 0.053 0.119 0.141
MEMEXTE 1.000 0.187 0.023 0.036
EDU 1.000 0.325 0.305
SOCCEREM 1.000 0.464
PROLOSS 1.000
Source: Computed from survey data
Based on the VIF and contingency coefficient results, the data were found to have no serious
problem of multicollinearity and therefore the continuous and discrete explanatory variables
were retained in the model.
3.7.2 Assessing the Goodness of Fit and Heterosccdasticity
The goodness of fit determines the accuracy with which a model approximates the coefficients of
the respective variable. Likelihood Ratio (LR) Chi-Square test shows that at least one of the
predictors' regression coefficients is not equal to zero. The chi square o f the regression model is
150.31 which is significant at less than 1 percent level of probability.
One of the assumptions in regression analysis is that the errors. Uj have a common (constant)
variance a 2. If the errors do not have a constant variance we say they are heteroscedastic
(Maddala, 1992). Though the estimated parameters of a regression in which heterosecadesicity is
present are consistent, they are inefficient. The Breuch-Bagan (BP) test has shown no
heteroscedasticity problem in the model.
46

CHAPTER FOUR: RESULTS AND DISCUSSION
This chapter presents the results from the descriptive and econometric analyses. The descriptive
analysis made use of such tools as mean, percentage, standard deviation and frequency
distribution. In addition, the t- and Chi-square statistics were employed to compare defaulters
with the non-defaulters group with respect to some explanatory variables. Econometric analysis
was carried out to identify the most important factors that affect the loan repayment performance
and to measure the relative importance of significant explanatory variables on loan repayment.
4.1. A Comparison of Characteristics of Defaulters and Non-Defaulters in East Hararghc
4.1.1. Socio-economic and Institutional Characteristics Among Defaulters and Non
Defaulters
Table 6 presents a summary of socio-economic and institutional factors (continuous variables)
among defaulter and non defaulter for all the respondents. The hypothesis that socio-economic
and institutional characteristics between defaulters and non defaulters are similar was rejected in
only some cases, when t calculated3was greater than t critical, as presented in Table 6 below.
X i - X 2
SX\ -X}
Where,
Sx i -Xj
47

Table 6 Socio-economic and institutional characteristics among defaulters and non defaulters for the entire respondent (continuous
variables)
Defaulter Non defaulter
t. value p. value Test decision
Total sample
Characteristics N=100 N=40 N=140
Mean sta. dev Mean sta.dev Mean sta. dev
Age 36.81 8.44 36.43 10.60 0.23 0.82 Fail to reject 36.70 9.07
Experience Credit 3.05 1.75 4.05 2.12 -2.87 0.00 Reject 3.34 1.91
Family size 6.04 1.94 5.58 2.21 1.20 0.21 Fail to reject 5.91 2.00
Ceremony expense 880.80 1857.73 633.75 2199.17 0.67 0.50 Fail to reject 810.21 1956.41
Distance from credit 86.18 43.74 38.83 28.40 6.33 0.00 Reject 72.65 45.28
Contact with 1.04 1.30 2.23 2.09 -4.04 0.00 Reject 1.38 1.65
development agent
Amount received 1758.00 899.18 1627.50 818.69 0.80 0.43 Fail to reject 1720.71 876.02
TLU 2.10 1.82 3.56 3.10 -3.46 0.00 Reject 2.52 2.34
Total income 9596.35 6712.57 16616.05 11843.83 -4.42 0.00 Reject 11601.98 9032.11
Total land size 1.10 0.42 1.64 1.52 -3.27 0.00 Reject 1.25 0.91
Source: Computed from the survey data
48

Only five different prevailing institutional and socio-economic platforms considered between
defaulters and non defaulters were found to be significant. These were experience with credit,
distance from credit, and contact with development agents, tropical livestock unit, total income
and total land size, at 5 percent level of significance. Those found not to be significant were age,
family size, ceremony expenditure and amount of loan received.
On average, the formal credit experience of the household heads for all the respondents was 3.34
years, while independently average years of formal credit experience; were 3.05 and 4.05 years
for defaulters and non defaulter respectively. The results indicate a significant difference between
the average formal credit experiences of the two groups at less than 1 percent level of probability.
This indicates that the farmers who had more experience with formal credit were more likely to
repay their loans than, those with less credit experience.
Land is by far the most important resource in agriculture. The fertility status, location and other
attributes of land, in association with its size, made it a binding resource in agriculture. A farmer
with more hectares of land is better off in loan repayment performance. As witnessed by the
survey results, the mean land size of defaulters and non-defaulters was found to be 1.52 hectares
and 1.10 hectares, respectively. Moreover there was a significant difference between the two
means at 1 percent level of significance.
Farmers in the study area took part in crop and livestock production activities, and about. 85.7
percent of the total respondents owned livestock, with varied sizes in the holdings. Livestock was
kept for various economic and social reasons in the study area. The major economic reasons
included the provision or supply of draught power, income generation, food, and animal dung (as
an organic fertilizer and fuel). Based on Storck el al. (1991) standard conversion factors, the
livestock population number was converted into Tropical Livestock Unit (TLU), to facilitate
49

comparison between the two groups. On the average, a household had 2.52 TLU with standard
deviation of 2.34 (Table 6). The minimum unit o f livestock kept was 0.026 TLU whereas the
maximum was 12.31 TLU. Non-defaulters owned a larger number of livestock (on average 3.10
TLU) compared to the defaulters (on average 2.10 TLU) with mean difference significant at 1
percent significant level.
Livestock production, crop production and off-farm activities were important income sources for
the sampled borrowers. The average revenue earned by a borrower, from these activities, during
the production period 2008/2009 was 11601.98 Birr. Non-defaulters reaped more cash from
crops, livestock and off farm activities (11843.83 Birr) than defaulters (9596.35 Birr). The
difference between the mean of the two groups was significant at less than 1 percent probability
level.
The distance in minutes that the beneficiaries traveled on foot to get to a credit source was
assessed. Farmers living near lending institution have a location advantage and can contact the
lender more easily and frequently than those who live in more distant locations. In line with this,
the average time required to reach lending institutions were 38.83 minutes for non-defaulters and
86.18 minutes for defaulters. The mean difference between the distances covered by non
defaulters and defaulters was statistically significant at less one percent level of probability.
Table 7 presents a summary of the socio-economic and institutional factors (discrete variables)
among the defaulter and non-defaulter groups for all respondents.
50

1 able 7 Socio-economic and institutional characteristics among defaulters and non defaulters forall respondents (discrete variables)
Defaulters Non-Defaulters x2- TotalCharacteristics No. Percent No. Percent value No. Percent
GenderMeal 56.00 56.00 22.00 55.00 78.00 55.71
Female 44.00 44.00 18.00 45.00 0.01 62.00 44.29Off farm income
No 62.00 62.00 10.00 25.00 72.00 51.43Yes 38.00 38.00 30.00 75.00 15.65 68.00 48.57
Crop and livestock diseaseNo 22.00 22.00 36.00 90.00 58.00 41.43Yes 78.00 78.00 4.00 10.00 54.45 82.00 58.57
Received loan from informalsector
No 64.00 64.00 26.00 65.00 90.00 64.29yes 36.00 36.00 14.00 35.00 0.01 50.00 35.71
Members of extension packageNo 17.00 17.00 7.00 17.50 24.00 17.14Yes 83.00 83.00 33.00 82.50 0.01 116.00 82.86
Any social ceremoniesNo 20.00 20.00 30.00 75.00 50.00 35.71Yes 80.00 80.00 10.00 25.00 37.64 90.00 64.29
Education LevelIlliterate 77.00 77.00 20.00 50.00 97.00 69.29Literate 23.00 23.00 20.00 50.00 9.79 43.00 30.71
Opinion on group liabilityVery good 6 6.00 1 2.50 7 5.00
Good 9 9.00 4 10.00 3.276 13 55.71
Fair 26 26.00 16 40.00 42 9.28
Bad 59 59.00 19 47.50 78 30.00
Source: Computed from the survey data
The results revealed that off farm income, crop and livestock disease, social ceremonies and
education level had a systematic relationship with loan repayment at less than 5 percent level of
probability, while, other variable such as gender, informal credit and membership of extension
packages did not have a significant relationship with the defaulter and non defaulter groups.
51

Education is thought to be a very important determining factor in loan repayment. An educated
farmer is able to use modem agricultural technologies, perform farming activities based on a
cropping calendar, and manage their resources properly. All these factors boost production,
which improves loan repayment. The results indicate that, 30.71 percent o f the sampled
household heads were is literate, with about 50 percent being from the non-defaulter category,
and 23 percent from the defaulter group. The average grade attained for non-defaulter and
defaulter household heads were 3.15 and 0.89 grades respectively. Thus, there is a significant
difference between non-defaulter and defaulter households with regard to education level at less
than one percent level of probability.
Expenditure on social festivals such as weddings, circumcision, funeral o f a family member or
close relative and engagement was also described. The analysis indicated that of the total
respondents, 64.29 percent reported that they had celebrated one or more of the occasional
ceremonies .while 35.71 percent stated that they did not celebrate any ceremonies them during
2008. Meanwhile, 25 percent of non-defaulters and 80 percent of defaulters reported that they
had celebrated one or more of these ceremonies. The minimum and maximum expenditures for
such ceremonies were Birr 100 and Birr 14000, respectively. Chi square tests indicated that there
is a significant association between loan repayment and social festival at less than one percent
level o f significance.
Of the total respondents, 58.57 percent reported crop failure and livestock disease incidences in
the 2008/2009 production year. Meanwhile, 10 percent of non-defaulters and 78 percent of
defaulters reported that they had experienced crop and livestock losses because of bad
environment, diseases, insects and other pests. This indicates that crop failure and livestock
disease affect loan repayment negatively because they affect the total income generated from
52

agriculture. The minimum and maximum loss for such crop failure and animal diseases were Birr
150 and Birr 20000, respectively. The Chi-square test indicated a systematic association between
loan repayment and crop and livestock disease at less than 1 percent level o f probability.
About 48.57 percent of the sampled household heads reported that at least one of their family
members was engaged in off-farm activities, which helped them to earn additional income. The
survey results also indicated that a larger proportion of the non-defaulter households (75.00
percent) engaged in off-farm activities as compared to the defaulter households (38.00 percent).
The Chi-square test indicated a systematic association between loan repayment and off-farm
activity at one percent level o f significance.
The survey results also revealed that majority of the defaulters (59 percent) and non-defaulters
(47.50 percent) were dissatisfied with group formation procedures and group liability. The
reasons mentioned by the respondents, is that group formation is not based on self selection .
that there is low communication among group members. lowr responsibility for loan repayment,
low confidence and low trust among members. These problems might have a negative effect on
the loan repayment performance.
4.1.2. Socio-economic and Institutional Characteristics among Defaulters and Non
Defaulters in Babilc District
Table 8 presents the socio-economic and institutional characteristics inherent among defaulters
and non defaulters in Babile district. The hypothesis that socio-economic and institutional
characteristics between defaulters and non defaulters are similar was rejected in only some cases,
when t calculated greater than t critical as presented in Table 8.
53

Tabic 8 Socio-econom ic and institutional characteristics among defaulters and non defaulters in Babile district (continuous variables)
Defaulter Non defaulter
t. value p. value Testdecision
Total sample
Characteristics N=52 N=18 N -70
Mean sta. dev Mean sta.dev Mean sta. devAge 36.65 9.79 38.17 14.30 -0.50 0.62 Fail to reject 37.04 11.03
Experience Credit 2.77 1.78 5.56 2.01 -5.54 0.00 Reject 3.49 2.20
Family size 5.96 2.01 5.94 2.65 0.03 0.98 Fail to reject 5.96 2.17
Ceremony expense 558.08 611.99 1155.56 3221.84 -1.29 0.20 Fail to reject 711.71 1703.95
Distance from credit 93.46 47.27 38.33 29.26 4.64 0.00 Reject 79.29 49.51
Contact with 1.94 1.23 3.83 1.38 -5.45 0.00 Reject 2.43 1.51
development agent
Amount received 1759.62 587.87 1694.44 755.74 0.38 0.71 Fail to reject 1742.86 630.06
Tropical livestock 2.03 2.09 5.48 3.55 -4.97 0.00 Reject 2.92 2.94
Total income 9110.19 6625.58 22415.56 10779.34 -6.18 0.00 Reject 12531.57 9766.32
Total land size 1.23 0.45 2.44 1.89 -4.37 0.00 Reject 1.54 1.14
Source. Computed from the survey data
54

The results indicate that on one hand there was a significant mean different between defaulter
and non defaulters with respect to: experience in credit use, distance from credit source, contact
with development agent, total annual income, total land size and tropical livestock unit. On the
other hand, age family size, social ceremony expenditure and amount of loan received were not
significantly different between defaulters and non-defaulters.
The results of the survey indicate that the average land size for non defaulters was 2.44 hectares
and 1.23 hectares, for defaulters. On average, 1.94 and 3.83 of defaulters and non defaulters,
respectively, had contact with extension agents each month. This implies that non defaulters had
larger land size and more contact with extension agents, compared to the defaulter. The t-test
indicated that there was significant different among the two categories at less than one percent
level o f probability.
Experience of credit use among non defaulters was significantly higher than that of defaulters.
On average, non defaulters had 5.56 years experience o f credit use, in 2008/2009, while
defaulters had only 2.77 years. The t-test indicated that there was significant different among the
two categories at less than one percent level of probability.
As indicated in Table 8, the distance from a credit source is negatively correlated with the loan
repayment rate, this survey result is in full agreement with the hypothesis. The mean distance
was significantly different at less than one percent probability level among defaulters and non
defaulters.
On average, non defaulters had relatively large units of livestock. The average livestock units
were found to be 3.55 and 2.03 TLU for non defaulters and defaulters respectively. There is a
significant difference between these two means at 1 percent level of significance. Average annual
income of the defaulters and non defaulters was 9110.19 birr, and 22415.56 birr respectively.
55

The group statistics also indicated that there is a significant difference in the average annual
income of the household between the defaulters and non defaulter’s household groups at less
than one percent level of probability.
Table 9 presents a summary of the socio-economic and institutional factors (discrete variables)
among defaulters and non defaulters in Babile district.
Table 9 Socio-economic and institutional characteristics among defaulters and non defaulters in
Babile district (discrete variables)
Defaulters Non-Defaulters x 2- Total
CharacteristicsNo. Percent No. Percent value No. Percent
GenderMeal 31 59.62 11 61.11
0.01242 60.00
Female 21 40.38 7 38.89 28 40.00Off farm income
No 35 67.31 5 27.788.532
40 57.14Yes 17 32.69 13 72.22 30 42.86
crop and livestock disease No 16 30.77 18 100.00
25.65634 48.57
Yes 36 69.23 0 0.00 36 51.43Received loan from informal sector
No 35 67.31 14 77.78
0.698
49 70.00
yes 17 32.69 4 22.22 21 30.00Members of extension package
No 12 23.08 1 5.562.715
13 18.57
Yes 40 76.92 17 94.44 57 81.43Any social ceremonies
No 14 26.92 14 77.7814.409
28 40.00
Yes 38 73.08 4 22.22 42 60.00Education Level
Illiterate 38 73.08 7 38.896.807
45 64.29
Literate 14 26.92 11 61.11 25 35.71
Source. Computed from the survey data
56
The result revealed that off farm income, crop and live stock diseases, social ceremonies and
education level had a significant systematic relationship with loan repayment at less than 5
percent level o f probability. However, other variable such as gender, informal credit and
membership of extension package did not have a significant systematic relationship between
defaulters and non defaulters.
The result of the survey indicated that 26.92 percent of farmers in the defaulter group and 61.11
percent of sample farmers in the non defaulter category were literate. Whereas, around 73.08 and
38.89 percent o f the sample farmers in the defaulter and non defaulter category respectively was
illiterate, the Chi-squarc test indicated that the systematic association between loan repayment
and education level of household head was significant at less than one percent level of
probability.
Most o f the non-defaulters had off farm income while 67.31 percent of the defaulters did not
have another source of income apart from farming. This reveals a positive relationship between
off-farm income and loan repayment; indeed, the Chi-square test also indicated that the
systematic relationship between loan repayment and off-farm income of household was
significant at less than one percent level of probability.
The Chi-square test indicated that the systematic relationship between loan repayment and
members of extension package was significant at less than one percent level of probability, that
is, 76.92 and 94.44 percent of defaulters and non defaulters were members o f extension
packages.
Sixty-nine and zero percent of the defaulters and non-defaulters respectively, had livestock and
crop loss in 2008/2009 production years because of different reason such as bad weather and
different animal and crop diseases. O f the total respondents in this district, 73.08 percent
57

reported that they had celebrated one, or more, occasional ceremonies and, 22.22 percent stated
that they had not celebrated any ceremony, during the study period. Meanwhile, 25 percent of
non-defaulters and 80 percent of defaulters reported that they had celebrated one or more of
these ceremonies. This implies that the farmers spent a lot o f money for unproductive purpose
and this affected loan repayment negatively. The chi-square test also indicates that the above two
factors have systematic relationship with loan repayment at less than one percent level of
probability.
4.1.3. Socio-economic and Institutional Characteristics among Defaulters and Non
Defaulters in Combolcha District
Table 10 presents a summary of the socio-economic and institution characteristics (continuous
variable) among defaulters and non defaulters in Combolcha district. The hypothesis that socio
economic and institutional characteristics between defaulters and non defaulters is rejected in
only some cases, when t calculated greater than t critical, as presented in fable 10.
58

\
S l U t f i i i 1 1 1 1 1 1 U 5 5
*♦
i
I

The results indicate on one hand, that, there is a significant mean difference only between
distance from credit source and contact with development agents, between defaulters and non
defaulters. On the other hand, education, experience credit use age family size, social ceremony
expenditure total annual income, tropical livestock unit and amount of loan received were not
significantly different between defaulters and non defaulters.
The survey results indicate that the average time required to reach lending institutions were
39.23 minutes for non-defaulter and 78.29 minutes for defaulters. The mean difference between
the distances covered by non-defaulters and defaulters was statistically significant at less than
one percent level o f probability.
Six and 27.27 percent of the defaulters and non defaulters, respectively, had contact with
extension agents. That means that on average, a defaulter was contacted over 0.06 days per
month, while, a non defaulter was contacted over 0.91 days. The difference in significance is at 1
percent.
Table 11 presents a summary of the socio-economic and institutional factors (discrete variables)
among defaulters and non-defaulters.
60
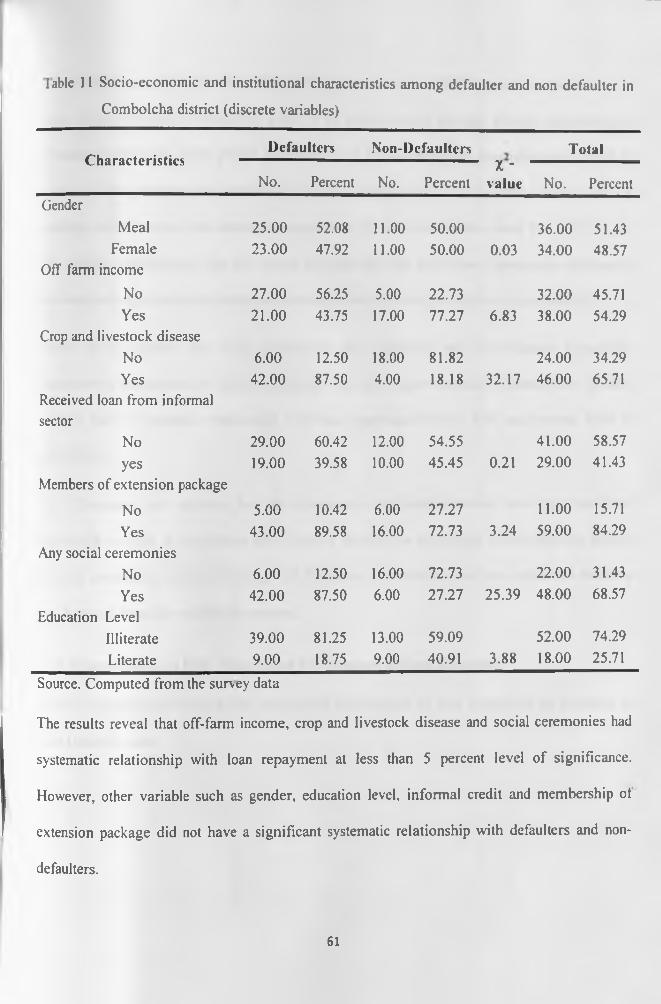
I able 11 Socio-economic and institutional characteristics among defaulter and non defaulter in
Combolcha district (discrete variables)
CharacteristicsDefaulters Non-Defaulters Total
No. Percent No. Percent
i x -value No. Percent
GenderMeal 25.00 52.08 11.00 50.00 36.00 51.43
Female 23.00 47.92 11.00 50.00 0.03 34.00 48.57Off farm income
No 27.00 56.25 5.00 22.73 32.00 45.71Yes 21.00 43.75 17.00 77.27 6.83 38.00 54.29
Crop and livestock diseaseNo 6.00 12.50 18.00 81.82 24.00 34.29Yes 42.00 87.50 4.00 18.18 32.17 46.00 65.71
Received loan from informal sector
No 29.00 60.42 12.00 54.55 41.00 58.57yes 19.00 39.58 10.00 45.45 0.21 29.00 41.43
Members of extension package
No 5.00 10.42 6.00 27.27 11.00 15.71Yes 43.00 89.58 16.00 72.73 3.24 59.00 84.29
Any social ceremoniesNo 6.00 12.50 16.00 72.73 22.00 31.43Yes 42.00 87.50 6.00 27.27 25.39 48.00 68.57
Education LevelIlliterate 39.00 81.25 13.00 59.09 52.00 74.29
Literate 9.00 18.75 9.00 40.91 3.88 18.00 25.71
Source. Computed from the survey data
The results reveal that off-farm income, crop and livestock disease and social ceremonies had
systematic relationship with loan repayment at less than 5 percent level of significance.
However, other variable such as gender, education level, informal credit and membership ot
extension package did not have a significant systematic relationship with defaulters and non-
defaulters.
61

Of the total respondents in this district, 68.57 percent reported that they had celebrated one or
more of the occasional ceremonies, while 31.43 percent stated that they had not celebrated any
ceremony during the study period. Meanwhile, 27.27 percent of the non-defaulters and 87.50
percent of the defaulters reported that they had celebrated one or more of the ceremonies. On
average, defaulters and non-defaulters expenditure for such ceremonies were Birr 1230.42 and
Birr 206.82, respectively. The Chi square test indicates that there was a systematic relationship
between loan repayment and social ceremonies at less than one percent level of probability.
About 43.75 percent and 77.27 percent of the defaulters and non-defaulter households
respectively, participated in off-farm activity. The chi- square test also indicates that off-farm
activity had a systematic relationship with loan repayment at less than one percent level of
probability.
The Chi-square test indicated that the systematic relationship between loan repayment and
household loss due to crop failure and livestock disease was significant at less than one percent
level of probability, that is, 42.00 and 18.18 percent of defaulters and non defaulters had crop
and livestock loss due to different reasons.
4.2. Determinants of Loan Repayment Performance in East Hararghe
Table 12 presents the result of the analysis of determinants o f loan repayment performance in
East Hararghe zone.
62

Table 12 Two-limit Tobit Model estimates and marginal effect of factors influence rate repayment and probability of being Nondefaulter for all the respondents
Variable Coef. Std.E rr. t P>t Test Decision
Probability Being Non Defaulters
Conditional on Being Uncensored
UnconditionalExpected
ValueAGRO-ECO 0.1633 0.0626 2.6100 0.0100 Reject 0.2273 0.0924 0.1269AGE -0.0024 0.0030 -0.7900 0.4310 Fail to reject 0.0033 0.0013 0.0019GENDER 0.0507 0.0431 1.1800 0.2420 Fail to reject 0.0704 0.0289 0.0399EXPCREDIT 0.0249 0.0136 1.8200 0.0700 Fail to reject 0.0350 0.0141 0.0195FAMSIZE -0.0127 0.0136 -0.9300 0.3520 Fail to reject 0.0179 0.0072 0.0100OFF-FARM 0.0982 0.0468 2.1000 0.0380 Reject 0.1382 0.0553 0.0765PROLOSS -0.2388 0.0513 -4.6500 0.0000 Reject 0.3504 0.1289 0.1771rNFOCRED -0.0919 0.0428 -2.1500 0.0340 Reject 0.1225 0.0536 0.0734MEMEXTE -0.0233 0.0573 -0.4100 0.6850 Fail to reject 0.0336 0.0129 0.0180DISCRESOU -0.0001 0.0002 -0.5300 0.5980 Fail to reject 0.0002 0.0001 0.0001SOCCEREM -0.1412 0.0570 -2.4800 0.0150 Reject 0.2110 0.0760 0.1058NUMTEASS 0.0587 0.0258 2.2700 0.0250 Reject 0.0825 0.0332 0.0459TLU -0.0036 0.0145 -0.2500 0.8060 Fail to reject 0.0050 0.0020 0.0028LOANINCO -0.4222 0.1538 -2.7400 0.0070 Reject 0.5936 0.2386 0.3305LANSIZ 0.0808 0.0638 1.2700 0.2080 Fail to reject 0.1136 0.0456 0.0632EDU -0.0132 0.0543 -0.2400 0.8080 Fail to reject 0.0184 0.0075 0.0104
cons 0.9730 0.1563 6.2200 0.0000Number of obs 140LR chi2( 16) 150.31
Prob > chi2 0.0000Pseudo R2 0.8437Log likelihood -13.9264
Source. Computed from the survey data
63
The two limit Tobit result reveals that a total of 16 explanatory variables were considered in the
econometric model out of which, 7 variables were found to significantly influence the probability
of being non-defaulter and the intensity of loan recovery among the farm households of the
entire sample. The log likelihood estimates of the Tobit regression model indicate that agro
ecological zone (AGRO-ECO), off-farm activity (OFFFARM), production loss (PROLOSS),
informal credit (INFOCRED), celebration of social ceremonies (SOCCEREM), number of
contact days of the farm household head with extension agents (NUMTEASS) and loan income
ratio (LOANINCO) were important factors, influencing the loan repayment performance of
small holder farmers in the study area.
Agro ecological difference (AGRO-ECO) was one of the factors, which significantly influenced
the loan repayment performance of the farmers. In this case, study area agro ecological zone was
categorized according to lowlands (Babile) and highlands (Combolcha). The econometric model
result revealed that residing in an adequate rainfall agro-ecological area increased the probability
of being a non-defaulter by 22.73 percent and increased the rate of repayment on average by
12.69 percent for the entire sample o f respondents. The reason behind this is that, farmers in
good rainfall areas have the opportunity of growing different crops that would help them derive a
good income from these activities and diversify their income earning portfolio, thereby enabling
them to pay the loans they borrowed, more than farmers living in moisture deficit areas.
Getting income from off-farm activities (OFF-FARM) is another economic factor that positively
and significantly affected the loan repayment performance of smallholder farmers. This might be
due to the fact that, off-farm activities were additional sources of income for smallholders and
the cash generated from these activities could back up the farmers' income to settle their debt
even during bad harvest seasons and when the repayment period coincided with low agricultural
64

prices. Farmers' participation in off-farm activity increases the probability o f being non-defaulter
by 13.82 percent and on average, increases the rate of loan repayment by 7.65 percent for all
respondents. This result supports the hypothesis and complies with the results obtained in the
descriptive analysis. Similar results were also obtained by Chirwa (1997) and Bekele (2001) in
their studies on agricultural credit repayment in Malawi and Ethiopia, respectively.
The results of the Tobit model reveal that celebration of social ceremonies affected the loan
repayment performance negatively. The variable is significant at 5 percent probability level. The
possible explanation is that, celebration of one or more of such social ceremonies require more
material and financial resources, beyond what the borrowers could afford. This means that the
money which should have been used for repayment might have been used for the celebrations.
For a discrete change in dummy variable from 0 to 1, the loan recovery rate declines by 10.58
percent for all the respondents. In addition, the probability o f a borrower also being a defaulter
increases by 20.10 for all the respondents. Belay (1998) has also reported the negative effect of
this variable on loan repayment.
The number of contact days that the household head has with extension agents (NUM TEASS) is
another important institutional factor, which was positively related to the dependent variable
(significant at 5 percent level) for all the respondents. Each additional contact increases the
probability of being a non-defaulter by 8.25 percent. Each additional extension contact days
increases the rate of repayment by 4.59 percent for the entire sample. This implies that, farmers
with more access to technical assistance on agricultural activities were able to repay their loan as
promised, more than those who had less or no assistance at all. The reason for this is that,
farmers who have frequent contact with development agents are better informed about markets
and production technologies. As a result, they are motivated to repay their loans on time.
65

compared to those with less or no contact with extension agents. Similar result was also obtained
by Chirwa (1997), Belay (2002). Roslon and Karin (2009).
The results o f the robit model reveal that informal loans affected the loan repayment
performance negatively at less than 5 percent level of probability. A farmer who borrowed from
informal sources (INFOCRED) has a bearing on credit repayment to formal institutions since
such farmers prefer to settle loans from nearby lenders and relatives rather than those from
distant and non-traditional financial institutions. Therefore, informal borrowers would tend to be
defaulters of formal institution in comparison to those who do not borrow from informal
services. The marginal effect of the total sample indicates that if a borrower received a loan from
informal sources, the probability that they will default increases by 12.25 percent, and the loan
recovery rate decreases by 7.34 percent for all the sample observations.
Other factors affecting loan repayment performance negatively were production loss due to bad
weather, disease, and pests. Agriculture is widely considered as more risky than other business
activities. Thus, it is not surprising that agricultural lending projects have had poor repayment
performance. Weather, pests, diseases and other calamities affect crops and animal products,
sometimes substantially in extreme cases. In Combolcha and Babile districts specifically, frost,
crop disease and pest are serious causes of production loss. Thus, the farmers who had lost their
produce, due to the above reasons were less likely to repay their loans, compared to other
farmers. For a discrete change in a dummy variable from 0 to 1, the loan recovery rate declines
by 17.71 for the entire sample. In addition, the probability o f a borrower being a non defaulter
also decreases by 35.04 for all respondents. Bekele (2001) has also reported the negative effect
of this variable on loan repayment.
66

The coefficient o f loan income ratio was hypothesized to influence loan repayment performance
negatively. The results of the Tobit model also indicate that borrowers who had a high loan
income ratio had a poorer loan repayment performance. The possible explanation is that
borrowers, who had a higher ratio, received a high loan relative to their economic status, without
considering the annual income and production. Indirectly, this result reveals that the farmers who
had higher annual income from agriculture and off- farm activity were more likely to repay their
loan on time. For a unit increase in loan income ratio, loan recovery rate declines by 33.05
percent while the probability of non default decreases by 59.36 percent for all the respondents.
67

CHAPTURE FIVE: SUMMARY, CONCLUSIONS A M ) RECOMMENDATIONS
This chapter presents the summary, conclusions and policy implications o f the present study.
5.1. Summary
Ethiopia is an agricultural country and has employed more than 83.8 percent o f the total
population in the agricultural sector. Small farmers are numerically dominant, contributing over
95 percent of the annual production. Yet, this output cannot meet the food requirements of the
country's population, let alone serve the needs of farmers. There exists a variety o f reasons for
this problem; one of the reasons why rural households continue to exist in a vicious cycle of
poverty, for long periods is their lack of access to financial services. Limited access to financial
service is also aggravated by a poor loan repayment performance record. The increasing default
rate is one of the major problems facing lending institutions in the study area. Thus, the main
objective this study was to analyze which, how and how much the hypothesized explanatory
variables were related to the loan repayment performance of smallholder farmers.
The study was carried out in Babile and Combolcha district of East Hararghe Administrative
Zone during 2011. Multi stage sampling techniques were employed in the selection o f a total of
140 sample borrowers from both districts. Descriptive statistics and the two-limit Tobit model
were used to analyze the data collected from the sample respondents.
The descriptive statistics results indicated that about 71.43 percent of the sampled households
defaulted on the loans that they obtained. Of these, about 9 percent were complete defaulters and
the remaining 91 percent, repaid a certain amount of the proportion of the loan they had received.
In addition, the descriptive statistics results revealed that there were significant differences
between defaulters and non-defaulters in Babile district with respect to experience in credit use,
distance from credit source, total annual income, total land size. 1LU, off farm activity.
68

production loss and social ceremony. In Combolcha district, statistically significant differences
were also observed between defaulters and non-defaulters, with respect to the education level,
distance from credit source, and frequency of contact with extension agents, off farm activity,
production loss and social ceremony.
The two limit lobit model results indicate that among 16 explanatory variables, which it was
hypothesized, influence the loan repayment performance, seven variables were statistically
significant for all the respondent population at less than 5 percent level of probability.
Agro ecological zone, off-farm activity, frequency of contact with extension agents positively
and significantly influenced loan repayments while, production loss, informal credit, social
ceremonies, and loan income ratio negatively influenced the loan repayment performance of
small holder farmers in the study area.
5.2. Conclusions and Policy Recommendations
Based on the findings of the study and observation of the environment, in which the current loan
delivery and recovery systems are based, the following recommendations are forwarded.
> The number of contact days o f the farm household head with development agents is an
important institutional factor, which was positively related to loan repayment.
Development agents are a strong bridge between the smallholder farmers, and the
ministries and other development oriented organizations that render public service.
Integrated and participatory rural development strategies can achieve their target if
these development agents create strong social and cultural links with the people that
they are expected to assist. Therefore, organizing regular in-service and on-job
training, providing adequate incentives and remuneration as well as employing
69

adequate number o f development agents will be necessary conditions to change the
farmers’ attitude toward agricultural transformation, and timely settlement o f debt.
^ The results of the Tobit model revealed that the celebration of social ceremonies
affected loan repayment performance negatively. The customarily celebrated social
ceremonies need a great deal of investment beyond what farmers can afford and are
found to be one o f the major causes of delinquency in the payment of formal loans.
Therefore, concrete effort should be made by elders, community leaders, local
associations and religious organizations so as to minimize these traditional ceremonies
and mitigate the associated expenditure through time.
> The econometric results also indicated that farmers who engaged in off-farm activities
earned more income and were able to settle their debts in a more timely manner, than
those who were not engaged in off farm activities. This indicates that, rural
development strategies should not only emphasize on increasing agricultural
production but simultaneous attention should be given to promoting off-farm activities
in the rural areas.
> The survey results also revealed that majority of the respondents were dissatisfied w ith
group formation procedures and group liability. Therefore, formation of credit groups
through self-selection will help individual members to screen each other effectively.
Screening of potential borrowers by initially selecting those of their neighbors, friends
and relatives whom they believe to be capable o f repaying the loans will help to
minimize defaulting problems that emanate from the errors made during initial group
formation. Placing the responsibility of group formation on the people would enhance
70

group advantage on information symmetry that is not available in the emerging
microfinance set ups which fix members to groups.
> Lastly, fanners who were residents of adequate rainfall agro-climatic area had better
loan repayment performance than farmers who were residents of moisture deficit areas
(lowland). The agro-ecology of the area highly influenced agricultural production and
productivity of the farmers. Moisture availability is one of the factors that affect the
type and range of crops to be grown and livestock to be kept. Therefore, policies and
strategies geared towards the development and promotion of new technologies suitable
to moisture deficit areas should be given adequate emphasis in order to improve the
loan repayment capacity o f smallholder farmers living in those moisture deficient
zones.
71

REFERENCES
Abreham. (2002). Loan repayment and its determinants in small scale enterprises financing in Ethiopia, M.Sc. Thesis, Addis Ababa University, Ethiopia
Aja Okarie, (2004). Major Determinant of Agricultural Smallholder Loan Lepayment in Developing Economy: empirical evidence from Ondo state Nigeria, University o f Nigeria. 211:4, 223-234.
Amare Berhanu, (2005). Determinants of Formal Source of Credit Loan Repayment Performance of Smallholder Farmers: The Case of North Western Ethiopia, North Gondar. M.Sc. Thesis, Alemaya University, Ethiopia.
Ambes Tenaye, (2007). Impacts and Implications of Agricultural Credit Use on Gross Farm Income in Southern Ethiopia. M.Sc. Thesis, Norwegian University of Life Sciences. Norway
Amemiya, T., (1984). Tobit model: A Survey. Journal ofEconometrica. 24:3-63.
Anbes Tenaye,(2003) Patten of Credit Use and Its Impact Of Smallholder Farmers Income. MSc Thesis, Alemaya University, Ethiopia
Bekele Hundie, (2001). Factors Influencing the Loan Repayment Performance of Smallholders in Ethiopia. M.Sc.Thesis, Alemaya University, Ethiopia
Belay Abebe, (2002) Factors Influencing Loan Repayment of Rural Women in Eastern Ethiopia: The Case of Dire Dawa Area. M.Sc. Thesis, Alemaya University, Ethiopia.
Chang Y., (2005). Acess to consumer credit: impact on low vs high income group Phd Thesis, Fordham University, New York
Chatterjee, Samprite and Bertran Price 1991, Regression Analysis by Example, Second Edition. John Wiley and Sons Inc. New York
Chirwa E. Wadonda,(1997) Econometric Analysis of the Determinants o f Agricultural Credit Repayment in Malawi, African Review o f Money, Finance and Banking, No. 1-2,1997. pp. 107-123.
Christencer, G., 1993. The Limits to informal financial intermediation. World Development, 21(5): 721-731
Cochran, W. G. (1963). Sampling Techniques, 2nd Ed., New York: John Wiley and Sons, Inc.
CSA (Central Statistical Authority), (2010). Annual Report, Addis Ababa
Dejene Aredo, (1993). The Informal and Semi-Formal Financial Sectors in Ethiopia: A Study of the Iqqub, Iddir and Savings and Credit Cooperatives, Discussion Paper, AERC, Nairobi
72

REFERENCES
Abreham. (2002). Loan repayment and its determinants in small scale enterprises financing in Ethiopia, M.Sc. Thesis, Addis Ababa University, Ethiopia
Aja Okarie, (2004). Major Determinant of Agricultural Smallholder Loan Lepayment in Developing Economy: empirical evidence from Ondo state Nigeria, University o f Nigeria 211:4, 223-234.
Amare Berhanu, (2005). Determinants of Formal Source of Credit Loan Repayment Performance of Smallholder Farmers: The Case of North Western Ethiopia, North Gondar, M.Sc. Thesis, Alemaya University, Ethiopia.
Ambes Tenaye, (2007). Impacts and Implications of Agricultural Credit Use on Gross Farm Income in Southern Ethiopia. M.Sc. Thesis, Norwegian University of Life Sciences, Norway
Amemiya, T., (1984). Tobit model: A Survey. Journal o f Economelrica. 24:3-63.
Anbes Tenaye,(2003) Patten of Credit Use and Its Impact Of Smallholder Farmers Income. MScThesis, Alemaya University, Ethiopia
Bekele Hundie, (2001). Factors Influencing the Loan Repayment Performance of Smallholders in Ethiopia. M.Sc. Thesis, Alemaya University, Ethiopia
Belay Abebe, (2002) Factors Influencing Loan Repayment of Rural Women in Eastern Ethiopia: The Case o f Dire Dawa Area, M.Sc. Thesis, Alemaya University, Ethiopia.
Chang Y., (2005). Acess to consumer credit: impact on low vs high income group Phd Thesis, Fordham University, New York
Chatterjee, Samprite and Bertran Price 1991, Regression Analysis by Example, Second Edition. John Wiley and Sons Inc. New York
Chirwa E. Wadonda,(1997) Econometric Analysis of the Determinants o f Agricultural Credit Repayment in Malawi, African Review o f Money, Finance and Banking, No.1-2,1997. pp. 107-123.
Christencer, G., 1993. The Limits to informal financial intermediation. World Development, 21(5): 721-731
Cochran, W. G. (1963). Sampling Techniques, 2nd Ed., New York: John Wiley and Sons, Inc.
CSA (Central Statistical Authority), (2010), Annual Report, Addis Ababa
Dejene Aredo, (1993). The Informal and Semi-Formal Financial Sectors in Ethiopia: A Study of the Iqqub, Iddir and Savings and Credit Cooperatives, Discussion Paper, AERC, Nairobi
72

Dejene Aredo, (1999). Informal Credit and Insurance Markets in Developing Countries: A Preliminary Survey of the Literature. Working paper. Addis Ababa
Dey, J., (1980). Gambian Women: Unequal partners in Price Development Projects. Journal o f Development Studies 17(3): 109-122
Dorward A. R. And S. W. Omamo, (2009). A Framework for Analyzing Institutions. In Dorward A. R. And S. W. Omamo (Eds.) Institutional Economics Perspectives on African Agricultural Development (75-110). International Food Policy Research Institute, Washington, D.C.
Fantahun Melles, (2000). Informal Financial Institutions: Impact Analysis of ACORD's Credit Intervention through Iddirs in Dire Dawa. M.Sc. Thesis, Addis Ababa University, Ethiopia.
Getachew Diriba. (1995). Economy at the Cross Roads: Famine and Food Security in Rural Ethiopia. Working Paper, Addis Ababa, Ethiopia.
Getachew Olana. (1993). “Farmers' Response to New Coffee Development Technologies and Factors Influencing it: The Case of Small Farmers in Gimbi CIPA, Wollega." M.Sc. Thesis, Alemaya University of Agriculture, Ethiopia.
Getaneh Gobezie, (2005a). Livelihoods through Micro-enterprise Services; Assessing Supply and Demand Constraints for Microfinance in Ethiopia (With Particular Reference to the Amhara Region); Paper Presented at the 3rd International Conference on the Ethiopian Economy, Organized by the Ethiopian Economic Association June 2-4. 2005. Addis Ababa, Ethiopia.
Goodwin,B.K., (1992). An analysis o f factors associated with consumers’ use o f grocery coupons. Journal o f Agricultural and Resource Economics. 17:110-120.
Greene, W.H. (2000). Econometric Analysis. Fourth Edition. Pretice Hall International, Inc.New York.
Greenwal, D. and Associates, (19S3).The Concise McGraw-Hill Dictionary o f Modern Economics. New' York, USA.
GebreYohannes, Worku, (2000). Microfinance Development in Ethiopia. A Paper Presented at the International Conference on the Development o f Microfinance in Ethiopia: Achievements, Problems and Prospects, Bahir Dar, Ethiopia.
Hanke, S.H. and A.A.Walters, (1991). Financial and Capital Markets in Developing Countries. CA: ICS Press San Francisco.
IFAD (International Fund for Agricultural Development), (2001). Federal Democratic Republic o f Ethiopia Rural Financial Intermediation Program. , Report No. 1241 -ET.
Johnston, J. And J.Dinardo, (1997). Econometrics Methods. Fourth Edition. The McGraw-Hill Companies, Inc, New York.
73

Joseph P. and M. Townsend (2009). The Impact of Credit on Village Economies. Thailand. MIT Department o f Economics Working Paper No 09-13. Thailand
Kuhn M.E. and Darroch M.A.G. (1999). Factors affecting rural medium-term loan repayment: Evidence from a South African development finance institution, pp 322-328 In: G Peters and J von Braun (Eds) Food Security, Diversification and Resource Management: Refocusing the Role o f Agriculture? Occasional Paper No. 8. International Association of Agricultural Economists, Ashgate Publishing Co Ltd, Aldershot, UK, 1998.
Lenis S. and W. Alex (2009). Poverty Status and the Impact o f Formal Credit on Technology Use and Wellbeing among Ethiopian Smallholders. World Development, Volume 38:541- 554
Long, S., (1997).Regression Models for Categorical and Limited Dependent Variables .Thousand Oaks,CA:Sage Publications.
Lynne, G.D., J.S. Shonkwiler, and L.R. Rola, (1988). Attitudes and Farmer Conservation Behavior. American Journal o f Agricultural Economics 70:12-19
Maddala, G.S. (1992). Introduction to Econometrics. Second Edition. Macmillan PublishingCompany, New York.
Mark P. and R. Khandker, (2000). Credit Program for the Poor and Seasonality in Rural Bangladesh, Working Paper. World Bank. Washington D.C.
McDonald, J. and R. Moffit, (1980).The use of Tobit Analysis. Review o f Econometrics and Statistics. 62:318-321.
McKinnon, R.I., (1973). Money and Capital in Economic Development. Brookings Institution,Washington, D.C.
McSweeney, B.G., (1979). Collection and Analysis of Data on Rural Women's l ime Use. Studies in Family Planning. 10(11/12): 379-383.
Mosher,A.T.,(1966). Getting Agriculture Moving: Essentials for Development andModernization. New York, Praeger.
Mulat Demeke, (1994), “Fertilizer Procurement, Distribution and Consumption in Ethiopia." A paper presented on the fourth annual conference o f the Ethiopian economy: 26-29 November 1994, Debre Zeit.
NBE (National Bank of Ethiopia), (2010). National Bank of Ethiopia 2008/2009 Annual Report. Addis Ababa, Ethiopia.
Nitin B. and Shui-Yan, 2002. Determinant of repayment in micro credit: evidence from programs in the UnitedStates, International journal o f urban and regional research.26-2:360-76. USA
74

Oladeeba, J.O. and O.E. Oladeeba, (2008). Determinantes o f Micro Credit Repayment in Agrobank, Malaysian. Malaysian humanities and social sciences journal 4( 1 )• 45-52 2008
Rosett, R. and F. Nelson, (1975). Estimation of the Two-limit Probit Regression Model. Econometrica. 43:141 -146.
Roslan, A.H. and M.Z. Abdkarim (2009). Determinants of Loan Repayment among Smallholder Farmers in Ogbomoso Agricultural Zone of Oyo State, Nigeria. Journal o f social science 17(1): 59-62 (2008)
Samson J. (2003). Financial Arrangements and Determinants of Consumption Credit use by Rural Households: The Case of Loume Woreda, M.Sc, thesis, Alemaya University, Ethiopia
Screiner, M. and G. Nagarjan,(1997). Predicting Creditworthiness: Evidence from ASCRAs and ROSCAs in the Gambia. Saving and Development, Quarterly review. 22(4): 399-413.
Smith, D.A. and R. Brame, (2003). Tobit Models In Social Science Research: Some Limitation and a More General Alternative. Sociological Methods and Research 31:364 -388
Solomon Damte, (1996). Credit to Poor households: The case o f Financing Micro. Enterprises in the Debre Berhan Town and North Shoa. Proceedings o f the Fourth Annual Conference on the Ethiopian Economy, Addis Ababa, Ethiopia
Solomon Gebre Sellassie. (1993). "Optimizing Farm Enterprise pattern and Resource Utilization in Major Coffee Growing Areas: A Case Study of Smallholders in Shebedino Awraja, Sidamo Region." M.Sc Thesis, AUA, Ethiopia.
Sonja V. and N. Chisholm (2002). Impact of credit as perceived by resource-poor Ethiopian households, M.sc Thesis National University of Ireland, Cork
Stighitz, E., (1989). Financial Markets and Development. Oxford Review o f Economic Policy. 5(4): 55-68.
Storck, H.,Bezabih Emana, Berhanu Adnew , A.A. Borowiecki, and Shimelis W/Hawariat, 1991. Farming systems and Farm Management Practices o f Small-holders in the Hararghe Highlands." Fanning system and Resource Economics in the Tropics'. Wissenschafts Varlag Vauk Kiel KG, Germany.
Timmer,C.P„ (1988). The Agricultural Transformation. In:Chenery, H and Srinivasan,T.N.,Eds, Handbook of Development Economics, Volume I. Elsevier Science Publisher.
Tobin, J., (1958). Estimation of Relation Ships for Limited Dependent Variables. Econometrica. 26:24-36.
75

I omoya M. and Y. lakashi. (2010). The Impacts of Fertilizer Credit on Crop Production and Income in Ethiopia. National Graduate Institute for Policy Studies, M.sc Thesis Tokyo, Japan
Wenner, M. D. (1995). Group Credit: A Menace to Improve Information Transfer and Loan Repayment Performance. Journal o f Development Studies.32 (2), 263- 281
Ugbomeh M., Achoja O., and Ideh V., Ofuoku U., (2008). Determinant of loan repayment performance among women self help groups in Bayelsa State, Nigeria. Journal article of agricultural conspectus scientificus. 73(3): 189-195, Nigeria
Zeller M., (1996). Determinant of Loan Repayment Performance in Credit Group: The Role of Program Design Intra Group Risk Pooling and Social Cohesion in Madagascar. Discussion papers. International food policy research institute, Washington, DC, U.S.A.
76

a p p e n d ic e s
Appendix 1 Conversion factors used to Estimate Tropical Livestock Units (TLU)
Livestock type TLU (Tropical Livestock Unit)
Calf 0.20
Heifer 0.75
Cows/oxen 1.00
Horse/Mule 1.10
Donkey 0.70
Donkey (Young) 0.35
Sheep/Goat 0.13
Sheep/Goat (Young) 0.06
Camel 1.25
Chicken 0.013
Source: Storck et a\., (1991)
77
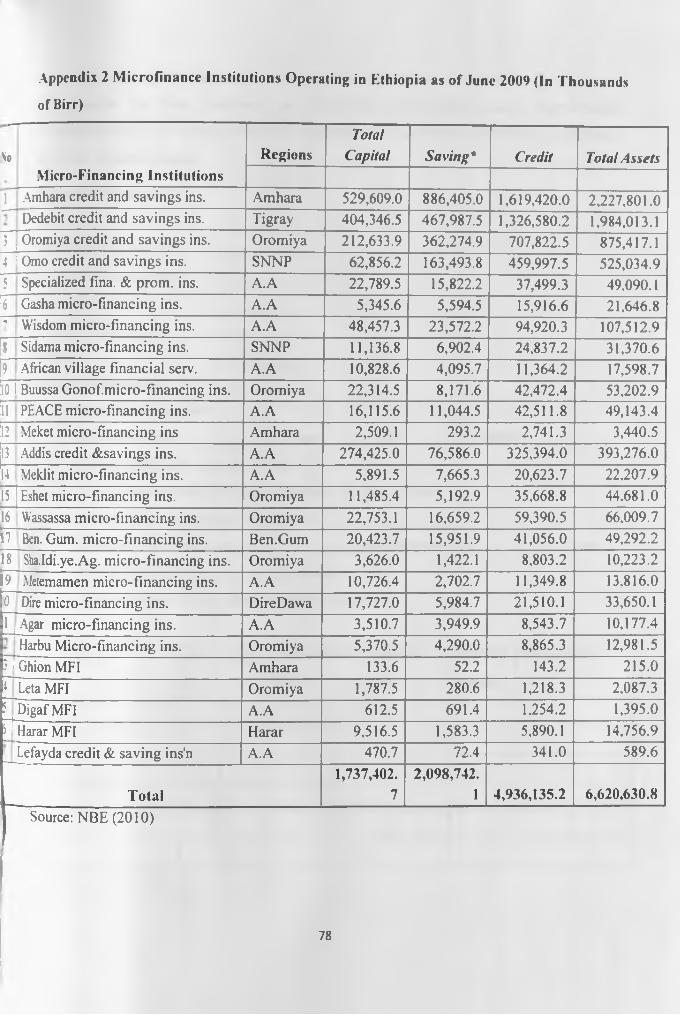
Appendix 2 .Microfinance Institutions Operating in Ethiopia as of June 2009 (In Thousands
of Birr)
VoMicro-Financing Institutions
RegionsTotal
Capital Saving* Credit Total Assets
l Amhara credit and savings ins. Amhara 529,609.0 886,405.0 1,619,420.0 2,227,801.0Dedebit credit and savings ins. Tigray 404,346.5 467,987.5 1,326,580.2 1,984.013.1
3 Oromiya credit and savings ins. Oromiya 212,633.9 362,274.9 707,822.5 875,417.1
4 Omo credit and savings ins. SNNP 62,856.2 163,493.8 459,997.5 525,034.95 Specialized fina. & prom. ins. A.A 22,789.5 15,822.2 37,499.3 49,090.16 Gasha micro-financing ins. A.A 5,345.6 5,594.5 15,916.6 21,646.81 Wisdom micro-financing ins. A.A 48,457.3 23,572.2 94,920.3 107,512.98 Sidama micro-financing ins. SNNP 11,136.8 6,902.4 24.837.2 31,370.69 African village financial serv. A.A 10,828.6 4,095.7 11,364.2 17,598.710 Buussa Gonof.micro-fmancing ins. Oromiya 22,314.5 8,171.6 42,472.4 53,202.911 PEACE micro-financing ins. A.A 16,115.6 11,044.5 42,511.8 49,143.412 Meket micro-financing ins Amhara 2,509.1 293.2 2,741.3 3,440.513 Addis credit &savings ins. A.A 274,425.0 76,586.0 325,394.0 393,276.014 Vleklit micro-financing ins. A.A 5,891.5 7,665.3 20,623.7 22,207.915 Eshet micro-financing ins. Oromiya 11,485.4 5,192.9 35,668.8 44.681.016 Wassassa micro-financing ins. Oromiya 22,753.1 16,659.2 59,390.5 66.009.717 Ben. Gum. micro-financing ins. Ben.Gum 20,423.7 15,951.9 41,056.0 49,292.218 Sha.ldi.ye.Ag. micro-financing ins. Oromiya 3,626.0 1,422.1 8,803.2 10,223.2
I9 Metemamen micro-financing ins. A.A 10,726.4 2,702.7 11,349.8 13,816.00 Dire micro-financing ins. DireDawa 17,727.0 5,984.7 21,510.1 33,650.11 j Agar micro-financing ins. A.A 3,510.7 3,949.9 8,543.7 10,177.4
f |Harbu Micro-financing ins. Oromiya 5,370.5 4,290.0 8,865.3 12,981.5Ghion MFI Amhara 133.6 52.2 143.2 215.0
1 L eta MFI Oromiya 1,787.5 280.6 1,218.3 2,087.35 D ig a f MFI A.A 612.5 691.4 1.254.2 1,395.0j l Harar MFI Harar 9,516.5 1,583.3 5,890.1 14,756.9
Lefayda credit & saving ins'n A.A 470.7 72.4 341.0 589.6
Total1,737,402.
72,098,742.
1 4,936,135.2 6,620,630.8Source: NBE (2010)
78

Appendix 3 Survey Questionnaire
Questionnaire for farm household on “FACTORS AFFECTING LOAN REPAYMENT
PERFORMANCE OF SMALLHOLDER FARMERS IN EASTERN HARERGE, ETHIOPIA”
for MSC. Research project
General Information
Date : ___________
Questionnaire code No. :___________
Name of the enumerator : ___________
Ecological zones : ___________
Peasant Association : ___________
Village : __________
Group Name loaness : ___________
A. Individual Background
1. Borrowers name______________ . age_______ . s e x _________religion____________ .
2. Are you married? A) yes B) no
3. Are you participated in formal education? A) yes B) no
4. If yes, what is your level of education?_________________
5. Experience in formal credit__________ years and informal credit___________y ears
6. Your family s ize____________ in number.
7. List the number of your family in the following table
No Name sex Age Educational
level
Relation
ship
Marital
status
Occupation
79

8. In which of the following organizations were you participated in the PA?
Farm/social organization Response (yes or no ) Years served/number
Peasant Association
Iddir'
Iqqub ‘
Others (specify)
B. Source of income
1. What is the main source of your income
A) Agriculture B) petty trading C) selling labor D) handicraft E) other (specify)
2. Amount o f income obtained from selling crop products and bi product in 2008/2009
No Type of crop or crop bi product Amount in quantity Unit price Total income (bin-)
3. Amount of income obtained from live stock and live stock product in 2008/2009
No Type of crop or crop bi product Amount in quantity Unit price Total income (birr)
80

4. Amount o f income obtained from off farm in 2008/2009
No Activities Total working days Total income (birr)
1 Petty trading
2 Handicraft
3 Fire wood and charcoal
4 Other(specify)
C. Agriculture
1. What is your main activity for income?
A) Agriculture B) petty trading C) selling labor D) handicraft E) other (specify)
2. Do you have land for cultivation? A) yes B) no
3. If yes, how many timed do you have?_____________ timed
a. Owned_______timed b. rented in________ timed c. rented out_______ timed
4. Land allocated for
A) Cultivated_______________ timed B) Grazing______________timed
C) Fallow__________________ timed D ) forest_______________ timed
E) Other (specify)____________timed
5. The degree of fertility of land?
A) Very poor B) Poor C) Average D) Good E) Very good
6. Is your land holding adequate to satisfy your family needs? A) yes B) no
7. If no, how can you raise your income?
A) Agriculture B) petty trading C) selling labor D) handicraft E) other (specify)_
8. Is there any possibility to get land if you want? A) yes B) no
9. If yes how do you get?
A) free from government B) buying from individuals C) renting D) other (specify)
10. Do you feel that your family labor adequate for your farm activity? A) yes B) no
11. Have you used hired labor on farm? A) yes B) no
81

12. If yes, for what farm activity do you hire labor? A) land preparation B) weeding
C) harvesting D) threshing E) other (specify)______________
13. Is there labor shortage during peak production period? A) yes B) no
14. If yes, how did you overcome? A) by mutual work (guza) B) hiring daily laborer
C) using family labor D) other (specify)_____________
15. Allocation of land for different crops during 2008/2009 crop season
No Type of crops Area allocated in timed
1 Creal crops
2 Pulse
3 Root crop
4 Coffee
5 Chat
6 Fruit
Other (specify)
16. Livestock holding
No Type of livestock Number Purpose Price/ unit
1 Oxen
2 Cow
3 Bulls
4 Heifer
5 Calves
6 Sheep
7 Goats
8 Donkey
9 Camels
10 Poultry
11 Others(specify)
17. The number of oxen used for draught
18. The number of cows used for milking
82

D. List of money spend on different items during year 2008/2009
No Items Birr
1
2
3
4
5
E credit acquisition mechanism
1. What type of credit did you receive in year 2008/20097A) formal B) informal C) both
2. What is/are the source of formal source of credit
A) OCSSCO B) development bank(DBE) C) commercial bank D) NGO’S E) other
3. What is/are the source of informal credit multiple answer is possible
A) Relative B) shopkeepers C) money lender D) other
4. Why did you borrow from the above mentioned source? A) Easier to get loan B) less
security required C) cheapest source of credit D) get terms to suit situation E) other___
5. Did u use your credit for consumption purpose? A) yes B) no
6. If yes, how much?______________ birr
7. Did u get amount of credit your request? A) yes B) no
8. Did you get credit service in time? A) yes B) no
9. Where do you invest your credit money obtained from OCSSO? A) purchase o f farm
input B) building C) consumption D) social ceremonies E) others________________
10. Did you credit obtained from OCSSO bring change to your living standard? A) yes B) no
11. Rank the main factors affecting your saving and investing decision(give 1 the most
affecting you decision)
A) Extended family obligation_________________
B) Limited market for production_______________
C) Natural disaster____________________________
D) Low price of farm product__________________
E) Other (specify)_____________________________
83

F. institutional and social factors
1. The distance from extension service (hours)_________________
2. Are you a member for any extension package? A) yes B) no
3. Distance from your extension service (hrs)___________________
4. Distance from your credit source (hrs)______________________
5. How many times was your credit source personnel visited you per year?_________
6. What do you feel about output price and market condition?
A) Very good B) Good C) Fair D) bad
7. Was credit received adequate and timelines? A) yes B) no
8. Did you receive loan from OCSSO group or individual? A) group B) individual
9. If you received loan in group what is your status in your Credit groups?________
10. Did you celebrate any social ceremonies in 2008/2009? Like wedding, funeral
ceremonies, engagement, circumcision, Iddir/lqqub and others
A) Yes B) no
11 .If yes, how much money you invested on it?__________________ birr
12. Have you or your family gone to a health center for treatment? A) Yes B) no.
13. If yes, how much did you pay?_______________
14. The source o f the money you paid_____________
15. Distance from water point (hours)_____________
16. Distance from grinding mills (hours)________________
17. Distance from market (hours)_______________________
F. Communication
1. Did you follow agricultural programs on the radio? A) yes B) no
2. If literate, have you access to written materials? A) yes B) no
3. If yes, how often?_____________ If not, why?________________
4. Did you get technical assistance from technical assistance? A) yes B) no
5. If yes, How often per month?______________________
6. Did you get training on credit, saving, interest rate from OCSSO? A) yes B) no
7. If yes, how often per month?_______________________
84
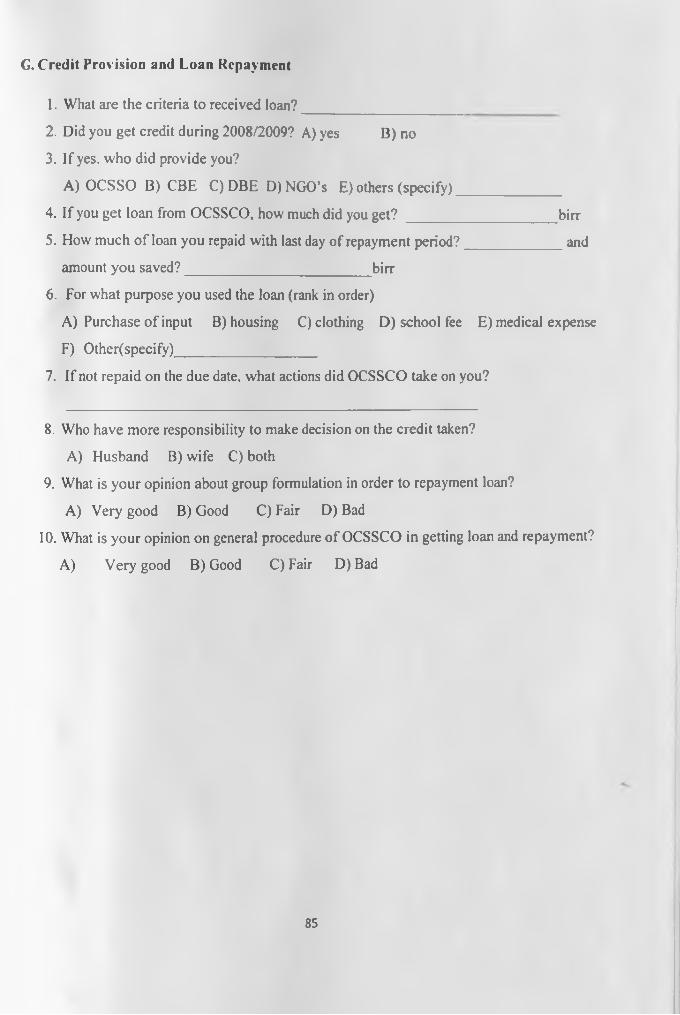
G. Credit Provision and Loan Repayment
1. What are the criteria to received loan?__________________________________
2. Did you get credit during 2008/2009? A) yes B) no
3. If yes. who did provide you?
A) OCSSO B) CBE C) DBE D) NGO’s E) others (specify)______________
4. If you get loan from OCSSCO, how much did you g e t ? ____________ ______ birr
5. How much of loan you repaid with last day of repayment period?____________ and
amount you saved?_________________________ birr
6. For what purpose you used the loan (rank in order)
A) Purchase of input B) housing C) clothing D) school fee E) medical expense
F) Other(specify)___________________
7. If not repaid on the due date, what actions did OCSSCO take on you?
8. Who have more responsibility to make decision on the credit taken?
A) Husband B) wife C) both
9. What is your opinion about group formulation in order to repayment loan?
A) Very good B) Good C) Fair D) Bad
10. What is your opinion on general procedure of OCSSCO in getting loan and repayment?
A) Very good B) Good C) Fair D) Bad
85