Factors Affecting Bank Risks in Vietnam
12
International Journal of Economics and Finance; Vol. 13, No. 10; 2021 ISSN 1916-971X E-ISSN 1916-9728 Published by Canadian Center of Science and Education 42 Factors Affecting Bank Risks in Vietnam Phuong Anh Nguyen 1,2 & Thi Thuy Trang Dinh 1,2 1 Department of Finance and Banking, School of Business, International University, Ho Chi Minh City, Vietnam 2 Vietnam National University of Ho Chi Minh City, Ho Chi Minh City, Vietnam Correspondence: Phuong Anh Nguyen, School of Business, International University, Quarter 6, Linh Trung Ward, Thu Duc City, Ho Chi Minh City, 700000, Vietnam. Received: July 10, 2021 Accepted: August 31, 2021 Online Published: September 5, 2021 doi:10.5539/ijef.v13n10p42 URL: https://doi.org/10.5539/ijef.v13n10p42 Abstract The research identifies the determinants of credit risk and insolvency risk in the Vietnamese banking sector. Using the data sample of 25 commercial banks over ten years (2008-2017), we examine the relationship between internal variables, external variables, and bank risks. In this study, the independent variables are bank size, bank capitalization, return on asset, return on equity, loan loss provision, capital adequacy ratio, inflation rate, and GDP growth rate. In contrast, non-performing loans and Z-score are the dependent variables. The empirical results show that all factors have an effect on bank risks except liquidity ratio. Keywords: bank risk, credit risk, insolvency risk, commercial banks, Vietnam 1. Introduction There have been several financial crises worldwide such as the 1992-1993 European monetary system crisis, Mexico 1994-1995 crisis, Asian crisis 1997-1998, and the global crisis in 2008. A myriad of reasons caused the financial crisis in 2008, and the subprime mortgage was an essential factor. When the economy operates inefficiently, the interest rate increases to create a repayment burden of borrowers and increased unemployment, the risk of subprime mortgages will be affected quickly. The grave consequences and the long-term effects of the crisis have accentuated the significance of early recognizable identifying risk-related factors. Widely known as the financial lifeline, the banking sector ’ s operations cover economic and social activities. The main activity of the banking system is capital mobilization from the savings sector to the manufacturing sector investment. Banks collect personal savings and lend them to businesses and manufacturers. Banks conduct credit based on analysis, appraisal, and valuation of borrowers’ information. Thereby, financial capital is distributed and utilized most effectively. However, the bank’ s operation always confronts several problems. Thus, to ensure financial stability for the bank and satisfy the customers’ needs, banks must maintain the balance between demand and ability to obtain capital in major cases. Furthermore, the bank’ s operation characteristics have a very high leverage ratio (capital mobility is larger than the owner ’ s equity), leading to increased risk. Therefore, bank administrators must focus on risk management to make profits and limit damage to banks. In theory and practice, banks are prone to credit, currency, liquidity, and country risk. With unique characteristics, the bank’ s operation is always inherent in risk, economic decisions based on risk and profits. The higher risk may lead to more profits, but it also makes the banking system accumulate more hazards. Heffeman (2005) showed that if the risks occur frequently, banks will lose capital and profits and reduce the value of their assets, thereby affecting the bank’ s operation. Therefore, banks must focus on risk-related issues. There are many reasons why banks increase risk accumulation: weak risk management, profiteering, chasing profit, etc. The global financial crisis in 2008-2009 set such a typical example, primarily caused by subprime lending and excess risk by the US banking industry. The spillover influence of the global financial crisis is enormous on the economies of nations. Moreover, the different levels of impact will be determined by the degree of integration for each country to the global economy. Large economies such as the United States, the European Union, and Japan are directly affected by unfavourable economic growth that narrows down the manufacturing business, stagnates or bankruptcy, and increases unemployment rates. Recently, Vietnam has been integrating more profoundly into the world economy, so its economy and the financial system in particular also had to bear heavy consequences of this financial crisis. The
Transcript of Factors Affecting Bank Risks in Vietnam
International Journal of Economics and Finance; Vol. 13, No. 10; 2021
ISSN 1916-971X E-ISSN 1916-9728
Published by Canadian Center of Science and Education
42
Factors Affecting Bank Risks in Vietnam
Phuong Anh Nguyen1,2
& Thi Thuy Trang Dinh1,2
1 Department of Finance and Banking, School of Business, International University, Ho Chi Minh City, Vietnam
2 Vietnam National University of Ho Chi Minh City, Ho Chi Minh City, Vietnam
Correspondence: Phuong Anh Nguyen, School of Business, International University, Quarter 6, Linh Trung Ward,
Thu Duc City, Ho Chi Minh City, 700000, Vietnam.
Received: July 10, 2021 Accepted: August 31, 2021 Online Published: September 5, 2021
doi:10.5539/ijef.v13n10p42 URL: https://doi.org/10.5539/ijef.v13n10p42
Abstract
The research identifies the determinants of credit risk and insolvency risk in the Vietnamese banking sector.
Using the data sample of 25 commercial banks over ten years (2008-2017), we examine the relationship between
internal variables, external variables, and bank risks. In this study, the independent variables are bank size, bank
capitalization, return on asset, return on equity, loan loss provision, capital adequacy ratio, inflation rate, and
GDP growth rate. In contrast, non-performing loans and Z-score are the dependent variables. The empirical
results show that all factors have an effect on bank risks except liquidity ratio.
Keywords: bank risk, credit risk, insolvency risk, commercial banks, Vietnam
1. Introduction
There have been several financial crises worldwide such as the 1992-1993 European monetary system crisis,
Mexico 1994-1995 crisis, Asian crisis 1997-1998, and the global crisis in 2008. A myriad of reasons caused the
financial crisis in 2008, and the subprime mortgage was an essential factor. When the economy operates
inefficiently, the interest rate increases to create a repayment burden of borrowers and increased unemployment,
the risk of subprime mortgages will be affected quickly. The grave consequences and the long-term effects of the
crisis have accentuated the significance of early recognizable identifying risk-related factors.
Widely known as the financial lifeline, the banking sector’s operations cover economic and social activities. The
main activity of the banking system is capital mobilization from the savings sector to the manufacturing sector
investment. Banks collect personal savings and lend them to businesses and manufacturers. Banks conduct credit
based on analysis, appraisal, and valuation of borrowers’ information. Thereby, financial capital is distributed
and utilized most effectively. However, the bank’s operation always confronts several problems. Thus, to ensure
financial stability for the bank and satisfy the customers’ needs, banks must maintain the balance between
demand and ability to obtain capital in major cases. Furthermore, the bank’s operation characteristics have a very
high leverage ratio (capital mobility is larger than the owner’s equity), leading to increased risk. Therefore, bank
administrators must focus on risk management to make profits and limit damage to banks.
In theory and practice, banks are prone to credit, currency, liquidity, and country risk. With unique characteristics,
the bank’s operation is always inherent in risk, economic decisions based on risk and profits. The higher risk
may lead to more profits, but it also makes the banking system accumulate more hazards. Heffeman (2005)
showed that if the risks occur frequently, banks will lose capital and profits and reduce the value of their assets,
thereby affecting the bank’s operation. Therefore, banks must focus on risk-related issues.
There are many reasons why banks increase risk accumulation: weak risk management, profiteering, chasing
profit, etc. The global financial crisis in 2008-2009 set such a typical example, primarily caused by subprime
lending and excess risk by the US banking industry.
The spillover influence of the global financial crisis is enormous on the economies of nations. Moreover, the
different levels of impact will be determined by the degree of integration for each country to the global economy.
Large economies such as the United States, the European Union, and Japan are directly affected by unfavourable
economic growth that narrows down the manufacturing business, stagnates or bankruptcy, and increases
unemployment rates. Recently, Vietnam has been integrating more profoundly into the world economy, so its
economy and the financial system in particular also had to bear heavy consequences of this financial crisis. The
ijef.ccsenet.org International Journal of Economics and Finance Vol. 13, No.10; 2021
43
global financial crisis narrows the market due to the enterprise’s production reduction that causes personal
income to drop sharply. Therefore, the demand for goods consumption falls and leads to a decrease in the
country’s GDP. It also has a significant effect on the investment and production activities of enterprises. In
addition, this crisis exerts an indirect impact on financial, monetary markets and banking activities. It makes
investments and contributed capital to purchase investors’ shares reduced and more limited and causes
fluctuations in the interest rates on gold prices and world currencies. Monetary markets worldwide with a crisis
often fluctuated rapidly and continuously. All of them have several impacts on the currency market, the foreign
exchange market, etc. According to the research analysis, there are several underlying roots of the financial crisis.
Among the leading causes, bank risk is the most noticeable, which has been a concern by the society.
The global financial crisis is a financial epidemic in which countries around the world are affected. Vietnam is
undeniably among the countries impacted on economic growth, import and export growth, etc. Agricultural
exports fell sharply: rice reduction by 58%, rubber decrease by 48%, coffee by 24%, and aquaculture by 15%.
From Vietnam’s goods exports to imports have declined, with slower product consumption and increased
inventory. Besides, it is also affected by tightening monetary policy, limiting credit growth to make higher
lending interest rates, and increasing the banks’ bad debts. Therefore, the government of Vietnam has issued
appropriate guidelines to monitor and provide support orientations for enterprises such as promoting business
cooperation, propaganda in support of domestic consumers, or control monetary policy. Bank risk has been paid
more attention to the society when this is at the root of the financial crisis 2007-2008. So, Vietnam banking
system during the reform process has much developed about the scale, products, and services quality, but the
issue of risk does not seem to be widely recognized. Vietnamese commercial banks face many risks when the
non-performing loan ratio has increased, and liquidity shortages rise and profit decline. The reasons may come
from the bank’s decisions, loan policy, and weak expense management or the country’s economic conditions.
Therefore, the need to understand more about determinants of bank risk has become essential.
This research mainly aims to focus on identifying the determinants of bank risks in Vietnamese commercial
banks. We examine how bank risks are related to internal and external factors. This research investigates
bank-specific variables such as bank size, capital, profitability, loan loss provisions, and asset liquidity. Moreover,
the study includes regulatory variables and macroeconomic variables.
2. Literature Review
2.1 Bank Risk
There are several types of bank risks and each of them will be measured by different indexes and methods. Not
only policymakers but also customers and investors worry about bank collapses, so we investigate the correlation
between bank risk and the likelihood of default. It is commonly expressed through credit risk (non-performing
loans) and insolvency (Z-score). Therefore, we examine and measure bank risks through Z-score and
non-performing loans (NPL).
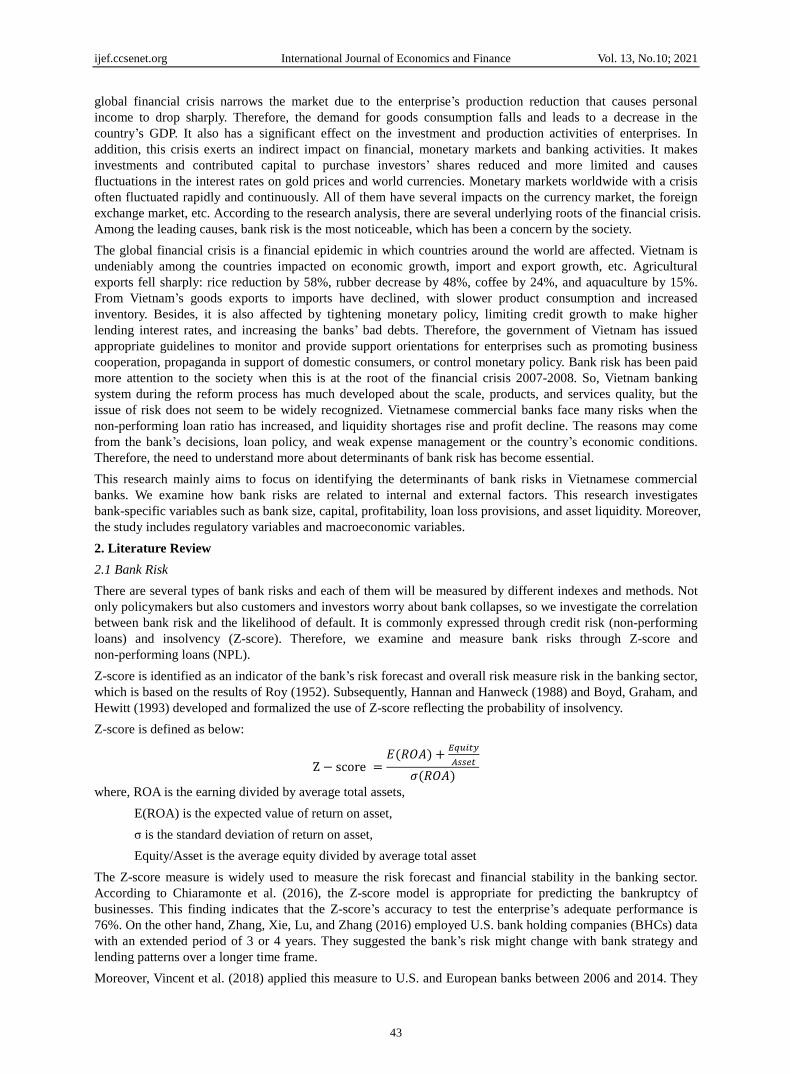
Z-score is identified as an indicator of the bank’s risk forecast and overall risk measure risk in the banking sector,
which is based on the results of Roy (1952). Subsequently, Hannan and Hanweck (1988) and Boyd, Graham, and
Hewitt (1993) developed and formalized the use of Z-score reflecting the probability of insolvency.
Z-score is defined as below:
Z − score =𝐸(𝑅𝑂𝐴) +
𝐸𝑞𝑢𝑖𝑡𝑦
𝐴𝑠𝑠𝑒𝑡
𝜎(𝑅𝑂𝐴)
where, ROA is the earning divided by average total assets,
E(ROA) is the expected value of return on asset,
σ is the standard deviation of return on asset,
Equity/Asset is the average equity divided by average total asset
The Z-score measure is widely used to measure the risk forecast and financial stability in the banking sector.
According to Chiaramonte et al. (2016), the Z-score model is appropriate for predicting the bankruptcy of
businesses. This finding indicates that the Z-score’s accuracy to test the enterprise’s adequate performance is
76%. On the other hand, Zhang, Xie, Lu, and Zhang (2016) employed U.S. bank holding companies (BHCs) data
with an extended period of 3 or 4 years. They suggested the bank’s risk might change with bank strategy and
lending patterns over a longer time frame.
Moreover, Vincent et al. (2018) applied this measure to U.S. and European banks between 2006 and 2014. They

ijef.ccsenet.org International Journal of Economics and Finance Vol. 13, No.10; 2021
44
find that a ROA-based Z-score using current values of the capital-asset ratio is the best model for both the U.S.
and Europe. Larysa (2019) also used the Z-score model to evaluate data from EU member countries and the three
associated countries (Ukraine, Georgia, and Modavia) for the period 2007- 2014. The conclusion is that this is a
valuable tool in measuring the financial stability of the banking sector. Higher Z-score indicates less risky and
more stable banks and vice versa - the decline of this indicator signals less resistance and more vulnerability.
Gonzalez (2006) and Caprio (2007) used the non-performing loans (NPLs) ratio as a measurement of the impacts
on credit risk. Delis and Kouretas (2011) illustrated that non-performing loans cause risks, damages to banks,
and the higher this ratio, the higher the credit risk. Batra (2003) found that NPL affects profitability, liquidity,
and competitive functioning and the psychology of bankers. Atoi (2018) also used the Z-score model to evaluate
Nigerian banks with national and international operational licenses from 2014:Q2 to 2017:Q2. The results reveal
that international banks withstand shocks from NPLs better than national banks in the long run. Using the data
from the four major commercial banks in Namibia from 2014 to 2018, Maseke and Swartz (2020) found that in
the worst period, NPLs increase while profit increases so external factors still play a major role. Non-performing
loan is a vitally crucial indicator to evaluate credit risk in the banking sector. Non-performing loan is the amount
of borrowing money of which debtors do not make payment interest or the principal by the specified time. The
banks cannot revoke granting lending and interest. However, they still must pay the interest and principal for
other deposits in due time, leading to imbalances between revenues and expenditures. The probability of not
receiving pay back loans from customers is relatively high; Banks lose capital, reduce income and profit. The
non-performing loan ratio is expressed as follows:
𝑁𝑃𝐿 𝑅𝑎𝑡𝑖𝑜 =𝑁𝑜𝑛 − 𝑝𝑒𝑟𝑓𝑜𝑟𝑚𝑖𝑛𝑔𝑙𝑜𝑎𝑛𝑠
𝐺𝑟𝑜𝑠𝑠𝑙𝑜𝑎𝑛𝑠
2.2 Bank Specific Factors
Lying at the heart of the countries’ economies, banks are regarded as financial institutions, constantly dealing
with risk and profit. Along with the benefits that banks get, they also face many hidden hazards that arise from
implementation processes. Therefore, there have been several types of research about risks to provide deeper
insight and explain the problem behind the banking sector. Reviewing these studies suggests some determinants
that need to be investigated in the case of Vietnam. The factors affecting bank risk are divided into two main
categories. The first category involves a group of risk determinants that are the specific risks for each bank.
These factors consist of capitalization, size, probability, liquidity, and capital regulatory. Second, a group of
determinants contain the factors associated with bank risks to the macroeconomic environment in the banking
operation system, for instance, s GDP growth rate and inflation rate.
According to previous studies, bank size and risk have complex relationships. A myriad of findings show the
unfavourable correlation between bank size and risk such as Hughes et al. (2001), Hu et al. (2004),
Garcia-Marco and Role-Fernandez (2008), Nguyen (2011), and Mongid et al. (2012). Nguyen (2011) found that
banks with larger sizes will constrain and diversify more than banks with small size because large banks have
more potential, more flexibility, many product lines, and many sources to generate revenue such as cash
management professional fees, and financial advice. Hu et al. (2004) found that banks with a significant asset are
associated with more resources and experience to handle adverse selection problems and moral hazards.
Meanwhile, smaller banks cannot solve these problems in a good way because they lack capacity and expertise
to evaluate credit ratings. For this reason, a bank of small size often has higher non-performing loans than a bank
of larger size.
Laeven et al. (2014) recommended that the economy of scale and economies of scope can be used to explain the
relationships. Banks with large size have more advantages for operating in many market segments and different
countries. This implies banks increment benefits from giving more items to progressively potential clients. In
addition, the variety of activities reduce risk and allow banks to operate with minimizing risk of crisis. In some
previous studies, the researchers figure out that sometimes the increase of bank size is not from the economy of
scale or scope, it may come from a phenomenon of “too-big-to-fail”. Kane (2010) suggested that large banks
with large asset size will take more risk than banks with small dimensions. Larger banks take more risks in
business decisions, higher amounts of investment and loans because they believe their banks are too big to fail.
Moreover, according to Boyd and Runkle (1993) and Demsetz and Strahan (1997), large banks may use the
unnecessarily leveraged instrument to expand their assets. This leading these banks to take more risks.
Babanskiy (2012) recognized that banks of major size believe the government will assist them if the economic
crisis occurs. This conviction will ensure the banks’ leverage to conduct more risky activities.
Capital is among the most significant elements influencing the solidity of the banking sector. It finances its

ijef.ccsenet.org International Journal of Economics and Finance Vol. 13, No.10; 2021
45
investment or reduces the probability of bankruptcy. Previous studies considered capital as an essential variable
in determining bank risk, as a financial cushion to keep away from budgetary stuns and extreme dangers.
Demirguc et al. (2010) found that higher bank capital would motivate bankers to take on more risk. Fatnassi,
Hasnaoui, Ftiti (2014) studied 13 banks in the GCC countries over the period (2003-2011) and identified that
bank capital is positively related to risk. This finding indicates that banks will decide to invest if their capital is
large enough to eliminate risky behaviours. In contrast, according to research results in the developing countries,
Tan and Floros (2013), Mohamed (2015), Tu (2016) revealed highly capitalized banks are less risky. Moreover,
Rim El-Khoury (2020) chose a sample of 23 Lebanese banks between 2009 and 2014 and obtained the same
results of negative relationship for both listed and unlisted banks. While Haq and Heaney (2012) pointed out that
capital follows the U-form relationship with bank risk, with a sample for European banks from 1996 to 2010.
Thereby, these researchers believe that the relationship between capital and risk is unpredictable.
Profitability is an effective measure to appreciate the operational situations as well as the risky of the banks.
There are several types of research about the relationship between profitability and bank risk. Jensen and
Meckling (1976) were two of the first researchers to learn about their relationship. Their findings indicated that
poor profitability banks tend to invest more in riskier activities, increasing their return. According to Martynova,
Ratnovski, and Vlahu (2015), higher profitability allows banks to borrow more and accept riskier on a large scale.
In the same year, Noman et al. (2015) used OLS random effect model, GLS and GMM for Bangladesh. They
suggested that an increase in exposed credit risk leads to a decrease in the bank’s profitability.
In contrast, Hien and Giang (2020) employed a similar method for Vietnamese data; however, the result is
different: banks tend to take on more risk when facing increased profitability. With a sample of Chinese banks,
Tan (2016) concluded that profitability does not interrelate with bank risk. Profitability is measured by Return on
Asset (ROA) and Return on Equity (ROE). Return on Asset (ROA) is a profitability ratio, which measures a
bank’s profitability compared to its assets. It is defined as the ratio of net income to the average total assets.
Return on Equity (ROE) is considered a variable to control effectiveness between equity management and bank
risk. This ratio is a measurement of the profit the bank can earn from its shareholder investment. In the bank’s
strategic development, increased equity is also associated with profitability and risks.
Liquidity is a virtually vital variable to determine the financial health bank. The commercial bank’s liquidity is
seen as an immediate ability to meet the demand for withdrawing. Using the ratio of total liquidity over total
assets makes it possible to estimate this variable, which allows identifying the relationship between liquidity and
bank risk. Charya and Naqvi (2012) suggested that banks with higher liquidity tend to be riskier by declining the
lending standard to increase the volume of loans. Alternatively, the findings indicate that relationships fluctuate
and change over time between liquidity and bank risk. It is supported by Muhammad et al. (2017) employed data
for U.S. bank holding companies from 1986 to 2014. They suggested a reduction in funding liquidity increases
bank risk; however, during the Global Financial Crisis banks with lower funding liquidity take less risk.
Futhermore, Nguyen and Quyen (2018) chose the sample of banks from Vietnamese commercial banks between
2002 and 2016 and concluded that there is no empirical statistical evidence to confirm a correlation between
liquidity and risk-taking. The results of the relationship between liquidity and bank risk are positive such as
Agenor and Aynaoui (2009), Berger and Bouwman (2009) Cao and Illing (2008) and Khan et al. (2015). Vodová
(2011), Deléchat et al. (2012), Truong and Minh (2014) found that liquidity remains negatively related to credit
risk.
Whalen (1988) suggested the higher the non-performing loans are, the greater the loan loss provision to gross
loans ratio and the risk will be. The higher loan-loss provision means a greater credit risk of banks, an increase in
non-performing loans, a decline in asset quality, and harmful effects on profit. Some researchers found the
positive relation between two variables, such as Hasan and Wall (2003), Ahmad and Ariff (2007), and Chaibi and
Ftiti (2015). Conversely, Halling (2007) found a negative relationship between loan loss provision and bank risk.
Banks with good financial healthy take the initiative in improving provisions, and banks face financial
difficulties that will reduce provision at the lowest level. Fakir (2018) analyzed 56 Bangladesh commercial
banks’ collected information between 2009 and 2017 and found that higher non-performing loans are higher
loans loss provisions. Both variables have a negative relationship with profitability.
Homolle (2004) found that the regulation of capital requirements limits risks to protect their banks from the risk
of insolvency. Lee and Chih (2013) believed that capital regulation has a beneficial effect on bank risk-taking.
Aysa and Razali (2020) used the SEM method and data of 565 commercial banks from 52 countries throughout
2011-2015. Correspondingly, a good correlation between capital regulatory and risk is shown by the empirical
results. On the contrary, the research of Patrick et al. (2017) disclosed that credit risk has a significant impact on
profitability. A higher capital adequacy ratio records better profitability and lower bank’s risk than commercial
ijef.ccsenet.org International Journal of Economics and Finance Vol. 13, No.10; 2021
46
banks in Nigeria. Moreover, according to Adamgbo et al. (2019), capital adequacy can remarkably downward
bank’s risk in both short and long-run periods, using the sample date in Nigeria from 1989 to 2015. There are
some recent research works that find the opposite relation between capital regulatory and risk, such as Zong-yi et
al. (2008), Zhang, Wu, and Lui (2008), Agoraki et al. (2011), and Delis, Tran, and Staikouras (2011).
2.3 Macroeconomic Factors
Pasiouras and Kosmidou (2007) found that macroeconomic conditions affect bank profit along with their
specific characteristics. Other studies of Cifter et al. (2009), Nkusu (2011) and Segoviano et al. (2006) also
placed a heavy emphasis on macroeconomic determinants of NPLs.
Inflation is a macroeconomic variable, which is used to consider the level impact on risk. Due to the high
inflation rate can make the low value of profitability and increased repayment of borrowers, banks choose to take
more risks. In countries with a change in interest rate, the inflation rate, perhaps, is negatively linked to the
ability to pay interest or payment of customers because of changes in monetary policies to combat inflations and
maintain banks’ profit. Gunsel (2012) and Badar and Javid (2013) found the positive effect of inflation.
Following the research, Kobia (2018) also discovered the significant relationship between inflation and bank risk
when using sample data of commercial banks in Kenya from 2013 to 2017. On the contrary, Poudel (2013) found
that the inflation rate negatively impacts credit risk in Nepal over ten years periods. Moreover, Myra (2020)
examined 120 samples of 20 Asian banks covering the period of 2012 to 2017, and the result is that profitability
is still upward while inflation rate is high.
Gross Domestic Product (GDP) is considered a variable to control for macroeconomic, representing the impact
of the economic cycle on the bank’s operation and risk. GDP allows banks to perform better and avoids risks.
Following Samir (2013), a country that has better economic growth tends to lower risk. Due to the financial
crisis period and a prolonged recession, banks face several difficulties, such as customers not fulfilling their debt
repayment obligations leading to increased risk for the banks. Kobia (2018) used a panel of multiple regression
analysis datasets of 43 commercial banks in Kenya between 2007-2015. The findings show that the growth rate
in GDP does not affect bank credit risk. In addition, Kharabsheh (2019) proposed that the growth rate in GDP
and the inflation rate do not affect bank credit risk when applying a panel for commercial banks in Jordan from
2000 to 2017. While Myra (2020) showed that the relationship between real GDP growth and credit risk is
undoubtedly positive and point out that inflation creates an enormous significant effect on risk, Alas and Saurina
(2002), Fofack (2005) argued about the existence of a negative impact on bank’s risk. On the other hand, the
fluctuation influences credit risk-taking are found by Laxmi (2019).
3. Method
3.1 Data and Variables
As illustrated in previous studies, the researchers show a myriad of variables that may affect bank risk-taking.
This research works towards a goal of identifying the relationships between internal factors, external factors and
bank risk in the context of Vietnam banking system. We use a panel dataset for banks from 2008 to 2017.
This research focuses only on Vietnamese banks, meaning to overlook other financial institutions, including
insurance companies, credit unions or investment funds. Moreover, the list of banks includes commercial banks
except foreign banks and joint-venture banks. According to the State Bank of Vietnam announcement at the end
of 2017, there have been 31 Vietnamese commercial banks. However, some banks are unlisted and do not have
public information in the annual reports. For that reason, we collect a sample size of 25 Vietnamese commercial
banks, including small, medium, and large size banks. Since the relationship between factors and bank risk will
be explored and clarified during the crisis period, the period chosen for this study is from 2008 to 2017. The
2008 subprime crisis is widespread and affects almost all financial markets worldwide. However, until late 2008,
the word-wide financial crisis officially started in the United States and spread worldwide. The crisis shook and
devastated the global economy. In 2017 along with the world economies recovery and the highest growth rate
since the financial crisis, Vietnam also has had positive changes and rehabilitate the economy.
The bank dataset used in this study is obtained from the annual report. The dataset of internal factors and risk
measures are collected from both the yearly report of banks and the bank’s website. The data for macroeconomic
variables are collected from the World Bank database (https://www.worldbank.org).

ijef.ccsenet.org International Journal of Economics and Finance Vol. 13, No.10; 2021
47
Table 1. Definition of selected variables
Variables Description
Dependent Variables
Non-performing loans NPLs A nonperforming loan (NPL) is a sum of borrowed money upon which the debtor has not
made the scheduled payments for a specified period
Bank Z-score Z-score Z-score captures the probability of default of a country’s banking system
Independent Variables
Bank zise LnTA The natural logarithm of total assets
Bank capitalization BC The difference between a bank’s assets and its liabilities, and it represents the net worth of
the bank or its equity value to investors
Profitability ROA An indicator showing the correlation between the profitability of a company and its assets
ROE An indicator of the effectiveness of the use of equity in the banks
Liquidity LIQ_A An important class of financial metrics used to decide a debtor’s capacity to take care of
current obligation commitments without raising outer capital
Loan loss provision LLPs An expense put aside as a remittance for uncollected credits and advance installments
Regulatory quality CAR The indicator is used to set standards for banks by looking at a bank’s ability to pay
liabilities, respond to credit risks
Macroeconomic Variables
Inflation INF The inflation rate
GDP growth rate GDP The growth rate of real GDP
3.2 Research Methods
Using a regression model with three approaches: Pooled-OLS, Fixed Effect Model (FEM) and Random Effect
Model (REM) to find a suitable model in this case. The problems of multicollinearity, autocorrelation, and
heteroscedasticity will be controlled in the model. If there are heteroskedasticity of residuals and autocorrelation
issues, we will use regression with Driscoll-Kraay standard errors to overcome these phenomena on the panel
data. We will use the Stata 14 to analyze data with Pooled OLS, Fixed Effect Model (FEM) and Random Effect
Model (REM), and diagnostic tests.
3.3 Empirical Model
To test the determinants of bank risk, a panel data regression model is used. The empirical model consists of
several variables for bank-specific and macroeconomic variables, which can affect the bank risk. Inspired by the
research work of Jabra et al. (2017) and Morshedur (2018), the empirical model is given as below:
𝑁𝑃𝐿𝑠 = 𝛼0 + 𝛼1𝐿𝑛𝑇𝐴𝑖𝑡 + 𝛼2𝐵𝐶𝑖𝑡 + 𝛼3𝑅𝑂𝐴𝑖𝑡 + 𝛼4𝑅𝑂𝐸𝑖𝑡 + 𝛼5𝐿𝐼𝑄𝑖𝑡 +
𝛼6𝐿𝐿𝑃𝑆𝑖𝑡+ 𝛼7𝐶𝐴𝑅𝑖𝑡 + 𝛼8𝐼𝑁𝐹𝑡 + 𝛼9𝐺𝐷𝑃𝑡 + 𝜀𝑖𝑡
𝑍 − 𝑠𝑐𝑜𝑟𝑒 = 𝛼0 + 𝛼1𝐿𝑛𝑇𝐴𝑖𝑡 + 𝛼2𝐵𝐶𝑖𝑡 + 𝛼3𝑅𝑂𝐴𝑖𝑡 + 𝛼4𝑅𝑂𝐸𝑖𝑡 + 𝛼5𝐿𝐼𝑄𝑖𝑡 + 𝛼6𝐿𝐿𝑃𝑆𝑖𝑡+
𝛼7𝐶𝐴𝑅𝑖𝑡 + 𝛼8𝐼𝑁𝐹𝑡 + 𝛼9𝐺𝐷𝑃𝑡 + 𝜀𝑖𝑡
Where i and t denote the bank and time dimension of the panel sample, respectively, 𝛼 are constant. For the
dependent variables, there are two variables to represent bank risk: non-performing loans (NPLs) and Z-score.
NPLs are a proxy for the bank’s credit risk, where higher values of NPLs correspond to higher bank risk. Z-score
is a proxy for insolvency risk in which higher values of the Z-score represent the lower probability of bank
default. Independent variables are ln(TA), BC, ROA, ROE, LIQ_A, LLPs, and CAR as internal variables for the
individual bank, and some macroeconomic variables such as INF and GDP.
4. Results
4.1 Summary Statistics Data
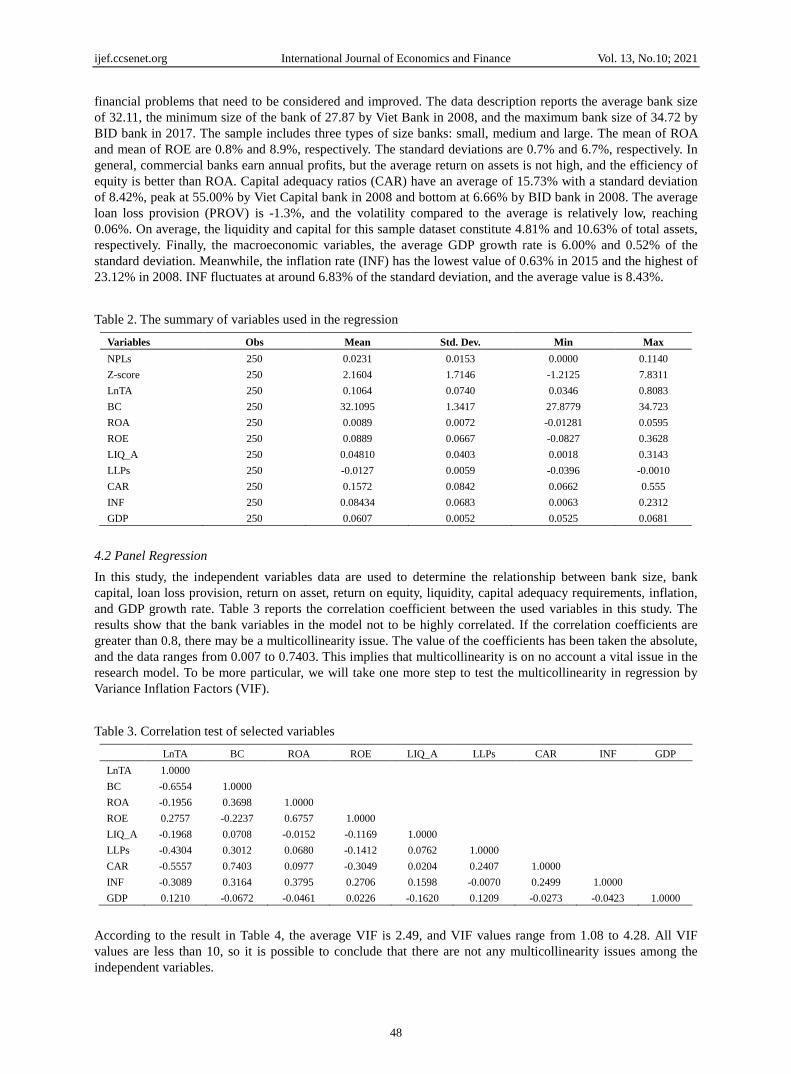
In this research, we have 250 bank-year observations for 25 Vietnamese commercial banks over 10 years. Table
2 reveals the summary statistics for all the variables used in this study. The average NPL is 2.3%, with a standard
deviation of 1.5% and hit the lowest value of 0% by Lien Viet Post Bank in 2008 and reached the highest value
of 11.40% by Sai Gon Commercial Bank (SCB) in 2010. Compared to the limit set by the State Bank of Vietnam
of NPL ratio target under below 3%, almost all banks manage and improve the quality of credits and loans or
have the policy to write off bad debt and change the classification of the loan. The Z-score ratio has the degree of
dispersion among banks from -1.21 to 7.83.
Moreover, the average value of the Z-score is 1.71, and this ratio warns banks over the crisis period to have
ijef.ccsenet.org International Journal of Economics and Finance Vol. 13, No.10; 2021
48
financial problems that need to be considered and improved. The data description reports the average bank size
of 32.11, the minimum size of the bank of 27.87 by Viet Bank in 2008, and the maximum bank size of 34.72 by
BID bank in 2017. The sample includes three types of size banks: small, medium and large. The mean of ROA
and mean of ROE are 0.8% and 8.9%, respectively. The standard deviations are 0.7% and 6.7%, respectively. In
general, commercial banks earn annual profits, but the average return on assets is not high, and the efficiency of
equity is better than ROA. Capital adequacy ratios (CAR) have an average of 15.73% with a standard deviation
of 8.42%, peak at 55.00% by Viet Capital bank in 2008 and bottom at 6.66% by BID bank in 2008. The average
loan loss provision (PROV) is -1.3%, and the volatility compared to the average is relatively low, reaching
0.06%. On average, the liquidity and capital for this sample dataset constitute 4.81% and 10.63% of total assets,
respectively. Finally, the macroeconomic variables, the average GDP growth rate is 6.00% and 0.52% of the
standard deviation. Meanwhile, the inflation rate (INF) has the lowest value of 0.63% in 2015 and the highest of
23.12% in 2008. INF fluctuates at around 6.83% of the standard deviation, and the average value is 8.43%.
Table 2. The summary of variables used in the regression
Variables Obs Mean Std. Dev. Min Max
NPLs 250 0.0231 0.0153 0.0000 0.1140
Z-score 250 2.1604 1.7146 -1.2125 7.8311
LnTA 250 0.1064 0.0740 0.0346 0.8083
BC 250 32.1095 1.3417 27.8779 34.723
ROA 250 0.0089 0.0072 -0.01281 0.0595
ROE 250 0.0889 0.0667 -0.0827 0.3628
LIQ_A 250 0.04810 0.0403 0.0018 0.3143
LLPs 250 -0.0127 0.0059 -0.0396 -0.0010
CAR 250 0.1572 0.0842 0.0662 0.555
INF 250 0.08434 0.0683 0.0063 0.2312
GDP 250 0.0607 0.0052 0.0525 0.0681
4.2 Panel Regression
In this study, the independent variables data are used to determine the relationship between bank size, bank
capital, loan loss provision, return on asset, return on equity, liquidity, capital adequacy requirements, inflation,
and GDP growth rate. Table 3 reports the correlation coefficient between the used variables in this study. The
results show that the bank variables in the model not to be highly correlated. If the correlation coefficients are
greater than 0.8, there may be a multicollinearity issue. The value of the coefficients has been taken the absolute,
and the data ranges from 0.007 to 0.7403. This implies that multicollinearity is on no account a vital issue in the
research model. To be more particular, we will take one more step to test the multicollinearity in regression by
Variance Inflation Factors (VIF).
Table 3. Correlation test of selected variables
LnTA BC ROA ROE LIQ_A LLPs CAR INF GDP
LnTA 1.0000
BC -0.6554 1.0000
ROA -0.1956 0.3698 1.0000
ROE 0.2757 -0.2237 0.6757 1.0000
LIQ_A -0.1968 0.0708 -0.0152 -0.1169 1.0000
LLPs -0.4304 0.3012 0.0680 -0.1412 0.0762 1.0000
CAR -0.5557 0.7403 0.0977 -0.3049 0.0204 0.2407 1.0000
INF -0.3089 0.3164 0.3795 0.2706 0.1598 -0.0070 0.2499 1.0000
GDP 0.1210 -0.0672 -0.0461 0.0226 -0.1620 0.1209 -0.0273 -0.0423 1.0000
According to the result in Table 4, the average VIF is 2.49, and VIF values range from 1.08 to 4.28. All VIF
values are less than 10, so it is possible to conclude that there are not any multicollinearity issues among the
independent variables.

ijef.ccsenet.org International Journal of Economics and Finance Vol. 13, No.10; 2021
49
Table 4. VIF test
Variable VIF 1/VIF
BC 4.28 0.233772
ROA 4.18 0.239464
ROE 4.09 0.244260
CAR 2.50 0.400049
LnTA 2.33 0.428304
INF 1.46 0.684231
LLPs 1.32 0.756392
LIQ_A 1.12 0.892565
GDP 1.08 0.924733
Mean VIF 2.49
Next, we use panel data regression with three models: Pooled OLS, Fixed Effects Model (FEM), and Random
Effects Model (REM) to recommend the most suitable model in this research. Table 5 shows the outcomes of the
comparison of the three models.
Table 5. Comparing between pooled OLS, fixed effect model and random effect model
NPLs
Model Test F test P-value Result
Pooled OLS and FEM F test F(24, 216) = 72.35 Prob > F = 0.0000 FEM
Pooled OLS and REM LM (*) chibar2(01) = 5.13 Prob > chibar2 = 0.0118 REM
FEM and REM Hausman chi2(9) = 17.28 Prob>chi2 = 0.0445 FEM
Z-score
Model Test F test P-value Result
Pooled OLS and FEM F test F(24, 216) = 72.35 Prob > F = 0.0000 FEM
Pooled OLS and REM LM (*) F(24, 216) = 72.35 Prob > F = 0.0000 REM
FEM and REM Hausman chi2(9) = 17.20 Prob>chi2 = 0.0456 FEM
(*) LM: The Lagrange Multiplier Test.
F-test compares the pooled OLS and Fixed Effects Model. The p-value is lower than 0.05 (p-value = 0.000), the
null hypothesis is rejected, and FEM outperforms pooled OLS. Moreover, the Lagrange Multiplier test
(Breusch-Pagan Lagrange multiplier - LM) to select between the pooled OLS and REM, which has the result of
p-value also equal to 0.000, referring to the random-effects model to be better than the pooled OLS. Finally, the
Hausman test examines and chooses a more suitable regression model between fixed and random effects. The
null hypothesis of this test is that the favoured model as random effects. There is no doubt that the p-value in
models with dependent variables (NPLs and Z-score) is less than 0.05. It means FEM is the most suitable model.
We use Breusch-Pagan to test for heteroskedasticity of errors in regression. In this test, the null hypothesis is
constant variance. The result is presented in appendix B. With this test, statistics have a p-value below an
appropriate threshold (p-value < 0.05), then the null hypothesis is rejected. In a nutshell, this model has
heteroskedasticity.
This research uses the Wooldridge test for autocorrelation in panel data. Based on the null hypothesis in the test,
it is presumed that there is no autocorrelation. The outcome of this test is presented in appendix C. It can clearly
be seen that the p-values are lower than 0.05, which can refer to as the existing phenomenon of serial correlation.
Since the problem of heteroscedasticity and autocorrelation exist in the regress model, we use robust regression
models with Driscoll-Kraay standard errors. The result is reported as follows:
ijef.ccsenet.org International Journal of Economics and Finance Vol. 13, No.10; 2021
50
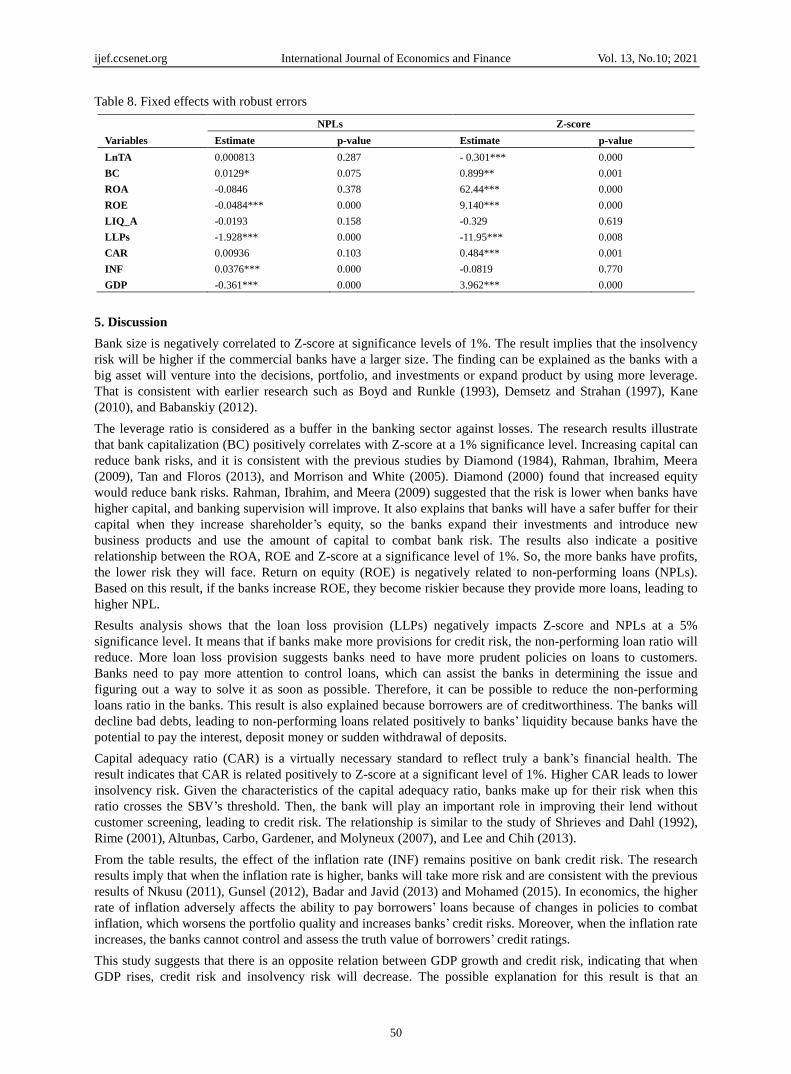
Table 8. Fixed effects with robust errors
NPLs Z-score
Variables Estimate p-value Estimate p-value
LnTA 0.000813 0.287 - 0.301*** 0.000
BC 0.0129* 0.075 0.899** 0.001
ROA -0.0846 0.378 62.44*** 0.000
ROE -0.0484*** 0.000 9.140*** 0.000
LIQ_A -0.0193 0.158 -0.329 0.619
LLPs -1.928*** 0.000 -11.95*** 0.008
CAR 0.00936 0.103 0.484*** 0.001
INF 0.0376*** 0.000 -0.0819 0.770
GDP -0.361*** 0.000 3.962*** 0.000
5. Discussion
Bank size is negatively correlated to Z-score at significance levels of 1%. The result implies that the insolvency
risk will be higher if the commercial banks have a larger size. The finding can be explained as the banks with a
big asset will venture into the decisions, portfolio, and investments or expand product by using more leverage.
That is consistent with earlier research such as Boyd and Runkle (1993), Demsetz and Strahan (1997), Kane
(2010), and Babanskiy (2012).
The leverage ratio is considered as a buffer in the banking sector against losses. The research results illustrate
that bank capitalization (BC) positively correlates with Z-score at a 1% significance level. Increasing capital can
reduce bank risks, and it is consistent with the previous studies by Diamond (1984), Rahman, Ibrahim, Meera
(2009), Tan and Floros (2013), and Morrison and White (2005). Diamond (2000) found that increased equity
would reduce bank risks. Rahman, Ibrahim, and Meera (2009) suggested that the risk is lower when banks have
higher capital, and banking supervision will improve. It also explains that banks will have a safer buffer for their
capital when they increase shareholder’s equity, so the banks expand their investments and introduce new
business products and use the amount of capital to combat bank risk. The results also indicate a positive
relationship between the ROA, ROE and Z-score at a significance level of 1%. So, the more banks have profits,
the lower risk they will face. Return on equity (ROE) is negatively related to non-performing loans (NPLs).
Based on this result, if the banks increase ROE, they become riskier because they provide more loans, leading to
higher NPL.
Results analysis shows that the loan loss provision (LLPs) negatively impacts Z-score and NPLs at a 5%
significance level. It means that if banks make more provisions for credit risk, the non-performing loan ratio will
reduce. More loan loss provision suggests banks need to have more prudent policies on loans to customers.
Banks need to pay more attention to control loans, which can assist the banks in determining the issue and
figuring out a way to solve it as soon as possible. Therefore, it can be possible to reduce the non-performing
loans ratio in the banks. This result is also explained because borrowers are of creditworthiness. The banks will
decline bad debts, leading to non-performing loans related positively to banks’ liquidity because banks have the
potential to pay the interest, deposit money or sudden withdrawal of deposits.
Capital adequacy ratio (CAR) is a virtually necessary standard to reflect truly a bank’s financial health. The
result indicates that CAR is related positively to Z-score at a significant level of 1%. Higher CAR leads to lower
insolvency risk. Given the characteristics of the capital adequacy ratio, banks make up for their risk when this
ratio crosses the SBV’s threshold. Then, the bank will play an important role in improving their lend without
customer screening, leading to credit risk. The relationship is similar to the study of Shrieves and Dahl (1992),
Rime (2001), Altunbas, Carbo, Gardener, and Molyneux (2007), and Lee and Chih (2013).
From the table results, the effect of the inflation rate (INF) remains positive on bank credit risk. The research
results imply that when the inflation rate is higher, banks will take more risk and are consistent with the previous
results of Nkusu (2011), Gunsel (2012), Badar and Javid (2013) and Mohamed (2015). In economics, the higher
rate of inflation adversely affects the ability to pay borrowers’ loans because of changes in policies to combat
inflation, which worsens the portfolio quality and increases banks’ credit risks. Moreover, when the inflation rate
increases, the banks cannot control and assess the truth value of borrowers’ credit ratings.
This study suggests that there is an opposite relation between GDP growth and credit risk, indicating that when
GDP rises, credit risk and insolvency risk will decrease. The possible explanation for this result is that an

ijef.ccsenet.org International Journal of Economics and Finance Vol. 13, No.10; 2021
51
economic growth rate will positively correlate with income, leading to improved ability financial conditions for
borrowers and thus reducing the banks’ bad debt ratio and insolvency risk.
6. Conclusion
In recent years, the complicated movements of risks always built a significant challenge for the banking sector
all over the world and in Vietnam. Banks are affected by a myriad of variables, which vary from internal factors
to external factors. The identification of risk factors is the top priority for banks.
This research examines the fundamental characteristics of commercial banks that affect risk by using a sample
collection from the annual reports of Vietnamese commercial banks over the period of 10 years (2008-2017). We
use the regression model with Driscoll-Kraay standard errors to examine the determinants of bank risk in
Vietnam. The research results illustrate bank risk factors, including internal, capital regulatory, and
macroeconomic variables. For internal variables, size, ROA, ROE, LLP affect bank risk. The capital adequacy
ratio represents capital regulatory; if this ratio increases, the banks will decrease insolvency risk. Besides, the
GDP growth rate has a negative relationship with credit risk and insolvency risk. We also find that inflation has a
significant positive correlation with credit risk. Moreover, there is no relation between liquidity and bank risk in
this research.
From the obtained results, we have some recommendations for controlling the risks of Vietnamese commercial
banks. The global economic crisis affects Vietnam economy, but it is still necessary to maintain economic
growth with government policies. Economic growth can create more profits for investors or individual and
organizational income, improving the borrower’s debts and solvency, thereby declining non-performing loans
(NPLs). CAR helps the bank reduce risk, so banks should have enough capital adequacy. Moreover, bank
capitalization negatively impacts risk. Banks need to have strategies to increase equity to expand operations and
create more new products to compete with other banks. If banks have more capital, they not only improve
financial capacity but also prevent the risk.
References
Adamgbo, S., & Adolphus, J. T. (2019). The Effect of Capital Adequacy on Credit Risk Management among
Commercial Banks in Nigeria; Within the Basel Capital Adequacy Framework. International Journal of
Contemporary Research and Review, 10(7). https://doi.org/10.15520/ijcrr.v10i07.714
Anthony, S., Elizabeth, S., & Nickolaos, G. T. (1990). Ownership Structure, Deregulation, and Bank Risk Taking.
Journal of Finance, 45(2), 643-54. https://doi.org/10.1111/j.1540-6261.1990.tb03709.x
Atoi, N. V. (2018). Non-performing loan and its effects on banking stability: Evidence from national and
international licensed banks in Nigeria. CBN Journal of Applied Statistics, 9(2), 43-74.
https://doi.org/10.33429/Cjas.09218.3/6
Bertrand, R. (2001). Capital requirements and bank behaviours: empirical evidence for Switzerland. Journal of
Banking and Finance, 25(4), 789-805. https://doi.org/10.1016/S0378-4266(00)00105-9
Buthiena, K., Mishiel, S. S., & Ramadan, E. (2019). Nonlinear association between controlling shareholders and
leverage: evidence from Jordan. Afro-Asian Journal of Finance and Accounting, 9(2), 193-212.
https://doi.org/10.1504/AAJFA.2019.099482
Chiaramonte, L., Liu, H., Poli, F., & Zhou, M. (2016). How accurately can Z‐score predict bank failure?
Financial Markets, Institutions & Instruments, 25(5), 333-360. https://doi.org/10.1111/fmii.12077
Demirguc-Kunt, A., & Huizinga, H. (2000). Financial structure and bank profitability. World Bank Mimeo.
https://doi.org/10.1596/1813-9450-2430
El-Khoury, R. (2020). Regulation, bank capital, and bank risk: Evidence from the Lebanese banking industry.
Journal of Banking Regulation, 21, 241-255. https://doi.org/10.1057/s41261-019-00111-2
Ha, N., & Quyen, P. (2018). The Impact of Funding Liquidity on Risk-taking Behaviour of Vietnamese Banks:
Approaching by Z-Score Measure. International Journal of Economics and Financial Issues, 8(3), 29-35.
Haq, M., & Heaney, R. (2012). Factors determining European bank risk. Journal of International Financial
Market Institutions, and Money, 22, 696-718. https://doi.org/10.1016/j.intfin.2012.04.003
Hien, N., & Giang, C. (2020). Competition, risk and profitability in banking system – Evidence from Vietnam.
The Singapore Economic Review, 65(6). https://doi.org/10.1142/S0217590820500137
Homölle, S. (2008). Does transparency restrict banks’ risk taking? Working Paper.

ijef.ccsenet.org International Journal of Economics and Finance Vol. 13, No.10; 2021
52
Jensen, M., & Meckling, W. (1976). Theory of the Firm: Managerial Behavior, Agency Costs and Ownership
Structure. Journal of Finance Economics, 3(4), 305-360. https://doi.org/10.1016/0304-405X(76)90026-X
Jimenez, G., & Jesus, S. (2005). Credit cycles, credit risk, and prudential regulation. Banco de Espana, January.
https://www.ijcb.org/journal/ijcb06q2a3.htm
Kadri, M., & David, G. M. (2009). Explaining bank distress in Eastern European transition economies. Journal
of Banking & Finance, 33(2), 244-253. https://doi.org/10.1016/j.jbankfin.2008.07.016
Kadri, M., & David, M. (2009). Explaining bank distress in Eastern European transition economies. Journal of
Banking & Financ, 33(2), 244-253. https://doi.org/10.1016/j.jbankfin.2008.07.016
Kobia, A. M. (2018). Effect of inflation rate on profitability of commercialbanks in Kenya. Rerieved from
http://erepository.uonbi.ac.ke/bitstream/handle/11295/105453/Kobia
Laeven, L., Ratnovski, L., & Tong, H. (2014). Bank Size and Systemic Risk. https://doi.org/10.2139/ssrn.2437729
Louzis, D. P., Vouldis, A. T., & Metaxas, V. L. (2012). Macroeconomic and bank-specific determinants of
non-performing loans in Greece: A comparative study of mortgage, business and consumer loan portfolios.
Journal of Banking & Finance, 36(4), 1012-1027. https://doi.org/10.1016/j.jbankfin.2011.10.012
Martynova, N., Ratnovski, L., & Vlahu, R. (2015). Bank Profitability and Risk-Taking. International Monetary
Fund. IMF Working Paper. https://doi.org/10.5089/9781513517582.001
Maseke, B. F., & Swartz, E. M. (2020). Risk Management Impact on Non-Performing Loans and Profitability in
the Namibian Banking Sector. Open Access Library Journal, 8, e6943.
https://doi.org/10.4236/oalib.1106943
Miller, S. M., & Noulas, A. (1997). Portfolio mix and large bank profitability in the USA. Applied Economics,
29(4), 505-512. https://doi.org/10.1080/000368497326994
Mongid, A., Tahir, I. Z., & Haron, S. (2012). The Relationship between Inefficiency, Risk and Capital: Evidence
from Commercial Banks in ASEAN. International Journal of Economics and Management, 6(1), 58-74.
http://www.ijem.upm.edu.my/vol6no1/bab04.pdf
Morrison, A. D., & White, L. (2005). Crisis and capital requirements in banking. American Economic Review.
https://doi.org/10.1111/j.1540-6261.1990.tb03709.x
Muhammad, S. K., Harald, S., & Eliza, W. (2017). Funding liquidity and bank risk taking. Journal of Banking &
Finance, 82(C), 203-216. https://doi.org/10.1016/j.jbankfin.2016.09.005
Myra, V. De L. (2020). The impact of credit risk and macroeconomic factors on profitability: The case of the
ASEAN banks. Banks and Bank Systems, 15(1), 21-29. https://doi.org/10.21511/bbs.15(1).2020.03
Noman, A. H. M., Pervin, S., Chowdhury, M. M., & Banna, H. (2015). The Effect of Credit Risk on the Banking
Profitability: A Case on Bangladesh. Global Journal of Management and Business Research: C Finance,
15(3), 41-48. https://doi.org/10.20525/ijfbs.v9i3.874
Pasiouras, F., & Kosmidou, K. (2007). Factors influencing the profitability of domestic and foreign commercial
banks in the European Union. International Business and Finance, 21, 222-237.
https://doi.org/10.1016/j.ribaf.2006.03.007
Patrick, O. N., Ikenna, J. E., & Ekemezie, L. I. (2017). The Impact of Credit Risk Management on Deposit
Money Banks Performance in Nigeria. Nigerian Journal of Management Sciences, 6(1).
Roy, A. D. (1952). Safety First and the Holding of Assets. Econometrica, 20, 431-449.
https://doi.org/10.2307/1907413
Salas, V., & Saurina, J. (2002). Credit risk in two institutional regimes: Spanish commercial and savings banks.
Journal of Financial Services Research, 22, 203-224. https://doi.org/10.1023/A:1019781109676
Sanjai, B., Brian, J. B., & Jun, L. (2012). Size, Leverage, and Risk-Taking of Financial Institutions. Journal of
Banking and Finance, 59. https://doi.org/10.1016/j.jbankfin.2015.06.018
Siddika, A., & Haron, R. (2020). Capital regulation and ownership structure on bank risk. Journal of Financial
Regulation and Compliance, 28(1), 39-56. https://doi.org/10.1108/JFRC-02-2019-0015
Tan, Y. (2016). The impacts of risk and competition on bank profitability in China. Journal of International
Financial Markets, Institutions and Money, 40, 85-110. https://doi.org/10.1016/j.intfin.2015.09.003
Tan, Y., & Floros, C. (2013). Risk, Capital and efficiency in Chinese banking. Journal of International Financial

ijef.ccsenet.org International Journal of Economics and Finance Vol. 13, No.10; 2021
53
Markets, Institutions and Money, 26, 378-393. https://doi.org/10.1016/j.intfin.2013.07.009
Zhichao, Z., Li, X., Xiangyun, L., & Zhuang, Z. (2014). Determinants of financial distress in u.s. large bank
holding companies. Contemporary Economic Policy: A Journal of Western Economic Association
International, 34(2), 250-267. https://doi.org/10.1111/coep.12105
Appendix A
The List Vietnamese Commercial Banks
No. Bank Abbreviation
1 An Binh Bank ABBANK
2 Asia Commercial Joint Stock Bank ACB
3 Vietnam Bank for Agriculture and Rural Development Agribank
4 JSC Bank for Investment and Development of Vietnam BID
5 Vietnam Joint Stock Commercial Bank for Industry and Trade CTG
6 Vietnam Joint Stock Commercial Vietnam Export Import Bank EIB
7 Ho Chi Minh City Housing Development Bank HDBank
8 Kien Long Commercial Joint Stock Bank KienLongBank
9 Joint stock commercial Lien Viet postal bank LPB
10 Military Commercial Joint Stock Bank MB
11 Vietnam Maritime Joint - Stock Commercial Bank MSB
12 Nam A commercial Join Stock Bank Nam A Bank
13 National Citizen Bank NCB
14 Joint Stock Commercia Petrolimex Bank PG Bank
15 Saigon Commercial Bank SCB
16 Southeast Asia Commercial Joint Stock Bank SeABank
17 Saigon Thuong Tin Commercial Joint Stock Bank SGB
18 Saigon - Hanoi Commercial Joint Stock Bank SHB
19 Sai Gon Thuong Tin Commercial Joint Stock Bank STB
20 VietNam Technological and Commercial Joint Stock Bank TCB
21 Joint Stock Commercial Bank for Foreign Trade of Vietnam VCB
22 Vietnam International and Commercial Joint Stock Bank VIB
23 Vietnam Thuong Tin Commercial Joint Stock Bank VietBank
24 Viet Capital Bank VietCapitalBank
25 Vietnam Prosperity Joint-Stock Commercial Bank VPBank
Appendix B
Table B1. Heteroskedasticity test
Test F test P-value Result
NPLs Breusch-Pagan Chi2(1) = 79.47 0.0000 Heteroskedasticity
Z-score Breusch-Pagan Chi2(1) = 96.59 0.0000 Heteroskedasticity
Table B2. Autocorrelation test
Test F test P-value Result
NPLs Wooldridge test F(1, 24) = 10.021 0.0042 Autocorrelation
Z-score Wooldridge test F(1, 24) = 4.441 0.0457 Autocorrelation
Copyrights
Copyright for this article is retained by the author(s), with first publication rights granted to the journal.
This is an open-access article distributed under the terms and conditions of the Creative Commons Attribution
license (http://creativecommons.org/licenses/by/4.0/).