The Mechanical Invariance Factor in Musical Acoustics and ...

Factor Structure and Invariance in the UDS Neuropsychological
Test Battery
KM Hayden, RN Jones, C Zimmer, BL Plassman, JN Browndyke, C Pieper, LH Warren,
KA Welsh-Bohmer
No disclosures
Background
• The UDS battery was developed to tap cognitive domains affected in MCI and AD
– Attention, speed of processing, executive function, episodic memory, and language
• The construct validity of the battery has not been formally tested
Joseph and Kathleen BryanAlzheimer’s Disease Research Center
Background
• Factor analysis and invariance testing can be used to evaluate construct validity
– Factor analysis Validity: the battery tests what it is supposed to test
– Invariance testing Reliability: evidence that the factor structure is stable
Joseph and Kathleen BryanAlzheimer’s Disease Research Center

Objective
• To examine the factor structure of the UDS battery and the level of invariance across groups and over time.
Joseph and Kathleen BryanAlzheimer’s Disease Research Center

Methods
• Data from 14,428 NACC participants with initial UDS batteries as of May 5, 2008
• Protocols approved by local IRBs
• Samples drawn from clinic and community volunteers
• Informed consent obtained
• Standardized protocol administered at ADCs across the US
Joseph and Kathleen BryanAlzheimer’s Disease Research Center

Statistical Analysis
• Exploratory Factor Analysis (EFA)
– Empirical model development
• Confirmatory Factor Analysis (CFA)
– Confirm empirical model
• Invariance Testing
– Analyze levels of invariance across three different groups defined by CDR and over time within CDR group
Joseph and Kathleen BryanAlzheimer’s Disease Research Center

Sample Selection
Joseph and Kathleen BryanAlzheimer’s Disease Research Center
14,428
811
1,080
517 12,020
6,010 6,010
Under 55
English not primary lang
Missing scores
Analytic Sample
Excluded Group:Younger Low MMSEFemale Non-whiteLow edu
Classified into three groups by CDR

Sample Characteristics
CharacteristicCDR= 0.0 “Normal”N=4,780
CDR= 0.5“MCI”
N=4,081
CDR> 0.5“Dementia”
N=3,159Total
n=12,020
Baseline Age (SD) 74.7 (8.9) 75.5 (8.7) 76.9 (9.0) 75.6 (8.9)
Sex= Female (%) 3,142 (65.7) 2,072 (50.8) 1,657 (52.5) 6,871 (57.2)
Race=White (%) 3,925 (82.3) 3,450 (84.8) 2,618 (83.0) 9,993 (83.3)
Education (SD) 15.4 (2.8) 15.0 (3.2) 14.2 (3.3) 15.0 (3.1)
Baseline MMSE (SD)
28.8 (1.5) 26.4 (3.5) 19.3 (6.1) 25.5 (5.4)
Joseph and Kathleen BryanAlzheimer’s Disease Research Center
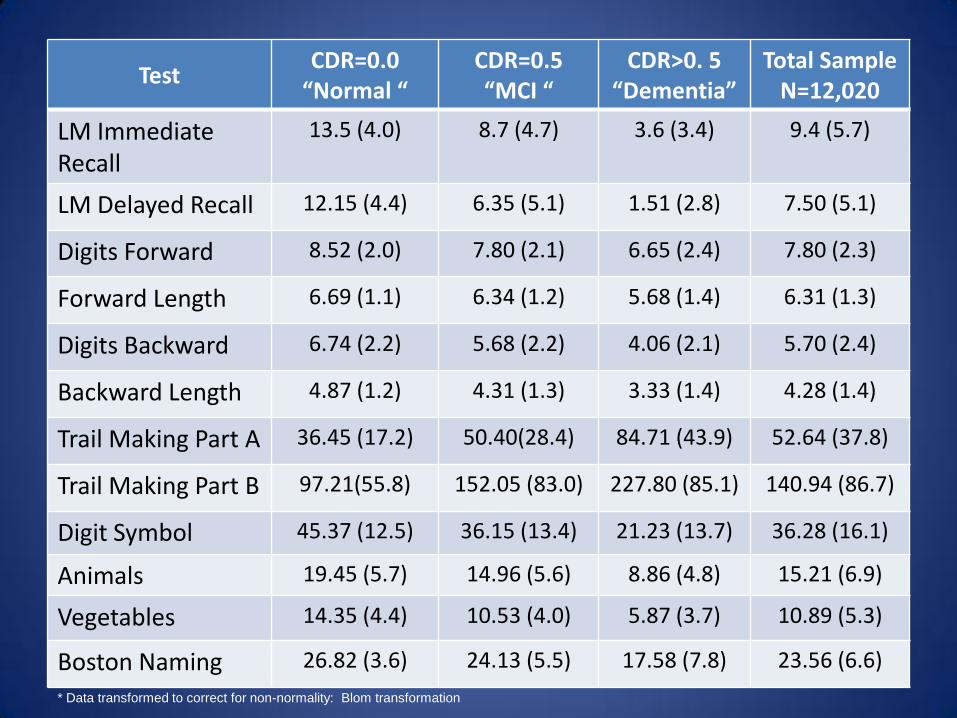
TestCDR=0.0
“Normal “CDR=0.5 “MCI “
CDR>0. 5 “Dementia”
Total SampleN=12,020
LM Immediate Recall
13.5 (4.0) 8.7 (4.7) 3.6 (3.4) 9.4 (5.7)
LM Delayed Recall 12.15 (4.4) 6.35 (5.1) 1.51 (2.8) 7.50 (5.1)
Digits Forward 8.52 (2.0) 7.80 (2.1) 6.65 (2.4) 7.80 (2.3)
Forward Length 6.69 (1.1) 6.34 (1.2) 5.68 (1.4) 6.31 (1.3)
Digits Backward 6.74 (2.2) 5.68 (2.2) 4.06 (2.1) 5.70 (2.4)
Backward Length 4.87 (1.2) 4.31 (1.3) 3.33 (1.4) 4.28 (1.4)
Trail Making Part A 36.45 (17.2) 50.40(28.4) 84.71 (43.9) 52.64 (37.8)
Trail Making Part B 97.21(55.8) 152.05 (83.0) 227.80 (85.1) 140.94 (86.7)
Digit Symbol 45.37 (12.5) 36.15 (13.4) 21.23 (13.7) 36.28 (16.1)
Animals 19.45 (5.7) 14.96 (5.6) 8.86 (4.8) 15.21 (6.9)
Vegetables 14.35 (4.4) 10.53 (4.0) 5.87 (3.7) 10.89 (5.3)
Boston Naming 26.82 (3.6) 24.13 (5.5) 17.58 (7.8) 23.56 (6.6)
* Data transformed to correct for non-normality: Blom transformation

Exploratory Factor AnalysisFive Factor Solution
TestFull
SampleCDR=0.0 CDR=0.5 CDR>0.5
CFI 0.999 1.0 0.999 0.998
TLI 0.997 0.998 0.996 0.993
RMSEA 0.019 0.013 0.019 0.024
SRMR 0.003 0.004 0.004 0.006
CFI: Comparative Fit Index >=0.90
TLI: Tucker-Lewis Index >= 0.90
RMSEA: Root mean square error of approx <=0.05
SRMR: Standardized root mean square residual <=0.05

Confirmatory Factor Analysis
Joseph and Kathleen BryanAlzheimer’s Disease Research Center
TestFull Sample Multiple
Group5 Factor 4 Factor
CFI 0.848 0.989 0.985
TLI 0.833 0.985 0.978
RMSEA 0.128 0.045 0.047
SRMR 0.381 0.019 0.029
Model constraints: means=0, variances=1.0

LM Recall
Digits F
Digits B
Trails A
Trails B
Digit Symb
Animals
Veg
ε
ε
ε
ε
ε
ε
ε
ε
ε
ε
ε
DF Length
8
7
5
6
9
1
1
0
3
Executive
Attention
Language
LM Immed
Boston 1
1
ε 2
2
4
DB Length
Memory

Executive
ε
ε
ε
ε
ε
ε
5
6
3
1
2
4
Speed
LM Recall
Digits F
Digits B
DF Length Attention
LM Immed
DB Length
Memory
Digit Symb ε 9
Trails B ε 8
Trails A ε 7
Animals
Veg Language
Boston
ε
ε
1
1
0
1 ε 2
1
Adapted from Weintraub, Alzheimer Dis Assoc Disord , 2009
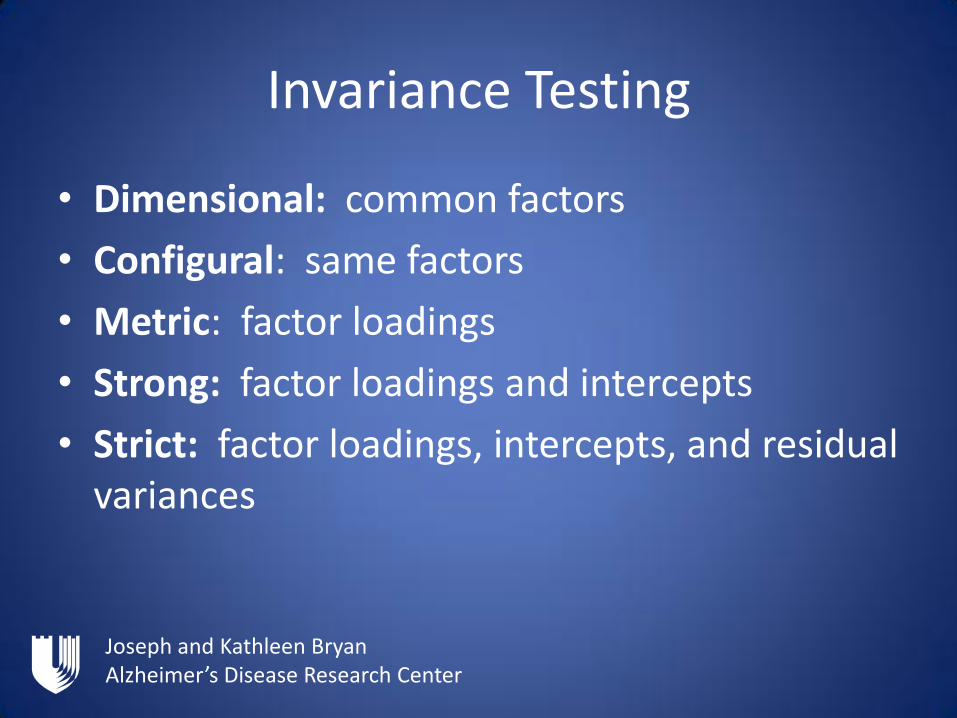
Invariance Testing
• Dimensional: common factors
• Configural: same factors
• Metric: factor loadings
• Strong: factor loadings and intercepts
• Strict: factor loadings, intercepts, and residual variances
Joseph and Kathleen BryanAlzheimer’s Disease Research Center

ResultsModel 1
Configural Invariance
Model 2Metric
Invariance
Model 3Strong
Invariance
Model 4Strict
Invariance
CFI 0.985 0.975 0.967 0.957
TLI 0.978 0.969 0.963 0.958
RMSEA 0.047 0.055 0.060 0.064
SRMR 0.029 0.065 0.072 0.071
BIC -460.77 -254.30 -70.33 112.90
Joseph and Kathleen BryanAlzheimer’s Disease Research Center
BIC: Bayesian information criterion <0.0

LM Recall
Digits F
Digits B
Trails A
Trails B
Digit Symb
Animals
Veg
ε
ε
ε
ε
ε
ε
ε
ε
ε
ε
ε
DF Length
8
7
5
6
9
1
1
0
3
Executive
Attention
Language
LM Immed
Boston 1
1
ε 2
2
4
DB Length
Memory

ResultsModel 3Strong
Invariance
Model 3 ModsStrong
Invariance
Model 4Strict
Invariance
Model 4 ModsStrict
Invariance
CFI 0.967 0.978 0.957 0.968
TLI 0.963 0.975 0.958 0.968
RMSEA 0.060 0.050 0.064 0.056
SRMR 0.072 0.051 0.071 0.052
BIC -70.33 -473.10 112.90 -267.17
Joseph and Kathleen BryanAlzheimer’s Disease Research Center

ResultsOver 1 year lag time
Joseph and Kathleen BryanAlzheimer’s Disease Research Center
Strict Invariance Models
CDR=0.0 CDR=0.5 CDR>0.5
CFI 0.984 0.984 0.988
TLI 0.983 0.983 0.987
RMSEA 0.042 0.040 0.038
SRMR 0.030 0.033 0.036
BIC -390.92 -536.81 -601.56

Limitations
• Specialized sample
⁻ Clinic based samples
⁻ Community volunteers
• Classification with CDR
• Limitations of the tests and battery
Joseph and Kathleen BryanAlzheimer’s Disease Research Center
Conclusions
The NACC battery factor structure
• Approximates the hypothesized model
• Approaches the level of strict invariance
• Demonstrates invariance within group over a 1 year lag time.
Joseph and Kathleen BryanAlzheimer’s Disease Research Center

Acknowledgments
• Co-Authors– Rich Jones– Cathy Zimmer– Brenda Plassman– Jeff Browndyke– Carl Pieper– Lauren Warren– Kathie Welsh-Bohmer
• Funding– K01 AG 029336– NACC Jr. Investigator 2008-JI-02
• NACC– Bud Kukull– Leslie Phillips
• Study Participants