Factor Alignment Effects in Portfolio Construction -...
38
1 ©2014 MSCI Inc. All rights reserved. msci.com msci.com msci.com Factor Alignment Effects in Portfolio Construction Jyh-Huei Lee Jose Menchero
Transcript of Factor Alignment Effects in Portfolio Construction -...

1 ©2014 MSCI Inc. All rights reserved. msci.com msci.com msci.com
Factor Alignment Effects in Portfolio Construction Jyh-Huei Lee
Jose Menchero

2 ©2014 MSCI Inc. All rights reserved. msci.com
Outline
Capturing Factor Premia
Simple, pure, and minimum-volatility factor portfolios
Alpha factors, risk factors, and portfolio optimization
Should Alpha Factors be Included in Risk Model?
Alpha/risk factor “misalignment”
Simulation framework
Effect of Sample Size (length of estimation window)
Impact of Long-Only Constraint
Empirical Results
Technical Appendix
Summary

3 ©2014 MSCI Inc. All rights reserved. msci.com 3 msci.com 3 msci.com
Capturing Factor Premia

4 ©2014 MSCI Inc. All rights reserved. msci.com
Different Ways of Capturing Risk Premia
Simple Factor Portfolios
Provide unit exposure to particular style
Portfolio has non-zero exposures to all other risk factors
Portfolios weights are obtained by univariate regression
Pure Factor Portfolios
Provide unit exposure to particular style
Portfolio has zero exposures to all other risk factors
Portfolios weights are obtained by multivariate regression
Minimum-Volatility Factor Portfolios
Provide unit exposure to particular style
Portfolio has non-zero exposures to all other risk factors
Portfolio weights are obtained via mean-variance optimization
5 ©2014 MSCI Inc. All rights reserved. msci.com
Year
1996 1998 2000 2002 2004 2006 2008 2010 2012
Cu
mu
lati
ve R
etu
rn (
Per
cen
t)
-30
-20
-10
0
10
20
30
40
50
Simple E/P
Pure E/P
Min-Vol E/P
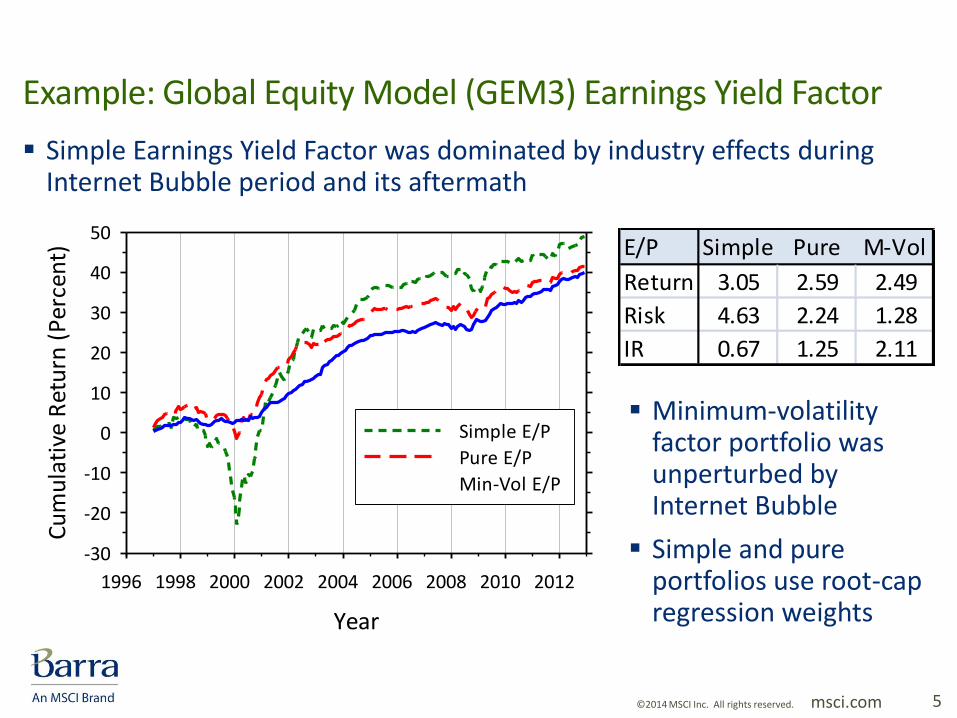
Example: Global Equity Model (GEM3) Earnings Yield Factor
Simple Earnings Yield Factor was dominated by industry effects during Internet Bubble period and its aftermath
E/P Simple Pure M-Vol
Return 3.05 2.59 2.49
Risk 4.63 2.24 1.28
IR 0.67 1.25 2.11
Minimum-volatility factor portfolio was unperturbed by Internet Bubble
Simple and pure portfolios use root-cap regression weights

6 ©2014 MSCI Inc. All rights reserved. msci.com
Using Optimization to Reduce Portfolio Risk
Portfolio optimization is designed to produce portfolios with the highest possible risk-adjusted performance (subject to investment constraints)
Optimized portfolios will have the lowest predicted risk of all portfolios for a given level of expected return (alpha)
Optimization employs risk models to reduce risk in two ways:
1) By using risk factors to hedge alpha factor risk
2) By diversifying the specific risk of the portfolio
Notes:
Alpha risk can only be hedged with risk factors if the alpha signal contains true systematic risk (i.e., the alpha factor must be a valid risk factor)
Even if the alpha factor contains systematic risk, correlations must be reliably estimated to avoid spurious hedges

7 ©2014 MSCI Inc. All rights reserved. msci.com
Alpha Factors versus Risk Factors
Customarily, risk models do not explicitly distinguish between “alpha” factors and “risk” factors
Such distinction is important for portfolio construction purposes
Definitions:
Risk factors represent systematic drivers of equity return co-movement
Alpha factors represent sources of directional “drift”
Categories are not mutually exclusive:
Risk Factor?
Alpha Factor?
Yes No
Yes Momentum Unique PM Signal
No Industry/Country Random Signal

8 ©2014 MSCI Inc. All rights reserved. msci.com
Illustrating the Factor Types
Year
0 2 4 6 8 10 12 14 16 18 20
Cu
mu
lati
ve R
etu
rn (
Per
cen
t)
-10
0
10
20
30
40
50
Alpha & Risk
Alpha Only
Risk Only
Even over 20-year period, the standard error in IR is quite large (0.22)
The volatility of the alpha factor is purely specific
Managers with skill may underperform for years
Simulated Returns
Alpha Alpha Risk
Measure & Risk Factor Factor
Risk (ex ante ) 2.86 0.76 2.86
Risk (ex post ) 2.74 0.75 3.04
IR (ex ante ) 0.96 1.00 0.00
IR (ex post ) 0.84 0.91 -0.08
Summary Table

9 ©2014 MSCI Inc. All rights reserved. msci.com 9 msci.com 9 msci.com
Should Alpha Factors be Included in Risk Model?

10 ©2014 MSCI Inc. All rights reserved. msci.com
Interplay of Alpha Factors and Risk Factors in Optimization
Alpha signal contains a component within the factor space (spanned alpha) and a component orthogonal to the factors (residual alpha):
Alpha Signal XX
Spanned Alpha
Residual Alpha
X
hh
Xh
Optimization
Optimization tends to put more weight on residual alpha:
Alpha Vector
Holdings Vector
If residual alpha contains true factor risk, the optimization may allocate the risk budget inefficiently, leading to a potential drop in portfolio IR

11 ©2014 MSCI Inc. All rights reserved. msci.com
Transfer Coefficient
Investment constraints force the actual portfolio P to deviate from the ideal portfolio Q
P Q P
P
P QIR IR Transfer Coefficient
P P QR R R
Portfolio you own
Portfolio you want
Residual Portfolio
Residual portfolio contributes to risk, but not to expected return
Compute betas and correlations relative to ideal portfolio Q
TC measures loss in efficiency

12 ©2014 MSCI Inc. All rights reserved. msci.com
Simulation Framework
Assume the true risk model (T) is based off Barra US Equity Model (USE4)
Assume one of the USE4 style factors represents the true alpha signal
Construct the true optimal portfolio
Unfortunately, investors do not have luxury of knowing true risk model; they must estimate it from available data
Generate time series of simulated stock returns for USE4 universe
Estimate two risk models from the simulated stock returns:
Model A uses the full factor set from USE4
Model B uses USE4 factors but omits one of the style factors (alpha)
Construct optimal portfolios using models A and B
Compute the true TC of the portfolios using Model T:
TP
andA BP P
,A T A TTC P P ,B T B TTC P P

13 ©2014 MSCI Inc. All rights reserved. msci.com
Two Important Cases to Consider
Model A now uses the true factor structure
Model B factor structure is now misspecified:
It has omitted a true risk factor
Simulate stock returns using Model T (full USE4 model)
Model A factor structure is now misspecified
It has included a spurious risk factor
Model B now uses the true factor structure
Simulate stock returns using Model T (USE4 omitting alpha)
Case 1: Alpha factor is a valid risk factor
Case 2: Alpha factor is a spurious risk factor
Case 1 Case 2
Model AAlpha Valid
Alpha Included
Alpha Spurious
Alpha Included
Model BAlpha Valid
Alpha Omitted
Alpha Spurious
Alpha Omitted

14 ©2014 MSCI Inc. All rights reserved. msci.com
Case 1 Results (Alpha is a Valid Risk Factor)
For each date, simulate 200 periods of stock returns from USE4
Estimate risk models A and B using simulated data (200 observations)
On average, we found a 3 percent gain in IR by
including the valid alpha factor in the risk model
December 2013 Sample Average
Alpha Factor TC(A) TC(B) TC(A) TC(B)
Growth 0.86 0.94 0.85 0.88
Size 0.86 0.83 0.86 0.81
Non-linear Size 0.86 0.86 0.87 0.84
Dividend Yield 0.87 0.91 0.86 0.87
Book-to-Price 0.85 0.88 0.85 0.87
Earnings Yield 0.87 0.91 0.86 0.85
Beta 0.83 0.46 0.84 0.53
Residual Volatility 0.86 0.75 0.85 0.71
Non-linear Beta 0.86 0.91 0.86 0.85
Momentum 0.87 0.89 0.87 0.86
Leverage 0.85 0.83 0.86 0.84
Liquidity 0.85 0.84 0.84 0.80
Average (ex Beta) 0.86 0.87 0.86 0.83Sample period: Dec-1998 to Dec-2013
Repeat exercise 10,000 times and compute the average TC
Beta factor is an anomaly:
Country factor provides near perfect hedge

15 ©2014 MSCI Inc. All rights reserved. msci.com
Transfer Coefficient over Time (Case 1)
The average difference in TC was small (about 3 percent)
Differences were slightly larger during crisis periods
Model B outperformed slightly during calm periods
Note that USE4 factors were selected for their strength
Thus, Model B omits an important risk factor
Case 1(Valid Alpha)
Year
1999 2002 2005 2008 2011 2014
Tran
sfer
Coe
ffic
ient
0.70
0.75
0.80
0.85
0.90
0.95
1.00Model A (alpha included)Model B (alpha omitted)

16 ©2014 MSCI Inc. All rights reserved. msci.com
Case 2 Results (Alpha is a Spurious Risk Factor)
December 2013 Sample Average
Alpha Factor TC(A) TC(B) TC(A) TC(B)
Growth 0.80 0.99 0.79 0.99
Size 0.77 0.98 0.78 0.98
Non-linear Size 0.78 0.98 0.79 0.98
Dividend Yield 0.79 0.98 0.78 0.98
Book-to-Price 0.80 0.98 0.79 0.98
Earnings Yield 0.79 0.98 0.80 0.98
Beta 0.78 0.97 0.78 0.97
Residual Volatility 0.76 0.97 0.77 0.98
Non-linear Beta 0.80 0.99 0.81 0.99
Momentum 0.80 0.98 0.80 0.98
Leverage 0.80 0.98 0.79 0.98
Liquidity 0.77 0.98 0.78 0.98
Average (all factors) 0.79 0.98 0.79 0.98
On average, we found a 20 percent drop in IR by
including a spurious alpha factor in the risk model
Repeat exercise 10,000 times and compute the average TC
Adding a spurious factor to risk model harmed portfolio
Sample period: Dec-1998 to Dec-2013
For each date, simulate 200 periods of stock returns using Model T (i.e., USE4 but with the alpha factor deleted)
Estimate risk models A and B using simulated data (200 observations)
17 ©2014 MSCI Inc. All rights reserved. msci.com
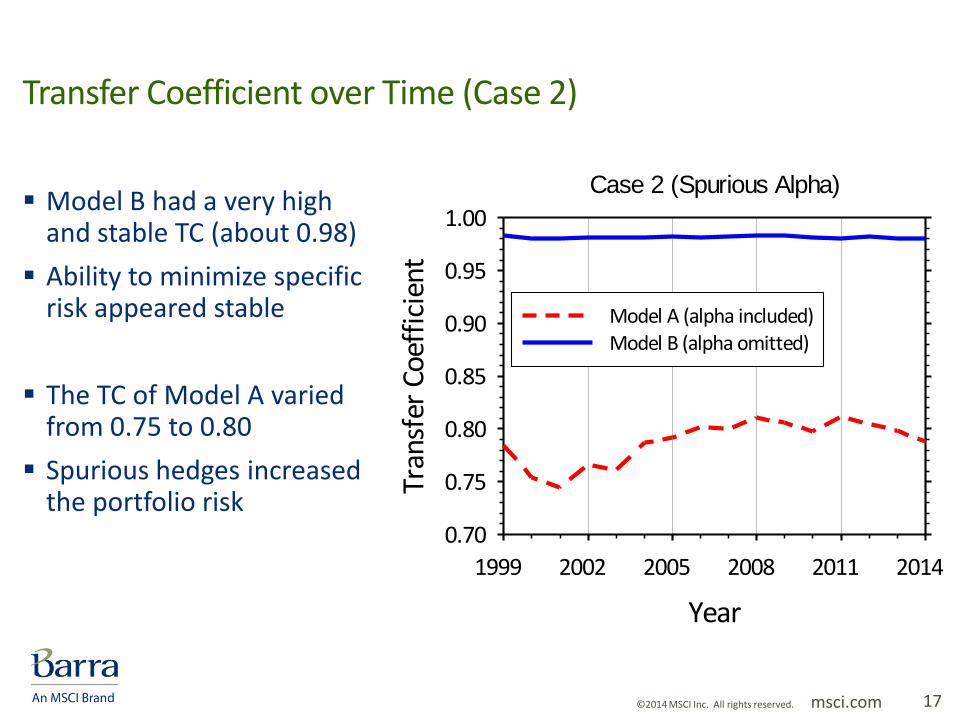
Transfer Coefficient over Time (Case 2)
Model B had a very high and stable TC (about 0.98)
Ability to minimize specific risk appeared stable
The TC of Model A varied from 0.75 to 0.80
Spurious hedges increased the portfolio risk
Case 2 (Spurious Alpha)
Year
1999 2002 2005 2008 2011 2014
Tran
sfer
Coe
ffic
ient
0.70
0.75
0.80
0.85
0.90
0.95
1.00
Model A (alpha included)Model B (alpha omitted)

18 ©2014 MSCI Inc. All rights reserved. msci.com 18 msci.com 18 msci.com
Effect of Sample Size

19 ©2014 MSCI Inc. All rights reserved. msci.com
Effect of Window Length (Case 1)
For Model A, short windows harmed the portfolio IR due to spurious hedging
Model A benefited from optimization when the correlations were reliably estimated
Model B was not sensitive to the window length since factor correlations played little role in this case
Case 1(Valid Alpha)
Length of Estimation Window (L)
100 200 300 400 500 600 700 800
Tran
sfer
Coe
ffic
ient
0.70
0.75
0.80
0.85
0.90
0.95
1.00
Model A (alpha included)Model B (alpha omitted)
Average over all factors (exclude Beta) Dec-2013

20 ©2014 MSCI Inc. All rights reserved. msci.com
Effect of Window Length (Case 2)
Adding a spurious alpha factor to the risk model hurt the portfolio IR
The inflicted damage decreased as the window length expanded
Factor correlations were much less important for Model B
Case 2 (Spurious Alpha)
Length of Estimation Window (L)
100 200 300 400 500 600 700 800
Tran
sfer
Coe
ffic
ient
0.65
0.70
0.75
0.80
0.85
0.90
0.95
1.00
Model A (alpha included)
Model B (alpha omitted)
Average over all factors (exclude Beta) Dec-2013

21 ©2014 MSCI Inc. All rights reserved. msci.com
Correlation Half-Life (Days)
0 100 200 300 400 500
Vo
lati
lity
(An
nu
aliz
ed)
8.0
8.5
9.0
9.5
10.0
10.5
Min Risk Fully Invested
Vo
lati
lity
(Per
cen
t)
Optimal Window Length
Construct the minimum-volatility fully invested portfolio (USE4D)
Observe out-of-sample volatility over 17 years (Jan-1997 to Dec-2013)
The optimal half-life
was less than 200 days
Short window lengths contain most relevant data, but have large sampling error
Long window lengths have smaller sampling error, but include more stale data

22 ©2014 MSCI Inc. All rights reserved. msci.com 22 msci.com 22 msci.com
Impact of Long-Only Constraint

23 ©2014 MSCI Inc. All rights reserved. msci.com
Long-Only Constraint (Case 1)
Imposing the long-only constraint reduced TC of both Models A and B
Differences between Models A and B were strongly compressed
Even at 800 periods, the increase in IR was only 3% when valid alpha signal was properly included in the risk model
Average over all factors (exclude Beta) Dec-2013
Case 1(Valid Alpha)
Length of Estimation Window (L)
100 200 300 400 500 600 700 800
Tran
sfer
Coe
ffic
ient
0.50
0.55
0.60
0.65
0.70
0.75
0.80
Model A (alpha included)
Model B (alpha omitted)

24 ©2014 MSCI Inc. All rights reserved. msci.com
Long-Only Constraint (Case 2)
The long-only constraint sharply reduced the TC for both Models A and B
Differences between Models A and B were strongly compressed
Even at 100 periods, the increase in IR was only 5% when alpha was properly omitted from risk model
Average over all factors (exclude Beta) Dec-2013
Case 2 (Spurious Alpha)
Length of Estimation Window (L)
100 200 300 400 500 600 700 800
Tran
sfer
Coe
ffic
ient
0.30
0.35
0.40
0.45
0.50
Model A (alpha included)Model B (alpha omitted)

25 ©2014 MSCI Inc. All rights reserved. msci.com 25 msci.com 25 msci.com
Empirical Results

26 ©2014 MSCI Inc. All rights reserved. msci.com
Empirical Study
Start with USE4S risk model
Only consider Case 1 (all USE4 style factors are valid risk factors)
At start of each month, create two optimized portfolios:
Using USE4 with complete factor set (Model A)
Using USE4 with style factor omitted (Model B)
Compute the out-of-sample volatilities of both portfolios
The lower the volatility, the higher the IR for a fixed expected return
The volatility ratio gives the empirical estimate of the TC ratio
( )
( )A B
B A
TC P
TC P
Volatility
Ratio

27 ©2014 MSCI Inc. All rights reserved. msci.com
Empirical Study: Unconstrained Case
USE4S model uses two Newey-West lags (l=2)
The correlation half-life is 504 trading days
The effective number of observations is about 500-700
Simulation results suggest a volatility ratio of 1.09
The empirical volatility ratio (1.11) is in excellent agreement with the simulation results
3
1 ln 2
HLL
l
Effective Number of
Observations
Realized Risk (%) Volatility
Alpha Factor (Model A) (Model B) Ratio
Growth 1.56 1.74 1.11
Size 2.57 2.82 1.10
Non-linear Size 2.76 2.59 0.94
Dividend Yield 1.76 1.79 1.02
Book-to-Price 1.82 1.90 1.04
Earnings Yield 2.79 3.05 1.09
Beta 3.09 5.90 1.91
Residual Volatility 2.66 3.44 1.30
Non-linear Beta 1.36 1.71 1.26
Momentum 6.26 6.43 1.03
Leverage 1.64 2.16 1.32
Liquidity 1.76 1.96 1.11
Average (ex Beta) 2.45 2.69 1.11

28 ©2014 MSCI Inc. All rights reserved. msci.com
Empirical Study: Long-Only Constraint
Simulation results for long-only constraint suggest a volatility ratio of 1.04
Simulations were in perfect agreement with the empirical volatility ratio (1.04)
Again, the effect of constraints is to compress differences between the two models
Realized Risk (%) Volatility
Alpha Factor (Model A) (Model B) Ratio
Growth 2.94 3.21 1.09
Size 5.15 5.15 1.00
Non-linear Size 8.98 8.93 0.99
Dividend Yield 2.65 2.75 1.04
Book-to-Price 3.06 3.09 1.01
Earnings Yield 4.69 4.64 0.99
Beta 6.42 6.78 1.06
Residual Volatility 4.49 5.16 1.15
Non-linear Beta 3.42 3.54 1.04
Momentum 6.73 6.79 1.01
Leverage 2.24 2.38 1.06
Liquidity 4.57 4.79 1.05
Average (all factors) 4.45 4.58 1.04

29 ©2014 MSCI Inc. All rights reserved. msci.com
Summary
Factor premia can be captured using simple, pure, or minimum-volatility factor portfolios
Minimum-volatility factor portfolios are the most efficient (ex ante)
Risk models reduce risk in two ways:
By hedging the alpha factor with risk factors
By diversifying away the specific risk
Transfer coefficient is ideally suited to measure portfolio efficiency
Adding a valid alpha factor to the risk model may help improve IR only if the factor correlations can be reliably estimated
Adding a spurious alpha factor to the risk model resulted in a significant drop in portfolio IR

30 ©2014 MSCI Inc. All rights reserved. msci.com 30 msci.com 30 msci.com
Technical Appendix

31 ©2014 MSCI Inc. All rights reserved. msci.com
Simple Factor Portfolios
Provide unit exposure to particular style
No consideration given to other factors
Simple factor portfolios are constructed by univariate regression:
S
n w nk k nr f X f e
0n nkn
w X Mean-zero exposures (regression weighted)
2 1n nkn
w X Unit standard deviation exposures
Sk n nk n
n
f w X r Return of simple factor portfolio k
Portfolio has non-zero exposures to other risk factors
32 ©2014 MSCI Inc. All rights reserved. msci.com
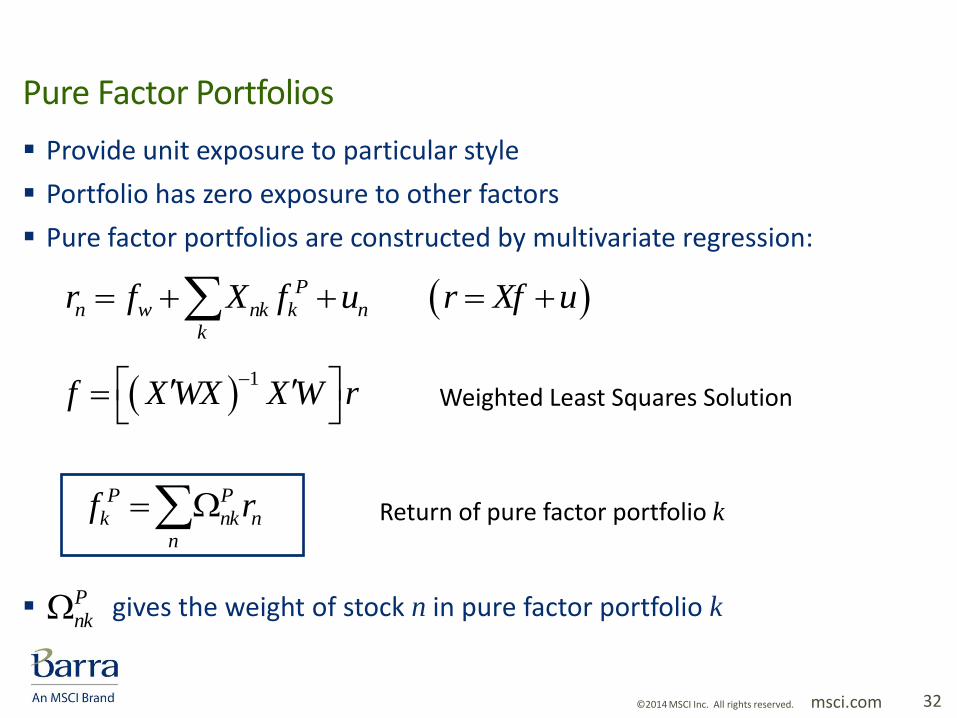
Pure Factor Portfolios
Provide unit exposure to particular style
Portfolio has zero exposure to other factors
Pure factor portfolios are constructed by multivariate regression:
Pn w nk k n
k
r f X f u r Xf u
P Pk nk n
n
f r Return of pure factor portfolio k
gives the weight of stock n in pure factor portfolio k P
nk
1
f X WX X W r
Weighted Least Squares Solution

33 ©2014 MSCI Inc. All rights reserved. msci.com
Minimum-Volatility Factor Portfolios
Provide unit exposure to particular style
Portfolio has minimum risk
Minimum-volatility factor portfolios are constructed by optimization:
1
1
MV kk
k k
V X
X V X
MV MVk nk n
n
f r Return of minimum-volatility factor portfolio k
gives the weight of stock n in minimum-volatility factor portfolio k
Minimum-volatility portfolios form building blocks for combining alpha
MV
nk

34 ©2014 MSCI Inc. All rights reserved. msci.com
Information Ratio Attribution (Ex Ante)
m
mmmm
mm RggxRgxRR
RIR ),()()(;;
)(
m mmm
mmmmm
Rggx
gx
R
RggxIR
),()()(
),()(
“Component IR” “Risk Weight”
Portfolio IR is the risk-weighted average of component IR
Component IR is the stand-alone IR of return source, but magnified by . This represents a diversification benefit.
1

35 ©2014 MSCI Inc. All rights reserved. msci.com
IR Analysis (Case 1)
Alpha is a valid risk factor
Model A has true factor structure
Model B is missing true factor
In Model A, the total portfolio is identical to spanned portfolio
Model B contains both spanned and residual portfolios
In Model B, most of the risk weight is assigned to the residual portfolio, which has a high (true) information ratio
USE4 Leverage factor (Dec-2013)
Total Portfolio Model A Truth Model B Truth
Information Ratio 1.06 0.85 2.34 0.83
Return (bps) 112.4 112.4 112.4 112.4
Risk (bps) 106.5 131.7 48.1 135.4
Risk Weight (%) 100.0 100.0 100.0 100.0
Component IR 1.06 0.85 2.34 0.83
Correlation 1.00 1.00 1.00 1.00
Absolute Weights (%) 122.1 122.1 101.6 101.6
Spanned Portfolio Model A Truth Model B Truth
Information Ratio 1.06 0.85 0.46 0.38
Return (bps) 112.4 112.4 4.3 4.3
Risk (bps) 106.5 131.7 9.4 11.4
Risk Weight (%) 100.0 100.0 3.8 3.0
Component IR 1.06 0.85 2.34 1.06
Correlation 1.00 1.00 0.20 0.36
Absolute Weights (%) 122.1 122.1 9.1 9.1
Residual Portfolio Model A Truth Model B Truth
Information Ratio 0.0 0.0 2.29 0.82
Return (bps) 0.0 0.0 108.1 108.1
Risk (bps) 0.0 0.0 47.1 131.8
Risk Weight (%) 0.0 0.0 96.2 97.0
Component IR 0.0 0.0 2.34 0.82
Correlation 0.0 0.0 0.98 1.00
Absolute Weights (%) 0.0 0.0 100.7 100.7

36 ©2014 MSCI Inc. All rights reserved. msci.com
IR Analysis (Case 2)
Alpha is a spurious risk factor
Model A has included spurious factor
Model B has true factor structure
In Model A, the total portfolio is identical to spanned portfolio
Model B contains both spanned and residual portfolios
In Model B, most of the risk weight is assigned to the residual portfolio, which has a high (true) information ratio
Total Portfolio Model A Truth Model B Truth
Information Ratio 0.73 0.80 1.03 0.98
Return (bps) 48.7 48.7 48.7 48.7
Risk (bps) 66.6 60.9 47.3 49.8
Risk Weight (%) 100.0 100.0 100.0 100.0
Component IR 0.73 0.80 1.03 0.98
Correlation 1.00 1.00 1.00 1.00
Absolute Weights (%) 101.6 101.6 100.3 100.3
Spanned Portfolio Model A Truth Model B Truth
Information Ratio 0.73 0.80 0.22 0.17
Return (bps) 48.7 48.7 2.2 2.2
Risk (bps) 66.6 60.9 10.0 12.6
Risk Weight (%) 100.0 100.0 4.5 6.7
Component IR 0.73 0.80 1.03 0.66
Correlation 1.00 1.00 0.21 0.26
Absolute Weights (%) 101.6 101.6 10.4 10.4
Residual Portfolio Model A Truth Model B Truth
Information Ratio 0.0 0.0 1.01 0.97
Return (bps) 0.0 0.0 46.5 46.5
Risk (bps) 0.0 0.0 46.2 48.0
Risk Weight (%) 0.0 0.0 95.5 93.3
Component IR 0.0 0.0 1.03 1.00
Correlation 0.0 0.0 0.98 0.97
Absolute Weights (%) 0.0 0.0 99.1 99.1USE4 Leverage factor (Dec-2013)

37 ©2014 MSCI Inc. All rights reserved. msci.com 37 msci.com 37 msci.com
MSCI 24 Hour Global Client Service
Asia Pacific
China North 10800.852.1032 (toll free)
China South 10800.152.1032 (toll free)
Hong Kong +852.2844.9333
Seoul 00798.8521.3392 (toll free)
Singapore 800.852.3749 (toll free)
Sydney +61.2.9033.9333
Taipei 008.0112.7513 (toll free)
Tokyo +81.3.5290.1555
Europe, Middle East & Africa
Cape Town +27.21.673.0100
Frankfurt +49.69.133.859.00
Geneva +41.22.817.9777
London +44.20.7618.2222
Milan +39.02.5849.0415
Paris 0800.91.59.17 (toll free)
Americas
Americas 1.888.588.4567 (toll free)
Atlanta +1.404.551.3212
Boston +1.617.532.0920
Chicago +1.312.706.4999
Monterrey +52.81.1253.4020
New York +1.212.804.3901
San Francisco +1.415.836.8800
São Paulo +55.11.3706.1360
Toronto +1.416.628.1007
[email protected] | www.msci.com

38 ©2014 MSCI Inc. All rights reserved. msci.com 38 msci.com 38 msci.com
Notice and Disclaimer This document and all of the information contained in it, including without limitation all text, data, graphs, charts (collectively, the “Information”) is the property of MSCI Inc. or its subsidiaries
(collectively, “MSCI”), or MSCI’s licensors, direct or indirect suppliers or any third party involved in making or compiling any Information (collectively, with MSCI, the “Information Providers”) and is provided for informational purposes only. The Information may not be reproduced or redisseminated in whole or in part without prior written permission from MSCI.
The Information may not be used to create derivative works or to verify or correct other data or information. For example (but without limitation), the Information may not be used to create indexes, databases, risk models, analytics, software, or in connection with the issuing, offering, sponsoring, managing or marketing of any securities, portfolios, financial products or other investment vehicles utilizing or based on, linked to, tracking or otherwise derived from the Information or any other MSCI data, information, products or services.
The user of the Information assumes the entire risk of any use it may make or permit to be made of the Information. NONE OF THE INFORMATION PROVIDERS MAKES ANY EXPRESS OR IMPLIED WARRANTIES OR REPRESENTATIONS WITH RESPECT TO THE INFORMATION (OR THE RESULTS TO BE OBTAINED BY THE USE THEREOF), AND TO THE MAXIMUM EXTENT PERMITTED BY APPLICABLE LAW, EACH INFORMATION PROVIDER EXPRESSLY DISCLAIMS ALL IMPLIED WARRANTIES (INCLUDING, WITHOUT LIMITATION, ANY IMPLIED WARRANTIES OF ORIGINALITY, ACCURACY, TIMELINESS, NON-INFRINGEMENT, COMPLETENESS, MERCHANTABILITY AND FITNESS FOR A PARTICULAR PURPOSE) WITH RESPECT TO ANY OF THE INFORMATION.
Without limiting any of the foregoing and to the maximum extent permitted by applicable law, in no event shall any Information Provider have any liability regarding any of the Information for any direct, indirect, special, punitive, consequential (including lost profits) or any other damages even if notified of the possibility of such damages. The foregoing shall not exclude or limit any liability that may not by applicable law be excluded or limited, including without limitation (as applicable), any liability for death or personal injury to the extent that such injury results from the negligence or willful default of itself, its servants, agents or sub-contractors.
Information containing any historical information, data or analysis should not be taken as an indication or guarantee of any future performance, analysis, forecast or prediction. Past performance does not guarantee future results.
None of the Information constitutes an offer to sell (or a solicitation of an offer to buy), any security, financial product or other investment vehicle or any trading strategy.
You cannot invest in an index. MSCI does not issue, sponsor, endorse, market, offer, review or otherwise express any opinion regarding any investment or financial product that may be based on or linked to the performance of any MSCI index.
MSCI’s subsidiaries Institutional Shareholder Services Inc. (“ISS”) and MSCI ESG Research Inc. are Registered Investment Advisers under the Investment Advisers Act of 1940. Except with respect to any applicable products or services from ISS or MSCI ESG Research, neither MSCI nor any of its products or services recommends, endorses, approves or otherwise expresses any opinion regarding any issuer, securities, financial products or instruments or trading strategies and neither MSCI nor any of its products or services is intended to constitute investment advice or a recommendation to make (or refrain from making) any kind of investment decision and may not be relied on as such.
The MSCI ESG Indexes use ratings and other data, analysis and information produced by MSCI ESG Research Inc. Issuers mentioned or included in any MSCI ESG Research materials may be a client of MSCI, ISS, or another MSCI subsidiary, or the parent of, or affiliated with, a client of MSCI, and may also purchase research or tools from MSCI ESG Research Inc. MSCI ESG Research materials, including materials utilized in any MSCI ESG Indexes or other products, have not been submitted to, nor received approval from, the United States Securities and Exchange Commission or any other regulatory body.
Any use of or access to products, services or information of MSCI requires a license from MSCI. MSCI, Barra, RiskMetrics, IPD, FEA, InvestorForce, and other MSCI brands and product names are the trademarks, service marks, or registered trademarks of MSCI or its subsidiaries in the United States and other jurisdictions. The Global Industry Classification Standard (GICS) was developed by and is the exclusive property of MSCI and Standard & Poor’s. “Global Industry Classification Standard (GICS)” is a service mark of MSCI and Standard & Poor’s. © 2014 MSCI Inc. All rights reserved. Feb 2014