FACTBOOK - Mississippi State University · 2016 FACTBOOK. We are celebrating a significant...
24
FOREWORD BY MORGAN FREEMAN 2016 FACTBOOK
Transcript of FACTBOOK - Mississippi State University · 2016 FACTBOOK. We are celebrating a significant...

FOREWORD BY MORGAN FREEMAN
2016FACTBOOK

We are celebrating a significant milestone in the history of Mississippi KIDS COUNT. The Family & Children Research Unit of Mississippi State University’s (MSU) Social Science Research Center begins our 10th year of being the Annie E. Casey Foundation’s KIDS COUNT grantee for the state of Mississippi. When representatives from the Annie E. Casey Foundation reached out to us in fall 2006 to determine our interest in being Mississippi’s KIDS COUNT grantee, we did not hesitate to host a site visit from Don Crary and Bill O’Hare of the foundation. In December 2006 we were notified that, effective January 1, 2007, the new home for Mississippi KIDS COUNT would be housed within our unit.
Our overall goal—then and now—is to be the premier data source on children and families for the state of Mississippi in the areas of health, education, economic well-being and child safety. While building and maintaining a foundation of reliable data is key to monitoring changes over time, our higher aim is to provide data that can be used as a catalyst for improving outcomes for Mississippi’s children. To that end, we have engaged communities, policymakers, state agencies, businesses, philanthropies, etc. Meeting these dual goals of providing solid data and presenting the data in a format that can be used to improve outcomes for children has been the direct result of the overwhelming support of individuals and entities across the state, stellar Advisory Board members, the incredibly dedicated Mississippi KIDS COUNT team and colleagues here at MSU’s Social Science Research Center, all of whom have made this possible. In addition to our current advisory board, previous members over the last decade include: Dr. Mary Gayle Armstrong, Gary Blair, Dr. Devon Brenner, Nelle Cohen, Dr. Neva Penton Eklund, Therese Hanna, Dr. William Hilbun, Lydia Jones, Rhonda Keenum, Elnora Littleton, Valerie Long, Dorothy Roberts, Kate McMillin, Sally Molpus, Avern Moore, Dr. Wanda Newell, Larry Otis, Wade Overstreet, Tom Pittman, Inez Saum, Sister Teresa Shields and Danny Spreitler.
Just as data is not static, our mechanisms for promoting our work continue to evolve. We have 1) transitioned from an academic approach in earlier databooks to a more user-friendly, infographic format in our factbooks; 2) spotlighted success stories of visionary Mississippians who are incredibly dedicated to improving outcomes for children and families in their communities and across the state; 3) hosted both summits and youth conferences, engaging thousands of Mississippians with information about the status of Mississippi's children. Youth summit speakers have included internationally recognized celebrities and authors: Wes Moore, Hill Harper, Rachel Simmons and Mississippi’s own Dak Prescott and Dan Mullen. In recent years, our factbook forewords have been written by Governor William Winter, Dr. Edward Hill and Dr. Carey Wright. This year we are pleased to have Mississippi’s own Morgan Freeman express his thoughts on the importance of investing in quality early care and education. We’ve also had numerous presentations to community and professional groups and are increasingly called upon for policy discussions impacting children and families. Yet, in looking forward to the next decade to begin in January 2017, we realize there is so much more to do to improve these outcomes. While we “count” many data points on children’s well-being, most of which are far less than optimal for Mississippi’s children, there are countless opportunities for improvement.
Mississippi KIDS COUNT is looking forward to working with you during the next decade to promote a comprehensive agenda for Mississippi’s children. To begin our next decade of efforts in 2017, we will continue our policy work on developmental screenings and chronic absenteeism, working in concert with the national Campaign for Grade Level Reading, funded heavily by the Annie E. Casey Foundation. Beyond these topics, we will also focus on some of the most pressing issues for children, youth and families—particularly the most vulnerable in our state—and produce evidence-based research and policy briefs with accompanying “calls for action.” We plan to strengthen current partnerships and build new ones, based upon the particular concern and challenges. In doing so, we are counting on you and welcome your input!
Linda H. Southward, Ph. DDirector, Mississippi KIDS COUNT
AcknowledgmentsMISSISSIPPI KIDS COUNT ADVISORY BOARDNAMEPatricia Marshall, J.D., ChairMike ClaybornePortia Espy Lloyd Gray J. Edward Hill, M.D.The Honorable John N. Hudson, J.D.Sanford JohnsonSammy Moon Brian Pugh, Ph.D.Corey Wiggins, Ph.D.
POSITIONAssistant Attorney GeneralPresidentDirector of Community BuildingExecutive DirectorFamily PhysicianJurist-in-ResidenceDeputy Director CoordinatorDirector of FinanceDirector
ORGANIZATIONOffice of the Attorney General, State of MississippiCREATE FoundationWilliam Winter Institute for Racial Reconciliation Phil Hardin FoundationNorth Mississippi Health ServicesMississippi Supreme CourtMississippi First Mississippi Association of Grantmakers Office of the Governor State of MississippiHope Policy Institute

Mississippi KIDS COUNT would like to express our sincere gratitude to the following entities; without their support and commitment, the production of this fact book would not be possible.
• The Annie E. Casey Foundation• Mississippi State University’s Social Science Research Center - Dr. Arthur Cosby, Director
Contents
1 Foreword
3 A Decade of Change
4 What Would it Take?
5 The Early Years
9 Reading to Learn
13 Economics of Education
20 References

Investing in our kids from birth to third grade is not an option – it’s our responsibility. One that has been shown to have a strong return on investment.
When we support proficiency in reading, we contribute to a child’s lifelong potential. Every story, every interest, every passion, every Web page, every inspiration is a potential discovery. Children are free to be their greatest. And that creates a greater us. When a child learns to read, the sense of wonder and imagination increases. That happened for me at the age of eight, when I received my first library card from a public library in Chicago. With the turn of a page, I could travel anywhere in the world…be anything I wanted to be…join any adventure. My mind became my passport. Science tells us that quality early childhood experiences influence the very architecture of a child’s developing brain. Learning to read starts with the ability to link sounds, letters, language and meaning together. In the context of richly stimulating interactions with engaged adults, sort of like the back-and-forth of a game of tennis, students build a strong developmental foundation, and are better able to develop their abilities to communicate, learn and understand. The most crucial stage for this cognitive development is from birth to third grade. Because our first years on this earth are a time of remarkable neurological growth, the very best ways to support a child’s curiosity and learning during this critical time involves supporting the environments that stimulate them. Strong and well-funded schools and libraries, well resourced teachers and access to reading experts, accessible materials, cutting-edge technology are a few examples. However, despite making some progress over the years, my home state of Mississippi is woefully behind every state in the country on virtually every childhood well-being and education indicator -- health, literacy, safety and economic development.
We’re also among the most underfunded in early childhood education. The Early Learning Collaborative Act of 2013 created the first state-funded Pre-K program in Mississippi. The inaugural round of funding appropriated $3 million for 11 collaboratives statewide serving 1,789 students. But this still leaves approximately 39,000 four-year-olds without access to public Pre-K. That’s 39,000 too many. If we truly want to increase Mississippians’ chances to thrive economically and educationally, we need to make sure all children in Mississippi have access to quality early childhood programs that develop their language and literacy. When we invest in the systems that support learning, we ensure a more socially and economically thriving Mississippi. • In Mississippi, children who have attended
Pre-K programs (Title I and/or locally funded) are 1.5 TIMES MORE LIKELY to be reading proficiently at 3rd grade
• Children who are reading proficiently in 3rd grade are 9 TIMES MORE LIKELY to read proficiently in 8th grade
• Proficient readers in 8th grade are 2 TIMES MORE LIKELY to graduate from high school on time
It costs about $12,401 to retain one student. Multiply that by the 2,907 students who are retained and you get $36,049,707. That is enough to fund early learning collaboratives 12 times over, support 132 Pre-K programs or put as many as 1,474 students through college. The bottom line: every dollar invested in pre-kindergarten (per child) yields an $8.40 return. That return is $12.30 for low-income children. Very few investments will perform better! Children who achieve their full potential contribute more fully to their communities by giving back as citizens. We can never truly measure the opportunity gain. But we can easily see its loss.
Foreword
1

Morgan Freeman
Additionally, we know that approximately one out of every three children in Mississippi lives in poverty (29%). And we know that children who live in conditions of poverty are less likely to have access to available books. We know that when adults struggle with social conditions such as financial insecurity, lack of access to quality healthcare and other public services, their children are negatively affected. These forces contribute to a lack of “serve and return” interactions with children, and thus children growing up in communities of poverty are more likely to have increased summer learning loss when not in school compared to middle and higher income households. But, we have solutions that have been shown to work. For example, through our schools, we can provide access to nutrition and necessities, which can remove some of the barriers to learning. Family engagement and quality childcare solutions have been shown to play an important role in promoting access to more stimulating environments. For Mississippi, making sure early learning really happens in the midst of economic challenge means innovating from within. That’s why Mississippians committed to the distinct needs of their neighborhoods and communities are such an important component of our state’s early learning effort to give children a voice. Investing now in things like high quality pre-kindergarten collaboratives help contributors of all kinds – teachers, families, business, legislators and civic leaders – to drive lasting change, fueled by the excellent work which is already being done across systems and agencies. Early childhood is at the core of our economic security – as individuals, as families, as communities, as a state, as a nation. With this in mind, I founded the Tallahatchie River Foundation – a 501[c][3] non-profit that invests in quality early childhood education within Mississippi communities. We have one goal: for every child in Mississippi to exceed third-grade proficiencies for life-long success. In order for all of Mississippi’s children to thrive both socially and economically, we need public, private and philanthropic entities
to work together with strong, consistent investments. We need to promote practices which science has shown will support healthy development in our children’s early years. We need everyone, and we all stand to benefit. As with all investments, the rewards and outcomes will come later, but the time to act is now. May I count you in?
2
A Decade of Change
INDICATOR 2005rate or %
2014rate or %
2014# of kids
National Rank
CHANGE
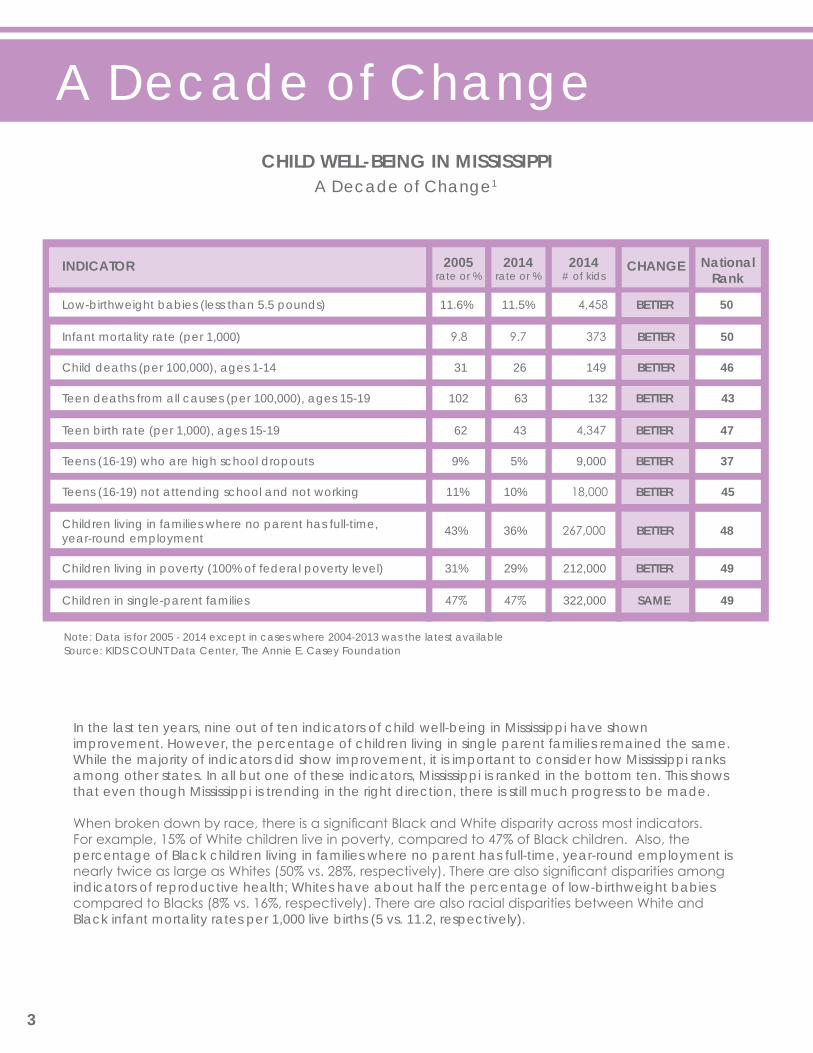
CHILD WELL-BEING IN MISSISSIPPIA Decade of Change1
Low-birthweight babies (less than 5.5 pounds)
Teen deaths from all causes (per 100,000), ages 15-19
Teens (16-19) not attending school and not working
Infant mortality rate (per 1,000)
Teen birth rate (per 1,000), ages 15-19
Children living in families where no parent has full-time, year-round employment
Child deaths (per 100,000), ages 1-14
Teens (16-19) who are high school dropouts
Children living in poverty (100% of federal poverty level)
Children in single-parent families
11.6%
102
11%
9.8
62
43%
31
9%
31%
47%
4,458
132
18,000
373
4,347
267,000
149
9,000
212,000
322,000
11.5%
63
10%
9.7
43
36%
26
5%
29%
47%
BETTER
BETTER
BETTER
BETTER
BETTER
BETTER
BETTER
BETTER
BETTER
SAME
50
43
45
50
47
48
46
37
49
49
In the last ten years, nine out of ten indicators of child well-being in Mississippi have shown improvement. However, the percentage of children living in single parent families remained the same. While the majority of indicators did show improvement, it is important to consider how Mississippi ranks among other states. In all but one of these indicators, Mississippi is ranked in the bottom ten. This shows that even though Mississippi is trending in the right direction, there is still much progress to be made.
When broken down by race, there is a significant Black and White disparity across most indicators. For example, 15% of White children live in poverty, compared to 47% of Black children. Also, the percentage of Black children living in families where no parent has full-time, year-round employment is nearly twice as large as Whites (50% vs. 28%, respectively). There are also significant disparities among indicators of reproductive health; Whites have about half the percentage of low-birthweight babies compared to Blacks (8% vs. 16%, respectively). There are also racial disparities between White and Black infant mortality rates per 1,000 live births (5 vs. 11.2, respectively).
Source: KIDS COUNT Data Center, The Annie E. Casey FoundationNote: Data is for 2005 - 2014 except in cases where 2004-2013 was the latest available
3

For almost three decades, the Annie E. Casey Foundation has produced state rankings. Mississippi continues to be at or near 50th across all indicators of child well-being. This year Mississippi is ranked 48th in education. What would have to change to move Mississippi to number one?
For Mississippi to go from forty-eight to number one in education?
A STATE-TO-STATE COMPARISON OF EDUCATION: 20151
What Would it Take?
INDICATORS WHERE WE ARE TO BE #1
Not attending Pre-K
High school students not graduating on time (2011-13)
Fourth graders not proficient in reading (2013)
Eighth graders not proficient in math (2013)
52%
32%
74%
79%
37%
7%
50%
45%
Source: KIDS COUNT Data Center, The Annie E. Casey Foundation
4
TX
CA
MT
AZ
ID
NV
NM
COIL
OR
UT
KS
WY
IA
SD
NE
MN
FL
ND
OK
WI
MO
AL
WA
GA
AR
LA
MI
IN
PA
NC
NY
MS
TN
VAKY
OH
SC
ME
WV
MI VTNH
MD
NJ
MACT
DE
RI
AK
MS ranked = 48
HI
States ranked 1-13States ranked 14-25States ranked 26-37States ranked 38-50
Mississippi rank: 48Massachusetts rank: 1

TX
CA
MT
AZ
ID
NV
NM
COIL
OR
UT
KS
WY
IA
SD
NE
MN
FL
ND
OK
WI
MO
AL
WA
GA
AR
LA
MI
IN
PA
NC
NY
MS
TN
VAKY
OH
SC
ME
WV
MI VTNH
MD
NJ
MACT
DE
RI
AK
HI
2050 PROJECTED RATIO OF ANNUAL BENEFITS TO PROGRAM COSTS OF UNIVERSAL PRE-K2
U.S. = $8.90 for every dollar spent
The Early Years
Source: Robert Lynch & Kavya Vaghul (2015). Washington Center for Equitable Growth
COSTS AND BENEFITS OF A UNIVERSAL PRE KINDERGARTEN PROGRAM IN MISSISSIPPI (2014 DOLLARS)
Government Benefits
Increased Compensation
Savings to Individuals
Total Benefits
Ratio of Total Annual Benefits to Program Costs
$684 Million
$865 Million
$1.1 Billion
$2.6 Billion
9:1
5
According to Robert Lynch and Kavya Vaghul's analysis (2015), by 2050 the United States stands to gain $8.90 in benefits for each dollar invested in universal Pre-K. In Mississippi, this ratio is even higher at $9.10 in benefits per dollar invested. By 2050, the annual benefits of universal Pre-K to Mississippi would total $2.6 billion. This would include $684 million in government budget benefits, $865 million in increased compensation to workers, and $1.1 billion in reduced costs to state residents through reduced crime, child maltreatment, and improved health outcomes.
$ 6.70 - $ 9.10$ 9.11 - $12.80$12.81 - $17.90$17.91 - $36.50

COST/BENEFIT ANALYSES SHOW POSITIVE RETURNSEarly Childhood Programs Benefits3
Rate
of R
etur
n to
Inve
stm
ent i
n Hu
man
Cap
ital
Pren
atal
0-3 4-5 School Post School
Prenatal programs
›
Programs targeted toward the earliest years
›
Preschool programs
›
Schooling
›
Job training
›
EARLY CHILDHOOD DEVELOPMENT IS A SMART INVESTMENT3
The earlier the investment, the greater the return.
The High/Scope Perry Preschool Study Through Age 40 validated long-term effects that were projected in earlier analysis from the project such as: impacts on the economy (i.e. higher incomes, home-owners etc.), families, and mental health; lower criminality and welfare status.4 The long-lasting economic results include higher productivity, a more qualified, dynamic workforce; less government assistance and a higher gross domestic product (GDP). Overall monetary returns (in 2000) were estimated to be $244,812 per participant – that is $16.14 per dollar invested ($15,166 each child).4
Source: Heckman (2008)
$8.74
$16.14
Perry Preschool Age 27
Perry Preschool Age 40
20
15
10
5
0Ratio
of B
enefi
ts to
Cos
ts
6
The Early Years
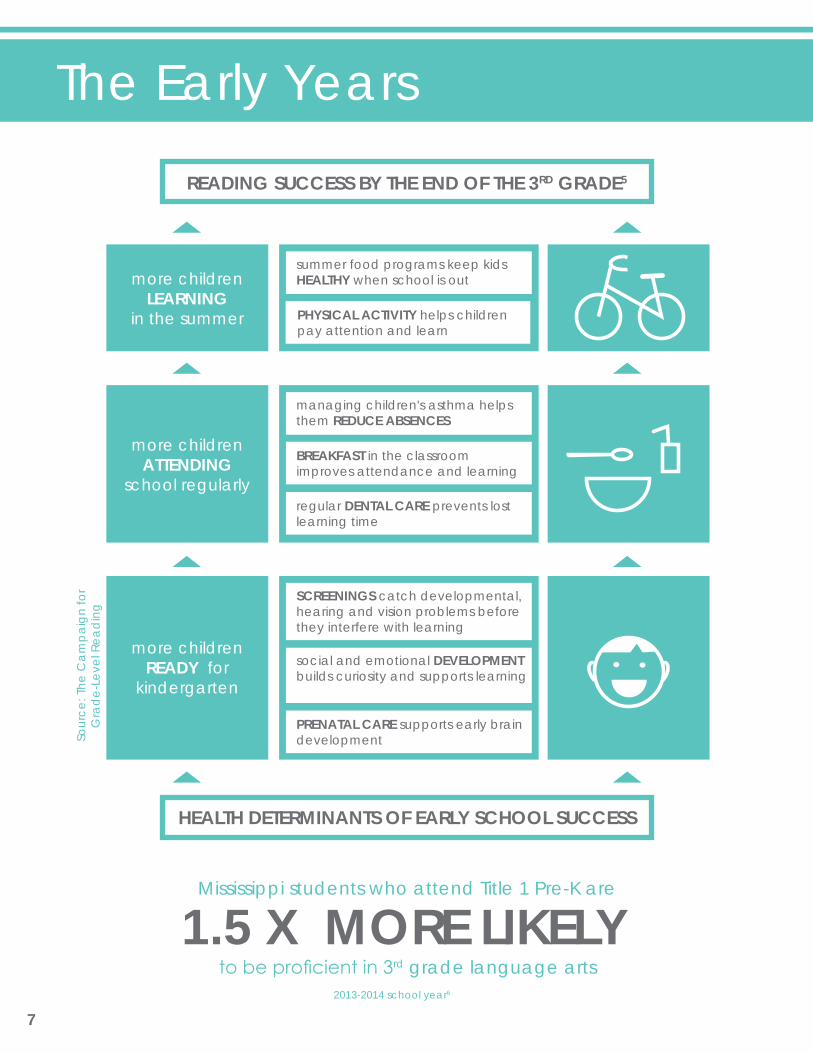
READING SUCCESS BY THE END OF THE 3RD GRADE5
HEALTH DETERMINANTS OF EARLY SCHOOL SUCCESS
Sour
ce: T
he C
ampa
ign
for
Gra
de-
Leve
l Rea
din
g
more children LEARNING
in the summer
more children ATTENDING
school regularly
more children READY for
kindergarten
summer food programs keep kids HEALTHY when school is out
managing children's asthma helps them REDUCE ABSENCES
SCREENINGS catch developmental, hearing and vision problems before they interfere with learning
PHYSICAL ACTIVITY helps children pay attention and learn
BREAKFAST in the classroom improves attendance and learning
social and emotional DEVELOPMENT builds curiosity and supports learning
regular DENTAL CARE prevents lost learning time
PRENATAL CARE supports early brain development
Mississippi students who attend Title 1 Pre-K are
to be proficient in 3rd grade language arts1.5 X MORE LIKELY
2013-2014 school year6
7

Ages 6-11Ages 1-5
CHILDREN UNDER AGE SIX EXPERIENCING RISK FACTORS7
EMERGENCY ROOM DIAGNOSES FOR MISSISSIPPI CHILDREN ON MEDICAID8
“Early childhood investments of high quality have lasting effects…. We cannot afford to postpone investing in children until they become adults, nor can we wait until they reach school age — a time when it may be too late to intervene. Learning is a dynamic process and is most effective when it begins at a young age and continues through adulthood.”
- James Heckman, Nobel Prize-winning Economist
MULTIPLE RISK FACTORS IN MISSISSIPPI
0 risks1-2 risks3+ risks
31%25%
44%
Children under age six
Percent of Primary Diagnoses
8
38% of children under six live in poverty
Mississippi United States24% of children under six live in poverty
Unmarried Parent
Residential Mobility
Unemployed Parent(s)
Low ParentalEducation
TeenMother
34%
20%
11% 10% 10%
4%
49%
21%
16%
7%
3.5%
3.5%
3.9%
8.1%
17.4%
3.4%Influenza Open wounds of extremities
Asthma
Sprains and strains
Superficial injury; Contusion
Other upper respiratory infections
Fever of unknown origin
Superficial injury; Contusion
Otitis media and related conditions
Other upper respiratory infections
5.1%
5.6%
9.9%
21.3%

COST OF RETENTION IN MISSISSIPPI
3RD GRADE LITERACY PROMOTION ACT
In 2013 the Mississippi legislature passed Senate Bill 2347, Mississippi's Third Grade Literacy-Based Promotion Act designed to improve student reading skills beginning in kindergarten extending through third grade so that students can transition from "learning to read" to "reading to learn". The act requires that third graders who fail to score at or above the minimum score (926) on the
Third Grade Reading Summative Assessment be retained in third grade.9 Initially, 5,612 students (15% of third graders) scored below the minimum score (926 or above).10 However, students who did not initially pass were allowed second and third attempts in April and May. After the second and third attempts the number of students to be retained for the 2015 school year fell to 2,907.11-12
Reading to Learn
AB C
*based on average Mississippi in-state tuition of $6,115/yr
2,907 students (8% of 3rd graders) were retained for the 2015 school year.12 It costs about $12,401 to retain one student.13
Fund the current early learning collaboratives 12x over for a total of 132 Pre-K programs ($3 Million funds a total of 11 collaboratives)
Fund 1,474 students through four years of college*
"We need a generation of high school graduates prepared for college and a career, for military service and to become a workforce that can compete in the global economy. With that in mind, the first
thing we must do is teach our children to read."- Ralph Smith, Sr. Vice President, Annie E. Casey Foundation,
Managing Director, Campaign for Grade Level Reading
9
14
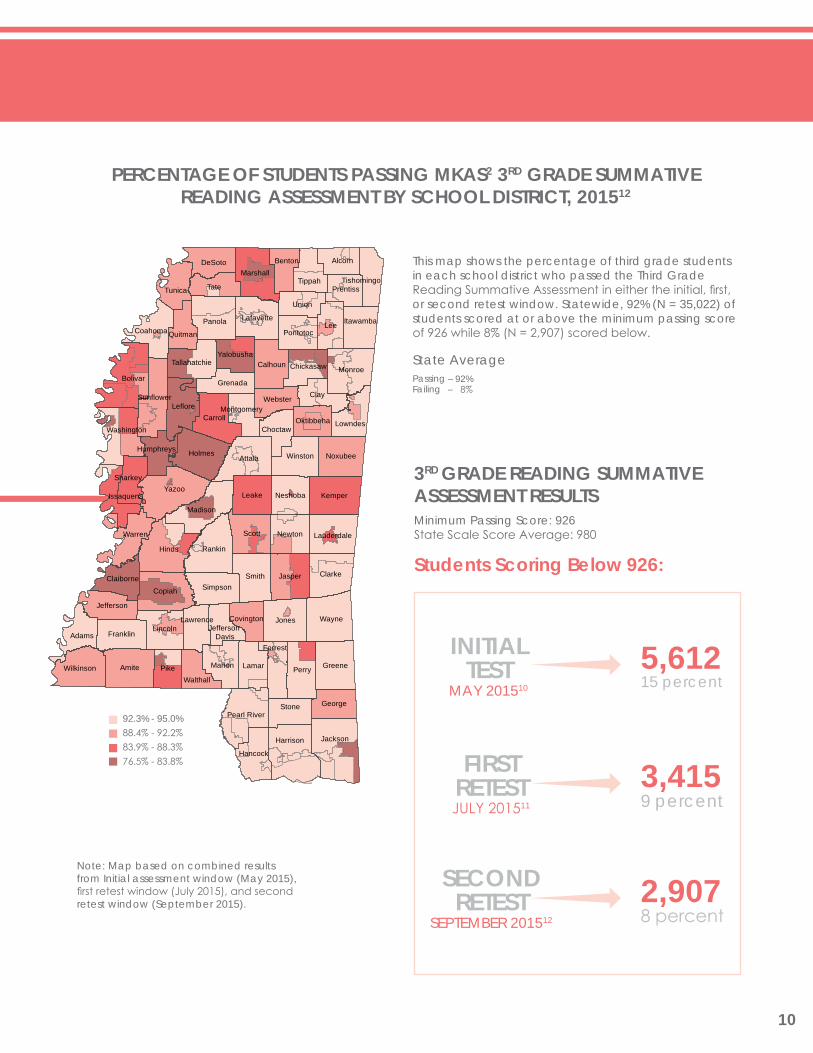
PERCENTAGE OF STUDENTS PASSING MKAS2 3RD GRADE SUMMATIVE READING ASSESSMENT BY SCHOOL DISTRICT, 201512
This map shows the percentage of third grade students in each school district who passed the Third Grade Reading Summative Assessment in either the initial, first, or second retest window. Statewide, 92% (N = 35,022) of students scored at or above the minimum passing score of 926 while 8% (N = 2,907) scored below.
State AveragePassing Failing
Note: Map based on combined results from Initial assessment window (May 2015), first retest window (July 2015), and second retest window (September 2015).
3RD GRADE READING SUMMATIVE ASSESSMENT RESULTS Minimum Passing Score: 926State Scale Score Average: 980
Students Scoring Below 926:
5,61215 percent
3,4159 percent
2,9078 percent
10
– 92%– 8%
INITIALTEST
MAY 201510
FIRST RETESTJULY 201511
SECOND RETEST
SEPTEMBER 201512
Hinds
Yazoo
Amite
Bolivar
Attala
Perry
Lee
Jones
Scott
Wayne
Rankin
Copiah
Smith Clarke
Panola
Jasper
Holmes
Monroe
Kemper
Tate
Leake
Pike Greene
Carroll
ClayLeflore
Madison
Jackson
Marshall
Lincoln
Marion Lamar
Noxubee
Stone
Winston
Newton
Pearl River
Lafayette
Union
Wilkinson
Calhoun
Tunica
Franklin
Harrison
Simpson
Tippah
Adams
DeSoto Alcorn
Neshoba
Lauderdale
George
Coahoma
Benton
Jefferson
Pontotoc
Lowndes
Tallahatchie
Itawamba
Hancock
Walthall
Grenada
Prentiss
Webster
Claiborne
Yalobusha
Choctaw
Chickasaw
Oktibbeha
Warren
Sunflower
Forrest
Washington
Sharkey
Quitman
Lawrence
Issaquena
Covington
Humphreys
Tishomingo
Montgomery
Jefferson Davis
92.3 - 95.0
88.4 - 92.2
83.9 - 88.3
76.5 - 83.8
92.3% - 95.0%88.4% - 92.2%83.9% - 88.3%76.5% - 83.8%

Reading to Learn
PERCENT OF STUDENTS CHRONICALLY ABSENT BY SCHOOL DISTRICT, K-318
0.0% - 6.1%6.2% - 9.1%9.2% - 13%13.1% - 20.3%
3RD GRADE LANGUAGE ARTS MCT2 SCORES, 2013/1415
16.4%
34.5% 31.6%
17.5%
MinimalBasicProficientAdvanced
3RD GRADE ENGLISH LANGUAGE ARTS PARCC SCORES, 2014/1516
CHRONIC ABSENCE IN MISSISSIPPI
DistinguishedStrongAdequatePartialMinimal
During the 2014/15 school year, Mississippi students in grades 3-8 participated in the PARCC testing program. The PARCC testing program uses a different rating than the one previously used by the Mississippi Curriculum Test 2nd Edition (MCT2). This change makes any comparisons to scores from previous years extremely difficult. However, based on the PARCC standards, in 2014/15, 45.6% of Mississippi students had a less than adequate understanding of language arts while 54.4% of students had an adequate or higher understanding of language arts. This is contrasted to 49.1% of students who were basic or below and 50.9% who were proficient or above on the MCT2 the previous school year.
MEASURES OF ATTENDANCE
Average Daily Attendance (ADA): Average number of enrolled students who attend school each day. In Mississippi, excused and unexcused absences are included in ADA.
Chronic Absence Rate: Percentage of students who miss too much school for any reason including excused and unexcused absences. Reflecting numerous studies and the practices of a growing number of states, this report defines it as missing 10% of the school year (about 18 days in a 180 school year).17
Truancy Rate: In Mississippi, truancy is defined as the percentage of students with five or more unlawful or unexcused absences in the school year. The truancy rate does not include out of school suspensions.
11
25.7%
27.3%21.3%
24.3%
1.4%
Hinds
Yazoo
Amite
Bolivar
Attala
Perry
Lee
Jones
Scott
Wayne
Rankin
Copiah
Smith Clarke
Panola
Jasper
Holmes
Monroe
Kemper
Tate
Leake
Pike Greene
Carroll
ClayLeflore
Madison
Jackson
Marshall
Lincoln
Marion Lamar
Noxubee
Stone
Winston
Newton
Pearl River
Lafayette
Union
Wilkinson
Calhoun
Tunica
Franklin
Harrison
Simpson
Tippah
Adams
DeSoto Alcorn
Neshoba
Lauderdale
George
Coahoma
Benton
Jefferson
Pontotoc
Lowndes
Tallahatchie
Itawamba
Hancock
Walthall
Grenada
Prentiss
Webster
Claiborne
Yalobusha
Choctaw
Chickasaw
Oktibbeha
Warren
Sunflower
Forrest
Washington
Sharkey
Quitman
Lawrence
Issaquena
Covington
Humphreys
Tishomingo
Montgomery
Jefferson Davis

PERCENTAGE OF STUDENTS PROFICIENT IN 3RD GRADE LANGUAGE ARTS BY PATTERN OF ATTENDANCE19
This figure shows the percentage of 3rd graders who were proficient or above on the 2013/14 MCT2 Language Arts assessment by their pattern of attendance during their kindergarten through third grade years. The gray bar on the left represents the proficiency level of students who were never chronically absent during grades K - 3. The next bar represents the proficiency level of students who were chronically absent in kindergarten only. The following three bars each represent the proficiency level of students who were chronically absent in consecutive years through grade three.
50%
40%
30%
20%
10%
0%
39.7%44.1%42.7%
46.1%
53.0%
Never Chronically Absent
Chronically Absent in K
Perc
ent P
rofic
ient
and
Abo
ve
Chronically Absent in K
and 1st Grade
Chronically Absent in K, 1st, and 2nd Grade
Chronically Absent in K, 1st, 2nd
and 3rd Grade
PERCENT CHRONIC ABSENCE IN MISSISSIPPI BY DAYS MISSED IN SEPTEMBER, 2013/1419
100%90%80%70%60%50%40%30%20%10%
0%
77.1%
38.8%
7.0%
88.3%
54.3%
12.4%
76.0%
36.0%
6.2%
60.9%
28.0%
4.8%
< 2 Days2–4 Days> 4 Days
K–5 6–8 9–12 All
Mississippi students who missed between 2 to 4
days in September were 5X MORE LIKELY to be chronically absent for
the year than those who missed less than two days.
This figure shows the percentage of chronically absent students in the 2013/14 school year by their number of absences in September. High school students (9 - 12) generally had the highest number of absences in September, followed by middle school students (6 - 8), and elementary school students (K - 5). Across grade levels, students who missed less than two days in September had the lowest rate of chronic absence for the year (7%), compared to those who missed either two to four days (38.8%) or more than four days (77.1%).
12

CHANGES IN MISSISSIPPI’S STUDENT ASSESSMENT PROGRAM22
MISSISSIPPI SPENT LESS PER STUDENT THAN SURROUNDING STATES IN 201320
$48K
$47K
$42K$48K
$52K
$8,130MISSISSIPPI
$8,208TENNESSEE
$8,755ALABAMA
$10,490LOUISIANA
AVERAGE TEACHER SALARY BY STATE, 2013/1421
Economics of Education
In the year 2015-16, the Mississippi Assessment Program (MAP) is the statewide assessment for students in grades 3-8 (MAP replaces PARCC). The test will be administered by Questar Inc. The Questar Contract is for 10 years and costs $110.9 million.
In the year 2014-15, the Partnership for Assessment of Readiness for College and Careers (PARCC) Assessment replaced the MCT2 Assessment Program.
The current 3rd Grade Reading Summative Assessment (GRSA) will be used for retention decisions in the 2015-16 school year with the new English and Language Assessment (ELA) being used in the 2016-17 school year.
MISSISSIPPI’S EDUCATION BUDGET, 2014/15 SCHOOL YEAR23
How was it spent?
Instruction (salaries, programming)General AdministrationSchool AdministrationOther-Instructional SupportNon-Instructional Support (food service)
67%
5%
6%
6%
16%
Where did it come from?
33%
52%
15%
StateLocalFederal
13
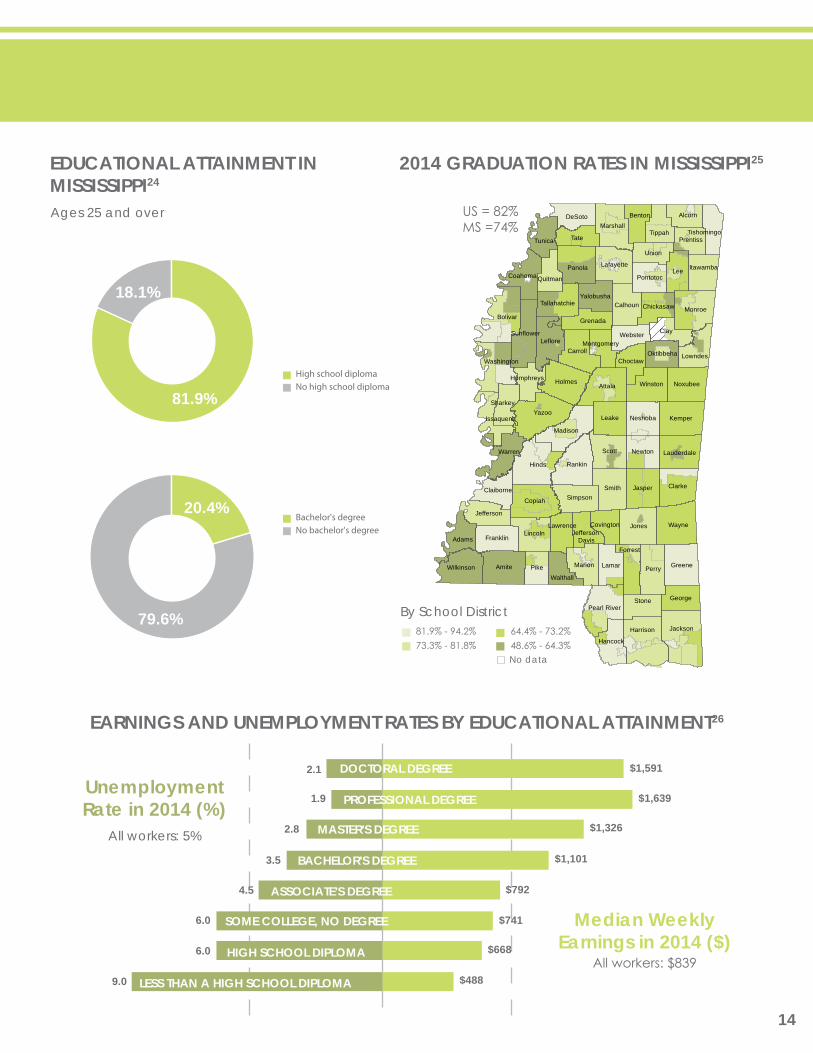
EARNINGS AND UNEMPLOYMENT RATES BY EDUCATIONAL ATTAINMENT26
2014 GRADUATION RATES IN MISSISSIPPI25
By School District81.9% - 94.2%73.3% - 81.8%
64.4% - 73.2%48.6% - 64.3%
US = 82%MS =74%
EDUCATIONAL ATTAINMENT IN MISSISSIPPI24
Ages 25 and over
Unemployment Rate in 2014 (%)
Median Weekly Earnings in 2014 ($)
$1,591
$1,639
$1,326
$1,101
$792
$741
$668
$488
2.1
1.9
2.8
3.5
4.5
6.0
6.0
9.0
All workers: 5%
All workers: $839
DOCTORAL DEGREE
PROFESSIONAL DEGREE
MASTER'S DEGREE
BACHELOR'S DEGREE
ASSOCIATE'S DEGREE
SOME COLLEGE, NO DEGREE
HIGH SCHOOL DIPLOMA
LESS THAN A HIGH SCHOOL DIPLOMA
14
Hinds
Yazoo
Amite
Bolivar
Attala
Perry
Lee
Jones
Scott
Wayne
Rankin
Copiah
Smith Clarke
Panola
Jasper
Holmes
Monroe
Kemper
Tate
Leake
Pike Greene
Carroll
ClayLeflore
Madison
Jackson
Marshall
Lincoln
Marion Lamar
Noxubee
Stone
Winston
Newton
Pearl River
Lafayette
Union
Wilkinson
Calhoun
Tunica
Franklin
Harrison
Simpson
Tippah
Adams
DeSoto Alcorn
Neshoba
Lauderdale
George
Coahoma
Benton
Jefferson
Pontotoc
Lowndes
Tallahatchie
Itawamba
Hancock
Walthall
Grenada
Prentiss
Webster
Claiborne
Yalobusha
Choctaw
Chickasaw
Oktibbeha
Warren
Sunflower
Forrest
Washington
Sharkey
Quitman
Lawrence
Issaquena
Covington
Humphreys
Tishomingo
Montgomery
Jefferson Davis
81.9%
18.1%
79.6%
20.4%
High school diplomaNo high school diploma
Bachelor's degreeNo bachelor's degree
No data

PERCENT CHANGE IN TOTAL STATE FUNDING PER STUDENT27
Economics of Education
MISSISSIPPI ADEQUATE EDUCATION PROGRAM (MAEP)29
In 1997, the Mississippi legislature adopted the Mississippi Adequate Education Program (MAEP) as a statutory formula to ensure that every Mississippi student regardless of the district where he/she lives is afforded an adequate education opportunity. The formula allocation plus add-on programs such as special education, gifted education, vocational education, transportation services and alternative school programs make up the total MAEP District funding. The majority of MAEP funds pay teacher salaries. MAEP has been fully funded twice (FY 2004 and FY 2008).
Full FundingActual Funding
2008 2009 2010 2011 2012 2013 2015$2,000
$2,200
$2,400
$2,300
$2,100
$2,500
-27M -21M-24M -23M
-26M
-257M
2014
-29M
BETWEEN 2008 AND 2014MISSISSIPPI SCHOOLS LOST
$1.3 BILLIONTO UNDERFUNDING
-3.2%
2009 2010 2011 2012 2013 2014
-13.5%-16.4%
-13.9%-15.2% -15.4%
15
INFLATION-ADJUSTED, FY08 - FY14
Note: California, Hawaii, Indiana, Maryland, Rhode Island, and West Virginia are excluded because the data necessary to make a valid comparison are not available.
Change per Student 10.5% – 90.7%- 1.6% – 10.4%-12.0% – -1.7%-23.3% – -12.1%No data
STATE FUNDINGPER STUDENTDOWN BY 15%28
TX
CA
MT
AZ
ID
NV
NM
COIL
OR
UT
KS
WY
IA
SD
NE
MN
FL
ND
OK
WI
MO
AL
WA
GA
AR
LA
MI
IN
PA
NC
NY
MS
TN
VAKY
OH
SC
ME
WV
MI VTNH
MD
NJ
MACT
DE
RI
AK
HI

EDUCATION GRANTS AND EDUCATIONAL ATTAINMENT30
Each county represents the educational attainment of adults 25 years and older who have at least a bachelor's degree. Each circle represents the total education grant dollars given to recipients in a given ZIP code by Mississippi-based foundations. Education giving includes grants to preschools, elementary and high schools, community colleges, four-year colleges, public libraries, and scholarships. The pattern that emerges from this map is that counties with greater educational attainment on average received more grant dollars for education related purposes. The total amount of education related grant dollars in 2012 from Mississippi foundations was $37.9 million, and 72% of that went to colleges, universities, and university foundations.
Bachelor's Degree or Higher28.6% - 45.8%18.0% - 28.5%12.4% - 17.9%5.3% - 12.3%
Grants$100 - $15,500$15,500 - $37,933$37,933 - $125,000$125,000 - $13,305,689
2012 MISSISSIPPI PHILANTHROPIC FUNDING BY COUNTY
16

VISIT HTTP://WWW.DATACENTER.KIDSCOUNT.ORG/MSRank states, counties, and school districts on various indicators of child well-being, family and community, health, and safety and risk behaviors.Generate customized visuals, such as maps, line graphs, and bar graphs to show how Mississippi’s children fare across the state and over time.Feature maps and graphs on your own website or blog that are automatically updated when new data is available.Download raw data.View and share data quickly and easily anytime and anywhere with the enhanced mobile site for smart phones (mobile.kidscount.org).
•
•
•
••
Scan to view county data
Mississippi KIDS COUNT maintains over 70 indicators on the KIDS COUNT Data Center website for all 82 counties and 152 school districts in Mississippi. This table of Lee County is a small example of the current data available. Counties are ranked according to the favorability of the outcome so that the “best” county is ranked 1st and the “worst” county is ranked 82nd.
PREMATURE BIRTHS
CHILDREN IN POVERTY
RECEIVING SUPPLEMENTAL NUTRITION
CHILDREN LIVING INA SINGLE PARENT HOME
ADULTS WHO COULD NOT SEE A DOCTOR
LOW-BIRTHWEIGHTINFANTS
TEEN PREGNANCY RATEPER 1,000 (ages 15-19)
UNEMPLOYMENT RATE
INDICATORS:
2013
2014
2015
2010-2014
2015
2013
2013
2014
YEAR
13.1%
30.7%*
21%
44.9%
19.9%
11.5%
49.1
7.8%
14.2%
29.6%
17.6%
39.6%
19.5%
12.3%
62.6
7.7%
51
18
19
27
31
49
57
3 & 4 YEAR OLDS ENROLLED IN PRE-K
CHILD POPULATION
INSTANCES OF CHILDABUSE & NEGLECT
HIGH SCHOOL DIPLOMA(ages 25+)
2010-2014
2010-2014
2015
2010-2014
51.6%
743,299
6,245
81.9%
43.7%
22,138
215
83.5%
20
7**
NR
15
26
MS LEE COUNTY COUNTY RANK
Looking for County-Level Data?
HIGHLIGHTING LEE COUNTY1
17
*Rate is based on SAIPE data for county level estimates. The SAIPE rate differs from the state-level rate from the American Community Survey (Mississippi = 29%). ** Ranked highest to lowest`

1. KIDS COUNT Data Center, Annie E. Casey Foundation. (n.d.). Retrieved from http://datacenter.kidscount.org2. Lynch, R., & Vaghul, K. (2015). The benefits and costs of investing in early childhood education: The fiscal, economic, and societal gains of a universal prekindergarten program in the Unites States, 2016-2050. Washington Center for Equitable Growth. http://equitablegrowth.org/report/the-benefits-and-costs-of-investing-in-early-childhood-education/3. Heckman, James J. (2008). Return on investment: Cost vs. benefits. https://childandfamilypolicy.duke.edu/pdfs/10yranniversary_Heckmanhandout.pdf 4. Schweinhart, L., Montie, J., Xiang, Z., Barnett, W.S., Belfield, C., & Nores, M. (2005). Lifetime effects: The high/scope perry preschool study through age 40. High/Scope Press Educational Research Foundation. http://www.highscope.org/Content.asp?ContentId=2195. The Campaign for Grade-Level Reading. (n.d.) The health determinants of early school success. http://gradelevelreading.net/healthy-readers-resources-guides6. Southward, L. H., Walker, B. H., McCown, J. S., Patev, A., Baird-Thomas, C., & Zollicoffer, A., (2015, September). Increasing the odds: Predictors of academic success for Mississippi’s children. http://fcru.ssrc.msstate.edu/wp-content/uploads/2015/09/4P2_WEB.pdf7. National Center for Children in Poverty (NCCP). (n.d.) Young child risk calculator. http://www.nccp.org/tools/risk/8. Walker, B. H., McCown, J. S., Bowser, D., Patev, A., Reaede, F. S., Razavi, M., Dzielak, D., & Southward, L. H. (2015). A preliminary assessment of emergency department use among Mississippi’s Medicaid population. Journal of the Mississippi State Medical Association, 56, 120-124.9. Miss Code § 37-177-9. (2013). http://www.mde.k12.ms.us/docs/curriculum-and-instructions-library/lbpa-code-section-37-177-1-et-seq.pdf?sfvrsn=210. Mississippi Department of Education (MDE). (2015). MKAS2 3rd grade summative assessment results: Spring 2015 results. http://reports.mde.k12.ms.us/pdf/a/2015/mkas2-statewide-final-results%20_UPDATED.pdf11. Mississippi Department of Education (MDE). (2015). MKAS2 spring results summary: Combined results from initial assessment window and first retest window. http://reports.mde.k12.ms.us/pdf/a/2015/MKAS%203rd%20Grade%20Scores%202015%20-%20Initial%20and%201st%20Retest.pdf12. Mississippi Department of Education (MDE). (2015). MKAS2 spring results summary: Combined Results from initial assessment window, first retest window, and second retest window. http://reports.mde.k12.ms.us/pdf/a/2015/MKAS%203rd%20Grade%20Scores%202015%20-%20Initial%201st%20and%202nd%20Retest%20Combined.pdf13. National Center for Education Statistics (NCES). (2015). Public school expenditures. http://nces.ed.gov/programs/coe/indicator_cmb.asp14. National Center for Education Statistics (NCES). (2015). Integrated Postsecondary Education Data System. http://nces.gov/ipeds/15. Mississippi Department of Education (MDE). (2014). Spring 2014 Mississippi Curriculum Test, 2nd Edition. http://reports.mde.k12.ms.us/report1/r2013-14.aspx16. Mississippi Department of Education (MDE). (2015). 2015 PARCC results for grade 3-8 mathematics and language arts. http://reports.mde.k12.ms.us/report1/r2014-15.aspx17. Attendance Works (2013). The attendance imperative: How states can advance achievement by reducing chronic absence. http://www.attendanceworks.org/wordpress/wp-content/uploads/2013/09/AAM-Policy-Brief-Final-9.16.pdf18. Mississippi KIDS COUNT. (2016). Analysis of student level data files provided by the Mississippi Department of Education for the 2013/14 school year. 19. Buffington, A., Walker, B.H., Patev, A., McCown J.S., Barr, S.G., & Roberts, B. (2016, February). Counting the future: Early attendance charts a path for future success in Mississippi’s schools. http://kidscount.ssrc.msstate.edu/wp-content/uploads/2013/05/policy-brief-WEB-2.pdf20. United States Census Bureau. (2013). Per pupil amounts for current spending of public elementary-secondary school systems by state: Fiscal year 2013 – United States. 2013 Annual Survey of school finances. Table SSF008. http://factfinder.census.gov/faces/tableservices/jsf/pages/productview.xhtml?pid=SSF_2013_SSF008.US01&prodType=table21. National Center for Education Statistics. (2014). Estimated average annual salary of teachers in public elementary and secondary schools, by state: 2013/14. https://nces.ed.gov/programs/digest/d14/tables/dt14_211.60.asp22. Mississippi Department of Education (MDE). (2015, September). Blueprint of new Mississippi assessment program tests available [News release]. http://www.mde.k12.ms.us/TD/news/2015/09/10/blueprint-of-new-mississippi-assessment-program-tests-available23. Mississippi Department of Education (MDE). (2015). 2014-2015 superintendent’s annual report. http://www.mde.k12.ms.us/docs/communications-library/mde_super_report_14_15_digital.pdf?sfvrsn=224. United States Census Bureau, American Community Survey. (2014). Educational attainment of population age 25 and older. 25. Mississippi Department of Education (MDE). (2014). District and school-level results: 2013/14 district graduation rates. http://reports.mde.k12.ms.us/report/report2014.aspx26. United States Department of Labor, Bureau of Labor Statistics. (2016). Employment projections: Earnings and unemployment rates by educational attainment. http://www.bls.gov/emp/ep_chart_001.htm27. Leachman, M., Albares, N., Masterson, K., & Wallace, M. (2016, January). Most states have cut school funding, and some continue cutting. Center on Budget and Policy Priorities. http://www.cbpp.org/sites/default/files/atoms/files/12-10-15sfp.pdf28. Center on Budget and Policy Priorities. (2015). School funding in Mississippi still well below 2008 level. http://www.cbpp.org/sites/default/files/atoms/files/mississippi-k12-factsheet.pdf29. Parent’s Campaign. (2014). Public schools underfunded $1.3 billion in 6 years. http://www.msparentscampaign.org/education-funding.html30. Southward, L. H., Walker, B. H., McCown, J. S., Blalock, L., Bryan, J., & Xhou, X. (2015). 2015 philanthropic giving in Mississippi. Publication developed by the Social Science Research Center in Partnership with the Mississippi Association of Grantmakers and the Foundation Center. Available at msgrantmakers.com
References
18

123456789123456789123456789123456789123456789123456789123456789123456723456789123456789123456789123456789123456789123456789123456789123456783456789123456789123456789123456789123456789123456789123456789123456789
DATABOOK
MISSISSIPPI
countk ids
2 0 0 7
1234567891234567891234567891234567891234567891234567891234567891234567891234567891234567892345678912378912345678912345678912345678912345678912345678913456789123456789123456789123456789123456789123456789456789123456789123456789123456789123456789123456789123456789123456789123456789123456789123456789123459123456789123456789123456789123456789123456789123456789123456789123456789123456789123456789123456789112345678912345678912345678912345678912345678912345678912345678912345678912345678912345678923456789123789123456789123456789123456789123456789123456789134567891234567891234567891234567891234567891234567894567891234567891234567891234567891234567891234567891234567891234567891234567891234567891234567891234591234567891234567891234567891234567891234567891234567891234567891234567891234567891234567891234567891123456789123456789123456789123456789123456789123456789123456789123456789123456789123456789234567891237891234567891234567891234567891234567891234567891345678912345678912345678912345678912345678912345678945678912345678912345678912345678912345678912345678912345678912345678912345678912345678912345678912345912345678912345678912345678912345678912345678912345678912345678912345678912345678912345678912345678911234567891234567891234567891234567891234567891234567891234567891234567891234567891234567892345678912378912345678912345678912345678912345678912345678913456789123456789123456789123456789123456789123456789456789123456789123456789123456789123456789123456789123456789123456789123456789123456789123456789123459123456789123456789123456789123456789123456789123456789123456789123456789123456789123456789123456789112345678912345678912345678912345678912345678912345678912345678912345678912345678912345678923456789123789123456789123456789123456789123456789123456789134567891234567891234567891234567891234567891234567894567891234567891234567891234567891234567891234567891234567891234567891234567891234567891234567891234591234567891234567891234567891234567891234567891234567891234567891234567891234567891234567891234567891123456789123456789123456789123456789123456789123456789123456789123456789123456789123456789234567891237891234567891234567891234567891234567891234567891345678912345678912345678912345678912345678912345678945678912345678912345678912345678912345678912345678912345678912345678912345678912345678912345678912345912345678912345678912345678912345678912345678912345678912345678912345678912345678912345678912345678911234567891234567891234567891234567891234567891234567891234567891234567891234567891234567892345678912378912345678912345678912345678912345678912345678913456789123456789123456789123456789123456789123456789456789123456789123456789123456789123456789123456789123456789123456789123456789123456789123456789123459123456789123456789123456789123456789123456789123456789123456789123456789123456789123456789123456789112345678912345678912345678912345678912345678912345678912345678912345678912345678912345678923456789123789123456789123456789123456789123456789123456789134567891234567891234567891234567891234567891234567894567891234567891234567891234567891234567891234567891234567891234567891234567891234567891234567891234591234567891234567891234567891234567891234567891234567891234567891234567891234567891234567891234567891123456789123456789123456789123456789123456789123456789123456789123456789123456789123456789234567891237891234567891234567891234567891234567891234567891345678912345678912345678912345678912345678912345678945678912345678912345678912345678912345678912345678912345678912345678912345678912345678912345678912345912345678912345678912345678912345678912345678912345678912345678912345678912345678912345678912345678911234567891234567891234567891234567891234567891234567891234567891234567891234567891234567892345678912378912345678912345678912345678912345678912345678913456789123456789123456789123456789123456789123456789456789123456789123456789123456789123456789123456789123456789123456789123456789123456789123456789123459123456789123456789123456789123456789123456789123456789123456789123456789123456789123456789123456789112345678912345678912345678912345678912345678912345678912345678912345678912345678912345678923456789123789123456789123456789123456789123456789123456789134567891234567891234567891234567891234567891234567894567891234567891234567891234567891234567891234567891234567891234567891234567891234567891234567891234591234567891234567891234567891234567891234567891234567891234567891234567891234567891234567891234567891123456789123456789123456789123456789123456789123456789123456789123456789123456789123456789234567891237891234567891234567891234567891234567891234567891345678912345678912345678912345678912345678912345678945678912345678912345678912345678912345678912345678912345678912345678912345678912345678912345678912345912345678912345678912345678912345678912345678912345678912345678912345678912345678912345678912345678911234567891234567891234567891234567891234567891234567891234567891234567891234567891234567892345678912378912345678912345678912345678912345678912345678913456789123456789123456789123456789123456789123456789
12345678912345678912345678912345678912345678912345678912345678912345678912345678912345678923456789123789123456789123456789123456789123456789123456789134567891234567891234567891234567891234567891234567894567891234567891234567891234567891234567891234567891234567891234567891234567891234567891234567891234591234567891234567891234567891234567891234567891234567891234567891234567891234567891234567891234567891
DATABOOK2 0 0 8
56789123456789123456789123456789123456789123456789123456789123456789123456789234567891234567891234567845678912345678912345678912345678913456789123456789123456789123456789123456789123456789123456789123456783456789123456789123456789123456789123456789123456789123456789123456789123456789123456789123456789123456123456789123456789123456789123456789123456789123456789123456789123456789123456789123456789123456789123567891234567891234567891234567891234567891234567891234567891234567891234567892345678912345678912345678945678912345678912345678912345678913456789123456789123456789123456789123456789123456789123456789123456783456789123456789123456789123456789123456789123456789123456789123456789123456789123456789123456789123451234567891234567891234567891234567891234567891234567891234567891234567891234567891234567891234567891234567891234567891234567891234567891234567891234567891234567891234567891234567892345678912345678912345678945678912345678912345678912345678913456789123456789123456789123456789123456789123456789123456789123456734567891234567891234567891234567891234567891234567891234567891234567891234567891234567891234567891234561234567891234567891234567891234567891234567891234567891234567891234567891234567891234567891234567891234567891234567891234567891234567891234567891234567891234567891234567891234567892345678912345678912345678456789123456789123456789123456789134567891234567891234567891234567891234567891234567891234567891234567834567891234567891234567891234567891234567891234567891234567891234567891234567891234567891234567891234561234567891234567891234567891234567891234567891234567891234567891234567891234567891234567891234567891235678912345678912345678912345678912345678912345678912345678912345678912345678923456789123456789123456789456789123456789123456789123456789134567891234567891234567891234567891234567891234567891234567891234567834567891234567891234567891234567891234567891234567891234567891234567891234567891234567891234567891234512345678912345678912345678912345678912345678912345678912345678912345678912345678912345678912345678912345678912345678912345678912345678912345678912345678912345678912345678912345678923456789123456789123456789456789123456789123456789123456789134567891234567891234567891234567891234567891234567891234567891234567345678912345678912345678912345678912345678912345678912345678912345678912345678912345678912345678912345612345678912345678912345678912345678912345678912345678912345678912345678912345678912345678912345678912345678912345678912345678912345678912345678912345678912345678912345678912345678923456789123456789123456784567891234567891234567891234567891345678912345678912345678912345678912345678912345678912345678912345678345678912345678912345678912345678912345678912345678912345678912345678912345678912345678912345678912345612345678912345678912345678912345678912345678912345678912345678912345678912345678912345678912345678912356789123456789123456789123456789123456789123456789123456789123456789123456789234567891234567891234567894567891234567891234567891234567891345678912345678912345678912345678912345678912345678912345678912345678345678912345678912345678912345678912345678912345678912345678912345678912345678912345678912345678912345123456789123456789123456789123456789123456789123456789123456789123456789123456789123456789123456789123456789123456789123456789123456789123456789123456789123456789123456789123456789234567891234567891234567894567891234567891234567891234567891345678912345678912345678912345678912345678912345678912345678912345673456789123456789123456789123456789123456789123456789123456789123456789123456789123456789123456789123456123456789123456789123456789123456789123456789123456789123456789123456789123456789123456789123456789123456789123456789123456789123456789123456789123456789123456789123456789123456789234567891234567891234567845678912345678912345678912345678913456789123456789123456789123456789123456789123456789123456789123456734567891234567891234567891234567891234567891234567891234567891234567891234567891234567891234567891234561234567891234567891234567891234567891234567891234567891234567891234567891234567891234567891234567891235678912345678912345678912345678912345678912345678912345678912345678912345678923456789123456789123456784567891234567891234567891234567891345678912345678912345678912345678912345678912345678912345678912345678345678912345678912345678912345678912345678912345678912345678912345678912345678912345678912345678912345123456789123456789123456789123456789123456789123456789123456789123456789123456789123456789123456789123567891234567891234567891234567891234567891234567891234567891234567891234567892345678912345678912345678945678912345678912345678912345678913456789123456789123456789123456789123456789123456789123456789123456734567891234567891234567891234567891234567891234567891234567891234567891234567891234567891234567891234512345678912345678912345678912345678912345678912345678912345678912345678912345678912345678912345678912345678912345678912345678912345678912345678912345678912345678912345678912345678923456789123456789123456784567891234567891234567891234567891345678912345678912345678912345678912345678912345678912345678912345673456789123456789123456789123456789123456789123456789123456789123456789123456789123456789123456789123456123456789123456789123456789123456789123456789123456789123456789123456789123456789123456789123456789123567891234567891234567891234567891234567891234567891234567891234567891234567892345678912345678912345678456789123456789123456789123456789134567891234567891234567891234567891234567891234567891234567891234567834567891234567891234567891234567891234567891234567891234567891234567891234567891234567891234567891234561234567891234567891234567891234567891234567891234567891234567891234567891234567891234567891234567891232345678912345678912345678912345678913456789123456789123456789123456789123456789123456789123456789123456123456789123456789123456789123456789123456789123456789123456789123456789123456789123456789123456789123489123456789123456789123456789123456789123456789123456789123456789123456789123456789123456789123456789156789123456789123456789123456789123456789123456789123456789123456789123456789234567891234567891234567894567891234567891234567891234567891345678912345678912345678912345678912345678912345678912345678912345678345678912345678912345678912345678912345678912345678912345678912345678912345678912345678912345678912345123456789123456789123456789123456789123456789123456789123456789123456789123456789123456789123456789123456789123456789123456789123456789123456789123456789123456789123456789123456789234567891234567891234567894567891234567891234567891234567891345678912345678912345678912345678912345678912345678912345678912345670909
2 0 0 9
DATABOOK
data book2010/2011
2 0 1 2DATA BOOK
2 0 1 3DATA BOOK
Foreword by Edward Hill, M.D., FAAFP
2015FACTBOOK
FOREWORD BY DR. CAREY M. WRIGHT
FOREWORD BY MORGAN FREEMAN
2016FACTBOOK
19
STAFFLaure BellAnne BuffingtonColleen HarrisBradley LongJohn McCownAlison PatevBen WalkerDr. Linda H. Southward, Director
STUDENTSSarah Gresham BarrJack BryanJustin Johnson
GRAPHIC DESIGN Anna Zollicoffer
The Annie E. Casey Foundation creates a brighter future for the nation's children by developing solutions to strengthen families, build paths to economic opportunity, and transform struggling communities into safer and healthier places to live, work, and grow. Mississippi KIDS COUNT is part of the national KIDS COUNT network of state-based organizations supported by the Annie E. Casey Foundation. For more information about Mississippi KIDS COUNT, visit www.kidscount.ssrc.msstate.edu.
20

www.facebook.com/MississippiKidsCount
www.youtube.com/mississippiKIDSCOUNT
www.pinterest.com/MSKIDSCOUNT
@mskidscount
You Tube
www.KIDSCOUNT.ssrc.msstate.eduEmail: [email protected] Mississippi KIDS COUNT program is made possible, in part, through grants from the Annie E. Casey Foundation and Mississippi State University’s Division of Agriculture, Forestry and Veterinary Medicine. This work is carried out through the Family and Children Research Unit, a division of the Social Science Research Center.
MISSISSIPPI KIDS COUNT, FAMILY AND CHILDREN RESEARCH UNIT