FACT3: Airport Capacity Needs in the National … Airport Capacity Needs in the National Airspace...
44
Transcript of FACT3: Airport Capacity Needs in the National … Airport Capacity Needs in the National Airspace...
FACT3: Airport Capacity Needsin the National Airspace System
January 2015

FROM THE ADMINISTRATOR
Dear Members of the Aviation Community:
This is the third iteration of the Federal Aviation
Administration’s (FAA) long-term outlook for airport
capacity in the United States. Like the previous
studies, the primary goal is to identify airports that
are likely to need more capacity to accommodate
anticipated growth in demand.
Today, most hub airports in the United States
operate efficiently with moderate delays. This is a
significant improvement from prior editions of the
Future Airport Capacity Task (FACT) reports when
delays at many airports were growing and causing a
ripple effect of systemwide delays. The graphic on the following page helps illustrate
the substantial reductions in congestion that have been achieved during the 10 years
since the first FACT report was published.
Working closely with airports, we’ve been able to dramatically enhance capacity at
many airports. This report shows the combined effects of adding 18 new runways
and seven extended runways at 21 busy hub airports since 2000. That’s a
tremendous amount of new capacity that allows traffic to flow more freely in and out
of airports to better serve their communities and the nationwide system. At other
airports, air traffic has decreased with structural changes in the airline industry. As a
result of both enhanced capacity and traffic changes, congestion has been reduced
and the nationwide system is more reliable. Bad weather days have less impact, and
we can recover schedules faster once the weather clears.
Since the publication of the second FACT report in 2007, the aviation industry has
continued to evolve, and we’ve sought to keep pace with ongoing trends in this
report. Our data and modeling of future demand, fleet mix, throughput, air traffic
control (ATC) procedures, and NextGen have all been updated. We’ve also included
surface components to better gauge congestion that can occur on the airport surface
and at gates.
What have we learned? Most (but not all) of our hub airports will be able to function
well in terms of capacity through the next decade. NextGen is helping to manage
delays resulting from increasing congestion at many airports, but NextGen alone
cannot create sufficient additional capacity at some of the largest and busiest
airports. This is not surprising, as FAA has always acknowledged that new runways
and other solutions will still be necessary to address traffic growth and reduce delays.
Therefore, we still have work to do. It’s vital that active airfield work continue at key
hubs like Chicago O’Hare and Philadelphia International Airports if we are to keep
pace with demand and stay ahead of delays. While capacity and delays have
improved nationally, there are a handful of airports with consistent delays – most
notably John F. Kennedy, LaGuardia, Newark, Philadelphia, and in the coming years,
San Francisco. Airline scheduling is increasingly concentrated at major hubs, which
has exacerbated congestion as well. While NextGen will improve performance, it’s
likely that significant congestion will continue to plague these airports unless
additional airfield capacity enhancements can be achieved. The FAA is committed to

supporting continued work in these locations to evaluate and implement effective long-term solutions in collaboration with stakeholders.
Looking further into the future, out to 2030, this report will also show that with cumulative traffic growth, more hub airports will become congested. However, due to aviation industry consolidation and other factors, there is uncertainty with these longer-term projections. For example, the airlines may accelerate the current trend in upgauging to larger aircraft, flying more passengers on fewer flights. With these short- range fluctuations, it's chal lenging to determine when long -term capacity enhancements will be needed. Nonetheless, this long-term outlook warrants careful monitoring and continuing airport planning efforts in order to stay ahead of congestion and delay as the economy improves and air travel demand picks up.
Where do we go from here? Principally, the findings of this report underscore the continued need for investment in aviation infrastructure. The airports identified in th is report need to continue progress on their runway projects and other airfield enhancements, while FAA and our industry partners need to continue the push fo rward with NextGen. Both airport development and NextGen are complementary of course. Together, they enable efficient, reliable access to the safest and most dynamic aviation system in the world.
t:iC:ft:tV FAA Administrator
FACT1 FACT2 FACT3Airport 2004 2013 2020 2007 2015 2025 2011 2020 2030
ABQ
ATL
BDL
BHM
BOS
BUR
BWI
CLT
CVG
DCA
DEN
DFW
DTW
EWR
FLL
HOU
IAD
IAH
ISP
JFK
LAS
LAX
LGA
LGB
MDW
MEM
MIA
MSP
OAK
ONT
ORD
PBI
PHL
PHX
PVD
SAN
SAT
SEA
SFO
SLC
SNA
STL
TUS
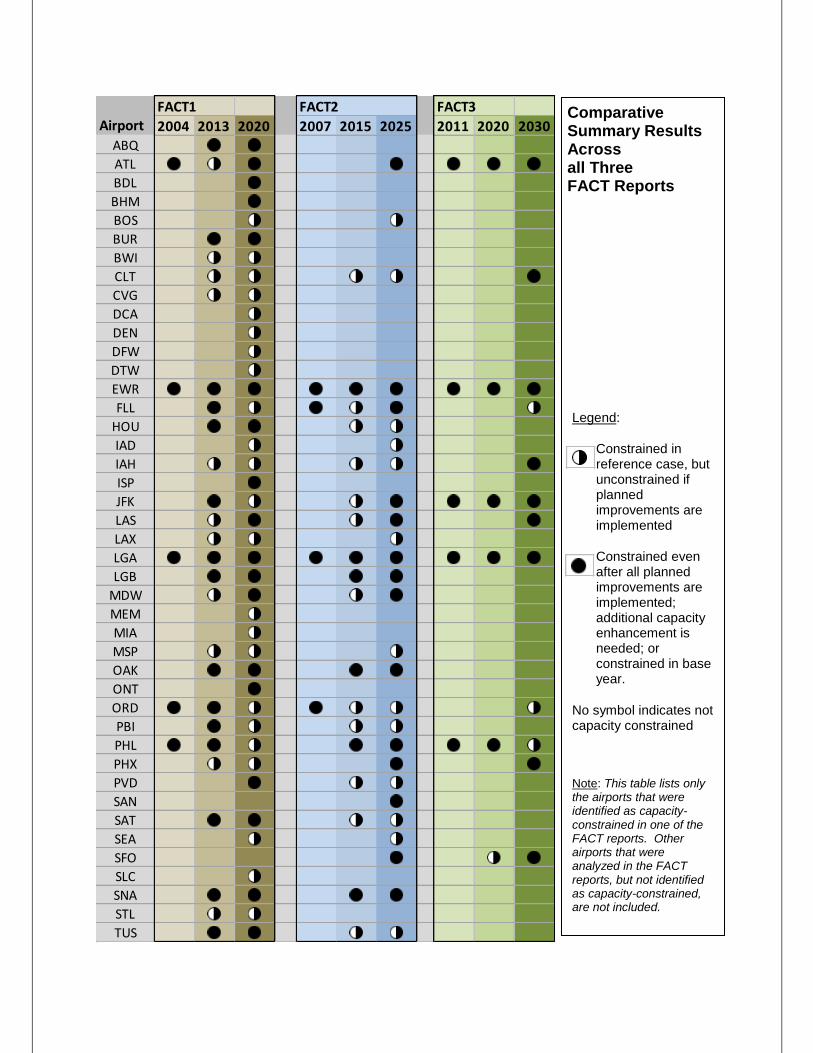
Comparative Summary Results Across all Three FACT Reports
Legend:
Constrained in reference case, but unconstrained if planned improvements are implemented
Constrained even after all planned improvements are implemented; additional capacity enhancement is needed; or constrained in base year.
No symbol indicates not capacity constrained
Note: This table lists only the airports that were identified as capacity-constrained in one of the FACT reports. Other airports that were analyzed in the FACT reports, but not identified as capacity-constrained, are not included.
FACT3: Airport Capacity Needs in the National Airspace System
Page i January 2015
TABLE OF CONTENTS SUMMARY INTRODUCTION ............................................................................................ 1
Airport Capacity Constraints and Congestion through 2020 .................................................... 2
What is expected by 2030? .................................................................................................. 3
NAS Modernization: NextGen and New Runways .................................................................. 3
Recommendations .............................................................................................................. 4
METHODOLOGY AND INPUTS – WHAT HAS CHANGED SINCE FACT2? .......................... 5
Updated Forecast and Fleet Mix Data ................................................................................... 5
Planned Improvements: Runways, NextGen, and NAS Modernization .................................... 7
Airport Selection ............................................................................................................... 10
Models and Identification Criteria ....................................................................................... 10
Airport Capacity Profiles and ASV Studies ........................................................................... 11
COORDINATION WITH AFFECTED AIRPORTS.............................................................. 12
FINDINGS OF THE FACT3 REPORT ............................................................................... 12
Congested Airports in 2011................................................................................................ 13
Interim Capacity Needs in 2020 ......................................................................................... 14
Needed Capacity Beyond What is Currently Planned for 2020 ...................................................... 17
Airport Capacity Improvements by 2020 .................................................................................... 17
Long-Term Capacity Needs in 2030 .................................................................................... 18
Needed Capacity Beyond What is Currently Planned for 2030 ...................................................... 19
Airports Capacity Improvements by 2030 ................................................................................... 21
Airports With Some Congestion to be Monitored ................................................................. 21
CONCLUSIONS AND RECOMMENDATIONS .................................................................. 22
APPENDIX A: STUDY AIRPORTS ............................................................................... A-1
APPENDIX B: METHODOLOGY ................................................................................... B-1
Introduction ................................................................................................................... B-1
Study Scope and Scenarios .............................................................................................. B-1
Airport Selection ............................................................................................................. B-1
Demand ......................................................................................................................... B-3
Refined and Expanded Methodology................................................................................. B-3
Modeling ........................................................................................................................ B-4
Annual Service Volume ............................................................................................................ B-4
NAS-Wide Modeling ................................................................................................................ B-4
Identification Criteria ....................................................................................................... B-6
FACT3: Airport Capacity Needs in the National Airspace System
Page ii January 2015
APPENDIX C: COMPARISON OF FACT1/2/3 METHODOLOGIES ................................ C-1
APPENDIX D: SENSITIVITY ANALYSIS OF THE 2013 TAF ON FACT3 RESULTS ........ D-1
Overview of the 2013 TAF ............................................................................................... D-1
Methodology for Estimating Effect of Demand Changes on FACT3 Results .......................... D-2
Potential Effect of the 2013 TAF....................................................................................... D-3
2020 Reference Scenario ......................................................................................................... D-4
2020 Improvements Scenario .................................................................................................. D-4
2030 Reference Scenario ......................................................................................................... D-5
2030 Improvements Scenario .................................................................................................. D-5
LIST OF FIGURES
Figure 1. Actual and Forecasted Annual Operations at 30 Core Airports .................. 6
Figure 2. FACT3 Scenarios in 2020 and 2030 ...................................................... 8
Figure 3. Airports Needing Capacity Today (2011) ............................................. 14
Figure 4. Airports Needing Additional Capacity in 2020 ...................................... 16
Figure 5. Airports Needing Additional Capacity in 2030 ...................................... 20
LIST OF TABLES
Table 1. Airports Needing Additional Capacity in 2020 ........................................ 15
Table 2. Capacity Enhancement and Congestion Reduction in 2020 ..................... 18
Table 3. Airports Needing Additional Capacity in 2030 ........................................ 19
Table 4. Capacity Enhancement and Congestion Reduction in 2030 ..................... 21
Table 5. Airports With Some Congestion to be Monitored .................................... 22
FACT3: Airport Capacity Needs in the National Airspace System
Page 1 January 2015
SUMMARY INTRODUCTION
In 2003, FAA convened a team to assess the Nation’s future airport capacity needs. This
effort, which became known as the Future Airport Capacity Task (FACT), represents a
strategic approach to identify the airports that have the greatest need for additional
capacity in the future. The identification is based on a macro-level analysis of the factors
and trends contributing to congestion and delay at the busiest airports in the Nation. By
embarking on this initiative, FAA seeks to ensure that the long-term capacity of the
U.S. aviation system can adequately serve future demand.
The team is led by the Office of Airports (ARP) and includes active participation from the
Air Traffic Organization (ATO) Capacity Analysis Group and the MITRE Corporation’s Center
for Advanced Aviation System Development (CAASD). The FAA’s Office of Aviation Policy
and Plans (APO) and the NextGen office (ANG) are also involved in the conduct of the
studies.
The first report in the series, commonly known as FACT1, was published in 2004 and
identified shortfalls in the system through 2020. This study was the first top-down review
of the busiest commercial service airports in the Nation. The report’s findings supported the
need for a substantial number of major airport capacity projects nationwide. After
considering all planned improvements at the time, 18 airports were projected as needing
additional capacity by 2020.
An updated report, FACT2, was published in 2007 to identify shortfalls through 2025.
FACT2 included a more transparent methodology and refined analytical methods. Fourteen
busy hub airports located in the Nation’s most populated regions (such as the Northeast
Corridor and California coast) were projected to be capacity-constrained in 2025 even with
completion of all planned improvements, as then contemplated. Notably, the report also
reaffirmed that key runway projects would allow several hub airports to reduce delays and
continue growing; this supported the completion of five new runways that have been
commissioned at hub airports since the report’s publication. The report provided an initial
look at capacity benefits from the Next Generation air traffic control (ATC) system, better
known as NextGen. The FAA’s investment in NextGen began in 2007. The graphic following
the Administrator’s letter provides a comparison of the FACT1, 2, and 3 report results.
All of the FACT reports have begun with a broad sampling of several hundred commercial
service and busy general aviation airports nationwide. From this initial step, a smaller
number of airports are identified for more detailed study. Both FACT1 and FACT2 evaluated
capacity and delay at 56 airports, including the 35 airports that were part of the now
completed Operational Evolution Plan (OEP). FACT3 conducted a more detailed evaluation
of 48 airports, including the 30 Core airports that FAA currently tracks as a measure of
system performance in the National Airspace System (NAS).
Since the publication of FACT2, the aviation industry in the United States has continued to
rapidly evolve. Due to the Great Recession and volatile (often higher) fuel costs, airlines
have emphasized better ticket yields, fees, and load factors, rather than improved market
share as a strategy for profitability. Airlines have consolidated through mergers and have
increasingly focused their connecting operations at major hubs. While the use of 50-seat
regional jets (RJ) has grown substantially during the last decade, these aircraft are now
leaving the fleet due to their higher fuel costs and upcoming major maintenance cycles.
Airlines are replacing these smaller RJs with larger RJs and narrow-body aircraft, enabling
FACT3: Airport Capacity Needs in the National Airspace System
Page 2 January 2015
airlines to accommodate passenger growth but with fewer operations. Collectively, these
factors have resulted in relatively flat traffic growth over the last few years. As a result, the
FAA forecast estimates 32 percent fewer operations and about 23 percent fewer enplanements in 2025 at the 30 Core airports than the forecast used in FACT2.
FACT3 is scoped to incorporate many of these trends through 2020 and 2030. In addition
to updated forecasts, the FACT3 analysis includes current aircraft fleet mix projections,
updated NextGen planning (which has matured substantially since 2007), and modeling of
gate and surface constraints on airport capacity.
The FACT3 assessment relies on a similar systemwide modeling approach as that used by
FAA to estimate the midterm benefits of NextGen, as well as the same airport capacity
assumptions and air traffic projections. Thus, the FACT3 results are consistent with the
overall delay reduction benefits reported in the Business Case for NextGen. Where FACT3
differs is in the use of location-specific metrics (e.g., percent of congested operating hours
above a delay threshold) that describe future congestion levels at airports. FACT3 also
incorporates a near-term NextGen scenario that reflects only the specific capabilities that
are ready and expected to be widely deployed in the NAS within the next few years. In
contrast, the analytical results reported in the Business Case for NextGen reflect all of the
midterm NextGen capabilities to calculate total system wide delay savings. While the
Business Case quantifies total NextGen benefits for the entire NAS, FACT3 is meant to
provide airport-specific results that can inform local infrastructure planning discussions.
In brief, the FACT3 report findings support the following:
Airport Capacity Constraints and Congestion through 2020
• Today delays are concentrated at a few major hub airports, which reflect ongoing trends
towards airline consolidation at their hubs. The New York City (NYC) area airports,
Philadelphia International Airport (PHL), and Hartsfield-Jackson Atlanta International
Airport (ATL) have significant congestion.1
• The NYC area airports (Newark Liberty International (EWR), John F. Kennedy
International (JFK), and La Guardia (LGA)) will continue to have significant capacity
constraints through 2020; LGA and JFK delays are expected to worsen such that
congestion will become severe.2
• At ATL, the new runway that opened in 2006 and area navigation (RNAV) flight
procedures have improved the airport’s capacity; however, the airport remains prone to
delays due to demand growth and arrival/departure banks in the schedule of the
airport’s primary airlines. Delays at ATL are projected to continue to grow through
2020. However, the use of larger aircraft by the airport’s primary airlines and/or a more
balanced flight schedule could mitigate these delay projections.
1This report identifies airports with their three-letter FAA location identifiers. For a complete list, see Appendix A.
2At the NYC area airports, the FAA forecast assumes unconstrained operations demand growth at JFK and EWR and constrained growth at LGA. Since FACT3 uses the Terminal Area Forecast (TAF), the additional congestion projected is a reflection of demand growth above the existing schedule limits. Should the schedule limits continue (due to future regulatory action), there will be less congestion than this report projects.

FACT3: Airport Capacity Needs in the National Airspace System
Page 3 January 2015
When implemented at San Francisco International Airport (SFO), midterm NextGen
capabilities will be sufficient to reduce delays below the significance criteria due to more
efficient flight procedures. Without midterm NextGen, SFO is projected to be capacity-
constrained in 2020.3
• The planned runway extensions at PHL will serve to reduce average arrival delays,
although the airport is projected to remain significantly congested if the planned new
parallel river runway is not constructed.
What is expected by 2030?
• The 2030 scenarios show that with steady traffic growth as forecasted, delays will
continue to grow. Without planned improvements beyond near-term NextGen,
12 airports will have significant congestion, including 11 that will have severe congestion
as shown in Table 3 and Figure 5.
The implementation of midterm NextGen capabilities is expected to reduce growth in
delays at the capacity-constrained airports by about 26 percent, with a slight increase in
total throughput of up to 2 percent. This is as compared to the 2030 Reference Scenario
(i.e., no further improvements beyond near-term NextGen). Although this is a
worthwhile improvement, the congestion reduction is not sufficient to keep these
airports below the FACT3 significance criteria.
• Of particular note, the runway development projects (both ongoing and future phases)
at Fort Lauderdale/Hollywood International Airport (FLL), Chicago O’Hare International
Airport (ORD), and PHL provide sufficient capacity to keep these airports from becoming
severely congested by 2030.
NAS Modernization: NextGen and New Runways
• Many of the NextGen capabilities provide incremental benefits – a moderate throughput
increase, or the ability to fly more efficient routes, or optimized descents that save fuel.
Time-based metering can optimize traffic flow into an airport. Surface metering
methods and decision support tools allow for improved data sharing and coordination.
This reduces capacity losses that would otherwise occur during certain adverse
conditions. These capabilities are important as they improve the efficiency,
predictability, and reliability of the entire NAS. Still, if an airport is facing a substantial
shortfall in capacity, the best answer is often new pavement. The optimal combination
of solutions in each particular location depends on the scale of the capacity/demand
imbalance and the specific operational issues that need to be addressed. Often, at
congested airports, both are necessary to foster improved operational performance. For
example, NextGen improvements may be needed to maximize the capacity benefits of a
new runway.
3Currently, SFO is designated by FAA as Level 2 under the International Air Transport Association Worldwide Slot Guidelines. Level 2 indicates that there is a potential for congestion that could be managed by voluntary means. This designation is necessary due to runway capacity, existing congestion and delays, and expected increased congestion with multiyear airport construction projects. The FAA is working with airlines serving SFO to voluntarily adjust schedules to reduce delays.

FACT3: Airport Capacity Needs in the National Airspace System
Page 4 January 2015
• NextGen has benefits that may prove to be as important as outright capacity
enhancement. Significant improvements in the reliability and predictability of operations
across the NAS will help airlines better maintain and recover flight schedules during
inclement weather. However, these predictability and reliability benefits will not be
readily apparent in the high-level systemwide capacity benefits presented in the FACT3
report.
• Gates and taxiway infrastructure do not constrain capacity at most airports, now or in
the future. In general, the largest and busiest airports have been able to build gates
when they are needed—and many airports are making better and more efficient use of
their gates through more flexible leasing arrangements.
Recommendations
• While NextGen capabilities will mitigate delays at the capacity-constrained airports,
congestion will continue to impede efficiency and growth. The remaining gap shows why
additional solutions such as new runways, regional emphasis, congestion management,
multimodal transportation, and further NextGen development are so important.
• Given the evolving trends and shifts in the aviation industry, along with a much higher
level of volatility, there is considerable uncertainty surrounding any projection that is
nearly two decades into the future (i.e., the 2030 scenarios). Sources of uncertainty
include traffic growth, how quickly the airlines add larger aircraft to their fleet to replace
smaller aircraft, demographic and socioeconomic shifts, and the realization of capacity
improvements from NAS modernization initiatives. However, with several consecutive
years of sustained operations growth at any of the Core airports, the long-term delay
concerns will become much more tangible. As a result, it remains crucial for these
airports to continue their efforts to devise long-term planning solutions to address
capacity constraints.
• The immediate focus should be on identifying solutions for airports identified as
capacity-constrained in any of the 2020 scenarios. These airports are likely to be
capacity-constrained under a variety of scenarios. Airports such as SFO and the NYC
area airports cannot easily be expanded to meet unconstrained demand. At the NYC
area airports, FAA limits on operations are currently in effect. If the schedule limits
continue due to future regulatory action, this will not diminish the need for capacity
enhancement at the NYC area airports. A focused effort will be needed to identify viable
solutions that can be implemented during this decade.
FACT3: Airport Capacity Needs in the National Airspace System
Page 5 January 2015
METHODOLOGY AND INPUTS – WHAT HAS CHANGED SINCE
FACT2?
The FAA has undertaken this third FACT analysis in order to identify airports that are
expected to have capacity needs in the future, given several possible scenarios for demand
growth and capacity expansion.
Much has changed since the publication of FACT2 in 2007. The aviation industry in the
United States has continued to evolve. Due to the Great Recession and volatile (often
higher) fuel costs, airlines have emphasized better ticket yields and fees, rather than
improved market share, as a strategy for profitability. Airlines have consolidated through
mergers and have increasingly focused their connecting operations at major hubs. While
the use of 50-seat RJs has increased substantially during the last decade, these aircraft are
now leaving the fleet due to their higher fuel costs and upcoming major maintenance cycles.
Collectively, these factors have resulted in relatively flat operations and enplanement
growth over the last few years. As a result, FAA forecast estimates 32 percent fewer
operations in 2025 at the 30 Core airports than the forecast used in FACT2.
FACT3 is scoped to incorporate many of these trends. In addition to updated forecasts, the
FACT3 analysis includes current aircraft fleet mix projections, updated NextGen planning
(which has matured substantially since 2007), and modeling of gate and surface constraints
on airport capacity. FACT3 also contains refined modeling and selection criteria.
This section identifies several changes made to the FACT process since the publication of the
FACT2 report. Appendix B provides more detail on the methodology. Appendix C provides
a summary of the FACT input changes through the various iterations of this report.
Appendix D provides a sensitivity analysis of the FACT3 findings, given the changes in
forecasted demand with the FAA’s annual forecast update.
Updated Forecast and Fleet Mix Data
The FACT3 analysis uses the 2012 version of the FAA’s TAF, as published in January 2013.4
At the 30 Core airports, the TAF forecasts 14.2 million total operations and 606.5 million
enplanements in 2020. In 2030, 16.7 million total operations and 769.0 million
enplanements are forecast. This reflects annualized operational growth of 1.1 percent
through 2020 and then 1.6 percent through 2030. Enplanements are forecast to grow at a
faster rate of 2.1 percent through 2020 and then 2.7 percent to 2030. The average seat
per aircraft in the fleet is expected to increase over this period, as enplanements are
forecast to grow faster than operations.
The original FACT1 report was based on the TAF released in 2003, while the FACT2 report
used the 2005 release of the TAF, as well as MITRE CAASD’s Future Air Traffic Estimator5
(FATE) forecast. The 2003 and 2005 TAFs were reflective of a period in which the aviation
industry was recovering from the September 11, 2001, terrorist attacks and the economy
4The FAA updates the TAF every year.
5The FATE forecast methodology is being transferred into the FAA’s modernized TAF, known as TAF-M.

FACT3: Airport Capacity Needs in the National Airspace System
Page 6 January 2015
was growing steadily. In contrast, the 2013 TAF used in the FACT3 report shows the effects
of the economic contraction in 2008 and 2009 on the aviation industry and the stabilization
of the industry through 2012. Figure 1 provides a comparison of the TAF operational levels
at the 30 Core airports from FACT2 to FACT3.
Figure 1. Actual and Forecasted Annual Operations at 30 Core Airports
Because the TAF is a forecast of unconstrained demand, FACT3 seeks to evaluate long-term
capacity needs of the airport system as needed to meet demand growth without constraints.
However, at a few very congested airports, a trimming algorithm is used to smooth
schedule peaks and limit operations in the FACT3 analysis.6 Even with trimming, these
airports remain highly delayed.
Fleet mix is a particularly important factor in assessing future airport congestion. For a
given number of passengers who want to travel by air, a fleet with a smaller average seat
count will result in more aircraft operations. This trend was evident in the last decade with
the increasing use of 50-seat RJs. However, the current trend is towards somewhat larger
aircraft, which are more fuel efficient as reflected in the current TAF. For the same amount
of growth in passengers, this results in a lower rate of growth in aircraft operations. The
amount of benefit with some NextGen improvements, such as Wake Recategorization, is
also dependent on fleet mix. The NAS-wide simulation used in FACT3 includes a dynamic
fleet mix that evolves over time using the FAA Fleet Forecast. FACT3 also uses an annual
service volume (ASV) model with a static fleet mix based on the current fleet at an airport.
The separate fleet mix assumptions provide useful variation in the estimates of future
delays at an airport.
6The trimming algorithm is meant to mimic historical airline and FAA actions at ORD, LGA, JFK, and EWR to reduce delays. However, the trimming algorithm does allow some growth in future years, including growth above the current FAA schedule limits at the NYC area airports.
0
5
10
15
20
25
1980 1985 1990 1995 2000 2005 2010 2015 2020 2025 2030
An
nu
al A
ircr
aft
Op
era
tio
ns
(Mill
ion
s) a
t 3
0 C
ore
Air
po
rts
Year
TAF2005 (FACT2)
TAF2012 (FACT3)
FACT3: Airport Capacity Needs in the National Airspace System
Page 7 January 2015
Planned Improvements: Runways, NextGen, and NAS Modernization
The FACT3 analysis includes planned improvements affecting runway capacity for two future
planning periods, 2020 and 2030. The FACT estimates of future capacity needs incorporate
the best available information about planned improvements to the ATC system, as well as
runway and airport infrastructure improvements.
FACT3 is aligned with the FAA’s overall NextGen implementation strategy in order to
incorporate relevant NextGen assumptions into the study. NextGen is a portfolio of
capabilities that will improve the capacity, efficiency, safety, and environmental
performance of the NAS. NextGen planning has matured greatly since the publication of
FACT2 with the formation of the FAA’s NextGen office. The FAA published the NextGen
Implementation Plan (NGIP), which provides an overview of NextGen capabilities and
implementation timeframes. The NextGen assumptions used in FACT3 are derived from
the Agency’s overall NextGen planning, including the NGIP as well as internal planning
documents,7 which describe NAS modernization efforts extending to the year 2020.
FACT3 assesses the capacity benefits of NextGen concepts at airports and estimates how
they will help reduce growth in delays through enhanced ATC techniques, technologies, and
procedures. While capacity is a NextGen benefit, it is important to note that many of the
capabilities are more focused on efficiency, shared situational awareness, and flexibility.8
These will improve the predictability and reliability of the NAS in ways that are perhaps
more important than capacity, by allowing more nimble reroutes of air traffic around lines of
thunderstorms; or allowing a faster recovery of normal operations when a weather event
impacts a metropolitan area (such as a snowstorm in the Mid-Atlantic region). While these
types of benefits are not assessed in the FACT3 models and metrics, the overall benefit to
the NAS should not be underestimated.
Two primary scenarios are used in FACT3 to assess airport capacity and congestion in 2020
and 2030 as shown in Figure 2. The improvements included in each scenario are described
on the following pages.
7FAA NAS Segment Implementation Plan (NSIP), version 4. The FACT3 assumptions reflect elements of Segment A for near-term NextGen and the remainder of Segment A plus Segment B for midterm NextGen.
8When used in the context of NextGen benefits, efficiency is often used to describe fuel savings that result from optimized flight procedures. Efficiency in this context does not necessarily indicate delay savings related to capacity enhancement.

FACT3: Airport Capacity Needs in the National Airspace System
Page 8 January 2015
Figure 2. FACT3 Scenarios in 2020 and 2030
Improvements
Reference
Scenario:
No further
improvements beyond near-term NextGen
Improvements
Scenario:
After planned
improvements with
mid-term NextGen and runways
Existing airport infrastructure as of 2011
New or extended runways at FLL, ORD,
and PHL
Near-term NextGen
Mid-term NextGen
New or revised ATC flight procedures, including airspace redesign
Existing noise abatement procedures
Gate development plans
The Reference Scenario, which encompasses no further improvements beyond near-term
NextGen, includes existing airport infrastructure (as of 2011), as well as existing ATC
procedures and airspace design. Also included are new or extended runways that have
opened at ORD, Seattle-Tacoma International Airport (SEA), Washington Dulles
International Airport (IAD), PHL, and Charlotte/Douglas International Airport (CLT), since
FACT2 was published. This scenario includes mature NextGen capabilities that are expected
to be widely deployed in the NAS within the next few years:
Near-term NextGen: From an implementation perspective, NextGen is a long-term,
incremental program. The initial building blocks establish the foundation for future
segments of NextGen to be implemented. FACT3 evaluates two segments of NextGen
and their effects on airport capacity. The first segment, known as near-term NextGen,
includes the capabilities in the NGIP that are mature, funded and are either being
deployed today or will achieve initial deployment in the NAS by the end of 2015. ATC
capacity improvements include the initial phase of Wake Recategorization, an increased
use of Traffic Management Advisor and Converging Runway Display Aids, and a
demonstration of Wake Turbulence Mitigation for Departures. Several improvements to
dependent and independent closely spaced parallel operations are also included. The
implementation, use, and benefit of these tools and procedures vary, given the unique
configurations and operational needs of an airport.
The Improvements Scenario includes the following additional planned improvements:
New or Extended Runways. New runways are included in FACT3 at FLL, ORD, and
PHL as planned improvements. At FLL, the extended and widened Runway 10R/28L

FACT3: Airport Capacity Needs in the National Airspace System
Page 9 January 2015
opened in September 2014. At ORD, the completion phase of the O’Hare Modernization
Program is planned by 2020.9 Two runway extensions are planned at PHL by 2020 as
part of its Capacity Enhancement Program (CEP). All of these runway projects are
included in the 2020 Improvements Scenario.10
The completion of the new parallel river runway at PHL, which is planned for early in the
next decade, is incorporated into the 2030 scenario with planned improvements at PHL.
Runway improvements are being considered at other airports as well, and several site-
specific studies are underway at Denver International Airport (DEN), George Bush
Intercontinental/Houston Airport (IAH), CLT, and ATL. However, these projects have not
reached sufficient maturity to be included in FACT3.
Midterm NextGen. The second segment of NextGen capacity improvements builds on
the capabilities achieved in the near-term segment. ATC capacity improvements include
use of Wake Turbulence Mitigation for Departures at additional airports; enhanced
closely spaced parallel runway operations, including Wake Turbulence Mitigation for
Arrivals; and improved metering of traffic within congested terminal airspace. Improved
departure fanning enabled by RNAV routes is also expected at several airports. The
integration of NextGen communications, navigation, and surveillance capabilities is also
estimated to improve the precision and reduce the separation buffer of arrivals coming
into congested airspace and airports. Overall, the midterm segment includes capabilities
that are expected to be achieved in the NAS by 2020.
New or Revised ATC Procedures. If a new or revised ATC procedure is planned at an
airport by FAA, with either NextGen or a complementary NAS modernization initiative, it
was modeled as an improvement in this report. Examples include increased use of
simultaneous offset approaches at SFO and improved departure throughput with RNAV-
based departures at ATL.
Airspace Redesign. Improvements derived from the redesign of the airspace
surrounding an airport were reflected in the 2020 scenarios based on the best
information available. This includes longer-term airspace projects such as the Las Vegas
and New York/New Jersey/Philadelphia airspace redesigns, as well as completion of the
first phase of the FAA’s Metroplex11 initiative to streamline Performance Based
Navigation (PBN) routes and procedures. Airspace redesign efforts are primarily focused
on efficiency (including fuel burn and route mileage reductions) and flexibility
improvements, rather than capacity. Detailed airspace redesign itself was not
performed as part of this analysis.
9Completion of the O’Hare Modernization Program includes Runways 10C/28C in 2013 and 10R/28L in 2015. The Runway 9C/27C and 9R/27L extensions are assumed to be completed by 2020.
10PHL CEP includes extension of Runways 8/26 and 9R/27L by 2020 and then construction of a new south parallel runway along the Delaware River a few years later. As such, this runway is included in the 2030 improvement scenarios.
11Also known as Optimization of Airspace and Procedures in the Metroplex (OAPM).
FACT3: Airport Capacity Needs in the National Airspace System
Page 10 January 2015
Other Assumptions. The FACT3 analysis assumed that existing noise abatement
procedures, which can affect runway capacity, would continue as is into the future
planning periods. Terminal gate development plans were also included. Detailed
taxiway or ground access improvements were not included in this analysis because they
were outside the scope of the models used.
Airport Selection
The goal of FACT is to identify those airports that are expected to be capacity-constrained in
the future; however, it is impractical to analyze all of the existing 3,330 airports in the
FAA’s National Plan of Integrated Airport Systems (NPIAS) to the required level of detail.
Therefore, a screening method was used to select candidate airports where excessive delays
could potentially have a significant impact on the efficiency of the NAS, including:
• Core airports: 30 commercial service airports that have been identified by FAA as
having a significant role in the NAS due to their level of operations or passengers;
• Potentially constrained commercial airports: commercial service airports with projected
traffic growth that may stress their current capacity; and
• General aviation airports: other airports with a substantial level of traffic, even if
primarily general aviation, which can affect airspace and air traffic in multi airport areas
like New York and Southern California.
In all, 48 airports were included in the FACT3 analysis as shown in Appendix A.
Models and Identification Criteria
As in FACT2, the FACT3 analysis was based on both ASV and NAS-wide modeling tools. The
use of two modeling techniques is a strength of the FACT approach as the synthesized
results can incorporate a comprehensive set of operational parameters.
ASV calculates the yearly demand that results in a given level of average delay in simulated
operations. ASV studies are conducted by the Capacity Analysis Group (AJR-G5) at the
FAA’s William J. Hughes Technical Center. ASV analysis considers multiple runway
configurations, weighted by the annual frequency of occurrence, and utilizes an annual
estimation of weather conditions for each configuration in its calculation. The resulting
demand-delay curve can be used to estimate the average annual delay that results at a
given level of annual demand.
As the name implies, NAS-wide simulations allow for the assessment of aircraft operations
across the entire system. MITRE CAASD conducts NAS-wide studies for the FACT reports.
Calculated capacity curves are used for each airport with adjustments over time for future
fleet mixes. With faster processing capability, 16 demand days, with a mix of weather
conditions, are simulated for each scenario (versus only two traffic scenarios, “good
weather” and “bad weather” for FACT2). NAS-wide modeling was expanded from runways
and airspace to include taxiway and gate constraints.
FACT3: Airport Capacity Needs in the National Airspace System
Page 11 January 2015
Both the ASV and the NAS-wide models were used to define whether an airport would be
considered “congested” or “capacity-constrained” in a scenario.12 13
• Caution: this status identifies airports that are not capacity constrained but have
delays approaching the capacity-constrained criteria. An airport falls into this caution
designation if the ASV delay was 5 minutes or greater or the percentage of congested
hours14 was 20 percent or greater for either arrivals or departures.
• Congested: to be designated as capacity constrained or congested, an ASV delay of
7 minutes per flight or greater was needed, as well as an NAS-wide estimate of
30 percent or more of the arrival or departure hours at the airport being congested.
• Severe: as a subset of the capacity-constrained airports, some airports have estimated
delay and congestion that are an order of magnitude higher than the initial criteria for
identification. An ASV delay of 15 minutes or greater and a percentage of congested
hours at or above 50 percent is considered to be severely capacity constrained.
Given the consolidation of airline operations at fewer airports and the general challenges of
applying a macro-level approach to regional system planning, the identification of congested
metropolitan areas is less significant today than when done in the FACT2 report.
Accordingly, the designation of metro areas as congested is not included in the FACT3
report. Nonetheless, this report recognizes that certain key metro areas with multiple
airports, such as the NYC area, are effectively congested under almost any measure due to
airport delays and airspace complexity. Where possible, encouraging traffic growth to
unconstrained airports in a metro area is worthwhile but often has practical constraints.
Effectively, the analysis of metro area airport systems is better conducted with a more
regionally focused methodology than is possible with FACT.
Airport Capacity Profiles and ASV Studies
As a companion publication to the FACT3 report, capacity curves similar to those used in the
NAS-wide modeling are available for selected airports on the FAA Web site. The airport
capacity profiles provide a range of model-estimated and facility called rates for both
existing and future conditions. The profiles replace the benchmarks that were last published
in 2004. In addition, the ASV studies are available to airport sponsors upon request.
12FACT3 criteria must not be considered as an FAA definition of acceptable delay for the purpose of justifying proposed airport development without prior consultation with the FAA’s Office of Airport Planning and Programming, Airport Planning and Environmental Division (APP-400).
13Due to the complexity of operations at LGA, only the NAS-wide model was used to assess future congestion at the airport.
14A congested hour is defined by having a high level of delay for either arrivals or departures. A congested delay level is defined as the 90th percentile value seen at the 30 Core airports in the 2011 NAS-wide baseline simulation. The hours between 0700 and 2259 local time on the 16 representative days were considered in the determination and application of this metric. See Appendix B for additional information.

FACT3: Airport Capacity Needs in the National Airspace System
Page 12 January 2015
COORDINATION WITH AFFECTED AIRPORTS During May, June, and July 2014, the FACT3 analysis was briefed to each of the airports
identified as being capacity constrained in future years. Each airport operator was briefed
on the assumptions used in the analysis, as well as the draft results. Often, the airport
operator agreed with the FACT3 analysis. Others thought the analysis may have over- or
under-estimated airport capacity. Several airports noted changes in gate assignments or
terminal development plans, as well as the ongoing effects of airline mergers.
Ongoing changes at airports are expected of course. Given the medium-level fidelity of the
models used in this report, the primary value of the simulation modeling is for trend
analysis. New gate assignments and similar smaller-scale changes do not substantively
affect the long-term trends projected by FACT3. This is because the trend projections for
future delays are more relevant and telling than a single-point, deterministic value that can
vary with small changes.
FINDINGS OF THE FACT3 REPORT Consistent with FACT2, this report also finds that several of the Nation’s busiest hub airports
are and will be capacity constrained in future years.
As would be expected, the findings from the various iterations of FACT have evolved over
time. Effectively, while aggregate future demand is lower than in previous FACT reports,
the ability of the NAS to handle demand is also greater. Ten of the 30 Core airports have
been successful in adding new runway capacity with either new runways or extensions,
since the first FACT report was published in 2004. The ATC has also enhanced efficiency
with airspace redesigns, including improved flight routes and procedures. Many large hub
airports have seen steady traffic growth as airlines have sought to increasingly focus
connecting traffic at their established hubs. Other airports have seen significant and
sustained reductions in operations. As a result, some airports are no longer designated as
congested by FACT. A full comparison of the FACT findings by airport is provided following
the Administrator’s introductory letter.
As a macro-level assessment of the airport system, FACT3 is not intended to evaluate all
aspects of an operation at each individual airport. For example, some airports may have
taxiway limitations that cause significant operational delays on the surface. While FACT3
does reflect consideration of general surface and gate constraints, it does not use a detailed
taxiway layout. Airports have many different runway configurations used throughout the
year. Most airport configurations are captured in the ASV model; however, the NAS-wide
modeling is limited to the three most common runway configurations during visual,
marginal, and instrument conditions. As such, the performance of an individual airport may
not be fully represented, and some future problems may not be captured or identified. While
FAA considers the FACT3 findings to be representative of the future performance of the
airport system, the limitations discussed above do influence the overall results.
The FACT3 analysis should be considered in combination with studies being prepared for
specific airports. These studies are focused specifically at the airports of interest and may
be more detailed and take into consideration additional constraints not accounted for in the
FACT3 methodologies. Furthermore, inclusion of capacity enhancement for which there is an
ongoing National Environmental Policy Act evaluation should not be construed as
predetermination of approval by FAA, but rather as a “what-if” assessment of potential
benefit. Similarly, inclusion of an NAS modernization initiative that has not yet been
FACT3: Airport Capacity Needs in the National Airspace System
Page 13 January 2015
approved through the FAA’s acquisition and safety processes should not be construed as an
FAA commitment to implement a given ATC improvement at a specific airport. Noise
abatement restrictions, where they presently exist, were assumed to continue unchanged.
When interpreting the results of FACT3 as compared to site-specific studies, it is important
to keep in context the purpose of the FACT process and the changes made since FACT1 and
FACT2. As a systemwide analysis, FACT is intended to provide FAA with macro-level
insights about the timing, need, and magnitude for both infrastructure and NAS
modernization improvements. This is meant to inform the FAA’s strategic planning. While
the FACT analysis is also meant to provide airport sponsors with insights about NAS
modernization plans, it cannot replace site-specific studies that examine capacity issues in
detail and are thus more accurate reflections of the situation at a particular airport.
The following sections identify airports that FACT considers to be capacity constrained or
congested in the applicable scenario and timeframe. This designation is based on the
airport meeting both the FACT3 delay and congestion criteria. Some airports are designated
as having a caution status, which means they experience some level of delay but do not yet
meet the FACT3 criteria to be considered congested. A few airports are considered to have
severe congestion as they exceed the FACT3 criteria by a significant margin.
Congested Airports in 2011
The FACT3 analysis identified five airports that are currently congested and would benefit
from additional capacity as shown in Figure 3.
Not surprisingly, the three major NYC area airports, EWR, JFK, and LGA, are congested. All
three airports regularly experience delays. As a result, all three airports are currently
subject to FAA limits on operations. While the ongoing airspace redesign effort and
NextGen enhancements will help to improve efficiency and flexibility, FAA sees strong
evidence that additional runways may be the best long-term solution to meet future
demand for intercity travel to and from the NYC area.
PHL continues to regularly experience significant delays. As a result, the airport is pursuing
its CEP to mitigate delays and meet future growth. The CEP includes two runway extensions
and a new parallel runway, as well as terminal area and other airport improvements.
ATL also meets the FACT3 criteria to be considered congested, although the airport has seen
significant delay reduction with the opening of its fifth parallel runway in 2006. ATL can be
congested during certain periods of the day because of the extensive connecting hub
activity at the airport.

FACT3: Airport Capacity Needs in the National Airspace System
Page 14 January 2015
Figure 3.
Airports Needing
Capacity Today
(2011)
Five airports today are considered congested by the FACT3 criteria
(as shown in red), with four others having caution status (as shown
in yellow). The airports shown in green were evaluated in FACT3
but generally are not congested.
Interim Capacity Needs in 2020
The capacity needs in the 2020 midterm planning period were evaluated with two scenarios:
1. Reference Scenario: this scenario includes the 2011 baseline conditions (runways and
airspace), with the implementation of mature, high-confidence, near-term NextGen
improvements.
2. Improvements Scenario: this scenario assumes completion by 2020 of all planned
runway development projects at ORD and FLL; two runway extensions at PHL; enhanced
ATC procedures and airspace redesign; and NAS modernization initiatives included in
midterm NextGen. Both scenarios assume forecasted demand growth through 2020 at a
rate of about 1.1 percent annually for Core airports consistent with the 2012 TAF.
Figure 4 shows both scenarios; results are also shown in Table 1. Comparison of the
scenarios reveal where additional capacity will be needed in the future; what effect the
improvements that are currently underway or in the planning process will have on future
capacity needs; and where new initiatives will be needed to provide even greater capacity
beyond what is currently in the construction or planning process.
FACT3: Airport Capacity Needs in the National Airspace System
Page 15 January 2015
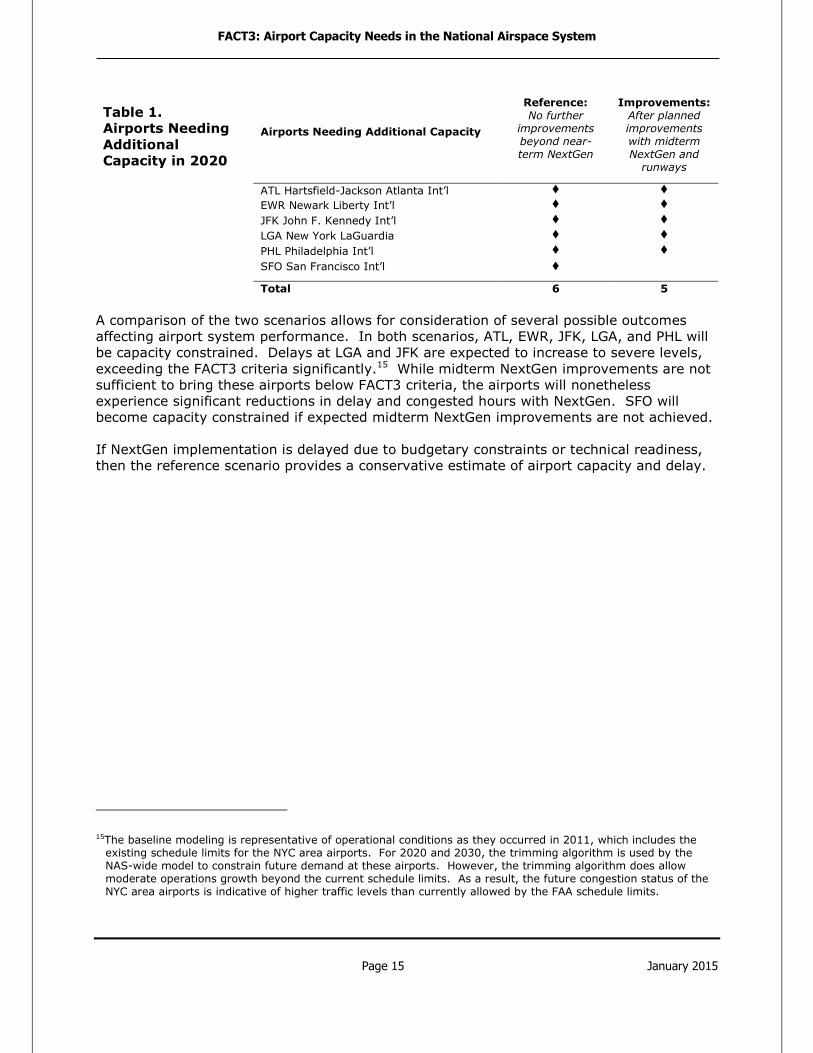
Table 1.
Airports Needing
Additional
Capacity in 2020
Airports Needing Additional Capacity
Reference: No further
improvements beyond near-term NextGen
Improvements: After planned improvements with midterm NextGen and
runways
ATL Hartsfield-Jackson Atlanta Int’l
EWR Newark Liberty Int’l
JFK John F. Kennedy Int’l
LGA New York LaGuardia
PHL Philadelphia Int’l
SFO San Francisco Int’l
Total 6 5
A comparison of the two scenarios allows for consideration of several possible outcomes
affecting airport system performance. In both scenarios, ATL, EWR, JFK, LGA, and PHL will
be capacity constrained. Delays at LGA and JFK are expected to increase to severe levels,
exceeding the FACT3 criteria significantly.15 While midterm NextGen improvements are not
sufficient to bring these airports below FACT3 criteria, the airports will nonetheless
experience significant reductions in delay and congested hours with NextGen. SFO will
become capacity constrained if expected midterm NextGen improvements are not achieved.
If NextGen implementation is delayed due to budgetary constraints or technical readiness,
then the reference scenario provides a conservative estimate of airport capacity and delay.
15The baseline modeling is representative of operational conditions as they occurred in 2011, which includes the existing schedule limits for the NYC area airports. For 2020 and 2030, the trimming algorithm is used by the NAS-wide model to constrain future demand at these airports. However, the trimming algorithm does allow moderate operations growth beyond the current schedule limits. As a result, the future congestion status of the NYC area airports is indicative of higher traffic levels than currently allowed by the FAA schedule limits.
FACT3: Airport Capacity Needs in the National Airspace System
Page 16 January 2015
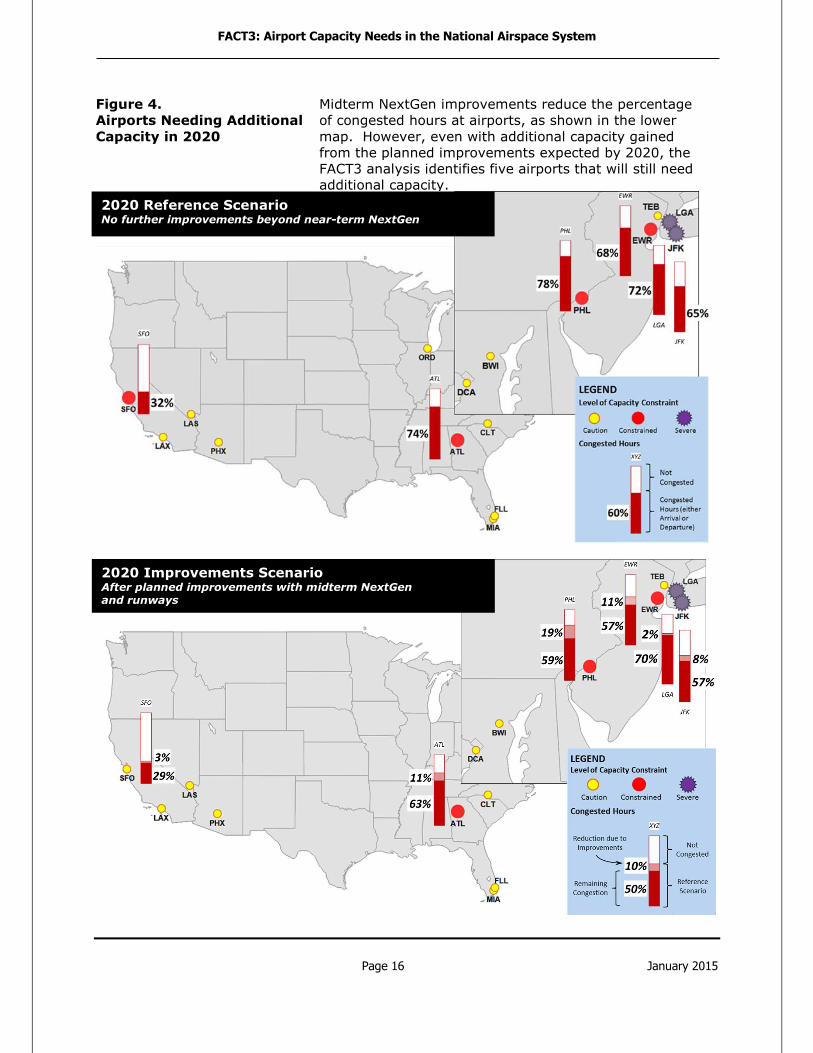
Figure 4.
Airports Needing Additional
Capacity in 2020
Midterm NextGen improvements reduce the percentage
of congested hours at airports, as shown in the lower
map. However, even with additional capacity gained
from the planned improvements expected by 2020, the
FACT3 analysis identifies five airports that will still need
additional capacity.
2020 Reference Scenario No further improvements beyond near-term NextGen
2020 Improvements Scenario After planned improvements with midterm NextGen and runways
FACT3: Airport Capacity Needs in the National Airspace System
Page 17 January 2015
Needed Capacity Beyond What is Currently Planned for 2020
By incorporating the additional capacity gained from the planned improvements expected by
2020 to the 2011 baseline capacities, and measuring this against the forecasted demand for
2020, the FACT3 analysis identified five airports that will need additional capacity beyond
what is already planned (see Figure 4 and Table 1).16
EWR, LGA, and JFK: The Port Authority of New York and New Jersey has embarked on a
long-term planning study to assess the feasibility of adding new runways to these
congested hub airports. While it is too early to determine the outcome of this initiative,
the FACT3 findings make clear the need for additional capacity enhancements within the
NYC area.
ATL: The city of Atlanta is developing an update to its master plan to assess future
facility requirements, including assessment of the need for further runway development.
ATL’s fifth runway opened in 2006 providing significant capacity benefit. If demand
grows as expected, delays will also increase. With its master plan, ATL is expected to
identify needed further capacity improvements and their timeframe for implementation.
PHL: The Environmental Impact Statement (EIS) for the complete reconfiguration of its
airfield was completed in 2010. In 2020, FACT3 included two runway extensions that
are part of the CEP in the planned improvements scenario. While these extensions
provide delay benefits, the long-term analysis also shows that the planned parallel river
runway is needed to further enhance capacity.
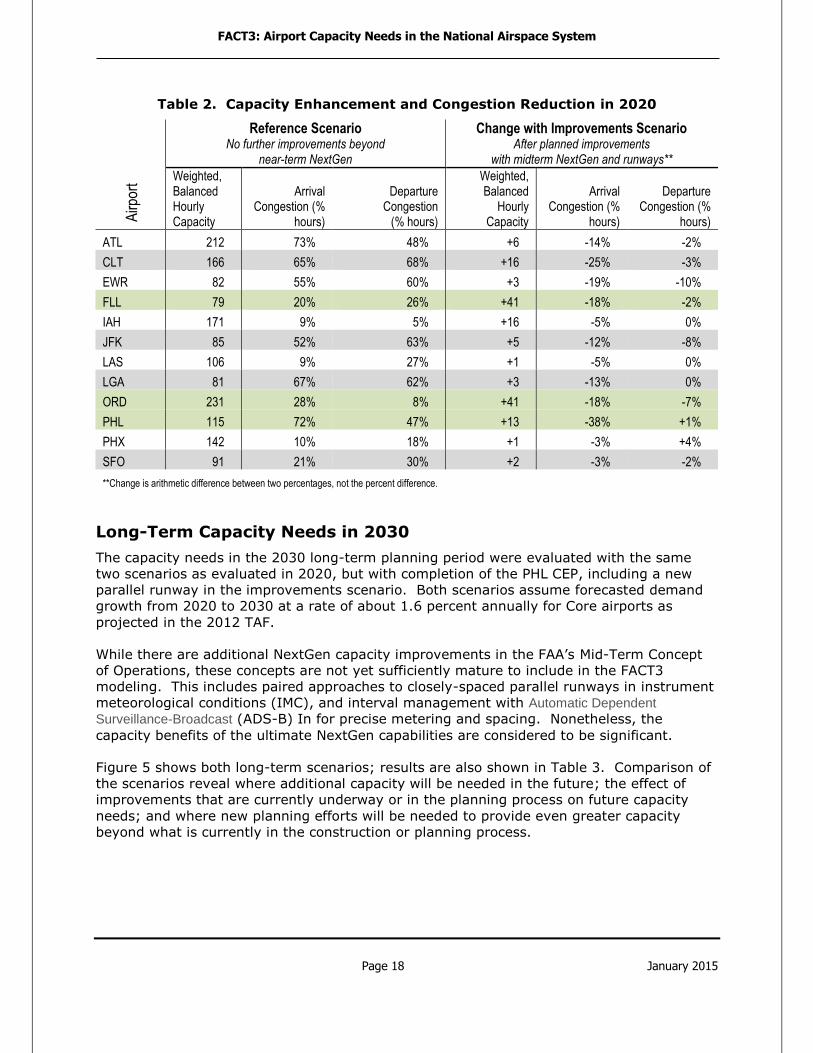
Airport Capacity Improvements by 2020
A comparison of the airports needing additional capacity with and without planned
improvements in 2020 reveals that a single airport, SFO, will come off the list of capacity
constrained airports if the planned improvements are completed. This is due to improved
metering of arrivals to the runways with midterm NextGen capabilities. These
improvements will also benefit other airports. Table 2 shows the model-estimated hourly
capacity improvement by airport. Of course, airfield capacity at ORD, PHL, and FLL also
improves with new or extended runways.
16Capacity and delay estimates are specific to the planning years identified (i.e., 2011, 2020, and 2030). Intermediate years were not analyzed.
FACT3: Airport Capacity Needs in the National Airspace System
Page 18 January 2015
Table 2. Capacity Enhancement and Congestion Reduction in 2020
Airp
ort
Reference Scenario No further improvements beyond
near-term NextGen
Change with Improvements Scenario After planned improvements
with midterm NextGen and runways** Weighted, Balanced Hourly Capacity
Arrival Congestion (%
hours)
Departure Congestion
(% hours)
Weighted, Balanced
Hourly Capacity
Arrival Congestion (%
hours)
Departure Congestion (%
hours)
ATL 212 73% 48% +6 -14% -2%
CLT 166 65% 68% +16 -25% -3%
EWR 82 55% 60% +3 -19% -10%
FLL 79 20% 26% +41 -18% -2%
IAH 171 9% 5% +16 -5% 0%
JFK 85 52% 63% +5 -12% -8%
LAS 106 9% 27% +1 -5% 0%
LGA 81 67% 62% +3 -13% 0%
ORD 231 28% 8% +41 -18% -7%
PHL 115 72% 47% +13 -38% +1%
PHX 142 10% 18% +1 -3% +4%
SFO 91 21% 30% +2 -3% -2%
**Change is arithmetic difference between two percentages, not the percent difference.
Long-Term Capacity Needs in 2030
The capacity needs in the 2030 long-term planning period were evaluated with the same
two scenarios as evaluated in 2020, but with completion of the PHL CEP, including a new
parallel runway in the improvements scenario. Both scenarios assume forecasted demand
growth from 2020 to 2030 at a rate of about 1.6 percent annually for Core airports as
projected in the 2012 TAF.
While there are additional NextGen capacity improvements in the FAA’s Mid-Term Concept
of Operations, these concepts are not yet sufficiently mature to include in the FACT3
modeling. This includes paired approaches to closely-spaced parallel runways in instrument
meteorological conditions (IMC), and interval management with Automatic Dependent
Surveillance-Broadcast (ADS-B) In for precise metering and spacing. Nonetheless, the
capacity benefits of the ultimate NextGen capabilities are considered to be significant.
Figure 5 shows both long-term scenarios; results are also shown in Table 3. Comparison of
the scenarios reveal where additional capacity will be needed in the future; the effect of
improvements that are currently underway or in the planning process on future capacity
needs; and where new planning efforts will be needed to provide even greater capacity
beyond what is currently in the construction or planning process.
FACT3: Airport Capacity Needs in the National Airspace System
Page 19 January 2015
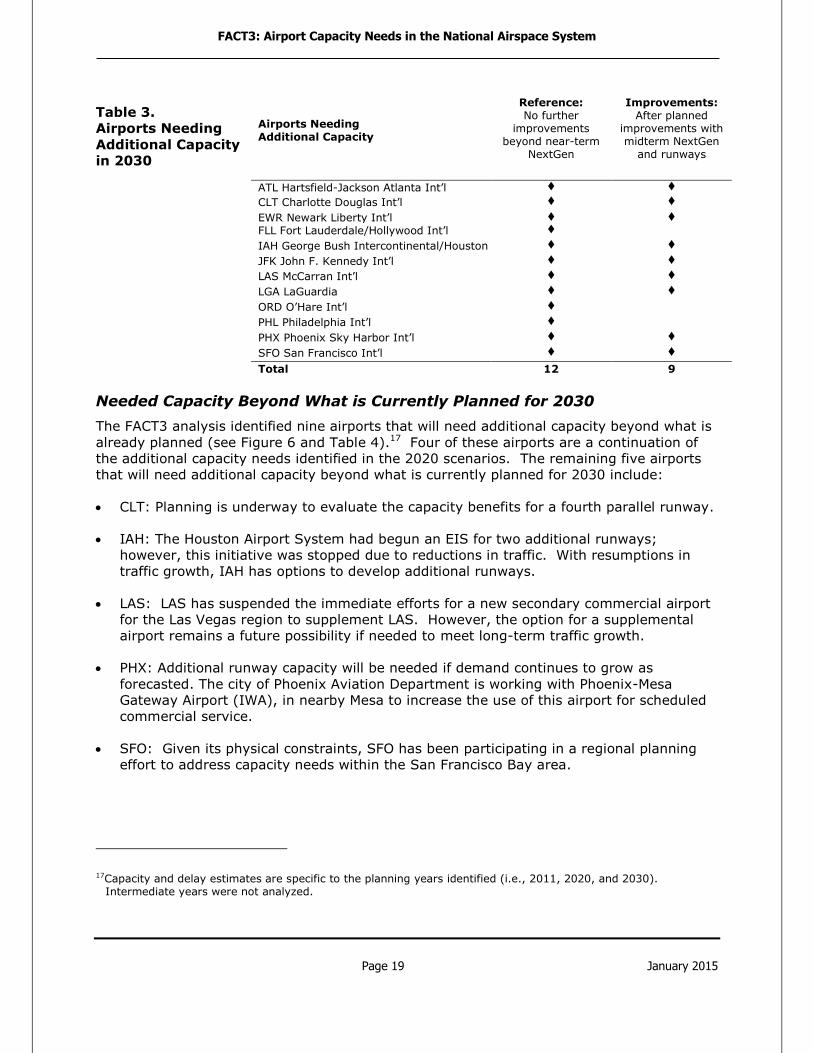
Table 3.
Airports Needing
Additional Capacity
in 2030
Airports Needing Additional Capacity
Reference: No further
improvements beyond near-term
NextGen
Improvements: After planned
improvements with midterm NextGen
and runways
ATL Hartsfield-Jackson Atlanta Int’l
CLT Charlotte Douglas Int’l
EWR Newark Liberty Int’l
FLL Fort Lauderdale/Hollywood Int’l
IAH George Bush Intercontinental/Houston
JFK John F. Kennedy Int’l
LAS McCarran Int’l
LGA LaGuardia
ORD O’Hare Int’l
PHL Philadelphia Int’l
PHX Phoenix Sky Harbor Int’l
SFO San Francisco Int’l
Total 12 9
Needed Capacity Beyond What is Currently Planned for 2030
The FACT3 analysis identified nine airports that will need additional capacity beyond what is
already planned (see Figure 6 and Table 4).17 Four of these airports are a continuation of
the additional capacity needs identified in the 2020 scenarios. The remaining five airports
that will need additional capacity beyond what is currently planned for 2030 include:
CLT: Planning is underway to evaluate the capacity benefits for a fourth parallel runway.
IAH: The Houston Airport System had begun an EIS for two additional runways;
however, this initiative was stopped due to reductions in traffic. With resumptions in
traffic growth, IAH has options to develop additional runways.
LAS: LAS has suspended the immediate efforts for a new secondary commercial airport
for the Las Vegas region to supplement LAS. However, the option for a supplemental
airport remains a future possibility if needed to meet long-term traffic growth.
PHX: Additional runway capacity will be needed if demand continues to grow as
forecasted. The city of Phoenix Aviation Department is working with Phoenix-Mesa
Gateway Airport (IWA), in nearby Mesa to increase the use of this airport for scheduled
commercial service.
SFO: Given its physical constraints, SFO has been participating in a regional planning
effort to address capacity needs within the San Francisco Bay area.
17Capacity and delay estimates are specific to the planning years identified (i.e., 2011, 2020, and 2030). Intermediate years were not analyzed.
FACT3: Airport Capacity Needs in the National Airspace System
Page 20 January 2015
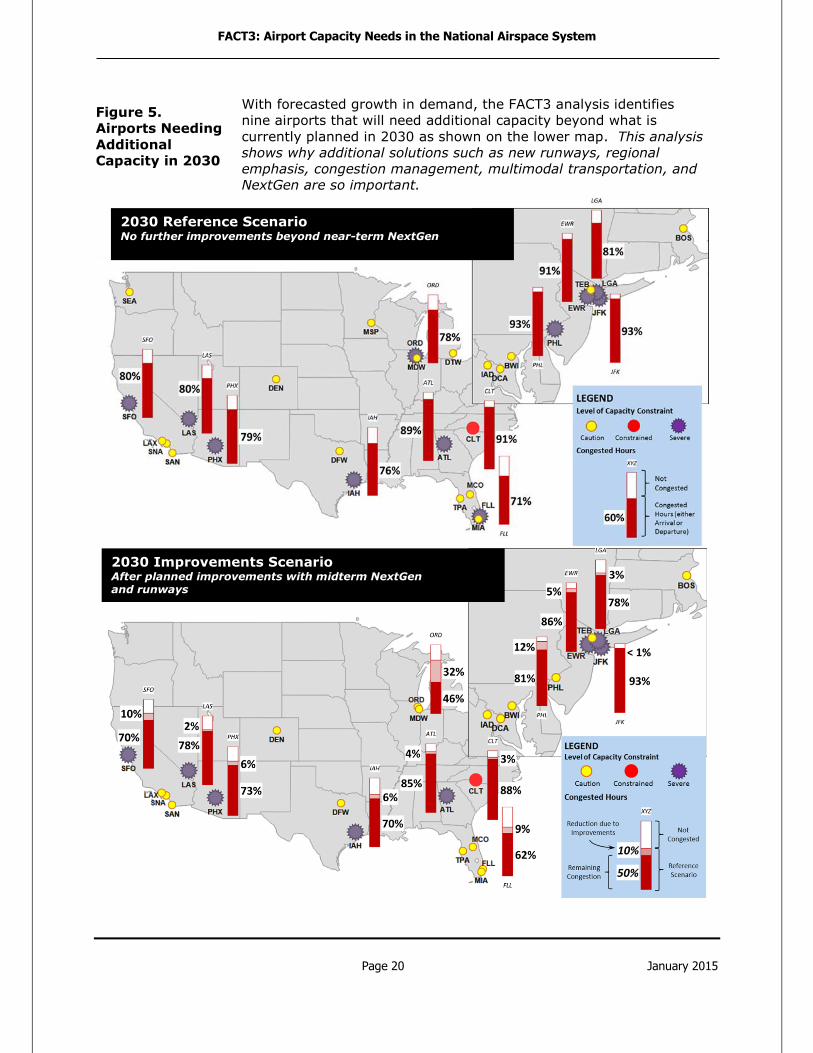
2030 Reference Scenario No further improvements beyond near-term NextGen
Figure 5.
Airports Needing
Additional
Capacity in 2030
With forecasted growth in demand, the FACT3 analysis identifies
nine airports that will need additional capacity beyond what is
currently planned in 2030 as shown on the lower map. This analysis
shows why additional solutions such as new runways, regional
emphasis, congestion management, multimodal transportation, and
NextGen are so important.
2030 Improvements Scenario After planned improvements with midterm NextGen and runways
FACT3: Airport Capacity Needs in the National Airspace System
Page 21 January 2015
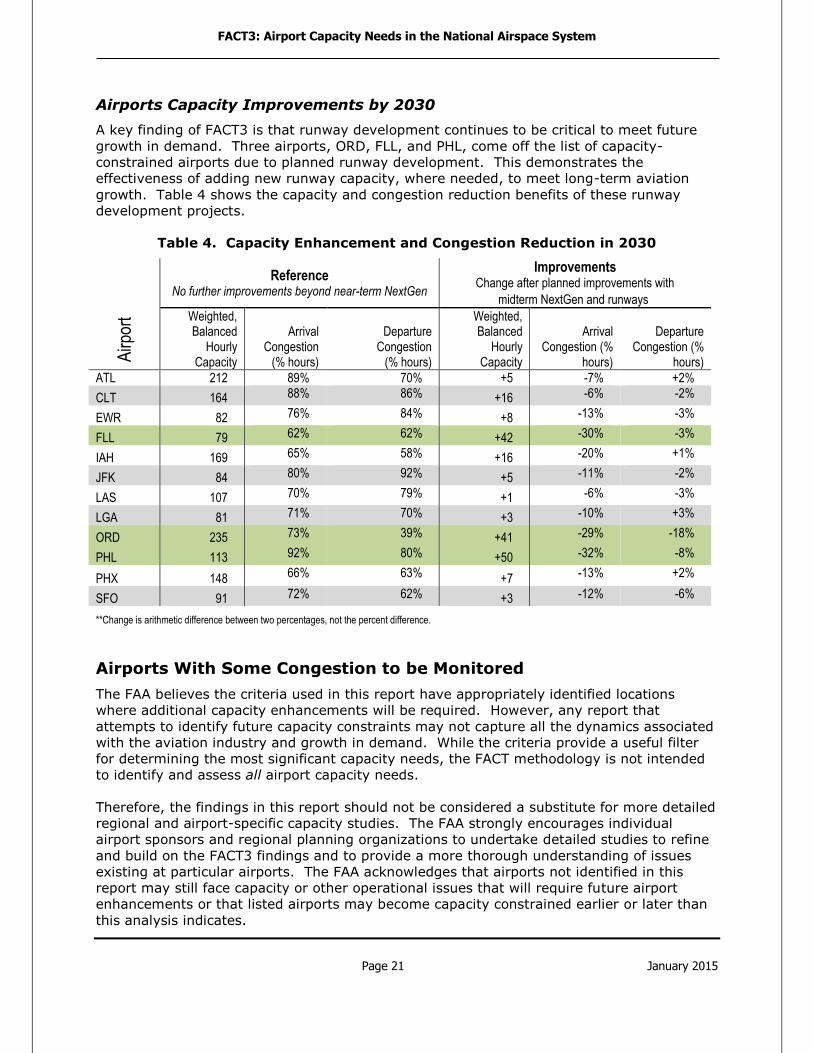
Airports Capacity Improvements by 2030
A key finding of FACT3 is that runway development continues to be critical to meet future
growth in demand. Three airports, ORD, FLL, and PHL, come off the list of capacity-
constrained airports due to planned runway development. This demonstrates the
effectiveness of adding new runway capacity, where needed, to meet long-term aviation
growth. Table 4 shows the capacity and congestion reduction benefits of these runway
development projects.
Table 4. Capacity Enhancement and Congestion Reduction in 2030
Airp
ort
Reference No further improvements beyond near-term NextGen
Improvements Change after planned improvements with
midterm NextGen and runways Weighted, Balanced
Hourly Capacity
Arrival Congestion
(% hours)
Departure Congestion
(% hours)
Weighted, Balanced
Hourly Capacity
Arrival Congestion (%
hours)
Departure Congestion (%
hours)
ATL 212 89% 70% +5 -7% +2%
CLT 164 88% 86% +16 -6% -2%
EWR 82 76% 84% +8 -13% -3%
FLL 79 62% 62% +42 -30% -3%
IAH 169 65% 58% +16 -20% +1%
JFK 84 80% 92% +5 -11% -2%
LAS 107 70% 79% +1 -6% -3%
LGA 81 71% 70% +3 -10% +3%
ORD 235 73% 39% +41 -29% -18%
PHL 113 92% 80% +50 -32% -8%
PHX 148 66% 63% +7 -13% +2%
SFO 91 72% 62% +3 -12% -6%
**Change is arithmetic difference between two percentages, not the percent difference.
Airports With Some Congestion to be Monitored
The FAA believes the criteria used in this report have appropriately identified locations
where additional capacity enhancements will be required. However, any report that
attempts to identify future capacity constraints may not capture all the dynamics associated
with the aviation industry and growth in demand. While the criteria provide a useful filter
for determining the most significant capacity needs, the FACT methodology is not intended
to identify and assess all airport capacity needs.
Therefore, the findings in this report should not be considered a substitute for more detailed
regional and airport-specific capacity studies. The FAA strongly encourages individual
airport sponsors and regional planning organizations to undertake detailed studies to refine
and build on the FACT3 findings and to provide a more thorough understanding of issues
existing at particular airports. The FAA acknowledges that airports not identified in this
report may still face capacity or other operational issues that will require future airport
enhancements or that listed airports may become capacity constrained earlier or later than
this analysis indicates.
FACT3: Airport Capacity Needs in the National Airspace System
Page 22 January 2015
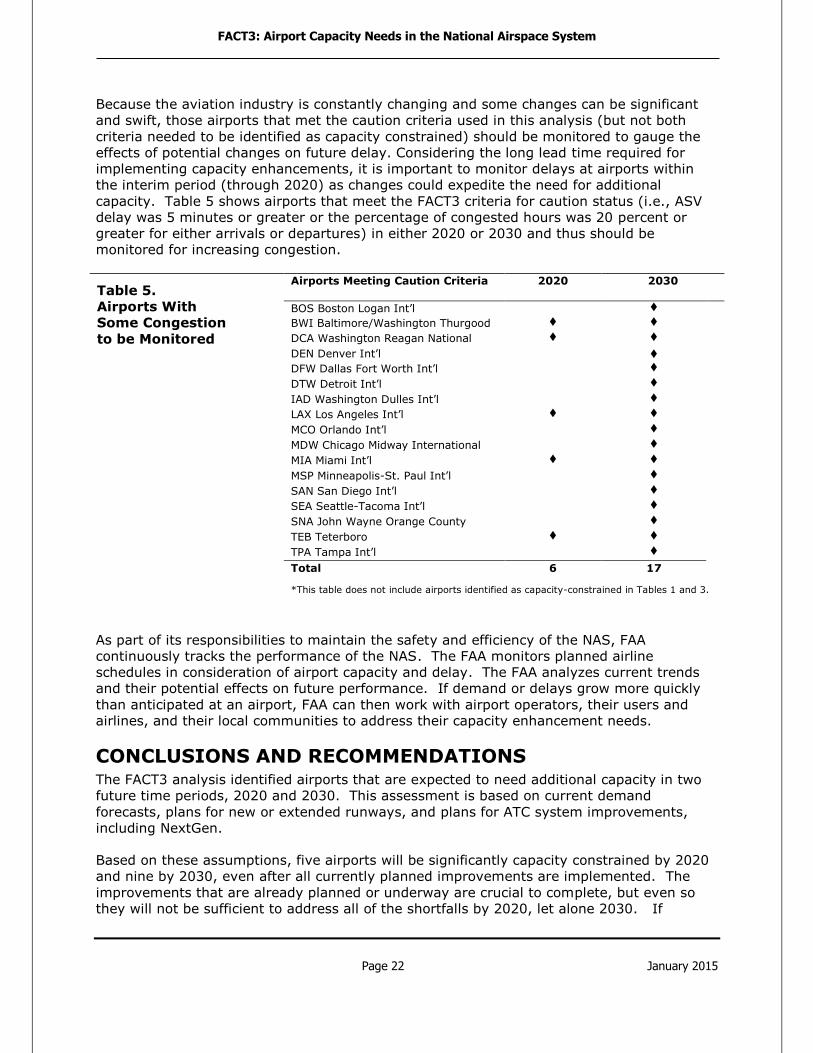
Because the aviation industry is constantly changing and some changes can be significant
and swift, those airports that met the caution criteria used in this analysis (but not both
criteria needed to be identified as capacity constrained) should be monitored to gauge the
effects of potential changes on future delay. Considering the long lead time required for
implementing capacity enhancements, it is important to monitor delays at airports within
the interim period (through 2020) as changes could expedite the need for additional
capacity. Table 5 shows airports that meet the FACT3 criteria for caution status (i.e., ASV
delay was 5 minutes or greater or the percentage of congested hours was 20 percent or
greater for either arrivals or departures) in either 2020 or 2030 and thus should be
monitored for increasing congestion.
Table 5.
Airports With
Some Congestion
to be Monitored
Airports Meeting Caution Criteria 2020 2030
BOS Boston Logan Int’l
BWI Baltimore/Washington Thurgood Marshall International
DCA Washington Reagan National
DEN Denver Int’l
DFW Dallas Fort Worth Int’l
DTW Detroit Int’l
IAD Washington Dulles Int’l
LAX Los Angeles Int’l
MCO Orlando Int’l
MDW Chicago Midway International
MIA Miami Int’l
MSP Minneapolis-St. Paul Int’l
SAN San Diego Int’l
SEA Seattle-Tacoma Int’l
SNA John Wayne Orange County
TEB Teterboro
TPA Tampa Int’l
Total 6 17
*This table does not include airports identified as capacity-constrained in Tables 1 and 3.
As part of its responsibilities to maintain the safety and efficiency of the NAS, FAA
continuously tracks the performance of the NAS. The FAA monitors planned airline
schedules in consideration of airport capacity and delay. The FAA analyzes current trends
and their potential effects on future performance. If demand or delays grow more quickly
than anticipated at an airport, FAA can then work with airport operators, their users and
airlines, and their local communities to address their capacity enhancement needs.
CONCLUSIONS AND RECOMMENDATIONS The FACT3 analysis identified airports that are expected to need additional capacity in two
future time periods, 2020 and 2030. This assessment is based on current demand
forecasts, plans for new or extended runways, and plans for ATC system improvements,
including NextGen.
Based on these assumptions, five airports will be significantly capacity constrained by 2020
and nine by 2030, even after all currently planned improvements are implemented. The
improvements that are already planned or underway are crucial to complete, but even so
they will not be sufficient to address all of the shortfalls by 2020, let alone 2030. If
FACT3: Airport Capacity Needs in the National Airspace System
Page 23 January 2015
planned improvements are not implemented as scheduled, one additional airport in 2020
and three additional airports in 2030 are expected to be capacity constrained. This analysis
shows why continued efforts to identify solutions, such as new runways, regional emphasis,
congestion management, multimodal transportation, and NextGen are essential.
Notably, all of the airports identified in FACT3 as capacity constrained are large hub, Core
airports. No smaller commercial service or general aviation airports that were evaluated in
the report were identified as capacity constrained, although a few are in the caution
category. This reflects the continued concentration of air traffic growth at major hubs.
While NextGen will reduce growth in average delays by about 26 percent,18 steady traffic
growth as forecasted will nonetheless result in eight of the nine capacity-constrained
airports in 2030 having severe congestion levels, affecting air travel nationwide.
Recognizing the evolving trends and shifts in the aviation industry, there is considerable
uncertainty about any projection that is nearly two decades into the future (i.e., the long-
term forecasts used in the 2030 scenarios from a 2011 projection). Sources of uncertainty
include:
traffic growth;
how quickly the airlines add larger aircraft to their fleet to replace smaller aircraft;
demographic and socioeconomic shifts; and
the realization of capacity improvements from NAS modernization initiatives.
However, with several consecutive years of sustained traffic growth at any of the Core
airports, the long-term delay concerns will become much more tangible. As a result, it
remains crucial for these airports to continue their efforts to devise long-term planning
solutions to address capacity constraints.
Given future uncertainties, the focus for the remainder of this decade should be on
identifying solutions for airports identified as capacity constrained in the 2020 scenarios.
These airports are likely to be capacity constrained under a variety of scenarios.19 Airports
such as SFO and the NYC area airports cannot be easily expanded to meet unconstrained
demand. At the NYC area airports, the FAA limits on operations are expected to continue.
A focused effort will be needed to identify viable solutions that can begin implementation.
Meeting the future capacity needs of the Nation’s airports will require innovative
approaches, as well as continued emphasis on airport expansion and technological
improvements. The following are some of the approaches that warrant further
investigation:
New Runways and New Airports. The most direct response to an expected capacity
limitation is the expansion of existing airports to meet forecasted demand. New
18 Reduced growth in delay is by comparison to the 2030 Reference Scenario.
19 Appendix D provides a sensitivity analysis of the FACT3 findings, given the changes in forecasted demand with the FAA’s annual forecast update. Even with changes in demand in the 2013 TAF, as compared to the 2012 TAF used in FACT3, the identification of constrained airports in 2020 remains substantively unchanged.

FACT3: Airport Capacity Needs in the National Airspace System
Page 24 January 2015
runways almost always provide the most significant capacity improvements. New
runways can also be part of a new airport, as has been considered in Las Vegas. Large-
scale airport development is rarely a straightforward process, especially near major
population centers. Considerable lead time is necessary to implement planned airport
capacity improvements. Master planning, site selection, financial planning, airspace,
environmental studies, and land acquisition need to be conducted in a steadfast,
collaborative manner to move a project through the development process.
Gates and Taxiways. Gate and taxiway infrastructure are not the primary constraints
to capacity at most airports, now or in the future. Gates and taxiways can usually be
built where and when needed.
Regional Solutions. Studies of regional traffic and development alternatives have
been used to analyze specific air travel behavior within defined regions that
experience significant congestion, such as the San Francisco Bay area, NYC, and the
Boston/New England region. Several of these regions have ongoing study efforts and
intergovernmental collaboration in place. These initiatives should continue.
Congestion Management. Fortunately, we can add capacity to solve most of our
problems. However, in some cases runway construction may not be a viable alternative.
Today, LGA is a good example. In the next 10 years, the San Francisco Bay area may
serve as an additional example of a capacity-constrained airport where runway
construction may not be a feasible option. In these cases, demand management,
regulatory or economic solutions, and other market mechanisms may need to be
investigated.
High-Density Multimodal Transportation Modes. The majority of the U.S. population is located along the coastlines in densely populated mega regions. Not surprisingly, the FACT3 analysis has identified significant and consistent capacity
problems at airports in some of these areas. The demand for travel in these high-
density intercity corridors requires the continued development of high-speed rail and bus
modes to provide additional options along with short-haul air travel. In these dense
mega regions, an “all of the above” approach is needed to advance the development of multiple transportation options. Often, the high-speed surface modes will complement air service and, where appropriate, can provide convenient and reliable access to airports for connections to long-haul markets.
NextGen. These findings indicate that FAA and its industry partners, including airports,
should continue to advance the development and deployment of NextGen. NextGen
concepts produced quantifiable delay reductions at nearly all airports included in this
report, either directly or by reducing delays at the airport that flights are going to or
coming from. The improvements may often be incremental, such as a moderate
throughput increase that may be the best option at airports that cannot easily add new
runways. Overall, NextGen capabilities are relevant to airports with planned runway
improvements, as well as for airports where geographic and other constraints prevent
easy physical expansion of the airfield.
NextGen has benefits that may prove to be more important than outright capacity
growth. Significant improvements in the reliability and predictability of operations
across the NAS will help airlines better maintain and recover flight schedules during
inclement weather. These predictability and reliability benefits are not captured in the

FACT3: Airport Capacity Needs in the National Airspace System
Page 25 January 2015
high-level systemwide capacity benefits estimated with FACT3, but they are nonetheless
vital to NAS modernization.
Runways and NextGen are Complementary. Capacity improvements from NextGen
are not as significant as those from new runways, but are applicable to many airports
across the NAS. Still, if an airport is facing a substantial shortfall in capacity, the best
answer is often new pavement. The optimal combination of solutions in each particular
location depends on the scale of the capacity/demand imbalance and the specific
operational issues that need to be addressed. Often, at congested airports, both are
necessary to foster improved airport performance; e.g., NextGen improvements such as
PBN may be needed to maximize the capacity benefits of a new runway.
This report has identified a number of airports where additional capacity is expected to be
needed to handle expected future demand. By updating the FACT analysis, FAA has a
strategic understanding of future airport capacity needs in the coming years. We can then
work with airports, their users, and their local communities to address capacity enhance-
ment needs. The solution at each airport will be different and can only be identified through
consideration of local factors and concerns. The FAA is prepared to work with airports to
address their capacity and demand challenges and to seek innovative approaches to their
needs.
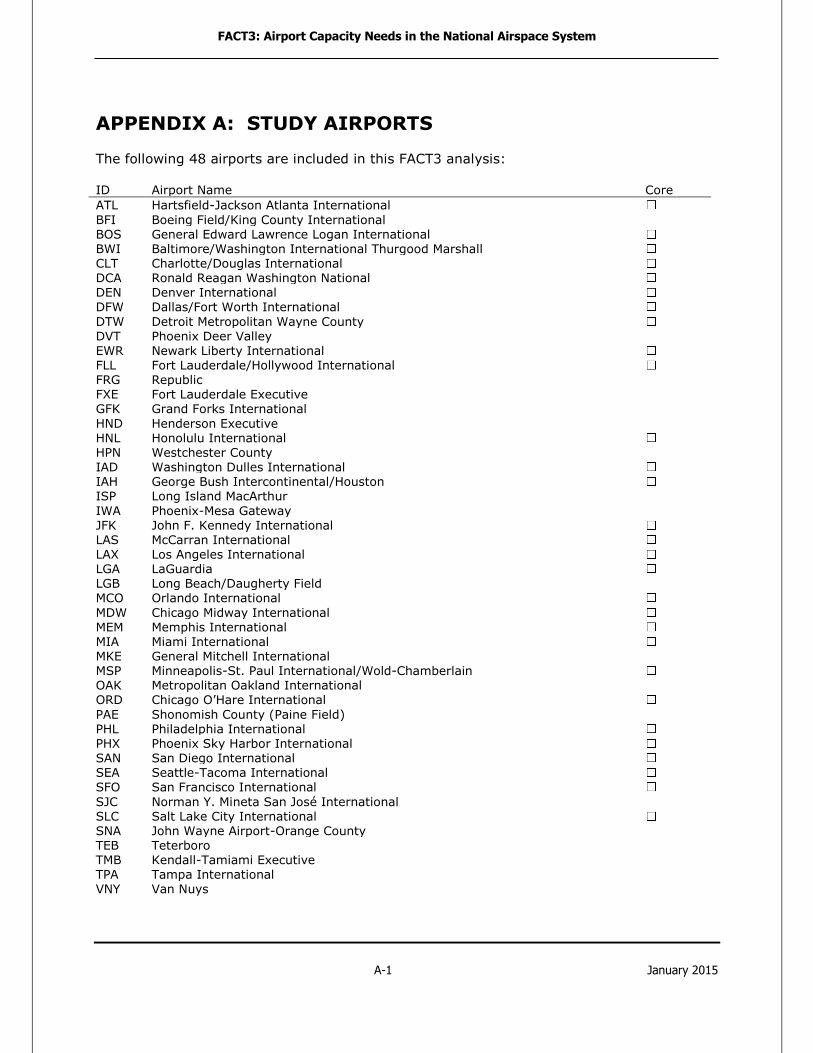
FACT3: Airport Capacity Needs in the National Airspace System
A-1 January 2015
APPENDIX A: STUDY AIRPORTS
The following 48 airports are included in this FACT3 analysis:
ID Airport Name Core
ATL Hartsfield-Jackson Atlanta International
BFI Boeing Field/King County International BOS General Edward Lawrence Logan International BWI Baltimore/Washington International Thurgood Marshall CLT Charlotte/Douglas International DCA Ronald Reagan Washington National DEN Denver International DFW Dallas/Fort Worth International
DTW Detroit Metropolitan Wayne County DVT Phoenix Deer Valley
EWR Newark Liberty International FLL Fort Lauderdale/Hollywood International FRG Republic FXE Fort Lauderdale Executive GFK Grand Forks International
HND Henderson Executive HNL Honolulu International HPN Westchester County IAD Washington Dulles International IAH George Bush Intercontinental/Houston ISP Long Island MacArthur
IWA Phoenix-Mesa Gateway JFK John F. Kennedy International LAS McCarran International LAX Los Angeles International LGA LaGuardia
LGB Long Beach/Daugherty Field MCO Orlando International
MDW Chicago Midway International MEM Memphis International MIA Miami International MKE General Mitchell International MSP Minneapolis-St. Paul International/Wold-Chamberlain OAK Metropolitan Oakland International ORD Chicago O’Hare International
PAE Shonomish County (Paine Field) PHL Philadelphia International PHX Phoenix Sky Harbor International SAN San Diego International SEA Seattle-Tacoma International SFO San Francisco International
SJC Norman Y. Mineta San José International SLC Salt Lake City International SNA John Wayne Airport-Orange County TEB Teterboro TMB Kendall-Tamiami Executive TPA Tampa International VNY Van Nuys
FACT3: Airport Capacity Needs in the National Airspace System
B-1 January 2015
APPENDIX B: METHODOLOGY
Introduction
The objective of the FACT analyses is not to predict future ATC scenarios, nor to perform a
benefits analysis of any improvements to the ATC system or to airports. Instead, FACT is
intended to provide information about which airports are expected to be capacity
constrained in the future even with reasonably optimistic assumptions about future system
performance. This information can then be used to scope additional efforts for systemwide
analysis or airport-specific improvements.
Study Scope and Scenarios
The baseline for the FACT3 analysis is the year 2011. Two future periods were also
studied: 2020 and 2030. Multiple scenarios were analyzed for FACT3, representing
alternative combinations of time period, ATC improvements, and infrastructure
improvements.
Current FAA plans for NextGen (such as the NextGen Implementation Plan) show many
NextGen operational improvements implemented through the end of the decade. For
FACT3, the 2020 scenarios in the analysis reflect different levels of NextGen
implementation:
“Near-term” NextGen, which includes those operational improvements which have been
implemented or are expected to be implemented in the next 2 or 3 years; and
“Midterm” NextGen, which includes all other operational improvements expected to be
implemented before 2020.
The 2030 time period represents the “far term” in the analysis, allowing more time for
demand to increase and stress planned airport capacity. Such a long look ahead is helpful,
given the time required to plan, study, approve, and build new runways and implement
large-scale NAS modernization efforts.
The effect of these ATC improvements was evaluated with and without separate runway and
gate improvements. For 2020, these runway improvements consisted of new and extended
runways at FLL, ORD, and PHL that have been approved by FAA. The 2030 scenarios with
runway improvements included a new runway at PHL consistent with the approved EIS.
New runways would have been considered at other airports in 2030 if planning was
sufficiently advanced and the need existed, but no other runway projects were identified.
Airport Selection
There are 3,330 existing airports in the United States that are open to public use according
to the FAA’s NPIAS report for 2011-2015. The goal of FACT is to identify those airports that
are expected to be capacity constrained in the future; however, it is impractical to analyze
all these airports to the required level of detail. Therefore, a screening method was used to
select candidate airports prior to performing the detailed analysis.

FACT3: Airport Capacity Needs in the National Airspace System
B-2 January 2015
Candidates for detailed analysis were those public-access airports where excessive delays
could potentially have a significant impact on the NAS. The following major categories of
airports were considered:
Core Airports: 30 commercial service airports that have been identified by FAA as
having a significant role in the NAS due to their level of operations or passengers.
Potentially Constrained Commercial Airports: commercial service airports with
projected traffic growth that may stress their current capacity.
General Aviation Airports: other airports with a substantial level of traffic, even if
primarily general aviation, that affect airspace and air traffic in multi airport areas like
the NYC area and southern California.
In all, 48 airports were included in the FACT3 analysis as shown in Figure B-1.
Figure B-1. Airports Included in the FACT3 Analysis
The list of potentially constrained commercial service airports was determined using a
multistep process. If the annualized capacity at an airport was more than 125 percent of
the forecasted demand (in other words, the demand/capacity ratio was 0.8 or below), then
delays were not expected to be significant and the airport was eliminated from
consideration. The initial filter used the most conservative assumptions for fleet mix and
operating procedures to underestimate capacity. Successive filters used more accurate
capacity estimates, reducing the initial list of 301 airports to 7 candidates for analysis.
A separate analysis focused on general aviation airports and emerging commercial service
airports in major metropolitan airports to identify additional airports for analysis. Airports
FACT3: Airport Capacity Needs in the National Airspace System
B-3 January 2015
with a substantial level of traffic, even if primarily general aviation, can affect airspace and
air traffic in multi airport areas like NYC and southern California.
Demand
The forecast of aviation demand in 2020 and 2030 came from the FAA’s TAF that was
published in February 2013, which included annual traffic counts by airport for
Fiscal Years (FY) 2012-2040.
The ASV analysis was based on annual demand, while the NAS-wide analysis required daily
traffic schedules. For the daily analysis, 16 days in FY 2011 were selected to represent the
entire year. The daily schedules on these days were obtained from Traffic Flow
Management System data. These schedules were then increased to reflect future traffic
levels while attempting to preserve airline scheduling patterns. General aviation flights
were also included. The resulting schedules were “trimmed and smoothed”20 as necessary
when airport capacity limits restricted hourly demand.
Refined and Expanded Methodology
The FACT2 analysis was based on both ASV and NAS-wide modeling. These remain the
principal tools used in FACT3, although the methodology has been revised and refined.
The NAS-wide simulations now run much more quickly. This made it possible to simulate 16
demand days for each alternative scenario versus only two traffic scenarios (“good weather”
and “bad weather”) for FACT2. This also led to a need for new metrics for determining
which airports are “capacity constrained.” The FACT2 metrics were based on good weather
and bad weather delay measures, but the 16 days in FACT3 represented real-world mixtures
of good weather and bad weather across the airports being modeled.
NAS-wide modeling was also expanded from runways and airspace to include taxiways and
gates as well. Discussions with airport operators after the publication of FACT2 often
addressed factors other than runways and ATC that affected airport delays. The operators
also mentioned taxiway restrictions and limited numbers of terminal gates as common
causes of delays and inefficiencies. These factors have been added to the NAS-wide model,
although in a simplified form.
The NAS-wide modeling relies on calculated capacity curves for each airport. In the past,
these capacity curves have assumed the same mix of aircraft types (with associated
performance and wake vortex characteristics) or fleet mix across all time periods. FACT3
includes forecasts of future fleet mixes for the first time based on TAF data and projections
of airline fleets.
20“Trimming” refers to the practice of reducing demand when capacity is significantly exceeded over one or more hours.

FACT3: Airport Capacity Needs in the National Airspace System
B-4 January 2015
Modeling
Annual Service Volume
The ASV is the yearly demand that results in a given level of average delay in simulated
operations. The ASV studies are conducted by the Capacity Analysis Group (AJR-G5) at the
FAA’s William J. Hughes Technical Center using the Runway Delay Simulation Model
(RDSIM). The ASV analysis considers multiple runway configurations, weighted by the
annual frequency of occurrence, and utilizes an annual estimation of weather conditions for
each configuration in its calculation.
The RDSIM simulations calculate the amount of delay at different levels of traffic. The
analyst can then determine which traffic level would produce the target level of delay
(usually by interpolating between the calculated results). Alternatively, the same demand-
delay curve can be used to estimate the average annual delay that results for a given
annual demand. Example ASV curves are shown in Figure B-2.
Figure B-2. Example ASV Curves
The process for FLL, ORD, and PHL was slightly different. Rather than conducting a new
analysis, average annual delays for these airports relied on previously published studies
conducted as part of the airport Master Plan or EIS.
NAS-Wide Modeling
The other technique used to estimate delays was NAS-wide modeling. Projected traffic
demand schedules and airport capacity information are used as inputs in a simulation of the
NAS as a whole, thus capturing the interactive effects of delays on flights throughout the
system.
2011 Baseline
Reference Scenario
Improvements
Scenario
Avera
ge D
ela
y p
er
Opera
tion (
min
ute
s)

FACT3: Airport Capacity Needs in the National Airspace System
B-5 January 2015
Airport capacity curves were prepared for each airport for all alternative scenarios using
MITRE’s runwaySimulator model. Some example curves for different weather conditions are
shown in Figure B-3. “Airport capacity” as used in this analysis is defined as the average
number of operations that can be handled in an hour, under conditions of continuous
demand, while adhering to all relevant ATC rules and procedures. Each capacity curve
shows the tradeoff between arrivals and departures as the operational mix ranges from
arrivals only to a balanced mix of arrivals and departures to departures only. Separate
curves were generated for: visual meteorological conditions (VMC), marginal visual
meteorological conditions (MMC), and IMC.
Figure B-3. Example Capacity Curves
Hourl
y A
rriv
als
Hourly Departures
For certain NextGen operational improvements that allow changes to separations when
crosswinds are favorable for displacing wake vortices, separate curves were generated for
favorable and unfavorable wind conditions.
The capacity curves and daily demand schedules, together with data about the airspace,
taxiway performance, and airport gate usage, were provided to the NAS-wide model,
MITRE’s systemwideModeler. This model simulates the progress of individual flights through
airports, terminal areas, and en route sectors while tracking delays caused by system
resources that reflect limited airport capacity, congestion, and the impacts of weather.
Taxiway congestion was estimated through airport-specific formulas that relate total taxi-in
and taxi-out time to the number of arrivals and departures while taxiing based on historical
data.

FACT3: Airport Capacity Needs in the National Airspace System
B-6 January 2015
The gate resource in systemwideModeler tracks gate occupancy as flights arrive and depart
at each airport. Because accurate gate assignments are not available for 2020, “clusters” of
perhaps 5 to 10 gates were defined at each airport based on the airline and sometimes on
the market segment (regional shuttle, domestic, or international). A flight would be
assigned to a cluster rather than to an individual gate; only when all gates in the cluster
were occupied would the arrival have to wait.
For the 2030 scenarios, uncertainties about the numbers of gates at each airport, airline
location within the terminal, and flight assignment to specific airlines, made it impractical to
define reasonable gate clusters. Instead, the gate resource simply tracked the number of
flights at the gates (and thus the minimum required number of gates) over the day.
Identification Criteria
Both the ASV and the NAS-wide models were used to define whether an airport would be
considered “capacity constrained” in any scenario. At the forecasted level of traffic, an ASV
delay of 7 minutes per flight or greater identified a potential capacity constraint. In
addition, the NAS-wide model needed to show a high percentage of hours with high levels of
delay for either arrivals or departures. A “high level of delay” was defined as the
90th percentile value seen at the 30 Core airports in the 2011 baseline simulation of
16 representative days. Only the hours between 0700 and 2259 local time were
considered. A congested hour at the airport was thus defined as an average arrival delay of
6.22 minutes per flight or an average departure delay of 6.65 minutes per flight. In order
to be considered “capacity constrained,” over 30 percent of the hours at the airport between
0700 and 2259 needed to meet the criteria for either arrival or departure congestion.
Higher values for these criteria were used to identify airports with severe levels of capacity
concerns. Specifically, the ASV delay criterion was increased to 15 minutes, and the
percentage of congested hours was increased from 30 percent to 50 percent.
Similarly, lower values for these criteria served to identify airports that were not capacity
constrained but were approaching that condition. An airport fell into this category if the
ASV delay was 5 minutes or greater or the percentage of congested hours was 20 percent
or greater for either arrivals or departures.
Note that these criteria, as used in FACT3, must not be considered as an FAA definition of
acceptable delay for the purpose of justifying proposed airport development without prior
consultation with the FAA’s Office of Airport Planning and Programming, Airport Planning
and Environmental Division (APP-400).

FACT3: Airport Capacity Needs in the National Airspace System
C-1 January 2015
APPENDIX C: COMPARISON OF FACT1/2/3
METHODOLOGIES Table C-1: Data and Methodology Comparison
FACT1 FACT2 FACT3
Timeframe Base Year 2002 2005 2011
Middle-Term 2013 2015 2020
Far-Term 2020 2025 2030
Demand Forecast
TAF version March 2003 March 2006 January 2013 (32% fewer operations at Core airports in 2025 than FACT2)
FATE Forecast 2003 2005 TAF-M with FATE methodology planned for use in sensitivity analyses when available
Scenario Days 1 2 (good and bad weather)
16 with mixed weather; aligned to ATO demand days with trimming
Fleet Mix Current/Constant Current/Constant Evolves in future years; aligned to FAA APO Fleet Forecast
Future NAS Technology
Interim OEP v.5.0 OEP v.8.0 NSIP Segment A with adjustments
Long Term Aggressive assumptions NextGen (early) assumptions
NSIP Segment B with adjustments
Airports
Primary Airports OEP 35 OEP 35 30 Core
Additional Airports 21 21 18 (including general aviation)
Models and Metrics
NAS Components Runways Runways Runways, plus gate-to-gate with general constraints of airspace, taxiways, and gates
ASV ASV average delay ASV average delay ASV average delay NAS-Wide Simulation:
Arrival Delay Expanded Delay Metrics NAS arrival/departure delay, congested hours, throughput

FACT3: Airport Capacity Needs in the National Airspace System
D-1 January 2015
APPENDIX D: SENSITIVITY ANALYSIS OF THE 2013 TAF ON FACT3 RESULTS
The FACT3 analysis of expected airport constraints in 2020 and 2030 was based on the
demand forecasts contained in the 2012 TAF, released in March 2013. Since the analysis
was completed, FAA published a new version of the TAF in January 2014 (known as the
2013 TAF). Although most airports had only minor changes in forecasted 2020 and 2030
demand, the updated forecast did contain substantial demand changes at a few airports.
This appendix presents an estimate of the potential changes to the FACT3 results if the
forecasts in the 2013 TAF had been used. The results described below were estimated
based on previous simulations without rerunning the NAS-wide model.
Overview of the 2013 TAF
The FAA releases a new TAF annually. The initial phase in developing a TAF is to update the
forecast of passenger demand at each airport based on the latest data. Next, a forecast of
aircraft operations is generated using the passenger forecast and current operational trends.
Thus, a particular airport’s operational forecast may change from a single year to the next if
the:
passenger forecast at the airport has changed;
market served by individual airlines changes; or
expected operational outlook (such as fleet mix and load factors) at the airport has
changed.
Figure D-1 shows the difference between the 2013 TAF and 2012 TAF forecasts for 2020
and 2030 at the 30 Core airports.
Comparing the 2013 TAF to the 2012 TAF, BOS showed the largest increase in expected
operations with a 17.7 percent increase over the previous 2020 forecast and a 29.2 percent
increase over the previous 2030 forecast. On the other hand, MEM had the largest decrease
compared to the previous 2020 forecast at -21.2 percent, and MCO had the largest decrease
for 2030 at -13.8 percent. However, some Core airports had very little change between the
2012 TAF and 2013 TAF: For example, BWI and LGA had less than 0.2 percent change in
their 2020 and 2030 operational forecasts.
Considering only the constrained airports from the FACT3 analysis, the following substantial
changes were seen in the 2013 TAF:
EWR increased 7.5 percent in 2020 and 14.2 percent in 2030
JFK decreased 5.0 percent in 2020 and 8.7 percent in 2030
LAS decreased 5.8 percent in 2030
IAH decreased 7.5 percent in 2030
PHX decreased 7.3 percent in 2030

FACT3: Airport Capacity Needs in the National Airspace System
D-2 January 2015
Figure D-1. Change in Forecasted Demand (2013 TAF vs. 2012 TAF)
Methodology for Estimating Effect of Demand Changes on FACT3
Results
Does the new forecast in the 2013 TAF change the results of the FACT3 analysis for an
airport?
In some cases, the answer is straightforward. If an airport had been identified as needing
additional capacity and the forecasted traffic level increased in the 2013 TAF, then the
airport will still need more capacity. The converse is also true.
At most airports, it was necessary to estimate the effect of the new TAF on the original
analysis. Two different methodologies, the ASV and the NAS-wide simulation, were used in
FACT3 to estimate future delays. Both analyses were reviewed for this sensitivity analysis.
The ASV analysis produces a curve of average annual delay versus annual traffic (see the
example in Figure B-2). Changing the forecast simply requires moving to a different part of
the curve to obtain the new value for average delay.
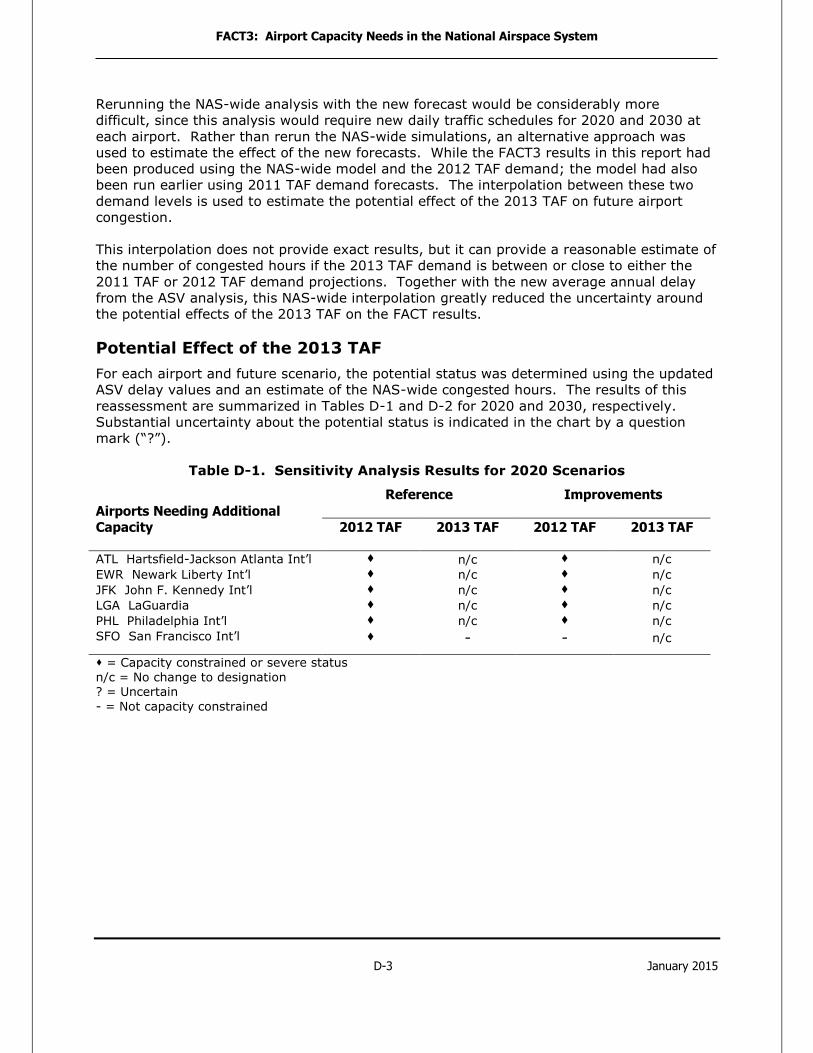
FACT3: Airport Capacity Needs in the National Airspace System
D-3 January 2015
Rerunning the NAS-wide analysis with the new forecast would be considerably more
difficult, since this analysis would require new daily traffic schedules for 2020 and 2030 at
each airport. Rather than rerun the NAS-wide simulations, an alternative approach was
used to estimate the effect of the new forecasts. While the FACT3 results in this report had
been produced using the NAS-wide model and the 2012 TAF demand; the model had also
been run earlier using 2011 TAF demand forecasts. The interpolation between these two
demand levels is used to estimate the potential effect of the 2013 TAF on future airport
congestion.
This interpolation does not provide exact results, but it can provide a reasonable estimate of
the number of congested hours if the 2013 TAF demand is between or close to either the
2011 TAF or 2012 TAF demand projections. Together with the new average annual delay
from the ASV analysis, this NAS-wide interpolation greatly reduced the uncertainty around
the potential effects of the 2013 TAF on the FACT results.
Potential Effect of the 2013 TAF
For each airport and future scenario, the potential status was determined using the updated
ASV delay values and an estimate of the NAS-wide congested hours. The results of this
reassessment are summarized in Tables D-1 and D-2 for 2020 and 2030, respectively.
Substantial uncertainty about the potential status is indicated in the chart by a question
mark (“?”).
Table D-1. Sensitivity Analysis Results for 2020 Scenarios
Airports Needing Additional
Capacity
Reference Improvements
2012 TAF 2013 TAF 2012 TAF 2013 TAF
ATL Hartsfield-Jackson Atlanta Int’l n/c n/c
EWR Newark Liberty Int’l n/c n/c
JFK John F. Kennedy Int’l n/c n/c
LGA LaGuardia n/c n/c
PHL Philadelphia Int’l n/c n/c
SFO San Francisco Int’l - - n/c
= Capacity constrained or severe status
n/c = No change to designation ? = Uncertain
- = Not capacity constrained
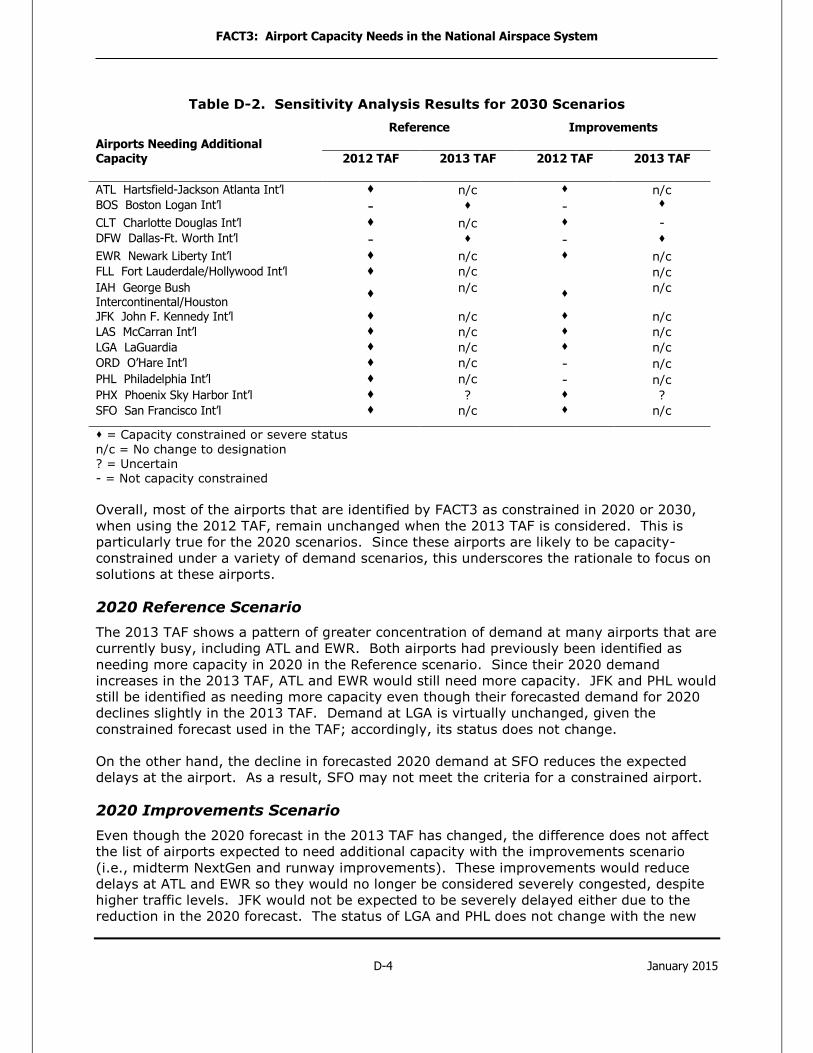
FACT3: Airport Capacity Needs in the National Airspace System
D-4 January 2015
Table D-2. Sensitivity Analysis Results for 2030 Scenarios
Airports Needing Additional Capacity
Reference Improvements
2012 TAF 2013 TAF 2012 TAF 2013 TAF
ATL Hartsfield-Jackson Atlanta Int’l n/c n/c
BOS Boston Logan Int’l - -
CLT Charlotte Douglas Int’l n/c -
DFW Dallas-Ft. Worth Int’l - -
EWR Newark Liberty Int’l n/c n/c
FLL Fort Lauderdale/Hollywood Int’l n/c n/c
IAH George Bush Intercontinental/Houston
n/c n/c
JFK John F. Kennedy Int’l n/c n/c
LAS McCarran Int’l n/c n/c
LGA LaGuardia n/c n/c
ORD O’Hare Int’l n/c - n/c
PHL Philadelphia Int’l n/c - n/c
PHX Phoenix Sky Harbor Int’l ? ?
SFO San Francisco Int’l n/c n/c
= Capacity constrained or severe status
n/c = No change to designation ? = Uncertain - = Not capacity constrained
Overall, most of the airports that are identified by FACT3 as constrained in 2020 or 2030,
when using the 2012 TAF, remain unchanged when the 2013 TAF is considered. This is
particularly true for the 2020 scenarios. Since these airports are likely to be capacity-
constrained under a variety of demand scenarios, this underscores the rationale to focus on
solutions at these airports.
2020 Reference Scenario
The 2013 TAF shows a pattern of greater concentration of demand at many airports that are
currently busy, including ATL and EWR. Both airports had previously been identified as
needing more capacity in 2020 in the Reference scenario. Since their 2020 demand
increases in the 2013 TAF, ATL and EWR would still need more capacity. JFK and PHL would
still be identified as needing more capacity even though their forecasted demand for 2020
declines slightly in the 2013 TAF. Demand at LGA is virtually unchanged, given the
constrained forecast used in the TAF; accordingly, its status does not change.
On the other hand, the decline in forecasted 2020 demand at SFO reduces the expected
delays at the airport. As a result, SFO may not meet the criteria for a constrained airport.
2020 Improvements Scenario
Even though the 2020 forecast in the 2013 TAF has changed, the difference does not affect
the list of airports expected to need additional capacity with the improvements scenario
(i.e., midterm NextGen and runway improvements). These improvements would reduce
delays at ATL and EWR so they would no longer be considered severely congested, despite
higher traffic levels. JFK would not be expected to be severely delayed either due to the
reduction in the 2020 forecast. The status of LGA and PHL does not change with the new

FACT3: Airport Capacity Needs in the National Airspace System
D-5 January 2015
forecast. SFO was not identified as capacity constrained in this scenario at 2012 TAF
demand levels nor at the slightly lower demand level in the 2013 TAF.
2030 Reference Scenario
Several airports that had been identified as severely congested in the 2030 Reference
Scenario are still expected to be severely congested, as their 2030 demand levels stay the
same, decline only slightly, or increase in the 2013 TAF. These airports include ATL, EWR,
JFK, LGA, ORD, PHL, and SFO.
Other airports with lower forecasts in the 2013 TAF would still be capacity constrained but
not severely so. This includes CLT, FLL, IAH, and LAS. PHX also has a lower forecast but its
status is uncertain.
On the other hand, BOS and DFW are expected to be constrained at the 2013 TAF demand
levels and would no longer be in the caution category.
2030 Improvements Scenario
Given the demand increases at ATL, EWR, and SFO in the 2013 TAF, these airports would
still be expected to be severely congested. JFK would also be expected to be severely
congested despite a reduced demand forecast. LGA would be unchanged.
IAH, LAS, and perhaps PHX would be constrained in 2030 even with a lower demand
forecast. CLT would no longer be considered a constrained airport due to the decrease in
the demand forecast but would remain in the caution category.
BOS and DFW would continue to be capacity constrained even with the planned
improvements due to the higher demand forecasts at those airports.
Due to runway development underway or planned at FLL, ORD, and PHL, these airports will
no longer meet the FACT3 criteria to be capacity constrained under either the 2012 or 2013
TAF demand level.