Fact Sheet Ver.02 - January-2015 - SUD Life Fact Sheet January 2015.pdf · Fact Sheet January –...
28
Fact Sheet January – 2015 InveSTAR
Transcript of Fact Sheet Ver.02 - January-2015 - SUD Life Fact Sheet January 2015.pdf · Fact Sheet January –...
Fact Sheet
January – 2015
InveSTAR
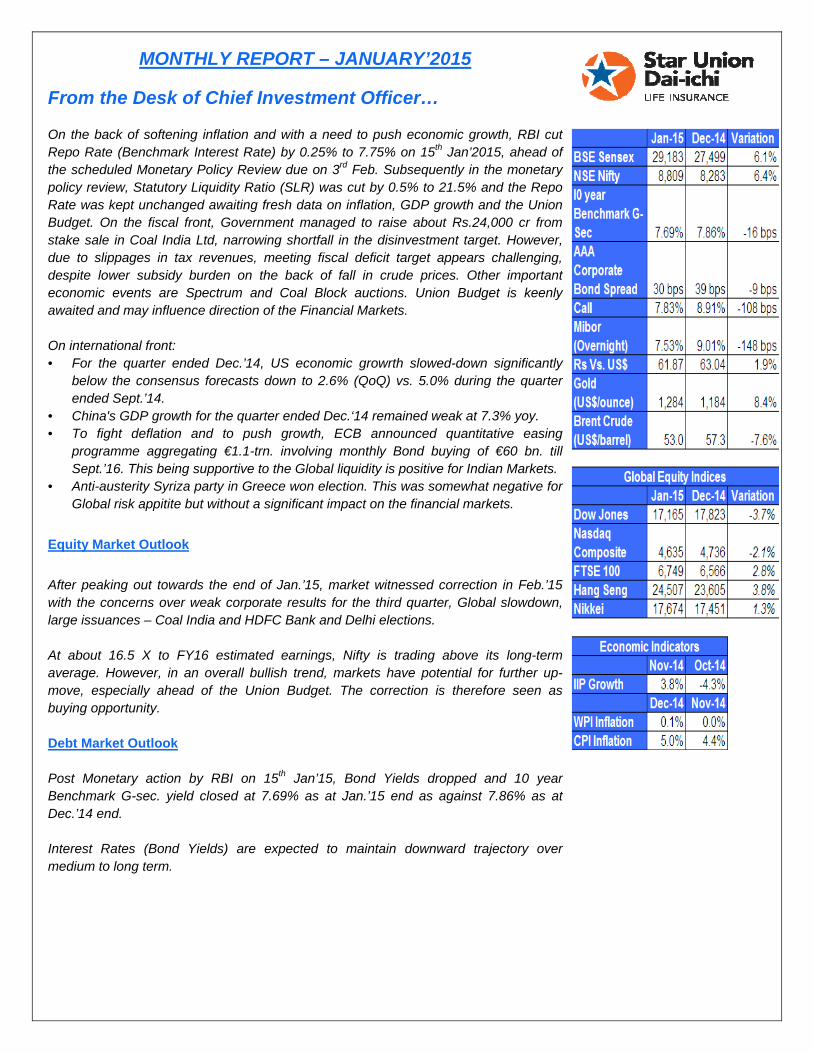
MONTHLY REPORT – JANUARY’2015
From the Desk of Chief Investment Officer…
On the back of softening inflation and with a need to push economic growth, RBI cut Repo Rate (Benchmark Interest Rate) by 0.25% to 7.75% on 15th Jan’2015, ahead of the scheduled Monetary Policy Review due on 3rd Feb. Subsequently in the monetary policy review, Statutory Liquidity Ratio (SLR) was cut by 0.5% to 21.5% and the Repo Rate was kept unchanged awaiting fresh data on inflation, GDP growth and the Union Budget. On the fiscal front, Government managed to raise about Rs.24,000 cr from stake sale in Coal India Ltd, narrowing shortfall in the disinvestment target. However, due to slippages in tax revenues, meeting fiscal deficit target appears challenging, despite lower subsidy burden on the back of fall in crude prices. Other important economic events are Spectrum and Coal Block auctions. Union Budget is keenly awaited and may influence direction of the Financial Markets. On international front: • For the quarter ended Dec.’14, US economic growrth slowed-down significantly
below the consensus forecasts down to 2.6% (QoQ) vs. 5.0% during the quarter ended Sept.’14.
• China's GDP growth for the quarter ended Dec.‘14 remained weak at 7.3% yoy. • To fight deflation and to push growth, ECB announced quantitative easing
programme aggregating €1.1-trn. involving monthly Bond buying of €60 bn. till Sept.’16. This being supportive to the Global liquidity is positive for Indian Markets.
• Anti-austerity Syriza party in Greece won election. This was somewhat negative for Global risk appitite but without a significant impact on the financial markets.
Equity Market Outlook
After peaking out towards the end of Jan.’15, market witnessed correction in Feb.’15 with the concerns over weak corporate results for the third quarter, Global slowdown, large issuances – Coal India and HDFC Bank and Delhi elections. At about 16.5 X to FY16 estimated earnings, Nifty is trading above its long-term average. However, in an overall bullish trend, markets have potential for further up-move, especially ahead of the Union Budget. The correction is therefore seen as buying opportunity. Debt Market Outlook Post Monetary action by RBI on 15th Jan’15, Bond Yields dropped and 10 year Benchmark G-sec. yield closed at 7.69% as at Jan.’15 end as against 7.86% as at Dec.’14 end. Interest Rates (Bond Yields) are expected to maintain downward trajectory over medium to long term.
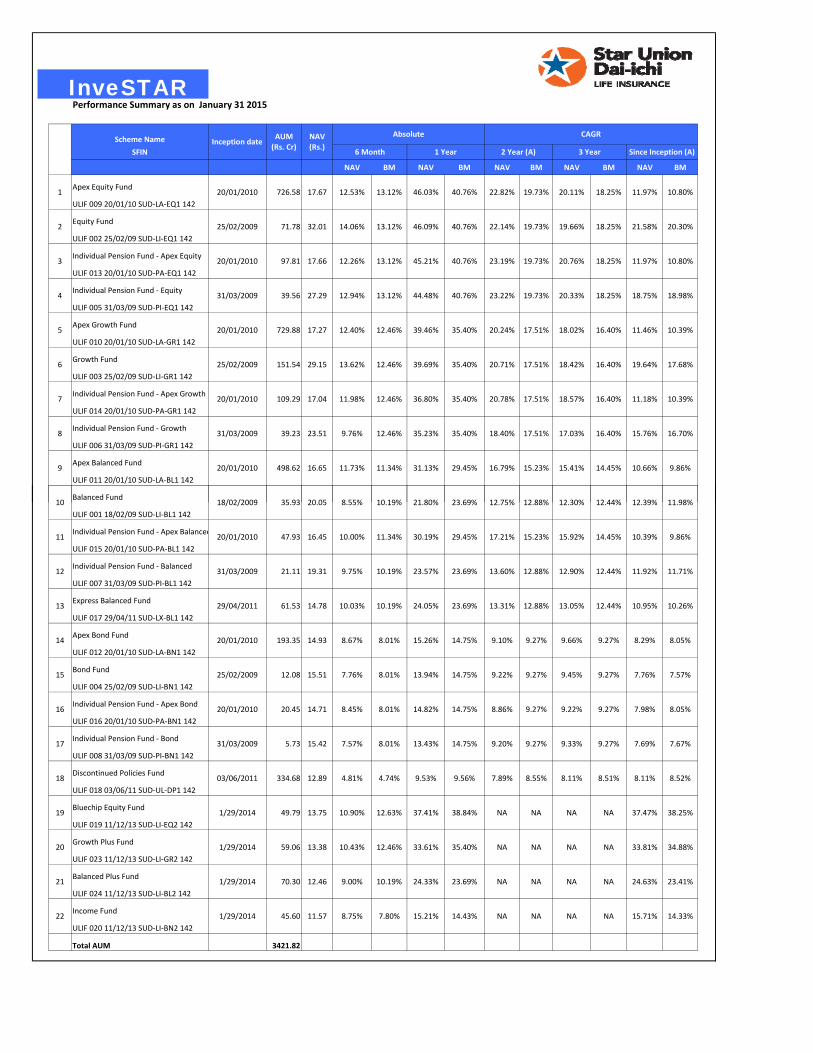
Performance Summary as on January 31 2015
Scheme Name
SFIN
NAV BM NAV BM NAV BM NAV BM NAV BM
Apex Equity Fund
ULIF 009 20/01/10 SUD‐LA‐EQ1 142
Equity Fund
ULIF 002 25/02/09 SUD‐LI‐EQ1 142
Individual Pension Fund ‐ Apex Equity
ULIF 013 20/01/10 SUD‐PA‐EQ1 142
Individual Pension Fund ‐ Equity
ULIF 005 31/03/09 SUD‐PI‐EQ1 142
Apex Growth Fund
ULIF 010 20/01/10 SUD‐LA‐GR1 142
Growth Fund
ULIF 003 25/02/09 SUD‐LI‐GR1 142
Individual Pension Fund ‐ Apex Growth
ULIF 014 20/01/10 SUD‐PA‐GR1 142
Individual Pension Fund ‐ Growth
ULIF 006 31/03/09 SUD‐PI‐GR1 142
Apex Balanced Fund
ULIF 011 20/01/10 SUD‐LA‐BL1 142
Absolute CAGR
20.71% 18.42%
25/02/2009 71.78 32.01 14.06%
25/02/2009 151.54 29.15 13.62% 39.69%
20/01/2010 726.58 17.67 12.53% 46.03% 22.82%
35.23% 18.40%
40.76%
46.09% 22.14%
19.73%
17.51%
18.25%
16.40%
31/03/2009 39.56 27.29 12.94%
12.46%
44.48% 23.22% 20.33%
17.51% 16.40%
35.40% 17.51%17.27 12.40% 39.46% 20.24% 18.02%
19.73%
18.75%
31/03/2009 39.23 23.51 9.76%
20/01/2010 729.88 11.46%
20/01/2010 498.62 16.65 11.73% 31.13%11.34% 16.79% 15.41%
17.03% 15.76%
19.64%
29.45% 15.23%
1 Year6 Month
40.76%
35.40%
40.76%
35.40%
12.26% 45.21% 23.19%
11.98% 36.80% 20.78%
40.76%
35.40%
10.80%
10.39%
9.86%
2 Year (A) 3 Year Since Inception (A)
20.30%19.66% 21.58%
11.97%
11.18%
18.25%
16.40%
10.66%
11.97%20.11%
19.73% 18.25%
18.57%
19.73%
17.51%
20.76%
Inception dateAUM (Rs. Cr)
NAV (Rs.)
13.12%
12.46%
13.12%
12.46%
13.12%
13.12%
12.46%
17.68%
18.98%
16.70%
10.80%
10.39%
20/01/2010 97.81 17.66
20/01/2010 109.29 17.04
18.25%
16.40%
14.45%
1
2
3
4
5
6
7
8
9
InveSTAR
Balanced Fund
ULIF 001 18/02/09 SUD‐LI‐BL1 142
Individual Pension Fund ‐ Apex Balanced
ULIF 015 20/01/10 SUD‐PA‐BL1 142
Individual Pension Fund ‐ Balanced
ULIF 007 31/03/09 SUD‐PI‐BL1 142
Express Balanced Fund
ULIF 017 29/04/11 SUD‐LX‐BL1 142
Apex Bond Fund
ULIF 012 20/01/10 SUD‐LA‐BN1 142
Bond Fund
ULIF 004 25/02/09 SUD‐LI‐BN1 142
Individual Pension Fund ‐ Apex Bond
ULIF 016 20/01/10 SUD‐PA‐BN1 142
Individual Pension Fund ‐ Bond
ULIF 008 31/03/09 SUD‐PI‐BN1 142
Discontinued Policies Fund
ULIF 018 03/06/11 SUD‐UL‐DP1 142
Bluechip Equity Fund
ULIF 019 11/12/13 SUD‐LI‐EQ2 142
Growth Plus Fund
ULIF 023 11/12/13 SUD‐LI‐GR2 142
Balanced Plus Fund
ULIF 024 11/12/13 SUD‐LI‐BL2 142
Income Fund
ULIF 020 11/12/13 SUD‐LI‐BN2 142
Total AUM 3421.82
18/02/2009 35.93 20.05 8.55% 21.80% 12.75% 12.30% 12.39%
25/02/2009 12.08 15.51 7.76% 13.94% 9.22% 9.45% 7.76%9.27% 9.27%
31/03/2009 21.11 19.31 9.75% 23.57% 13.60% 11.92%
31/03/2009 5.73 15.42 7.57% 13.43% 9.20% 9.33% 7.69%
12.88%
9.27%
12.44%12.90%
8.67% 15.26% 9.10% 8.29%14.75% 9.27% 9.66%
12.88%
8.11% 8.11%9.56%4.74% 8.55%
17.21% 15.92% 10.39%
8.86% 9.22% 7.98%
24.05% 13.31% 13.05% 10.95%
29.45%
14.75%
23.69%10.19%
15.23%
9.27%
12.88%
14.45%30.19%
14.75%
03/06/2011 334.68 12.89 4.81% 9.53% 7.89%
29/04/2011 61.53 14.78 10.03%
20/01/2010 47.93 16.45 10.00%
20/01/2010 20.45 14.71 8.45%
23.69% 11.98%12.44%
8.52%
10.19%
8.01%
10.19%
8.01%
8.01%
11.34%
8.01%
7.57%
11.71%
7.67%
14
15
16
8.05%
9.86%
8.05%
10.26%
14.75%
23.69%
14.82%
20/01/2010 193.35 14.93
17
18
9.27%
12.44%
8.51%
9.27%
9.27%
10
11
12
13
NA 37.47% 38.25%
20 1/29/2014 59.06 13.38 10.43% 12.46% 33.61% 35.40% NA NA NA NA 33.81% 34.88%
19 1/29/2014 49.79 13.75 10.90%
10.19% 24.33% 23.69%
NA NA NA12.63% 37.41% 38.84%
NA NA NA NA 24.63% 23.41%
22 1/29/2014 45.60 11.57 8.75% 7.80% 15.21% 14.43% NA NA NA NA 15.71% 14.33%
21 1/29/2014 70.30 12.46 9.00%
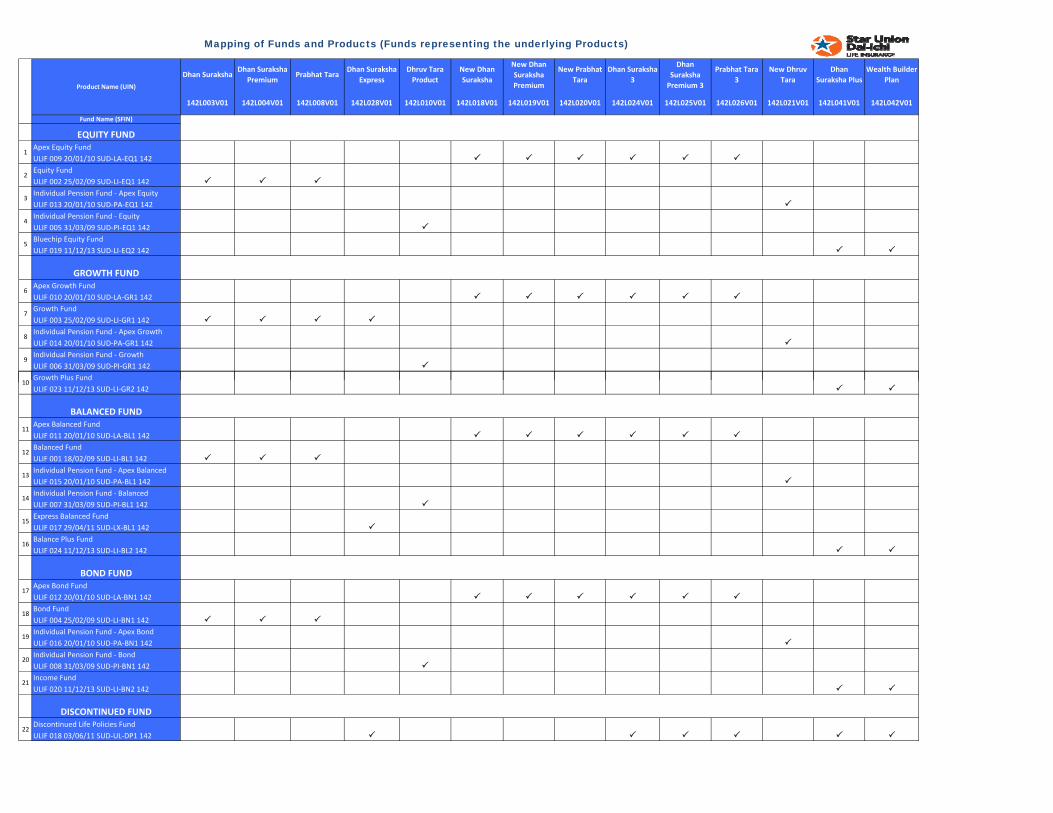
142L003V01 142L004V01 142L008V01 142L028V01 142L010V01 142L018V01 142L019V01 142L020V01 142L024V01 142L025V01 142L026V01 142L021V01 142L041V01 142L042V01
Fund Name (SFIN)
Apex Equity Fund
ULIF 009 20/01/10 SUD‐LA‐EQ1 142
Equity Fund
ULIF 002 25/02/09 SUD‐LI‐EQ1 142
Individual Pension Fund ‐ Apex Equity
ULIF 013 20/01/10 SUD‐PA‐EQ1 142
Individual Pension Fund ‐ Equity
ULIF 005 31/03/09 SUD‐PI‐EQ1 142
Bluechip Equity Fund
ULIF 019 11/12/13 SUD‐LI‐EQ2 142
Apex Growth Fund
ULIF 010 20/01/10 SUD‐LA‐GR1 142
Growth Fund
ULIF 003 25/02/09 SUD‐LI‐GR1 142
Individual Pension Fund ‐ Apex Growth
ULIF 014 20/01/10 SUD‐PA‐GR1 142
Individual Pension Fund ‐ Growth
ULIF 006 31/03/09 SUD‐PI‐GR1 142
Growth Plus Fund
GROWTH FUND
10
EQUITY FUND
5
Dhan
Suraksha Plus
Wealth Builder
Plan
New Dhruv
Tara
Dhan Suraksha
Express
Dhruv Tara
Product
New Dhan
Suraksha
New Dhan
Suraksha
Premium
Dhan Suraksha
3
Dhan
Suraksha
Premium 3
Prabhat Tara
3
New Prabhat
Tara
6
7
8
9
Mapping of Funds and Products (Funds representing the underlying Products)
1
2
3
4
Product Name (UIN)
Dhan SurakshaDhan Suraksha
PremiumPrabhat Tara
Growth Plus Fund
ULIF 023 11/12/13 SUD‐LI‐GR2 142
Apex Balanced Fund
ULIF 011 20/01/10 SUD‐LA‐BL1 142
Balanced Fund
ULIF 001 18/02/09 SUD‐LI‐BL1 142
Individual Pension Fund ‐ Apex Balanced
ULIF 015 20/01/10 SUD‐PA‐BL1 142
Individual Pension Fund ‐ Balanced
ULIF 007 31/03/09 SUD‐PI‐BL1 142
Express Balanced Fund
ULIF 017 29/04/11 SUD‐LX‐BL1 142
Balance Plus Fund
ULIF 024 11/12/13 SUD‐LI‐BL2 142
Apex Bond Fund
ULIF 012 20/01/10 SUD‐LA‐BN1 142
Bond Fund
ULIF 004 25/02/09 SUD‐LI‐BN1 142
Individual Pension Fund ‐ Apex Bond
ULIF 016 20/01/10 SUD‐PA‐BN1 142
Individual Pension Fund ‐ Bond
ULIF 008 31/03/09 SUD‐PI‐BN1 142
Income Fund
ULIF 020 11/12/13 SUD‐LI‐BN2 142
Discontinued Life Policies Fund
ULIF 018 03/06/11 SUD‐UL‐DP1 142
DISCONTINUED FUND
BOND FUND
21
BALANCED FUND
16
10
19
11
12
20
22
13
14
15
17
18
Investment Objective :
Date of Inception : SFIN No.
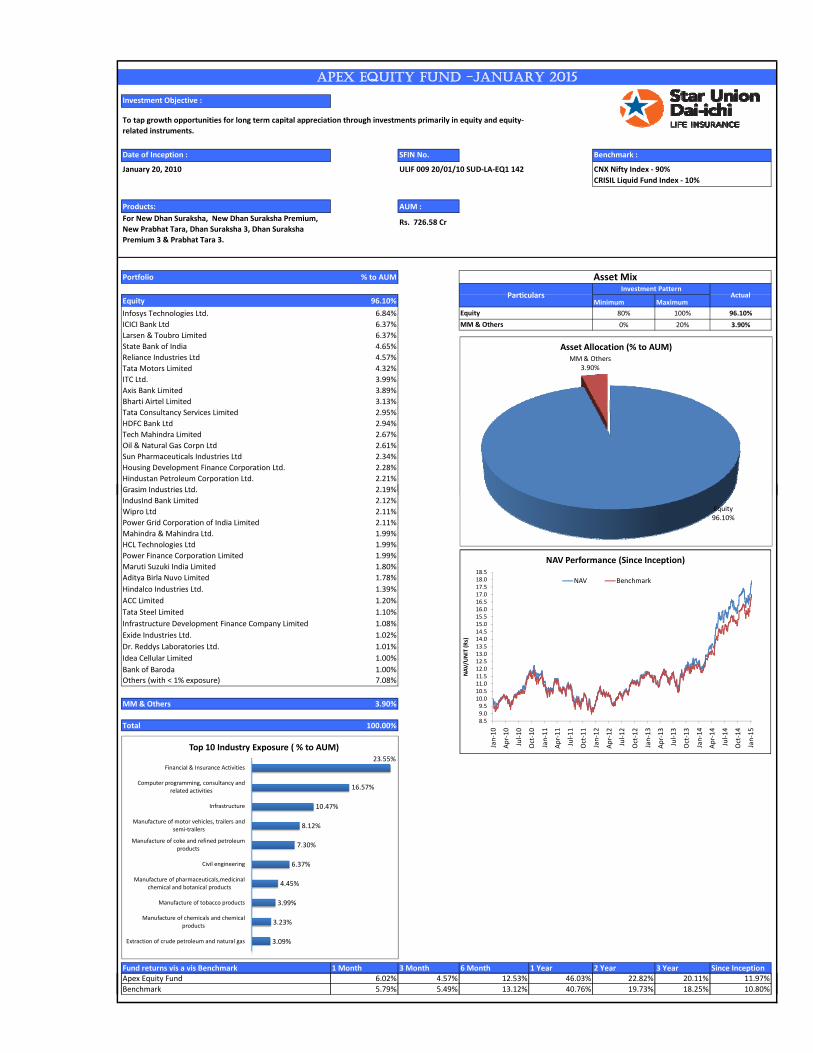
January 20, 2010 ULIF 009 20/01/10 SUD‐LA‐EQ1 142
Products: AUM :
Rs. 726.58 Cr
Portfolio % to AUM
`
Equity 96.10% Minimum Maximum
Infosys Technologies Ltd. 6.84% 80% 100% 96.10%
ICICI Bank Ltd 6.37% 0% 20% 3.90%
Larsen & Toubro Limited 6.37%
State Bank of India 4.65%
Reliance Industries Ltd 4.57%
Tata Motors Limited 4.32%
ITC Ltd. 3.99%
Axis Bank Limited 3.89%
Bharti Airtel Limited 3.13%
Tata Consultancy Services Limited 2.95%
HDFC Bank Ltd 2.94%
Tech Mahindra Limited 2.67%
Oil & Natural Gas Corpn Ltd 2.61%
Sun Pharmaceuticals Industries Ltd 2.34%
Housing Development Finance Corporation Ltd. 2.28%
Hindustan Petroleum Corporation Ltd. 2.21%
Grasim Industries Ltd. 2.19%
APEX EQUITY FUND -JANUARY 2015
Equity
MM & Others
To tap growth opportunities for long term capital appreciation through investments primarily in equity and equity‐
related instruments.
Investment PatternActual
Asset Mix
Particulars
For New Dhan Suraksha, New Dhan Suraksha Premium,
New Prabhat Tara, Dhan Suraksha 3, Dhan Suraksha
Premium 3 & Prabhat Tara 3.
Benchmark :
CNX Nifty Index ‐ 90%
CRISIL Liquid Fund Index ‐ 10%
MM & Others3.90%
Asset Allocation (% to AUM)
Grasim Industries Ltd. 2.19%
IndusInd Bank Limited 2.12%
Wipro Ltd 2.11%
Power Grid Corporation of India Limited 2.11%
Mahindra & Mahindra Ltd. 1.99%
HCL Technologies Ltd 1.99%
Power Finance Corporation Limited 1.99%
Maruti Suzuki India Limited 1.80%
Aditya Birla Nuvo Limited 1.78%
Hindalco Industries Ltd. 1.39%
ACC Limited 1.20%
Tata Steel Limited 1.10%
Infrastructure Development Finance Company Limited 1.08%
Exide Industries Ltd. 1.02%
Dr. Reddys Laboratories Ltd. 1.01%
Idea Cellular Limited 1.00%
Bank of Baroda 1.00%
Others (with < 1% exposure) 7.08%
MM & Others 3.90%
Total 100.00%
`
Fund returns vis a vis Benchmark 1 Month 3 Month 6 Month 1 Year 2 Year 3 Year Since InceptionApex Equity Fund 6.02% 4.57% 12.53% 46.03% 22.82% 20.11% 11.97%
23.55%
16.57%
10.47%
8.12%
7.30%
6.37%
4.45%
3.99%
3.23%
3.09%
Financial & Insurance Activities
Computer programming, consultancy and related activities
Infrastructure
Manufacture of motor vehicles, trailers and semi‐trailers
Manufacture of coke and refined petroleum products
Civil engineering
Manufacture of pharmaceuticals,medicinal chemical and botanical products
Manufacture of tobacco products
Manufacture of chemicals and chemical products
Extraction of crude petroleum and natural gas
Top 10 Industry Exposure ( % to AUM)
Equity96.10%
MM & Others3.90%
Asset Allocation (% to AUM)
8.59.09.510.010.511.011.512.012.513.013.514.014.515.015.516.016.517.017.518.018.5
Jan‐10
Apr‐10
Jul‐10
Oct‐10
Jan‐11
Apr‐11
Jul‐11
Oct‐11
Jan‐12
Apr‐12
Jul‐12
Oct‐12
Jan‐13
Apr‐13
Jul‐13
Oct‐13
Jan‐14
Apr‐14
Jul‐14
Oct‐14
Jan‐15
NAV/U
NIT (Rs)
NAV Performance (Since Inception)
NAV Benchmark
Benchmark 5.79% 5.49% 13.12% 40.76% 19.73% 18.25% 10.80%
23.55%
16.57%
10.47%
8.12%
7.30%
6.37%
4.45%
3.99%
3.23%
3.09%
Financial & Insurance Activities
Computer programming, consultancy and related activities
Infrastructure
Manufacture of motor vehicles, trailers and semi‐trailers
Manufacture of coke and refined petroleum products
Civil engineering
Manufacture of pharmaceuticals,medicinal chemical and botanical products
Manufacture of tobacco products
Manufacture of chemicals and chemical products
Extraction of crude petroleum and natural gas
Top 10 Industry Exposure ( % to AUM)
Equity96.10%
MM & Others3.90%
Asset Allocation (% to AUM)
8.59.09.510.010.511.011.512.012.513.013.514.014.515.015.516.016.517.017.518.018.5
Jan‐10
Apr‐10
Jul‐10
Oct‐10
Jan‐11
Apr‐11
Jul‐11
Oct‐11
Jan‐12
Apr‐12
Jul‐12
Oct‐12
Jan‐13
Apr‐13
Jul‐13
Oct‐13
Jan‐14
Apr‐14
Jul‐14
Oct‐14
Jan‐15
NAV/U
NIT (Rs)
NAV Performance (Since Inception)
NAV Benchmark
Investment Objective:
Date of Inception : SFIN No.
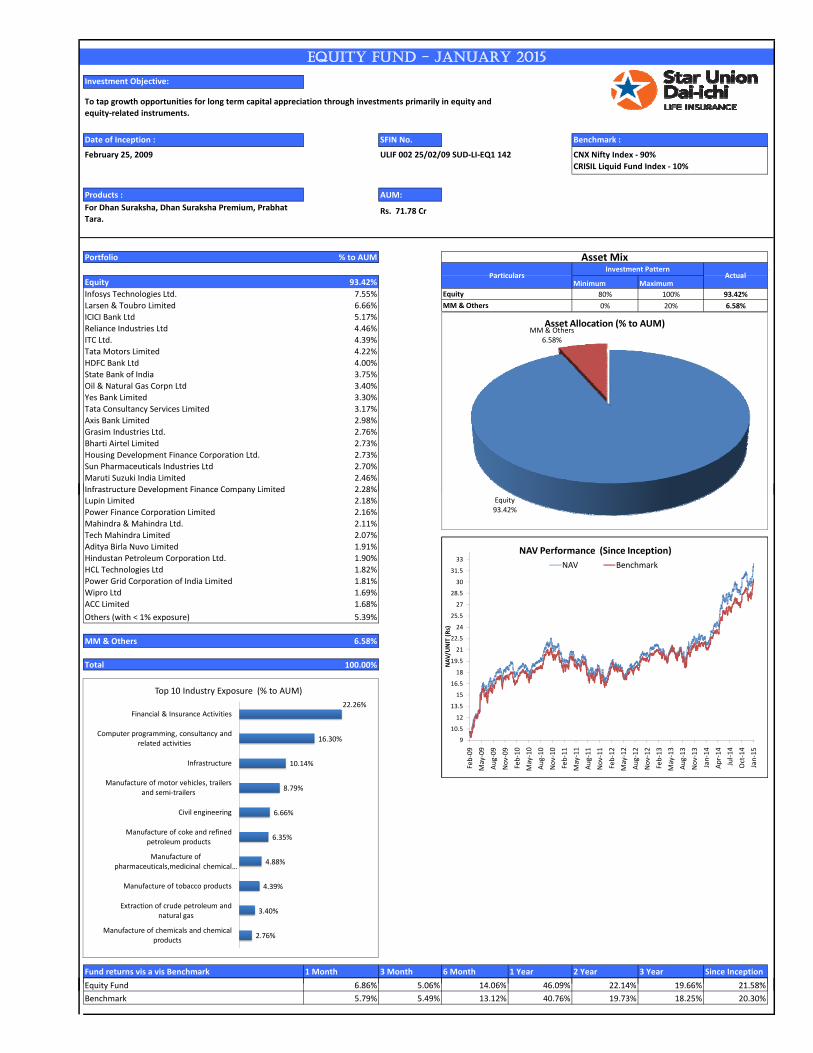
February 25, 2009 ULIF 002 25/02/09 SUD‐LI‐EQ1 142
Products : AUM:
Rs. 71.78 Cr
Portfolio % to AUM
`
Equity 93.42% Minimum Maximum
Infosys Technologies Ltd. 7.55% 80% 100% 93.42%
Larsen & Toubro Limited 6.66% 0% 20% 6.58%
ICICI Bank Ltd 5.17%
Reliance Industries Ltd 4.46%
ITC Ltd. 4.39%
Tata Motors Limited 4.22%
HDFC Bank Ltd 4.00%
State Bank of India 3.75%
Oil & Natural Gas Corpn Ltd 3.40%
Yes Bank Limited 3.30%
Tata Consultancy Services Limited 3.17%
Axis Bank Limited 2.98%
Grasim Industries Ltd. 2.76%
Bharti Airtel Limited 2.73%
Housing Development Finance Corporation Ltd. 2.73%
Sun Pharmaceuticals Industries Ltd 2.70%
Maruti Suzuki India Limited 2.46%
Infrastructure Development Finance Company Limited 2.28%
Equity
MM & Others
For Dhan Suraksha, Dhan Suraksha Premium, Prabhat
Tara.
EQUITY FUND - JANUARY 2015
To tap growth opportunities for long term capital appreciation through investments primarily in equity and
equity‐related instruments.
Investment PatternActual
Asset Mix
Particulars
Benchmark :
CNX Nifty Index ‐ 90%
CRISIL Liquid Fund Index ‐ 10%
MM & Others6.58%
Asset Allocation (% to AUM)
Infrastructure Development Finance Company Limited 2.28%
Lupin Limited 2.18%
Power Finance Corporation Limited 2.16%
Mahindra & Mahindra Ltd. 2.11%
Tech Mahindra Limited 2.07%
Aditya Birla Nuvo Limited 1.91%
Hindustan Petroleum Corporation Ltd. 1.90%
HCL Technologies Ltd 1.82%
Power Grid Corporation of India Limited 1.81%
Wipro Ltd 1.69%
ACC Limited 1.68%
Others (with < 1% exposure) 5.39%
MM & Others 6.58%
Total 100.00%
`
Fund returns vis a vis Benchmark 1 Month 3 Month 6 Month 1 Year 2 Year 3 Year Since Inception
Equity Fund 6 86% 5 06% 14 06% 46 09% 22 14% 19 66% 21 58%
22.26%
16.30%
10.14%
8.79%
6.66%
6.35%
4.88%
4.39%
3.40%
2.76%
Financial & Insurance Activities
Computer programming, consultancy and related activities
Infrastructure
Manufacture of motor vehicles, trailers and semi‐trailers
Civil engineering
Manufacture of coke and refined petroleum products
Manufacture of pharmaceuticals,medicinal chemical …
Manufacture of tobacco products
Extraction of crude petroleum and natural gas
Manufacture of chemicals and chemical products
Top 10 Industry Exposure (% to AUM)
Equity93.42%
MM & Others6.58%
Asset Allocation (% to AUM)
9
10.5
12
13.5
15
16.5
18
19.5
21
22.5
24
25.5
27
28.5
30
31.5
33
Feb‐09
May‐09
Aug‐09
Nov‐09
Feb‐10
May‐10
Aug‐10
Nov‐10
Feb‐11
May‐11
Aug‐11
Nov‐11
Feb‐12
May‐12
Aug‐12
Nov‐12
Feb‐13
May‐13
Aug‐13
Nov‐13
Jan‐14
Apr‐14
Jul‐14
Oct‐14
Jan‐15
NAV/U
NIT (Rs)
NAV Performance (Since Inception)
NAV Benchmark
Equity Fund 6.86% 5.06% 14.06% 46.09% 22.14% 19.66% 21.58%
Benchmark 5.79% 5.49% 13.12% 40.76% 19.73% 18.25% 20.30%
22.26%
16.30%
10.14%
8.79%
6.66%
6.35%
4.88%
4.39%
3.40%
2.76%
Financial & Insurance Activities
Computer programming, consultancy and related activities
Infrastructure
Manufacture of motor vehicles, trailers and semi‐trailers
Civil engineering
Manufacture of coke and refined petroleum products
Manufacture of pharmaceuticals,medicinal chemical …
Manufacture of tobacco products
Extraction of crude petroleum and natural gas
Manufacture of chemicals and chemical products
Top 10 Industry Exposure (% to AUM)
Equity93.42%
MM & Others6.58%
Asset Allocation (% to AUM)
9
10.5
12
13.5
15
16.5
18
19.5
21
22.5
24
25.5
27
28.5
30
31.5
33
Feb‐09
May‐09
Aug‐09
Nov‐09
Feb‐10
May‐10
Aug‐10
Nov‐10
Feb‐11
May‐11
Aug‐11
Nov‐11
Feb‐12
May‐12
Aug‐12
Nov‐12
Feb‐13
May‐13
Aug‐13
Nov‐13
Jan‐14
Apr‐14
Jul‐14
Oct‐14
Jan‐15
NAV/U
NIT (Rs)
NAV Performance (Since Inception)
NAV Benchmark
Investment Objective :
Date of Inception : SFIN No.
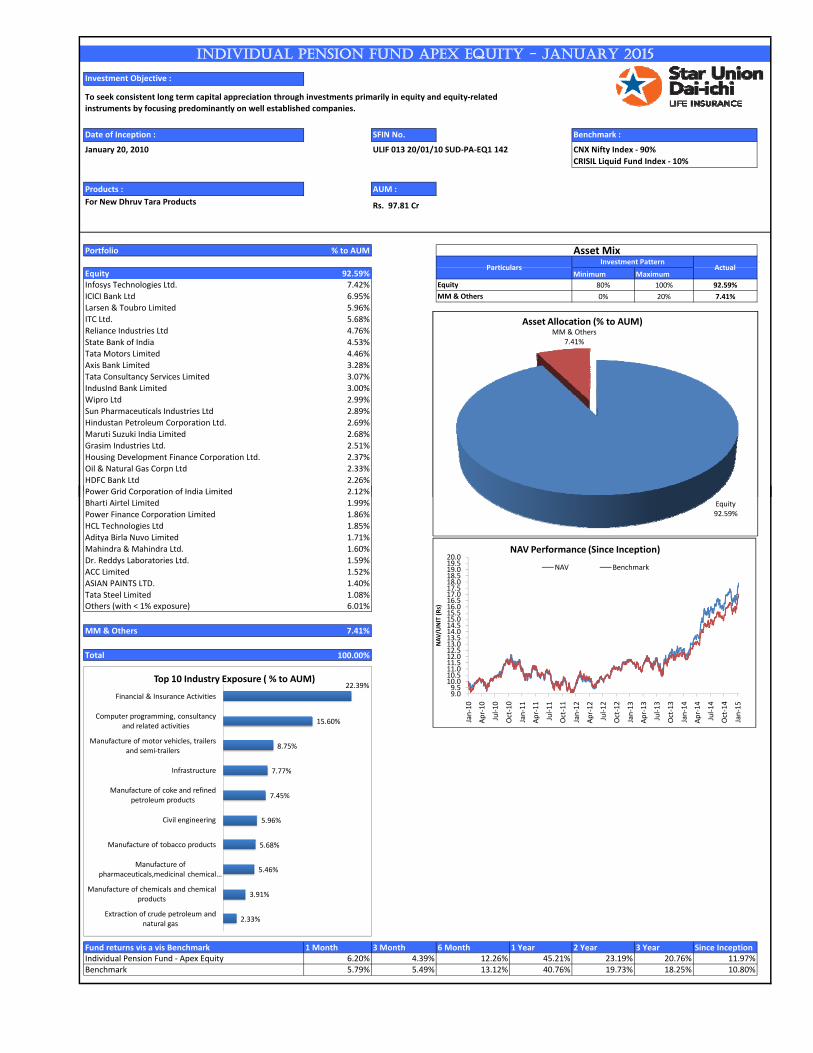
January 20, 2010 ULIF 013 20/01/10 SUD‐PA‐EQ1 142
Products : AUM :
Rs. 97.81 Cr
Portfolio % to AUM
`
Equity 92.59% Minimum Maximum
Infosys Technologies Ltd. 7.42% 80% 100% 92.59%
ICICI Bank Ltd 6.95% 0% 20% 7.41%
Larsen & Toubro Limited 5.96%
ITC Ltd. 5.68%
Reliance Industries Ltd 4.76%
State Bank of India 4.53%
Tata Motors Limited 4.46%
Axis Bank Limited 3.28%
Tata Consultancy Services Limited 3.07%
IndusInd Bank Limited 3.00%
Wipro Ltd 2.99%
Sun Pharmaceuticals Industries Ltd 2.89%
Hindustan Petroleum Corporation Ltd. 2.69%
Maruti Suzuki India Limited 2.68%
Grasim Industries Ltd. 2.51%
Housing Development Finance Corporation Ltd. 2.37%
Oil & Natural Gas Corpn Ltd 2.33%
HDFC Bank Ltd 2.26%
Power Grid Corporation of India Limited 2 12%
INDIVIDUAL PENSION FUND APEX EQUITY - JANUARY 2015
Equity
For New Dhruv Tara Products
MM & Others
To seek consistent long term capital appreciation through investments primarily in equity and equity‐related
instruments by focusing predominantly on well established companies.
Asset Mix
ParticularsInvestment Pattern
Actual
Benchmark :
CNX Nifty Index ‐ 90%
CRISIL Liquid Fund Index ‐ 10%
MM & Others7.41%
Asset Allocation (% to AUM)
Power Grid Corporation of India Limited 2.12%
Bharti Airtel Limited 1.99%
Power Finance Corporation Limited 1.86%
HCL Technologies Ltd 1.85%
Aditya Birla Nuvo Limited 1.71%
Mahindra & Mahindra Ltd. 1.60%
Dr. Reddys Laboratories Ltd. 1.59%
ACC Limited 1.52%
ASIAN PAINTS LTD. 1.40%
Tata Steel Limited 1.08%Others (with < 1% exposure) 6.01%
MM & Others 7.41%
Total 100.00%
`
Fund returns vis a vis Benchmark 1 Month 3 Month 6 Month 1 Year 2 Year 3 Year Since InceptionIndividual Pension Fund ‐ Apex Equity 6.20% 4.39% 12.26% 45.21% 23.19% 20.76% 11.97%Benchmark 5.79% 5.49% 13.12% 40.76% 19.73% 18.25% 10.80%
22.39%
15.60%
8.75%
7.77%
7.45%
5.96%
5.68%
5.46%
3.91%
2.33%
Financial & Insurance Activities
Computer programming, consultancy and related activities
Manufacture of motor vehicles, trailers and semi‐trailers
Infrastructure
Manufacture of coke and refined petroleum products
Civil engineering
Manufacture of tobacco products
Manufacture of pharmaceuticals,medicinal chemical …
Manufacture of chemicals and chemical products
Extraction of crude petroleum and natural gas
Top 10 Industry Exposure ( % to AUM)
Equity92.59%
MM & Others7.41%
Asset Allocation (% to AUM)
9.09.510.010.511.011.512.012.513.013.514.014.515.015.516.016.517.017.518.018.519.019.520.0
Jan‐10
Apr‐10
Jul‐10
Oct‐10
Jan‐11
Apr‐11
Jul‐11
Oct‐11
Jan‐12
Apr‐12
Jul‐12
Oct‐12
Jan‐13
Apr‐13
Jul‐13
Oct‐13
Jan‐14
Apr‐14
Jul‐14
Oct‐14
Jan‐15
NAV/U
NIT (Rs)
NAV Performance (Since Inception)
NAV Benchmark
Investment Objective :
Date of Inception : SFIN No.
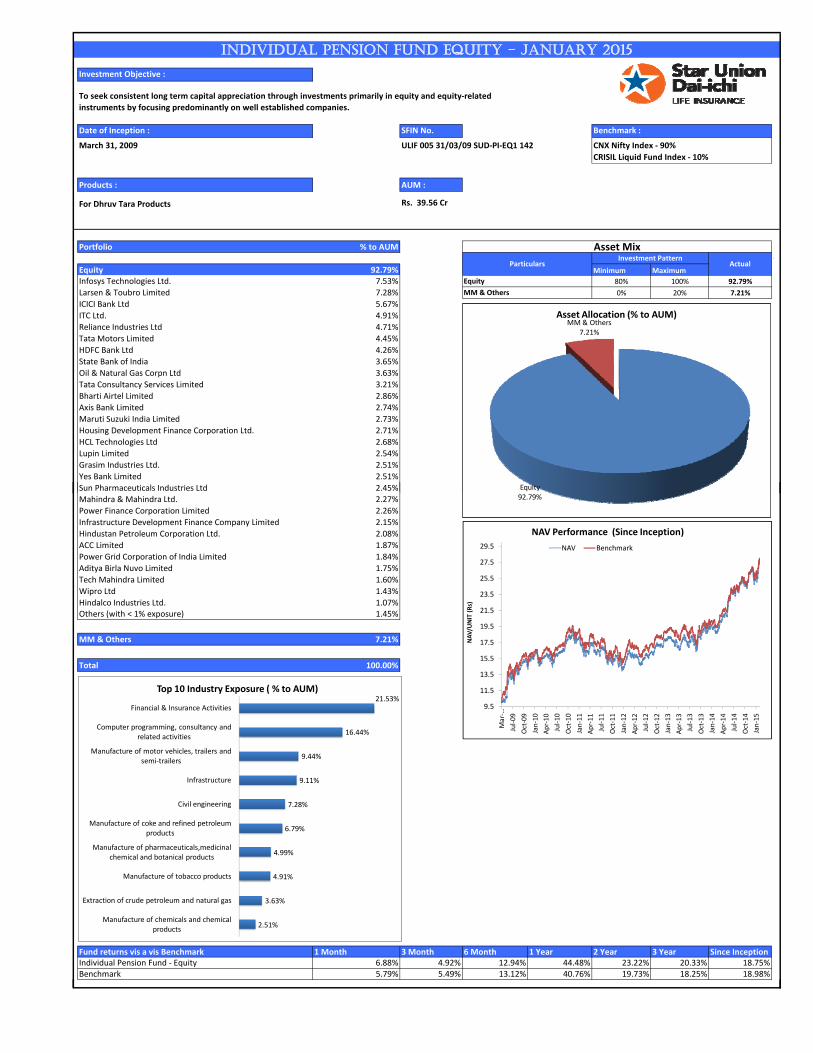
March 31, 2009 ULIF 005 31/03/09 SUD‐PI‐EQ1 142
Products : AUM :
Rs. 39.56 Cr
Portfolio % to AUM
`
Equity 92.79% Minimum Maximum
Infosys Technologies Ltd. 7.53% 80% 100% 92.79%
Larsen & Toubro Limited 7.28% 0% 20% 7.21%
ICICI Bank Ltd 5.67%
ITC Ltd. 4.91%
Reliance Industries Ltd 4.71%
Tata Motors Limited 4.45%
HDFC Bank Ltd 4.26%
State Bank of India 3.65%
Oil & Natural Gas Corpn Ltd 3.63%
Tata Consultancy Services Limited 3.21%
Bharti Airtel Limited 2.86%
Axis Bank Limited 2.74%
Maruti Suzuki India Limited 2.73%
Housing Development Finance Corporation Ltd. 2.71%
HCL Technologies Ltd 2.68%
Lupin Limited 2.54%
Grasim Industries Ltd. 2.51%
Yes Bank Limited 2.51%
Sun Pharmaceuticals Industries Ltd 2.45%
INDIVIDUAL PENSION FUND EQUITY - JANUARY 2015
MM & Others
Equity
For Dhruv Tara Products
To seek consistent long term capital appreciation through investments primarily in equity and equity‐related
instruments by focusing predominantly on well established companies.
Asset Mix
ParticularsInvestment Pattern
Actual
Benchmark :
CNX Nifty Index ‐ 90%
CRISIL Liquid Fund Index ‐ 10%
Equity
MM & Others7.21%
Asset Allocation (% to AUM)
Mahindra & Mahindra Ltd. 2.27%
Power Finance Corporation Limited 2.26%
Infrastructure Development Finance Company Limited 2.15%
Hindustan Petroleum Corporation Ltd. 2.08%
ACC Limited 1.87%
Power Grid Corporation of India Limited 1.84%
Aditya Birla Nuvo Limited 1.75%
Tech Mahindra Limited 1.60%
Wipro Ltd 1.43%
Hindalco Industries Ltd. 1.07%Others (with < 1% exposure) 1.45%
MM & Others 7.21%
Total 100.00%
`
Fund returns vis a vis Benchmark 1 Month 3 Month 6 Month 1 Year 2 Year 3 Year Since InceptionIndividual Pension Fund ‐ Equity 6.88% 4.92% 12.94% 44.48% 23.22% 20.33% 18.75%Benchmark 5.79% 5.49% 13.12% 40.76% 19.73% 18.25% 18.98%
21.53%
16.44%
9.44%
9.11%
7.28%
6.79%
4.99%
4.91%
3.63%
2.51%
Financial & Insurance Activities
Computer programming, consultancy and related activities
Manufacture of motor vehicles, trailers and semi‐trailers
Infrastructure
Civil engineering
Manufacture of coke and refined petroleum products
Manufacture of pharmaceuticals,medicinal chemical and botanical products
Manufacture of tobacco products
Extraction of crude petroleum and natural gas
Manufacture of chemicals and chemical products
Top 10 Industry Exposure ( % to AUM)
Equity92.79%
MM & Others7.21%
Asset Allocation (% to AUM)
9.5
11.5
13.5
15.5
17.5
19.5
21.5
23.5
25.5
27.5
29.5
Mar‐…
Jul‐09
Oct‐09
Jan‐10
Apr‐10
Jul‐10
Oct‐10
Jan‐11
Apr‐11
Jul‐11
Oct‐11
Jan‐12
Apr‐12
Jul‐12
Oct‐12
Jan‐13
Apr‐13
Jul‐13
Oct‐13
Jan‐14
Apr‐14
Jul‐14
Oct‐14
Jan‐15
NAV/U
NIT (Rs)
NAV Performance (Since Inception)
NAV Benchmark
Investment Objective :
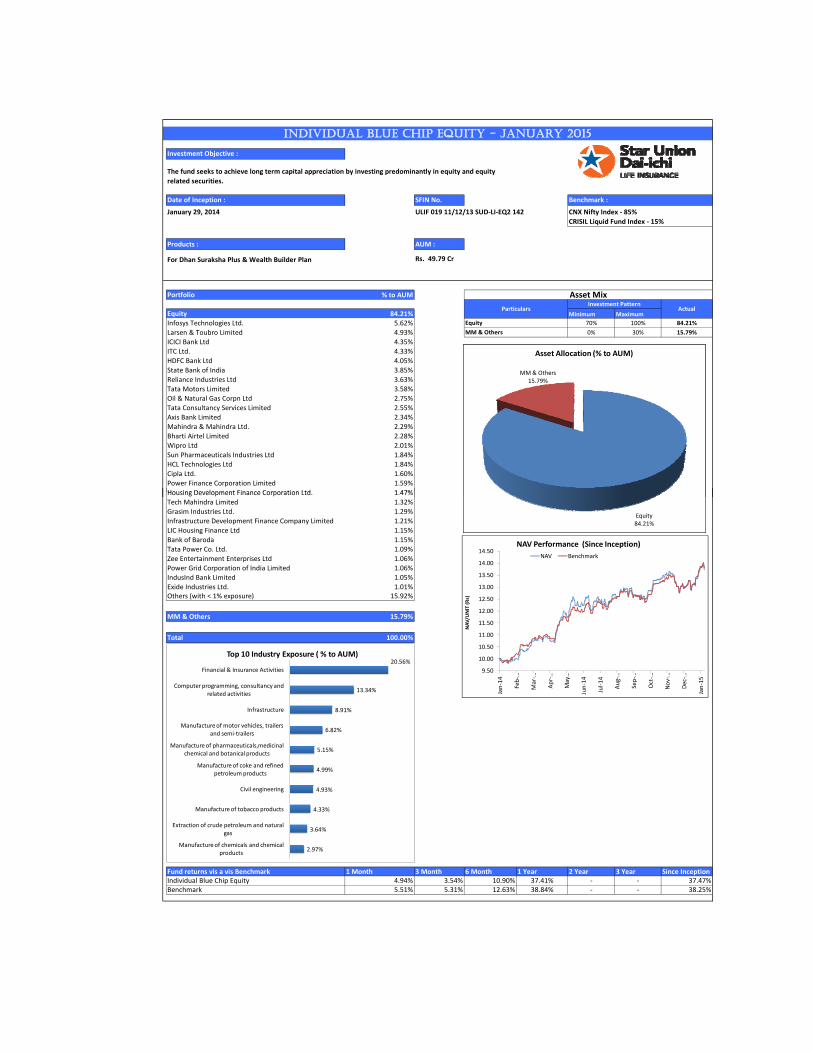
Date of Inception : SFIN No.
January 29, 2014 ULIF 019 11/12/13 SUD‐LI‐EQ2 142
Products : AUM :
Rs. 49.79 Cr
Portfolio % to AUM
Equity 84.21% Minimum Maximum
Infosys Technologies Ltd. 5.62% 70% 100% 84.21%
Larsen & Toubro Limited 4.93% 0% 30% 15.79%
ICICI Bank Ltd 4.35%
ITC Ltd. 4.33%
HDFC Bank Ltd 4.05%
State Bank of India 3.85%
Reliance Industries Ltd 3.63%
Tata Motors Limited 3.58%
Oil & Natural Gas Corpn Ltd 2.75%
Tata Consultancy Services Limited 2.55%
Axis Bank Limited 2.34%
Mahindra & Mahindra Ltd. 2.29%
Bharti Airtel Limited 2.28%
Wipro Ltd 2.01%
Sun Pharmaceuticals Industries Ltd 1.84%
HCL Technologies Ltd 1.84%
Cipla Ltd. 1.60%
Power Finance Corporation Limited 1.59%
Housing Development Finance Corporation Ltd 1 47%
INDIVIDUAL BLUE CHIP EQUITY - JANUARY 2015
MM & Others
Asset Mix
ParticularsInvestment Pattern
Actual
Equity
For Dhan Suraksha Plus & Wealth Builder Plan
The fund seeks to achieve long term capital appreciation by investing predominantly in equity and equity
related securities.
Benchmark :
CNX Nifty Index ‐ 85%
CRISIL Liquid Fund Index ‐ 15%
MM & Others15.79%
Asset Allocation (% to AUM)
Housing Development Finance Corporation Ltd. 1.47%
Tech Mahindra Limited 1.32%
Grasim Industries Ltd. 1.29%
Infrastructure Development Finance Company Limited 1.21%
LIC Housing Finance Ltd 1.15%
Bank of Baroda 1.15%
Tata Power Co. Ltd. 1.09%
Zee Entertainment Enterprises Ltd 1.06%
Power Grid Corporation of India Limited 1.06%
IndusInd Bank Limited 1.05%
Exide Industries Ltd. 1.01%Others (with < 1% exposure) 15.92%
MM & Others 15.79%
Total 100.00%
`
Fund returns vis a vis Benchmark 1 Month 3 Month 6 Month 1 Year 2 Year 3 Year Since InceptionIndividual Blue Chip Equity 4.94% 3.54% 10.90% 37.41% ‐ ‐ 37.47%Benchmark 5.51% 5.31% 12.63% 38.84% ‐ ‐ 38.25%
20.56%
13.34%
8.91%
6.82%
5.15%
4.99%
4.93%
4.33%
3.64%
2.97%
Financial & Insurance Activities
Computer programming, consultancy and related activities
Infrastructure
Manufacture of motor vehicles, trailers and semi‐trailers
Manufacture of pharmaceuticals,medicinal chemical and botanical products
Manufacture of coke and refined petroleum products
Civil engineering
Manufacture of tobacco products
Extraction of crude petroleum and natural gas
Manufacture of chemicals and chemical products
Top 10 Industry Exposure ( % to AUM)
Equity84.21%
MM & Others15.79%
Asset Allocation (% to AUM)
9.50
10.00
10.50
11.00
11.50
12.00
12.50
13.00
13.50
14.00
14.50
Jan‐14
Feb‐…
Mar‐…
Apr‐…
May…
Jun‐14
Jul‐14
Aug‐…
Sep‐…
Oct‐…
Nov‐…
Dec‐…
Jan‐15
NAV/U
NIT (Rs)
NAV Performance (Since Inception)
NAV Benchmark
Investment Objective :
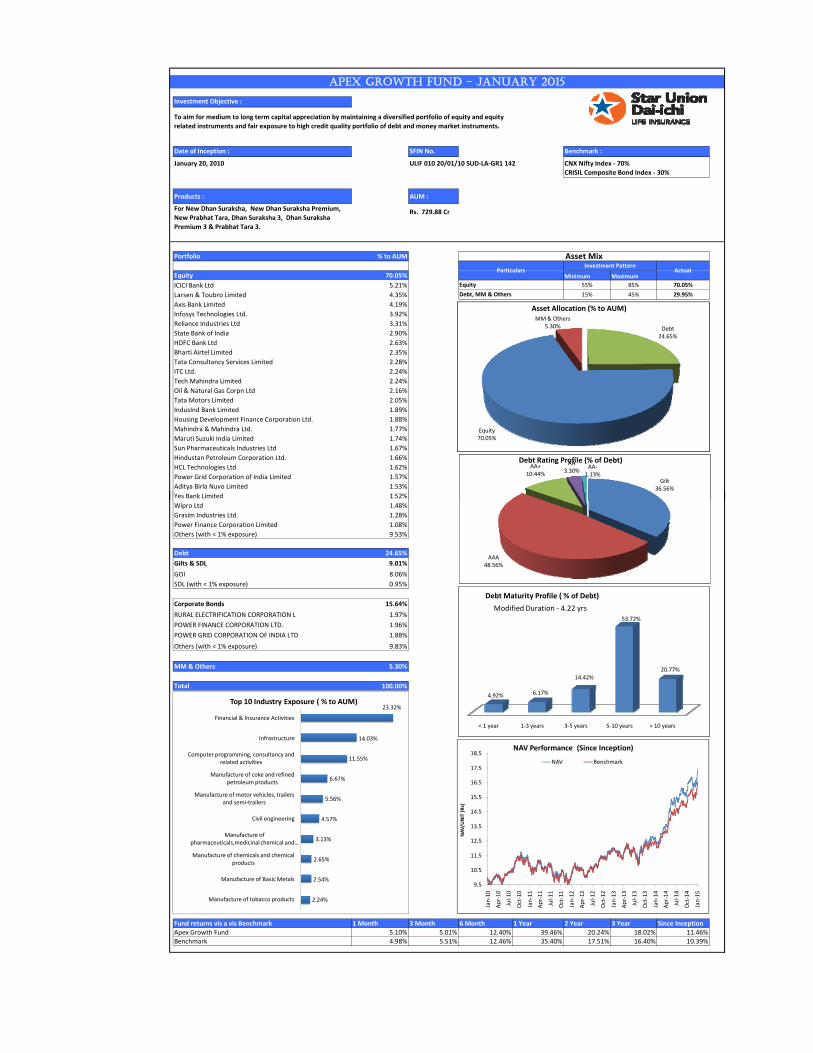
Date of Inception : SFIN No.
January 20, 2010 ULIF 010 20/01/10 SUD‐LA‐GR1 142
Products : AUM :
Rs. 729.88 Cr
Portfolio % to AUM
`
Equity 70.05% Minimum Maximum
ICICI Bank Ltd 5.21% 55% 85% 70.05%
Larsen & Toubro Limited 4.35% 15% 45% 29.95%
Axis Bank Limited 4.19%
Infosys Technologies Ltd. 3.92%
Reliance Industries Ltd 3.31%
State Bank of India 2.90%
HDFC Bank Ltd 2.63%
Bharti Airtel Limited 2.35%
Tata Consultancy Services Limited 2.28%
ITC Ltd. 2.24%
Tech Mahindra Limited 2.24%
Oil & Natural Gas Corpn Ltd 2.16%
Tata Motors Limited 2.05%
IndusInd Bank Limited 1.89%
Housing Development Finance Corporation Ltd. 1.88%
Mahindra & Mahindra Ltd. 1.77%
Maruti Suzuki India Limited 1.74%
Sun Pharmaceuticals Industries Ltd 1.67%
Hindustan Petroleum Corporation Ltd. 1.66%
HCL Technologies Ltd 1.62%
Power Grid Corporation of India Limited 1.57%
Aditya Birla Nuvo Limited 1.53%
APEX GROWTH FUND - JANUARY 2015
Equity
Debt, MM & Others
To aim for medium to long term capital appreciation by maintaining a diversified portfolio of equity and equity
related instruments and fair exposure to high credit quality portfolio of debt and money market instruments.
Investment PatternActual
Asset Mix
Particulars
For New Dhan Suraksha, New Dhan Suraksha Premium,
New Prabhat Tara, Dhan Suraksha 3, Dhan Suraksha
Premium 3 & Prabhat Tara 3.
Benchmark :
CNX Nifty Index ‐ 70%
CRISIL Composite Bond Index ‐ 30%
Debt24.65%
Equity70.05%
MM & Others5.30%
Asset Allocation (% to AUM)
Gilt36.56%
AA+10.44%
AA3.30%
AA‐1.13%
Debt Rating Profile (% of Debt)
Yes Bank Limited 1.52%
Wipro Ltd 1.48%
Grasim Industries Ltd. 1.28%
Power Finance Corporation Limited 1.08%
Others (with < 1% exposure) 9.53%
Debt 24.65%
Gilts & SDL 9.01%
GOI 8.06%
SDL (with < 1% exposure) 0.95%
Corporate Bonds 15.64%
RURAL ELECTRIFICATION CORPORATION L 1.97%
POWER FINANCE CORPORATION LTD. 1.96%
POWER GRID CORPORATION OF INDIA LTD 1.88%
Others (with < 1% exposure) 9.83%
MM & Others 5.30%
Total 100.00%
`
Fund returns vis a vis Benchmark 1 Month 3 Month 6 Month 1 Year 2 Year 3 Year Since InceptionApex Growth Fund 5.10% 5.01% 12.40% 39.46% 20.24% 18.02% 11.46%Benchmark 4.98% 5.51% 12.46% 35.40% 17.51% 16.40% 10.39%
23.32%
14.03%
11.55%
6.67%
5.56%
4.57%
3.13%
2.65%
2.54%
2.24%
Financial & Insurance Activities
Infrastructure
Computer programming, consultancy and related activities
Manufacture of coke and refined petroleum products
Manufacture of motor vehicles, trailers and semi‐trailers
Civil engineering
Manufacture of pharmaceuticals,medicinal chemical and …
Manufacture of chemicals and chemical products
Manufacture of Basic Metals
Manufacture of tobacco products
Top 10 Industry Exposure ( % to AUM)
< 1 year 1‐3 years 3‐5 years 5‐10 years > 10 years
4.92% 6.17%
14.42%
53.72%
20.77%
Debt Maturity Profile ( % of Debt)
Debt24.65%
Equity70.05%
MM & Others5.30%
Asset Allocation (% to AUM)
Gilt36.56%
AAA48.56%
AA+10.44%
AA3.30%
AA‐1.13%
Debt Rating Profile (% of Debt)
Modified Duration ‐ 4.22 yrs
9.5
10.5
11.5
12.5
13.5
14.5
15.5
16.5
17.5
18.5
Jan‐10
Apr‐10
Jul‐10
Oct‐10
Jan‐11
Apr‐11
Jul‐11
Oct‐11
Jan‐12
Apr‐12
Jul‐12
Oct‐12
Jan‐13
Apr‐13
Jul‐13
Oct‐13
Jan‐14
Apr‐14
Jul‐14
Oct‐14
Jan‐15
NAV/U
NIT (Rs)
NAV Performance (Since Inception)
NAV Benchmark
Investment Objective :
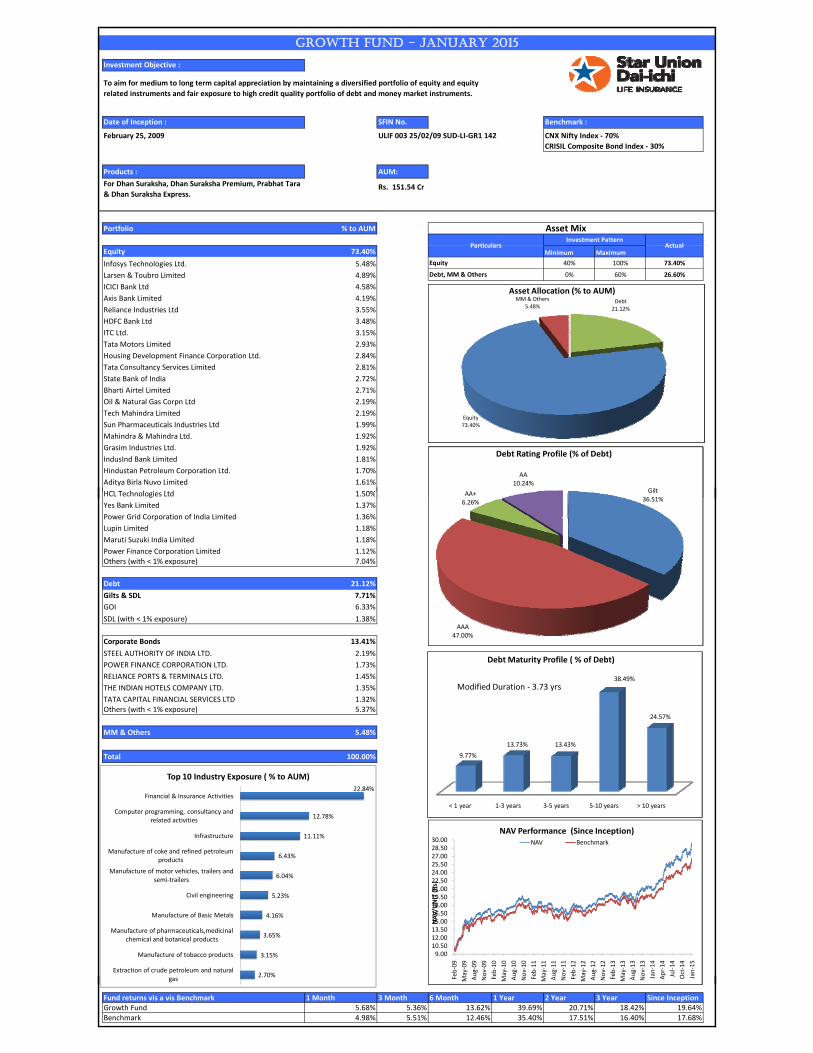
Date of Inception : SFIN No.
February 25, 2009 ULIF 003 25/02/09 SUD‐LI‐GR1 142
Products : AUM:
Rs. 151.54 Cr
Portfolio % to AUM
`
Equity 73.40% Minimum Maximum
Infosys Technologies Ltd. 5.48% 40% 100% 73.40%
Larsen & Toubro Limited 4.89% 0% 60% 26.60%
ICICI Bank Ltd 4.58%
Axis Bank Limited 4.19%
Reliance Industries Ltd 3.55%
HDFC Bank Ltd 3.48%
ITC Ltd. 3.15%
Tata Motors Limited 2.93%
Housing Development Finance Corporation Ltd. 2.84%
Tata Consultancy Services Limited 2.81%
State Bank of India 2.72%
Bharti Airtel Limited 2.71%
Oil & Natural Gas Corpn Ltd 2.19%
Tech Mahindra Limited 2.19%
Sun Pharmaceuticals Industries Ltd 1.99%
Mahindra & Mahindra Ltd. 1.92%
Grasim Industries Ltd. 1.92%
IndusInd Bank Limited 1.81%
Hindustan Petroleum Corporation Ltd. 1.70%
Aditya Birla Nuvo Limited 1.61%
HCL Technologies Ltd 1 50%
Equity
Debt, MM & Others
To aim for medium to long term capital appreciation by maintaining a diversified portfolio of equity and equity
related instruments and fair exposure to high credit quality portfolio of debt and money market instruments.
Investment PatternActual
Asset Mix
Particulars
For Dhan Suraksha, Dhan Suraksha Premium, Prabhat Tara
& Dhan Suraksha Express.
Benchmark :
CNX Nifty Index ‐ 70%
CRISIL Composite Bond Index ‐ 30%
GROWTH FUND - JANUARY 2015
Gilt36 51%
AA+
AA10.24%
Debt Rating Profile (% of Debt)
Debt21.12%
Equity73.40%
MM & Others5.48%
Asset Allocation (% to AUM)
HCL Technologies Ltd 1.50%
Yes Bank Limited 1.37%
Power Grid Corporation of India Limited 1.36%
Lupin Limited 1.18%
Maruti Suzuki India Limited 1.18%
Power Finance Corporation Limited 1.12%Others (with < 1% exposure) 7.04%
Debt 21.12%
Gilts & SDL 7.71%
GOI 6.33%
SDL (with < 1% exposure) 1.38%
Corporate Bonds 13.41%
STEEL AUTHORITY OF INDIA LTD. 2.19%
POWER FINANCE CORPORATION LTD. 1.73%
RELIANCE PORTS & TERMINALS LTD. 1.45%
THE INDIAN HOTELS COMPANY LTD. 1.35%
TATA CAPITAL FINANCIAL SERVICES LTD 1.32%Others (with < 1% exposure) 5.37%
MM & Others 5.48%
Total 100.00%
`
22.84%
12.78%
11.11%
6.43%
6.04%
5.23%
4.16%
3.65%
3.15%
2.70%
Financial & Insurance Activities
Computer programming, consultancy and related activities
Infrastructure
Manufacture of coke and refined petroleum products
Manufacture of motor vehicles, trailers and semi‐trailers
Civil engineering
Manufacture of Basic Metals
Manufacture of pharmaceuticals,medicinal chemical and botanical products
Manufacture of tobacco products
Extraction of crude petroleum and natural gas
Top 10 Industry Exposure ( % to AUM)
< 1 year 1‐3 years 3‐5 years 5‐10 years > 10 years
9.77%
13.73% 13.43%
38.49%
24.57%
Debt Maturity Profile ( % of Debt)
Gilt36.51%
AAA47.00%
AA+6.26%
AA10.24%
Debt Rating Profile (% of Debt)
9.0010.5012.0013.5015.0016.5018.0019.5021.0022.5024.0025.5027.0028.5030.00
Feb‐09
May‐09
Aug‐09
Nov‐09
Feb‐10
May‐10
Aug‐10
Nov‐10
Feb‐11
May‐11
Aug‐11
Nov‐11
Feb‐12
May‐12
Aug‐12
Nov‐12
Feb‐13
May‐13
Aug‐13
Nov‐13
Jan‐14
Apr‐14
Jul‐14
Oct‐14
Jan‐15
NAV/U
NIT (Rs)
NAV Performance (Since Inception)NAV Benchmark
Debt21.12%
Equity73.40%
MM & Others5.48%
Asset Allocation (% to AUM)
Modified Duration ‐ 3.73 yrs
Fund returns vis a vis Benchmark 1 Month 3 Month 6 Month 1 Year 2 Year 3 Year Since InceptionGrowth Fund 5.68% 5.36% 13.62% 39.69% 20.71% 18.42% 19.64%Benchmark 4.98% 5.51% 12.46% 35.40% 17.51% 16.40% 17.68%
22.84%
12.78%
11.11%
6.43%
6.04%
5.23%
4.16%
3.65%
3.15%
2.70%
Financial & Insurance Activities
Computer programming, consultancy and related activities
Infrastructure
Manufacture of coke and refined petroleum products
Manufacture of motor vehicles, trailers and semi‐trailers
Civil engineering
Manufacture of Basic Metals
Manufacture of pharmaceuticals,medicinal chemical and botanical products
Manufacture of tobacco products
Extraction of crude petroleum and natural gas
Top 10 Industry Exposure ( % to AUM)
< 1 year 1‐3 years 3‐5 years 5‐10 years > 10 years
9.77%
13.73% 13.43%
38.49%
24.57%
Debt Maturity Profile ( % of Debt)
Gilt36.51%
AAA47.00%
AA+6.26%
AA10.24%
Debt Rating Profile (% of Debt)
9.0010.5012.0013.5015.0016.5018.0019.5021.0022.5024.0025.5027.0028.5030.00
Feb‐09
May‐09
Aug‐09
Nov‐09
Feb‐10
May‐10
Aug‐10
Nov‐10
Feb‐11
May‐11
Aug‐11
Nov‐11
Feb‐12
May‐12
Aug‐12
Nov‐12
Feb‐13
May‐13
Aug‐13
Nov‐13
Jan‐14
Apr‐14
Jul‐14
Oct‐14
Jan‐15
NAV/U
NIT (Rs)
NAV Performance (Since Inception)NAV Benchmark
Debt21.12%
Equity73.40%
MM & Others5.48%
Asset Allocation (% to AUM)
Modified Duration ‐ 3.73 yrs
Investment Objective :
Date of Inception : SFIN No.
January 20, 2010 ULIF 014 20/01/10 SUD‐PA‐GR1 142
Products : AUM :
Rs. 109.29 Cr
Portfolio % to AUM
`
Equity 72.00% Minimum Maximum
Infosys Technologies Ltd. 5.35% 55% 85% 72.00%
Larsen & Toubro Limited 5.26% 15% 45% 28.00%
HDFC Bank Ltd 4.27%
ICICI Bank Ltd 4.18%
Reliance Industries Ltd 3.88%
Axis Bank Limited 3.58%
State Bank of India 2.98%
Tata Motors Limited 2.98%
ITC Ltd. 2.90%
Tata Consultancy Services Limited 2.71%
Housing Development Finance Corporation Ltd. 2.39%
Bharti Airtel Limited 2.17%
Oil & Natural Gas Corpn Ltd 2.02%
Grasim Industries Ltd. 1.98%
Sun Pharmaceuticals Industries Ltd 1.97%
Mahindra & Mahindra Ltd. 1.96%
Tech Mahindra Limited 1.83%
Lupin Limited 1.74%
Yes Bank Limited 1.74%
HCL Technologies Ltd 1.72%
id i f di i i d %
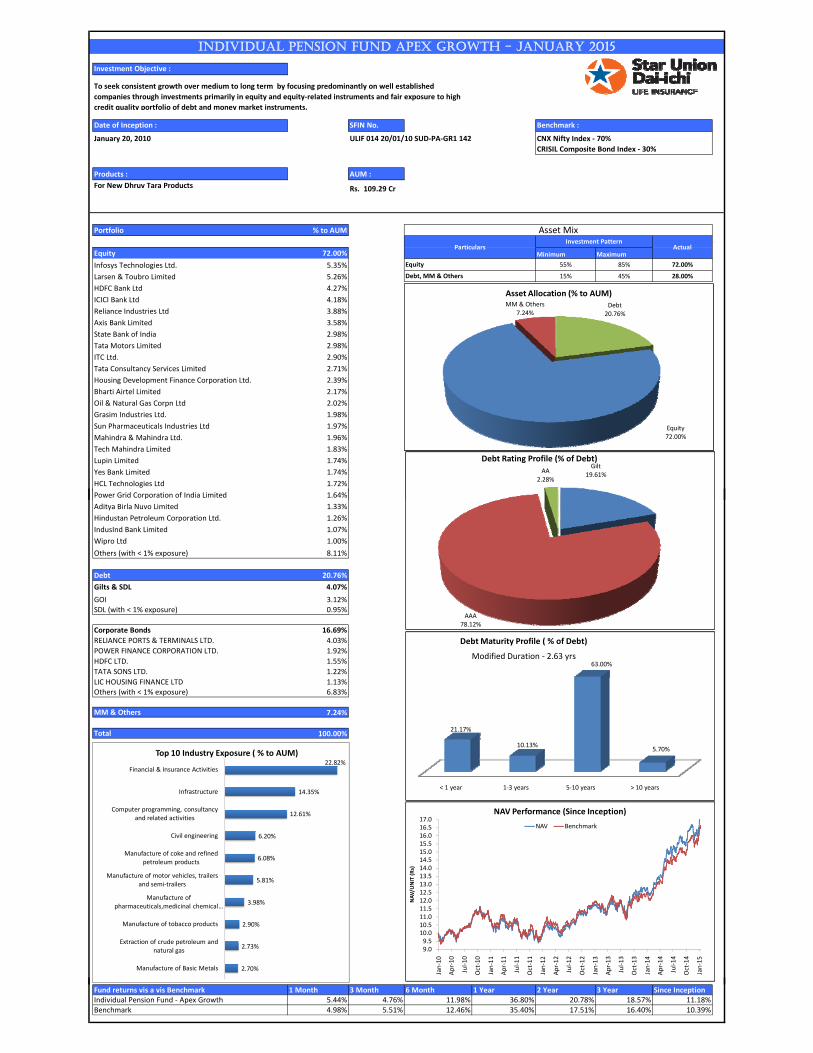
INDIVIDUAL PENSION FUND APEX GROWTH - JANUARY 2015
Equity
For New Dhruv Tara Products
Debt, MM & Others
To seek consistent growth over medium to long term by focusing predominantly on well established
companies through investments primarily in equity and equity‐related instruments and fair exposure to high
credit quality portfolio of debt and money market instruments.
Asset Mix
ParticularsInvestment Pattern
Actual
Benchmark :
CNX Nifty Index ‐ 70%
CRISIL Composite Bond Index ‐ 30%
Debt20.76%
Equity72.00%
MM & Others7.24%
Asset Allocation (% to AUM)
Gilt19.61%
AA2.28%
Debt Rating Profile (% of Debt)
Power Grid Corporation of India Limited 1.64%
Aditya Birla Nuvo Limited 1.33%
Hindustan Petroleum Corporation Ltd. 1.26%
IndusInd Bank Limited 1.07%
Wipro Ltd 1.00%
Others (with < 1% exposure) 8.11%
Debt 20.76%
Gilts & SDL 4.07%
GOI 3.12%SDL (with < 1% exposure) 0.95%
Corporate Bonds 16.69%
RELIANCE PORTS & TERMINALS LTD. 4.03%
POWER FINANCE CORPORATION LTD. 1.92%
HDFC LTD. 1.55%
TATA SONS LTD. 1.22%
LIC HOUSING FINANCE LTD 1.13%Others (with < 1% exposure) 6.83%
MM & Others 7.24%
Total 100.00%
`
22.82%
14.35%
12.61%
6.20%
6.08%
5.81%
3.98%
2.90%
2.73%
2.70%
Financial & Insurance Activities
Infrastructure
Computer programming, consultancy and related activities
Civil engineering
Manufacture of coke and refined petroleum products
Manufacture of motor vehicles, trailers and semi‐trailers
Manufacture of pharmaceuticals,medicinal chemical …
Manufacture of tobacco products
Extraction of crude petroleum and natural gas
Manufacture of Basic Metals
Top 10 Industry Exposure ( % to AUM)
< 1 year 1‐3 years 5‐10 years > 10 years
21.17%
10.13%
63.00%
5.70%
Debt Maturity Profile ( % of Debt)
Debt20.76%
Equity72.00%
MM & Others7.24%
Asset Allocation (% to AUM)
Gilt19.61%
AAA78.12%
AA2.28%
Debt Rating Profile (% of Debt)
9.09.510.010.511.011.512.012.513.013.514.014.515.015.516.016.517.0
Jan‐10
Apr‐10
Jul‐10
Oct‐10
Jan‐11
Apr‐11
Jul‐11
Oct‐11
Jan‐12
Apr‐12
Jul‐12
Oct‐12
Jan‐13
Apr‐13
Jul‐13
Oct‐13
Jan‐14
Apr‐14
Jul‐14
Oct‐14
Jan‐15
NAV/U
NIT (Rs)
NAV Performance (Since Inception)
NAV Benchmark
Modified Duration ‐ 2.63 yrs
Fund returns vis a vis Benchmark 1 Month 3 Month 6 Month 1 Year 2 Year 3 Year Since InceptionIndividual Pension Fund ‐ Apex Growth 5.44% 4.76% 11.98% 36.80% 20.78% 18.57% 11.18%Benchmark 4.98% 5.51% 12.46% 35.40% 17.51% 16.40% 10.39%
22.82%
14.35%
12.61%
6.20%
6.08%
5.81%
3.98%
2.90%
2.73%
2.70%
Financial & Insurance Activities
Infrastructure
Computer programming, consultancy and related activities
Civil engineering
Manufacture of coke and refined petroleum products
Manufacture of motor vehicles, trailers and semi‐trailers
Manufacture of pharmaceuticals,medicinal chemical …
Manufacture of tobacco products
Extraction of crude petroleum and natural gas
Manufacture of Basic Metals
Top 10 Industry Exposure ( % to AUM)
< 1 year 1‐3 years 5‐10 years > 10 years
21.17%
10.13%
63.00%
5.70%
Debt Maturity Profile ( % of Debt)
Debt20.76%
Equity72.00%
MM & Others7.24%
Asset Allocation (% to AUM)
Gilt19.61%
AAA78.12%
AA2.28%
Debt Rating Profile (% of Debt)
9.09.510.010.511.011.512.012.513.013.514.014.515.015.516.016.517.0
Jan‐10
Apr‐10
Jul‐10
Oct‐10
Jan‐11
Apr‐11
Jul‐11
Oct‐11
Jan‐12
Apr‐12
Jul‐12
Oct‐12
Jan‐13
Apr‐13
Jul‐13
Oct‐13
Jan‐14
Apr‐14
Jul‐14
Oct‐14
Jan‐15
NAV/U
NIT (Rs)
NAV Performance (Since Inception)
NAV Benchmark
Modified Duration ‐ 2.63 yrs
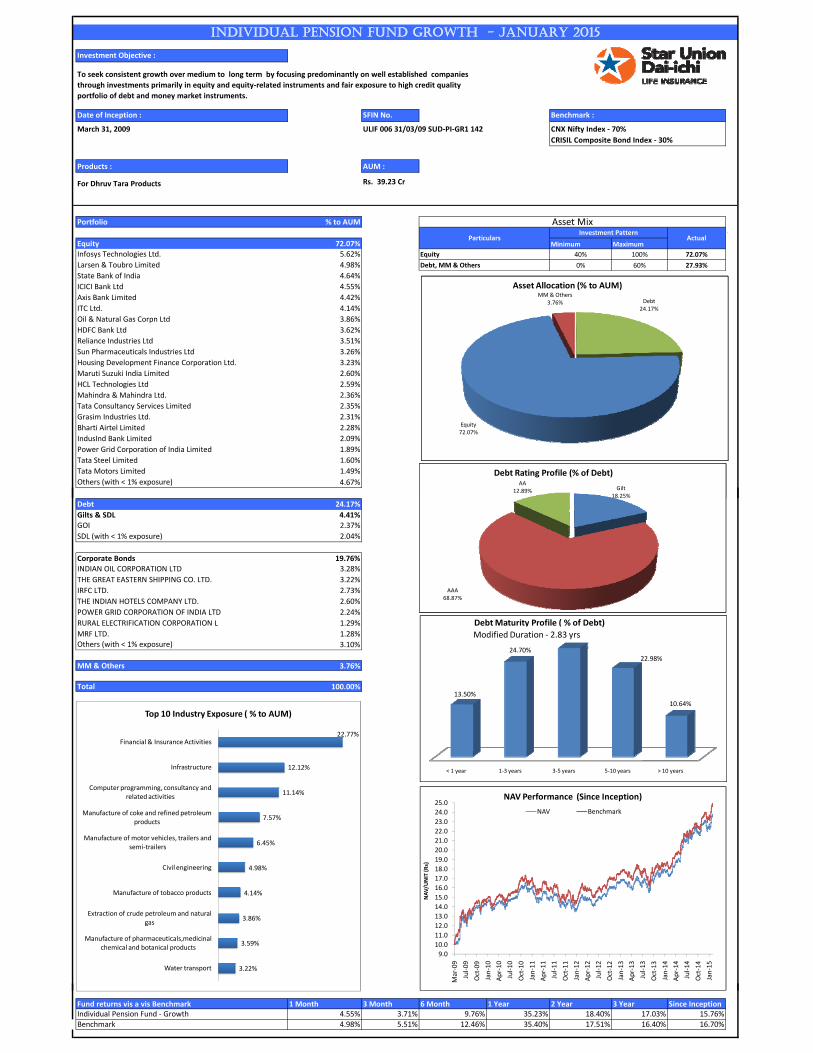
Investment Objective :
Date of Inception : SFIN No.
March 31, 2009 ULIF 006 31/03/09 SUD‐PI‐GR1 142
Products : AUM :
Rs. 39.23 Cr
Portfolio % to AUM
`
Equity 72.07% Minimum Maximum
Infosys Technologies Ltd. 5.62% 40% 100% 72.07%
Larsen & Toubro Limited 4.98% 0% 60% 27.93%
State Bank of India 4.64%
ICICI Bank Ltd 4.55%
Axis Bank Limited 4.42%
ITC Ltd. 4.14%
Oil & Natural Gas Corpn Ltd 3.86%
HDFC Bank Ltd 3.62%
Reliance Industries Ltd 3.51%
Sun Pharmaceuticals Industries Ltd 3.26%
Housing Development Finance Corporation Ltd. 3.23%
Maruti Suzuki India Limited 2.60%
HCL Technologies Ltd 2.59%
Mahindra & Mahindra Ltd. 2.36%
Tata Consultancy Services Limited 2.35%
Grasim Industries Ltd. 2.31%
Bharti Airtel Limited 2.28%
IndusInd Bank Limited 2.09%
Power Grid Corporation of India Limited 1.89%
Tata Steel Limited 1.60%
Tata Motors Limited 1.49%
Others (with < 1% exposure) 4.67%
To seek consistent growth over medium to long term by focusing predominantly on well established companies
through investments primarily in equity and equity‐related instruments and fair exposure to high credit quality
portfolio of debt and money market instruments.
Asset Mix
For Dhruv Tara Products
Benchmark :
CNX Nifty Index ‐ 70%
CRISIL Composite Bond Index ‐ 30%
INDIVIDUAL PENSION FUND GROWTH - JANUARY 2015
Equity
Debt, MM & Others
ParticularsInvestment Pattern
Actual
Gilt18.25%
AA12.89%
Debt Rating Profile (% of Debt)
Debt24.17%
Equity72.07%
MM & Others3.76%
Asset Allocation (% to AUM)
Debt 24.17%
Gilts & SDL 4.41%GOI 2.37%
SDL (with < 1% exposure) 2.04%
Corporate Bonds 19.76%INDIAN OIL CORPORATION LTD 3.28%
THE GREAT EASTERN SHIPPING CO. LTD. 3.22%
IRFC LTD. 2.73%
THE INDIAN HOTELS COMPANY LTD. 2.60%
POWER GRID CORPORATION OF INDIA LTD 2.24%
RURAL ELECTRIFICATION CORPORATION L 1.29%
MRF LTD. 1.28%Others (with < 1% exposure) 3.10%
MM & Others 3.76%
Total 100.00%
`
22.77%
12.12%
11.14%
7.57%
6.45%
4.98%
4.14%
3.86%
3.59%
3.22%
Financial & Insurance Activities
Infrastructure
Computer programming, consultancy and related activities
Manufacture of coke and refined petroleum products
Manufacture of motor vehicles, trailers and semi‐trailers
Civil engineering
Manufacture of tobacco products
Extraction of crude petroleum and natural gas
Manufacture of pharmaceuticals,medicinal chemical and botanical products
Water transport
Top 10 Industry Exposure ( % to AUM)
< 1 year 1‐3 years 3‐5 years 5‐10 years > 10 years
13.50%
24.70%
28.19%
22.98%
10.64%
Debt Maturity Profile ( % of Debt)
Gilt18.25%
AAA68.87%
AA12.89%
Debt Rating Profile (% of Debt)
9.0
10.0
11.0
12.0
13.0
14.0
15.0
16.0
17.0
18.0
19.0
20.0
21.0
22.0
23.0
24.0
25.0
Mar‐09
Jul‐09
Oct‐09
Jan‐10
Apr‐10
Jul‐10
Oct‐10
Jan‐11
Apr‐11
Jul‐11
Oct‐11
Jan‐12
Apr‐12
Jul‐12
Oct‐12
Jan‐13
Apr‐13
Jul‐13
Oct‐13
Jan‐14
Apr‐14
Jul‐14
Oct‐14
Jan‐15
NAV/U
NIT (Rs)
NAV Performance (Since Inception)
NAV Benchmark
Debt24.17%
Equity72.07%
MM & Others3.76%
Asset Allocation (% to AUM)
Modified Duration ‐ 2.83 yrs
Fund returns vis a vis Benchmark 1 Month 3 Month 6 Month 1 Year 2 Year 3 Year Since InceptionIndividual Pension Fund ‐ Growth 4.55% 3.71% 9.76% 35.23% 18.40% 17.03% 15.76%Benchmark 4.98% 5.51% 12.46% 35.40% 17.51% 16.40% 16.70%
22.77%
12.12%
11.14%
7.57%
6.45%
4.98%
4.14%
3.86%
3.59%
3.22%
Financial & Insurance Activities
Infrastructure
Computer programming, consultancy and related activities
Manufacture of coke and refined petroleum products
Manufacture of motor vehicles, trailers and semi‐trailers
Civil engineering
Manufacture of tobacco products
Extraction of crude petroleum and natural gas
Manufacture of pharmaceuticals,medicinal chemical and botanical products
Water transport
Top 10 Industry Exposure ( % to AUM)
< 1 year 1‐3 years 3‐5 years 5‐10 years > 10 years
13.50%
24.70%
28.19%
22.98%
10.64%
Debt Maturity Profile ( % of Debt)
Gilt18.25%
AAA68.87%
AA12.89%
Debt Rating Profile (% of Debt)
9.0
10.0
11.0
12.0
13.0
14.0
15.0
16.0
17.0
18.0
19.0
20.0
21.0
22.0
23.0
24.0
25.0
Mar‐09
Jul‐09
Oct‐09
Jan‐10
Apr‐10
Jul‐10
Oct‐10
Jan‐11
Apr‐11
Jul‐11
Oct‐11
Jan‐12
Apr‐12
Jul‐12
Oct‐12
Jan‐13
Apr‐13
Jul‐13
Oct‐13
Jan‐14
Apr‐14
Jul‐14
Oct‐14
Jan‐15
NAV/U
NIT (Rs)
NAV Performance (Since Inception)
NAV Benchmark
Debt24.17%
Equity72.07%
MM & Others3.76%
Asset Allocation (% to AUM)
Modified Duration ‐ 2.83 yrs
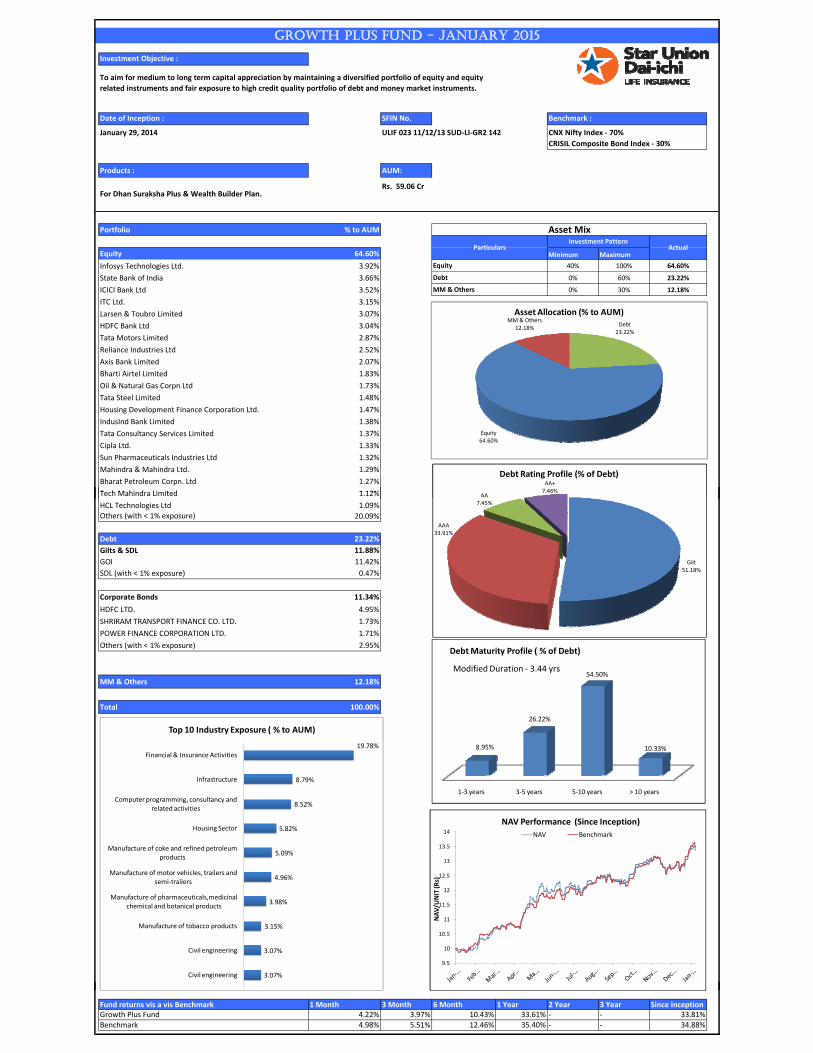
Investment Objective :
Date of Inception : SFIN No.
January 29, 2014 ULIF 023 11/12/13 SUD‐LI‐GR2 142
Products : AUM:
Rs. 59.06 Cr
Portfolio % to AUM
`
Equity 64.60% Minimum Maximum
Infosys Technologies Ltd. 3.92% 40% 100% 64.60%
State Bank of India 3.66% 0% 60% 23.22%
ICICI Bank Ltd 3.52% 0% 30% 12.18%
ITC Ltd. 3.15%
Larsen & Toubro Limited 3.07%
HDFC Bank Ltd 3.04%
Tata Motors Limited 2.87%
Reliance Industries Ltd 2.52%
Axis Bank Limited 2.07%
Bharti Airtel Limited 1.83%
Oil & Natural Gas Corpn Ltd 1.73%
Tata Steel Limited 1.48%
Housing Development Finance Corporation Ltd. 1.47%
IndusInd Bank Limited 1.38%
Tata Consultancy Services Limited 1.37%
Cipla Ltd. 1.33%
Sun Pharmaceuticals Industries Ltd 1.32%
Mahindra & Mahindra Ltd. 1.29%
Bharat Petroleum Corpn. Ltd 1.27%
Tech Mahindra Limited 1 12%
Benchmark :
To aim for medium to long term capital appreciation by maintaining a diversified portfolio of equity and equity
related instruments and fair exposure to high credit quality portfolio of debt and money market instruments.
GROWTH PLUS FUND - JANUARY 2015
For Dhan Suraksha Plus & Wealth Builder Plan.
Asset Mix
ParticularsInvestment Pattern
Actual
MM & Others
Equity
Debt
CNX Nifty Index ‐ 70%
CRISIL Composite Bond Index ‐ 30%
AA
AA+7.46%
Debt Rating Profile (% of Debt)
Debt23.22%
Equity64.60%
MM & Others12.18%
Asset Allocation (% to AUM)
Tech Mahindra Limited 1.12%
HCL Technologies Ltd 1.09%Others (with < 1% exposure) 20.09%
Debt 23.22%
Gilts & SDL 11.88%
GOI 11.42%
SDL (with < 1% exposure) 0.47%
Corporate Bonds 11.34%
HDFC LTD. 4.95%
SHRIRAM TRANSPORT FINANCE CO. LTD. 1.73%
POWER FINANCE CORPORATION LTD. 1.71%
Others (with < 1% exposure) 2.95%
MM & Others 12.18%
Total 100.00%
`
19.78%
8.79%
8.52%
5.82%
5.09%
4.96%
3.98%
3.15%
3.07%
3.07%
Financial & Insurance Activities
Infrastructure
Computer programming, consultancy and related activities
Housing Sector
Manufacture of coke and refined petroleum products
Manufacture of motor vehicles, trailers and semi‐trailers
Manufacture of pharmaceuticals,medicinal chemical and botanical products
Manufacture of tobacco products
Civil engineering
Civil engineering
Top 10 Industry Exposure ( % to AUM)
1‐3 years 3‐5 years 5‐10 years > 10 years
8.95%
26.22%
54.50%
10.33%
Debt Maturity Profile ( % of Debt)
Modified Duration ‐ 3.44 yrs
Gilt51.18%
AAA33.91%
AA7.45%
AA+7.46%
Debt Rating Profile (% of Debt)
9.5
10
10.5
11
11.5
12
12.5
13
13.5
14
NAV/U
NIT (R
s)
NAV Performance (Since Inception)
NAV Benchmark
Debt23.22%
Equity64.60%
MM & Others12.18%
Asset Allocation (% to AUM)
Fund returns vis a vis Benchmark 1 Month 3 Month 6 Month 1 Year 2 Year 3 Year Since InceptionGrowth Plus Fund 4.22% 3.97% 10.43% 33.61% ‐ ‐ 33.81%Benchmark 4.98% 5.51% 12.46% 35.40% ‐ ‐ 34.88%
19.78%
8.79%
8.52%
5.82%
5.09%
4.96%
3.98%
3.15%
3.07%
3.07%
Financial & Insurance Activities
Infrastructure
Computer programming, consultancy and related activities
Housing Sector
Manufacture of coke and refined petroleum products
Manufacture of motor vehicles, trailers and semi‐trailers
Manufacture of pharmaceuticals,medicinal chemical and botanical products
Manufacture of tobacco products
Civil engineering
Civil engineering
Top 10 Industry Exposure ( % to AUM)
1‐3 years 3‐5 years 5‐10 years > 10 years
8.95%
26.22%
54.50%
10.33%
Debt Maturity Profile ( % of Debt)
Modified Duration ‐ 3.44 yrs
Gilt51.18%
AAA33.91%
AA7.45%
AA+7.46%
Debt Rating Profile (% of Debt)
9.5
10
10.5
11
11.5
12
12.5
13
13.5
14
NAV/U
NIT (R
s)
NAV Performance (Since Inception)
NAV Benchmark
Debt23.22%
Equity64.60%
MM & Others12.18%
Asset Allocation (% to AUM)
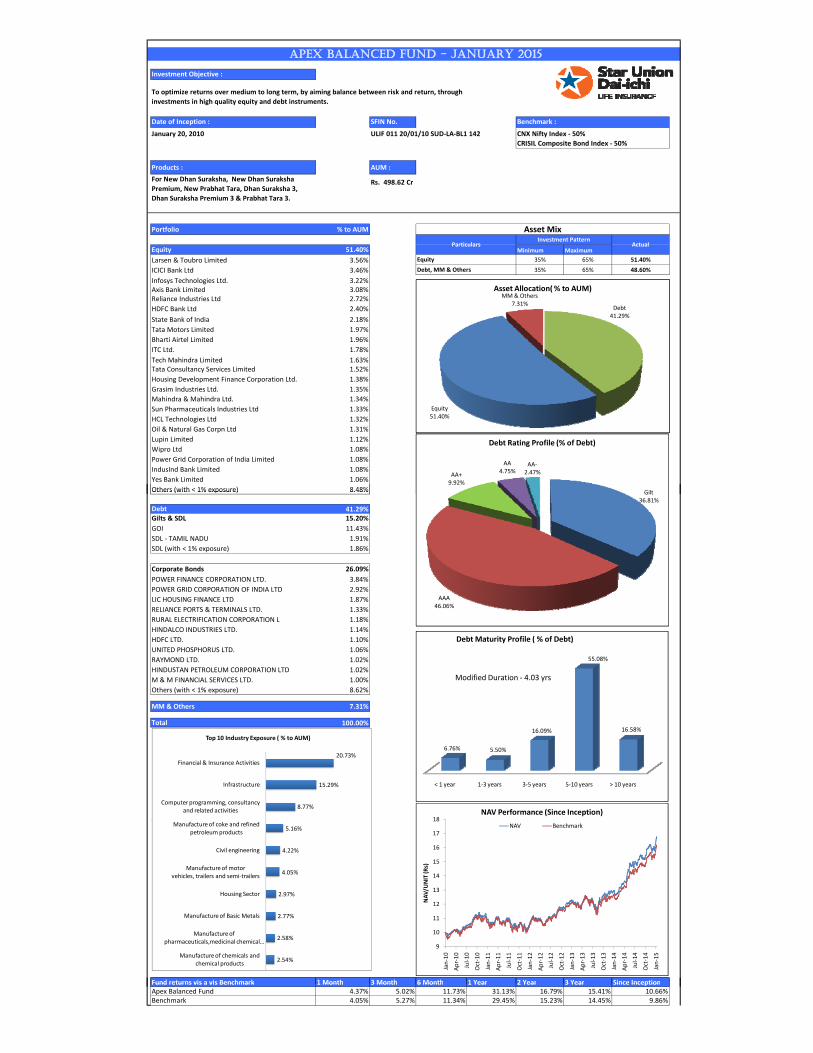
Investment Objective :
Date of Inception : SFIN No.
January 20, 2010 ULIF 011 20/01/10 SUD‐LA‐BL1 142
Products : AUM :
Rs. 498.62 Cr
Portfolio % to AUM
`
Equity 51.40% Minimum Maximum
Larsen & Toubro Limited 3.56% 35% 65% 51.40%
ICICI Bank Ltd 3.46% 35% 65% 48.60%
Infosys Technologies Ltd. 3.22%Axis Bank Limited 3.08%Reliance Industries Ltd 2.72%
HDFC Bank Ltd 2.40%
State Bank of India 2.18%
Tata Motors Limited 1.97%
Bharti Airtel Limited 1.96%
ITC Ltd. 1.78%
Tech Mahindra Limited 1.63%Tata Consultancy Services Limited 1.52%
Housing Development Finance Corporation Ltd. 1.38%
Grasim Industries Ltd. 1.35%
Mahindra & Mahindra Ltd. 1.34%
Sun Pharmaceuticals Industries Ltd 1.33%
HCL Technologies Ltd 1.32%
Oil & Natural Gas Corpn Ltd 1.31%
Lupin Limited 1.12%
Wipro Ltd 1.08%
Power Grid Corporation of India Limited 1.08%
IndusInd Bank Limited 1.08%
Yes Bank Limited 1.06%
Others (with < 1% exposure) 8.48%
Investment PatternActual
Asset Mix
Particulars
APEX BALANCED FUND - JANUARY 2015
Equity
Debt, MM & Others
To optimize returns over medium to long term, by aiming balance between risk and return, through
investments in high quality equity and debt instruments.
For New Dhan Suraksha, New Dhan Suraksha
Premium, New Prabhat Tara, Dhan Suraksha 3,
Dhan Suraksha Premium 3 & Prabhat Tara 3.
Benchmark :
CNX Nifty Index ‐ 50%
CRISIL Composite Bond Index ‐ 50%
Debt41.29%
Equity51.40%
MM & Others7.31%
Asset Allocation( % to AUM)
Gilt
AA+9.92%
AA4.75%
AA‐2.47%
Debt Rating Profile (% of Debt)
Others (with 1% exposure) 8.48%
Debt 41.29%Gilts & SDL 15.20%
GOI 11.43%
SDL ‐ TAMIL NADU 1.91%
SDL (with < 1% exposure) 1.86%
Corporate Bonds 26.09%
POWER FINANCE CORPORATION LTD. 3.84%
POWER GRID CORPORATION OF INDIA LTD 2.92%
LIC HOUSING FINANCE LTD 1.87%
RELIANCE PORTS & TERMINALS LTD. 1.33%
RURAL ELECTRIFICATION CORPORATION L 1.18%
HINDALCO INDUSTRIES LTD. 1.14%
HDFC LTD. 1.10%
UNITED PHOSPHORUS LTD. 1.06%
RAYMOND LTD. 1.02%
HINDUSTAN PETROLEUM CORPORATION LTD 1.02%
M & M FINANCIAL SERVICES LTD. 1.00%
Others (with < 1% exposure) 8.62%
MM & Others 7.31%
Total 100.00%
`
Fund returns vis a vis Benchmark 1 Month 3 Month 6 Month 1 Year 2 Year 3 Year Since Inception
20.73%
15.29%
8.77%
5.16%
4.22%
4.05%
2.97%
2.77%
2.58%
2.54%
Financial & Insurance Activities
Infrastructure
Computer programming, consultancy and related activities
Manufacture of coke and refined petroleum products
Civil engineering
Manufacture of motor vehicles, trailers and semi‐trailers
Housing Sector
Manufacture of Basic Metals
Manufacture of pharmaceuticals,medicinal chemical …
Manufacture of chemicals and chemical products
Top 10 Industry Exposure ( % to AUM)
< 1 year 1‐3 years 3‐5 years 5‐10 years > 10 years
6.76% 5.50%
16.09%
55.08%
16.58%
Debt Maturity Profile ( % of Debt)
Debt41.29%
Equity51.40%
MM & Others7.31%
Asset Allocation( % to AUM)
Gilt36.81%
AAA46.06%
AA+9.92%
AA4.75%
AA‐2.47%
Debt Rating Profile (% of Debt)
9
10
11
12
13
14
15
16
17
18
Jan‐10
Apr‐10
Jul‐10
Oct‐10
Jan‐11
Apr‐11
Jul‐11
Oct‐11
Jan‐12
Apr‐12
Jul‐12
Oct‐12
Jan‐13
Apr‐13
Jul‐13
Oct‐13
Jan‐14
Apr‐14
Jul‐14
Oct‐14
Jan‐15
NAV/U
NIT (R
s)
NAV Performance (Since Inception)
NAV Benchmark
Modified Duration ‐ 4.03 yrs
Fund returns vis a vis Benchmark 1 Month 3 Month 6 Month 1 Year 2 Year 3 Year Since InceptionApex Balanced Fund 4.37% 5.02% 11.73% 31.13% 16.79% 15.41% 10.66%Benchmark 4.05% 5.27% 11.34% 29.45% 15.23% 14.45% 9.86%
20.73%
15.29%
8.77%
5.16%
4.22%
4.05%
2.97%
2.77%
2.58%
2.54%
Financial & Insurance Activities
Infrastructure
Computer programming, consultancy and related activities
Manufacture of coke and refined petroleum products
Civil engineering
Manufacture of motor vehicles, trailers and semi‐trailers
Housing Sector
Manufacture of Basic Metals
Manufacture of pharmaceuticals,medicinal chemical …
Manufacture of chemicals and chemical products
Top 10 Industry Exposure ( % to AUM)
< 1 year 1‐3 years 3‐5 years 5‐10 years > 10 years
6.76% 5.50%
16.09%
55.08%
16.58%
Debt Maturity Profile ( % of Debt)
Debt41.29%
Equity51.40%
MM & Others7.31%
Asset Allocation( % to AUM)
Gilt36.81%
AAA46.06%
AA+9.92%
AA4.75%
AA‐2.47%
Debt Rating Profile (% of Debt)
9
10
11
12
13
14
15
16
17
18
Jan‐10
Apr‐10
Jul‐10
Oct‐10
Jan‐11
Apr‐11
Jul‐11
Oct‐11
Jan‐12
Apr‐12
Jul‐12
Oct‐12
Jan‐13
Apr‐13
Jul‐13
Oct‐13
Jan‐14
Apr‐14
Jul‐14
Oct‐14
Jan‐15
NAV/U
NIT (R
s)
NAV Performance (Since Inception)
NAV Benchmark
Modified Duration ‐ 4.03 yrs
Investment Objective :
Date of Inception : SFIN No.
February 18, 2009 ULIF 001 18/02/09 SUD‐LI‐BL1 142
Products : AUM :
Rs. 35.93 Cr
Portfolio % to AUM
`
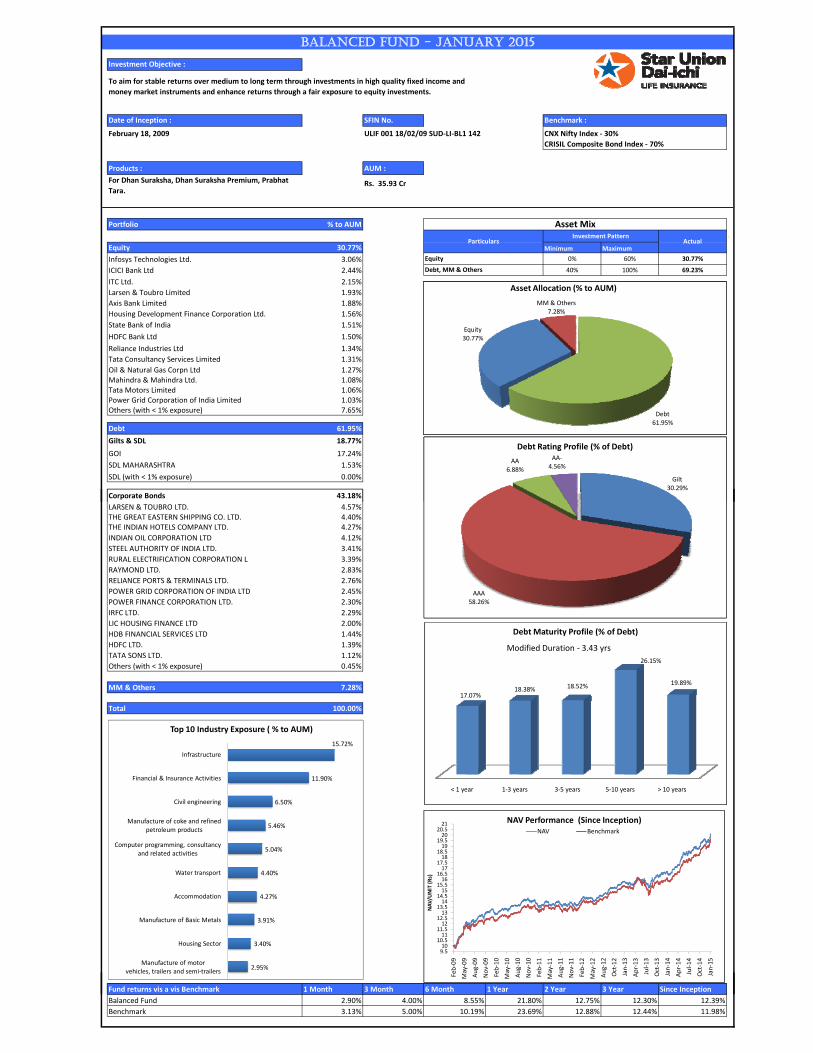
Equity 30.77% Minimum Maximum
Infosys Technologies Ltd. 3.06% 0% 60% 30.77%
ICICI Bank Ltd 2.44% 40% 100% 69.23%
ITC Ltd. 2.15%
Larsen & Toubro Limited 1.93%
Axis Bank Limited 1.88%
Housing Development Finance Corporation Ltd. 1.56%
State Bank of India 1.51%
HDFC Bank Ltd 1.50%
Reliance Industries Ltd 1.34%
Tata Consultancy Services Limited 1.31%
Oil & Natural Gas Corpn Ltd 1.27%Mahindra & Mahindra Ltd. 1.08%Tata Motors Limited 1.06%Power Grid Corporation of India Limited 1.03%Others (with < 1% exposure) 7.65%
Debt 61.95%
Gilts & SDL 18.77%
GOI 17.24%
SDL MAHARASHTRA 1.53%
SDL (with < 1% exposure) 0.00%
BALANCED FUND - JANUARY 2015
Equity
Debt, MM & Others
To aim for stable returns over medium to long term through investments in high quality fixed income and
money market instruments and enhance returns through a fair exposure to equity investments.
Investment PatternActual
Asset Mix
Particulars
For Dhan Suraksha, Dhan Suraksha Premium, Prabhat
Tara.
Benchmark :
CNX Nifty Index ‐ 30%
CRISIL Composite Bond Index ‐ 70%
Debt61.95%
Equity30.77%
MM & Others7.28%
Asset Allocation (% to AUM)
Gilt30.29%
AA6.88%
AA‐4.56%
Debt Rating Profile (% of Debt)
Corporate Bonds 43.18%
LARSEN & TOUBRO LTD. 4.57%THE GREAT EASTERN SHIPPING CO. LTD. 4.40%THE INDIAN HOTELS COMPANY LTD. 4.27%
INDIAN OIL CORPORATION LTD 4.12%
STEEL AUTHORITY OF INDIA LTD. 3.41%
RURAL ELECTRIFICATION CORPORATION L 3.39%
RAYMOND LTD. 2.83%
RELIANCE PORTS & TERMINALS LTD. 2.76%
POWER GRID CORPORATION OF INDIA LTD 2.45%
POWER FINANCE CORPORATION LTD. 2.30%
IRFC LTD. 2.29%
LIC HOUSING FINANCE LTD 2.00%
HDB FINANCIAL SERVICES LTD 1.44%
HDFC LTD. 1.39%
TATA SONS LTD. 1.12%
Others (with < 1% exposure) 0.45%
MM & Others 7.28%
Total 100.00%
`
15.72%
11.90%
6.50%
5.46%
5.04%
4.40%
4.27%
3.91%
3.40%
2.95%
Infrastructure
Financial & Insurance Activities
Civil engineering
Manufacture of coke and refined petroleum products
Computer programming, consultancy and related activities
Water transport
Accommodation
Manufacture of Basic Metals
Housing Sector
Manufacture of motor vehicles, trailers and semi‐trailers
Top 10 Industry Exposure ( % to AUM)
< 1 year 1‐3 years 3‐5 years 5‐10 years > 10 years
17.07%18.38% 18.52%
26.15%
19.89%
Debt Maturity Profile (% of Debt)
Debt61.95%
Equity30.77%
MM & Others7.28%
Asset Allocation (% to AUM)
Gilt30.29%
AAA58.26%
AA6.88%
AA‐4.56%
Debt Rating Profile (% of Debt)
9.510
10.511
11.512
12.513
13.514
14.515
15.516
16.517
17.518
18.519
19.520
20.521
Feb‐09
May‐09
Aug‐09
Nov‐09
Feb‐10
May‐10
Aug‐10
Nov‐10
Feb‐11
May‐11
Aug‐11
Nov‐11
Feb‐12
May‐12
Aug‐12
Oct‐12
Jan‐13
Apr‐13
Jul‐13
Oct‐13
Jan‐14
Apr‐14
Jul‐14
Oct‐14
Jan‐15
NAV/U
NIT (Rs)
NAV Performance (Since Inception)NAV Benchmark
Modified Duration ‐ 3.43 yrs
Fund returns vis a vis Benchmark 1 Month 3 Month 6 Month 1 Year 2 Year 3 Year Since Inception
Balanced Fund 2.90% 4.00% 8.55% 21.80% 12.75% 12.30% 12.39%
Benchmark 3.13% 5.00% 10.19% 23.69% 12.88% 12.44% 11.98%
15.72%
11.90%
6.50%
5.46%
5.04%
4.40%
4.27%
3.91%
3.40%
2.95%
Infrastructure
Financial & Insurance Activities
Civil engineering
Manufacture of coke and refined petroleum products
Computer programming, consultancy and related activities
Water transport
Accommodation
Manufacture of Basic Metals
Housing Sector
Manufacture of motor vehicles, trailers and semi‐trailers
Top 10 Industry Exposure ( % to AUM)
< 1 year 1‐3 years 3‐5 years 5‐10 years > 10 years
17.07%18.38% 18.52%
26.15%
19.89%
Debt Maturity Profile (% of Debt)
Debt61.95%
Equity30.77%
MM & Others7.28%
Asset Allocation (% to AUM)
Gilt30.29%
AAA58.26%
AA6.88%
AA‐4.56%
Debt Rating Profile (% of Debt)
9.510
10.511
11.512
12.513
13.514
14.515
15.516
16.517
17.518
18.519
19.520
20.521
Feb‐09
May‐09
Aug‐09
Nov‐09
Feb‐10
May‐10
Aug‐10
Nov‐10
Feb‐11
May‐11
Aug‐11
Nov‐11
Feb‐12
May‐12
Aug‐12
Oct‐12
Jan‐13
Apr‐13
Jul‐13
Oct‐13
Jan‐14
Apr‐14
Jul‐14
Oct‐14
Jan‐15
NAV/U
NIT (Rs)
NAV Performance (Since Inception)NAV Benchmark
Modified Duration ‐ 3.43 yrs
Investment Objective :
Date of Inception : SFIN No.
January 20, 2010 ULIF 015 20/01/10 SUD‐PA‐BL1 142
Products : AUM :
Rs. 47.93 Cr
Portfolio % to AUM
`
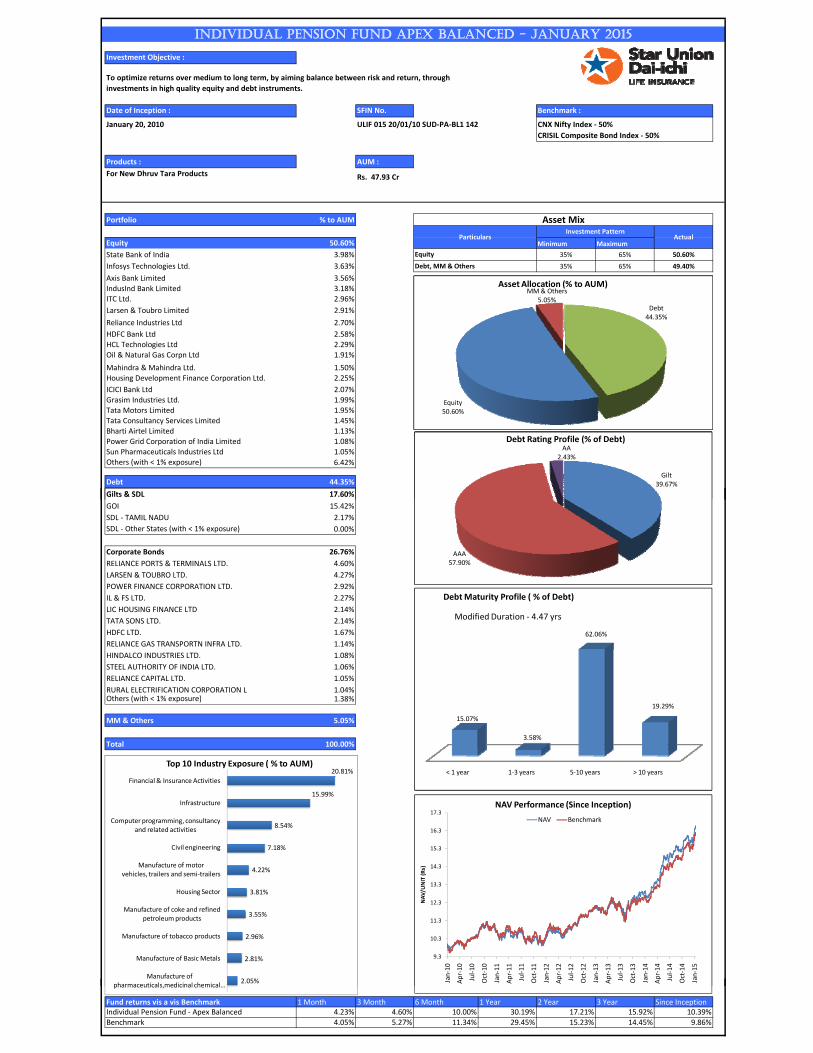
Equity 50.60% Minimum Maximum
State Bank of India 3.98% 35% 65% 50.60%
Infosys Technologies Ltd. 3.63% 35% 65% 49.40%
Axis Bank Limited 3.56%IndusInd Bank Limited 3.18%ITC Ltd. 2.96%
Larsen & Toubro Limited 2.91%
Reliance Industries Ltd 2.70%
HDFC Bank Ltd 2.58%HCL Technologies Ltd 2.29%Oil & Natural Gas Corpn Ltd 1.91%
Mahindra & Mahindra Ltd. 1.50%Housing Development Finance Corporation Ltd. 2.25%
ICICI Bank Ltd 2.07%Grasim Industries Ltd. 1.99%Tata Motors Limited 1.95%Tata Consultancy Services Limited 1.45%Bharti Airtel Limited 1.13%Power Grid Corporation of India Limited 1.08%Sun Pharmaceuticals Industries Ltd 1.05%Others (with < 1% exposure) 6.42%
Debt 44.35%
Gilt & SDL 17 60%
INDIVIDUAL PENSION FUND APEX BALANCED - JANUARY 2015
Equity
For New Dhruv Tara Products
Debt, MM & Others
To optimize returns over medium to long term, by aiming balance between risk and return, through
investments in high quality equity and debt instruments.
Asset Mix
ParticularsInvestment Pattern
Actual
Benchmark :
CNX Nifty Index ‐ 50%
CRISIL Composite Bond Index ‐ 50%
Gilt39.67%
AA2.43%
Debt Rating Profile (% of Debt)
Debt44.35%
Equity50.60%
MM & Others5.05%
Asset Allocation (% to AUM)
Gilts & SDL 17.60%
GOI 15.42%
SDL ‐ TAMIL NADU 2.17%
SDL ‐ Other States (with < 1% exposure) 0.00%
Corporate Bonds 26.76%
RELIANCE PORTS & TERMINALS LTD. 4.60%
LARSEN & TOUBRO LTD. 4.27%
POWER FINANCE CORPORATION LTD. 2.92%
IL & FS LTD. 2.27%
LIC HOUSING FINANCE LTD 2.14%
TATA SONS LTD. 2.14%
HDFC LTD. 1.67%
RELIANCE GAS TRANSPORTN INFRA LTD. 1.14%
HINDALCO INDUSTRIES LTD. 1.08%
STEEL AUTHORITY OF INDIA LTD. 1.06%
RELIANCE CAPITAL LTD. 1.05%
RURAL ELECTRIFICATION CORPORATION L 1.04%Others (with < 1% exposure) 1.38%
MM & Others 5.05%
Total 100.00%
`
20.81%
15.99%
8.54%
7.18%
4.22%
3.81%
3.55%
2.96%
2.81%
2.05%
Financial & Insurance Activities
Infrastructure
Computer programming, consultancy and related activities
Civil engineering
Manufacture of motor vehicles, trailers and semi‐trailers
Housing Sector
Manufacture of coke and refined petroleum products
Manufacture of tobacco products
Manufacture of Basic Metals
Manufacture of pharmaceuticals medicinal chemical
Top 10 Industry Exposure ( % to AUM)< 1 year 1‐3 years 5‐10 years > 10 years
15.07%
3.58%
62.06%
19.29%
Debt Maturity Profile ( % of Debt)
Gilt39.67%
AAA57.90%
AA2.43%
Debt Rating Profile (% of Debt)
9.3
10.3
11.3
12.3
13.3
14.3
15.3
16.3
17.3
Jan‐10
Apr‐10
Jul‐10
Oct‐10
Jan‐11
Apr‐11
Jul‐11
Oct‐11
Jan‐12
Apr‐12
Jul‐12
Oct‐12
Jan‐13
Apr‐13
Jul‐13
Oct‐13
Jan‐14
Apr‐14
Jul‐14
Oct‐14
Jan‐15
NAV/U
NIT (Rs)
NAV Performance (Since Inception)
NAV Benchmark
Debt44.35%
Equity50.60%
MM & Others5.05%
Asset Allocation (% to AUM)
Modified Duration ‐ 4.47 yrs
Fund returns vis a vis Benchmark 1 Month 3 Month 6 Month 1 Year 2 Year 3 Year Since InceptionIndividual Pension Fund ‐ Apex Balanced 4.23% 4.60% 10.00% 30.19% 17.21% 15.92% 10.39%Benchmark 4.05% 5.27% 11.34% 29.45% 15.23% 14.45% 9.86%
20.81%
15.99%
8.54%
7.18%
4.22%
3.81%
3.55%
2.96%
2.81%
2.05%
Financial & Insurance Activities
Infrastructure
Computer programming, consultancy and related activities
Civil engineering
Manufacture of motor vehicles, trailers and semi‐trailers
Housing Sector
Manufacture of coke and refined petroleum products
Manufacture of tobacco products
Manufacture of Basic Metals
Manufacture of pharmaceuticals,medicinal chemical …
Top 10 Industry Exposure ( % to AUM)< 1 year 1‐3 years 5‐10 years > 10 years
15.07%
3.58%
62.06%
19.29%
Debt Maturity Profile ( % of Debt)
Gilt39.67%
AAA57.90%
AA2.43%
Debt Rating Profile (% of Debt)
9.3
10.3
11.3
12.3
13.3
14.3
15.3
16.3
17.3
Jan‐10
Apr‐10
Jul‐10
Oct‐10
Jan‐11
Apr‐11
Jul‐11
Oct‐11
Jan‐12
Apr‐12
Jul‐12
Oct‐12
Jan‐13
Apr‐13
Jul‐13
Oct‐13
Jan‐14
Apr‐14
Jul‐14
Oct‐14
Jan‐15
NAV/U
NIT (Rs)
NAV Performance (Since Inception)
NAV Benchmark
Debt44.35%
Equity50.60%
MM & Others5.05%
Asset Allocation (% to AUM)
Modified Duration ‐ 4.47 yrs
Investment Objective :
Date of Inception : SFIN No.
March 31, 2009 ULIF 007 31/03/09 SUD‐PI‐BL1 142
Products : AUM :
Rs. 21.11 Cr
Portfolio % to AUM
`
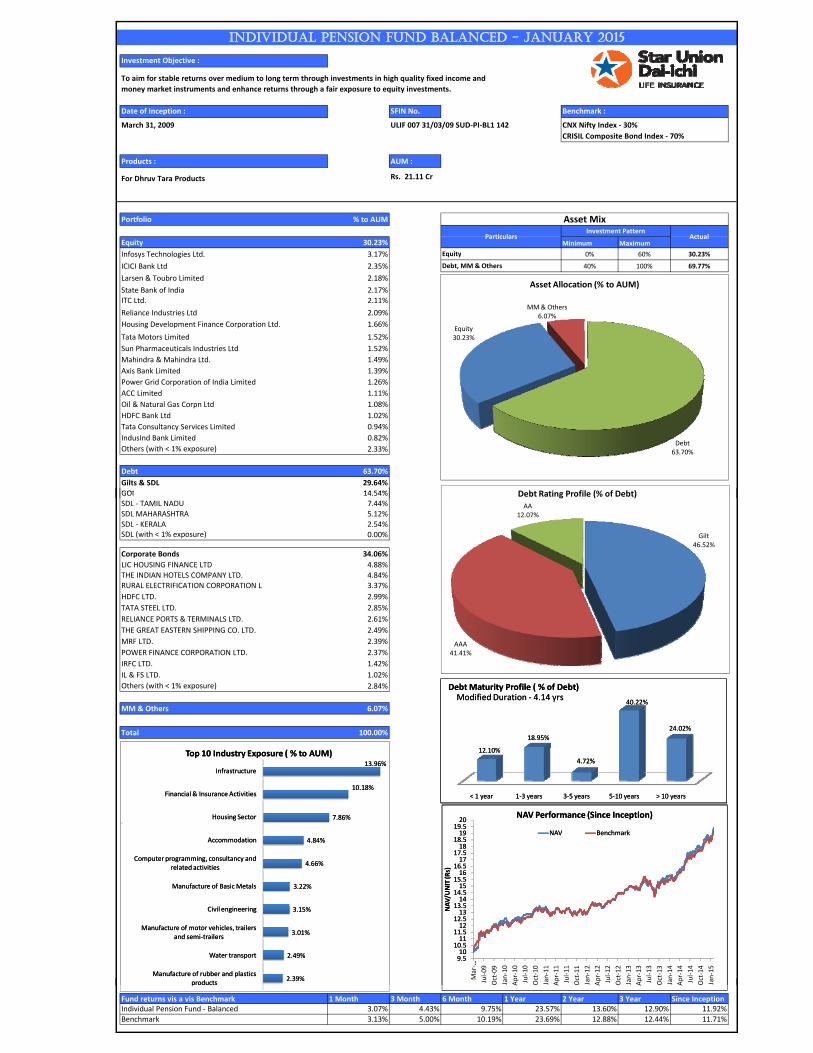
Equity 30.23% Minimum Maximum
Infosys Technologies Ltd. 3.17% 0% 60% 30.23%
ICICI Bank Ltd 2.35% 40% 100% 69.77%
Larsen & Toubro Limited 2.18%
State Bank of India 2.17%ITC Ltd. 2.11%
Reliance Industries Ltd 2.09%
Housing Development Finance Corporation Ltd. 1.66%
Tata Motors Limited 1.52%
Sun Pharmaceuticals Industries Ltd 1.52%
Mahindra & Mahindra Ltd. 1.49%
Axis Bank Limited 1.39%
Power Grid Corporation of India Limited 1.26%
ACC Limited 1.11%
Oil & Natural Gas Corpn Ltd 1.08%
HDFC Bank Ltd 1.02%
Tata Consultancy Services Limited 0.94%
IndusInd Bank Limited 0.82%
Others (with < 1% exposure) 2.33%
Debt 63.70%
Gilts & SDL 29.64%
GOI 14 54%
INDIVIDUAL PENSION FUND BALANCED - JANUARY 2015
Equity
For Dhruv Tara Products
Debt, MM & Others
To aim for stable returns over medium to long term through investments in high quality fixed income and
money market instruments and enhance returns through a fair exposure to equity investments.
Asset Mix
ParticularsInvestment Pattern
Actual
Benchmark :
CNX Nifty Index ‐ 30%
CRISIL Composite Bond Index ‐ 70%
Debt Rating Profile (% of Debt)
Debt63.70%
Equity30.23%
MM & Others6.07%
Asset Allocation (% to AUM)
GOI 14.54%
SDL ‐ TAMIL NADU 7.44%SDL MAHARASHTRA 5.12%SDL ‐ KERALA 2.54%SDL (with < 1% exposure) 0.00%
Corporate Bonds 34.06%
LIC HOUSING FINANCE LTD 4.88%THE INDIAN HOTELS COMPANY LTD. 4.84%RURAL ELECTRIFICATION CORPORATION L 3.37%
HDFC LTD. 2.99%
TATA STEEL LTD. 2.85%
RELIANCE PORTS & TERMINALS LTD. 2.61%
THE GREAT EASTERN SHIPPING CO. LTD. 2.49%
MRF LTD. 2.39%
POWER FINANCE CORPORATION LTD. 2.37%
IRFC LTD. 1.42%
IL & FS LTD. 1.02%
Others (with < 1% exposure) 2.84%
MM & Others 6.07%
Total 100.00%
`
13.96%
10.18%
7.86%
4.84%
4.66%
3.22%
3.15%
3.01%
2.49%
2.39%
Infrastructure
Financial & Insurance Activities
Housing Sector
Accommodation
Computer programming, consultancy and related activities
Manufacture of Basic Metals
Civil engineering
Manufacture of motor vehicles, trailers and semi‐trailers
Water transport
Manufacture of rubber and plastics products
Top 10 Industry Exposure ( % to AUM)
< 1 year 1‐3 years 3‐5 years 5‐10 years > 10 years
12.10%
18.95%
4.72%
40.22%
24.02%
Debt Maturity Profile ( % of Debt)Modified Duration ‐ 4.14 yrs
Gilt46.52%
AAA41.41%
AA12.07%
Debt Rating Profile (% of Debt)
9.510
10.511
11.512
12.513
13.514
14.515
15.516
16.517
17.518
18.519
19.520
Mar‐…
Jul‐09
Oct‐09
Jan‐10
Apr‐10
Jul‐10
Oct‐10
Jan‐11
Apr‐11
Jul‐11
Oct‐11
Jan‐12
Apr‐12
Jul‐12
Oct‐12
Jan‐13
Apr‐13
Jul‐13
Oct‐13
Jan‐14
Apr‐14
Jul‐14
Oct‐14
Jan‐15
NAV/U
NIT (R
s)
NAV Performance (Since Inception)
NAV Benchmark
Debt63.70%
Equity30.23%
MM & Others6.07%
Asset Allocation (% to AUM)
Fund returns vis a vis Benchmark 1 Month 3 Month 6 Month 1 Year 2 Year 3 Year Since InceptionIndividual Pension Fund ‐ Balanced 3.07% 4.43% 9.75% 23.57% 13.60% 12.90% 11.92%
Benchmark 3.13% 5.00% 10.19% 23.69% 12.88% 12.44% 11.71%
13.96%
10.18%
7.86%
4.84%
4.66%
3.22%
3.15%
3.01%
2.49%
2.39%
Infrastructure
Financial & Insurance Activities
Housing Sector
Accommodation
Computer programming, consultancy and related activities
Manufacture of Basic Metals
Civil engineering
Manufacture of motor vehicles, trailers and semi‐trailers
Water transport
Manufacture of rubber and plastics products
Top 10 Industry Exposure ( % to AUM)
< 1 year 1‐3 years 3‐5 years 5‐10 years > 10 years
12.10%
18.95%
4.72%
40.22%
24.02%
Debt Maturity Profile ( % of Debt)Modified Duration ‐ 4.14 yrs
Gilt46.52%
AAA41.41%
AA12.07%
Debt Rating Profile (% of Debt)
9.510
10.511
11.512
12.513
13.514
14.515
15.516
16.517
17.518
18.519
19.520
Mar‐…
Jul‐09
Oct‐09
Jan‐10
Apr‐10
Jul‐10
Oct‐10
Jan‐11
Apr‐11
Jul‐11
Oct‐11
Jan‐12
Apr‐12
Jul‐12
Oct‐12
Jan‐13
Apr‐13
Jul‐13
Oct‐13
Jan‐14
Apr‐14
Jul‐14
Oct‐14
Jan‐15
NAV/U
NIT (R
s)
NAV Performance (Since Inception)
NAV Benchmark
Debt63.70%
Equity30.23%
MM & Others6.07%
Asset Allocation (% to AUM)
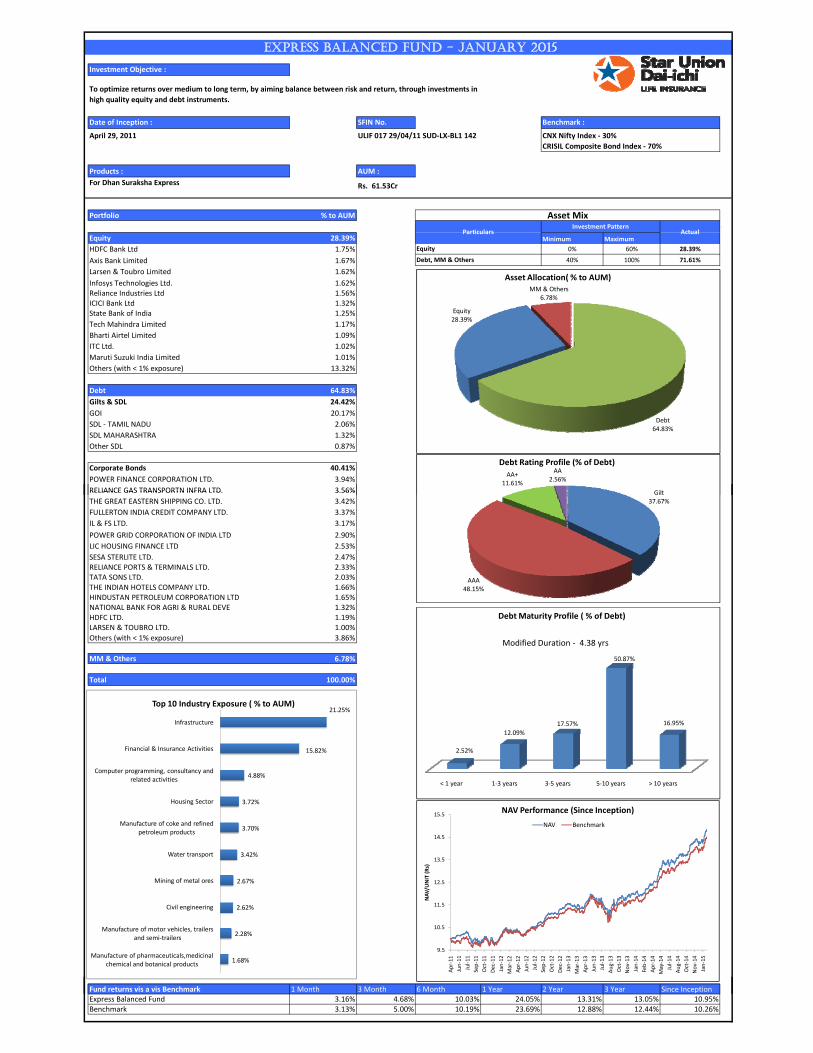
Investment Objective :
Date of Inception : SFIN No. Benchmark :
April 29, 2011 ULIF 017 29/04/11 SUD‐LX‐BL1 142 CNX Nifty Index ‐ 30%
CRISIL Composite Bond Index ‐ 70%
Products : AUM :
For Dhan Suraksha Express Rs. 61.53Cr
Portfolio % to AUM
`
Equity 28.39% Minimum Maximum
HDFC Bank Ltd 1.75% 0% 60% 28.39%
Axis Bank Limited 1.67% 40% 100% 71.61%
Larsen & Toubro Limited 1.62%
Infosys Technologies Ltd. 1.62%Reliance Industries Ltd 1.56%ICICI Bank Ltd 1.32%State Bank of India 1.25%
Tech Mahindra Limited 1.17%
Bharti Airtel Limited 1.09%
ITC Ltd. 1.02%
Maruti Suzuki India Limited 1.01%
Others (with < 1% exposure) 13.32%
Debt 64.83%
Gilts & SDL 24.42%
GOI 20.17%
SDL ‐ TAMIL NADU 2.06%
SDL MAHARASHTRA 1.32%
Other SDL 0.87%
Corporate Bonds 40.41%
POWER FINANCE CORPORATION LTD. 3.94%
RELIANCE GAS TRANSPORTN INFRA LTD. 3.56%
EXPRESS BALANCED FUND - JANUARY 2015
Equity
Debt, MM & Others
To optimize returns over medium to long term, by aiming balance between risk and return, through investments in
high quality equity and debt instruments.
Asset Mix
ParticularsInvestment Pattern
Actual
Gilt
AA+11.61%
AA2.56%
Debt Rating Profile (% of Debt)
Debt64.83%
Equity28.39%
MM & Others6.78%
Asset Allocation( % to AUM)
RELIANCE GAS TRANSPORTN INFRA LTD. 3.56%
THE GREAT EASTERN SHIPPING CO. LTD. 3.42%
FULLERTON INDIA CREDIT COMPANY LTD. 3.37%
IL & FS LTD. 3.17%
POWER GRID CORPORATION OF INDIA LTD 2.90%
LIC HOUSING FINANCE LTD 2.53%
SESA STERLITE LTD. 2.47%RELIANCE PORTS & TERMINALS LTD. 2.33%TATA SONS LTD. 2.03%THE INDIAN HOTELS COMPANY LTD. 1.66%HINDUSTAN PETROLEUM CORPORATION LTD 1.65%NATIONAL BANK FOR AGRI & RURAL DEVE 1.32%HDFC LTD. 1.19%LARSEN & TOUBRO LTD. 1.00%
Others (with < 1% exposure) 3.86%
MM & Others 6.78%
Total 100.00%
`
21.25%
15.82%
4.88%
3.72%
3.70%
3.42%
2.67%
2.62%
2.28%
1.68%
Infrastructure
Financial & Insurance Activities
Computer programming, consultancy and related activities
Housing Sector
Manufacture of coke and refined petroleum products
Water transport
Mining of metal ores
Civil engineering
Manufacture of motor vehicles, trailers and semi‐trailers
Manufacture of pharmaceuticals,medicinal chemical and botanical products
Top 10 Industry Exposure ( % to AUM)
< 1 year 1‐3 years 3‐5 years 5‐10 years > 10 years
2.52%
12.09%
17.57%
50.87%
16.95%
Debt Maturity Profile ( % of Debt)
Gilt37.67%
AAA48.15%
AA+11.61%
AA2.56%
Debt Rating Profile (% of Debt)
9.5
10.5
11.5
12.5
13.5
14.5
15.5
Apr‐11
Jun‐11
Jul‐11
Sep‐11
Oct‐11
Dec‐11
Jan‐12
Mar‐12
Apr‐12
Jun‐12
Jul‐12
Sep‐12
Oct‐12
Dec‐12
Jan‐13
Mar‐13
Apr‐13
Jun‐13
Jul‐13
Aug‐13
Oct‐13
Nov‐13
Jan‐14
Feb‐14
Apr‐14
May‐14
Jul‐14
Aug‐14
Oct‐14
Nov‐14
Jan‐15
NAV/U
NIT (Rs)
NAV Performance (Since Inception)
NAV Benchmark
Debt64.83%
Equity28.39%
MM & Others6.78%
Asset Allocation( % to AUM)
Modified Duration ‐ 4.38 yrs
Fund returns vis a vis Benchmark 1 Month 3 Month 6 Month 1 Year 2 Year 3 Year Since InceptionExpress Balanced Fund 3.16% 4.68% 10.03% 24.05% 13.31% 13.05% 10.95%Benchmark 3.13% 5.00% 10.19% 23.69% 12.88% 12.44% 10.26%
21.25%
15.82%
4.88%
3.72%
3.70%
3.42%
2.67%
2.62%
2.28%
1.68%
Infrastructure
Financial & Insurance Activities
Computer programming, consultancy and related activities
Housing Sector
Manufacture of coke and refined petroleum products
Water transport
Mining of metal ores
Civil engineering
Manufacture of motor vehicles, trailers and semi‐trailers
Manufacture of pharmaceuticals,medicinal chemical and botanical products
Top 10 Industry Exposure ( % to AUM)
< 1 year 1‐3 years 3‐5 years 5‐10 years > 10 years
2.52%
12.09%
17.57%
50.87%
16.95%
Debt Maturity Profile ( % of Debt)
Gilt37.67%
AAA48.15%
AA+11.61%
AA2.56%
Debt Rating Profile (% of Debt)
9.5
10.5
11.5
12.5
13.5
14.5
15.5
Apr‐11
Jun‐11
Jul‐11
Sep‐11
Oct‐11
Dec‐11
Jan‐12
Mar‐12
Apr‐12
Jun‐12
Jul‐12
Sep‐12
Oct‐12
Dec‐12
Jan‐13
Mar‐13
Apr‐13
Jun‐13
Jul‐13
Aug‐13
Oct‐13
Nov‐13
Jan‐14
Feb‐14
Apr‐14
May‐14
Jul‐14
Aug‐14
Oct‐14
Nov‐14
Jan‐15
NAV/U
NIT (Rs)
NAV Performance (Since Inception)
NAV Benchmark
Debt64.83%
Equity28.39%
MM & Others6.78%
Asset Allocation( % to AUM)
Modified Duration ‐ 4.38 yrs
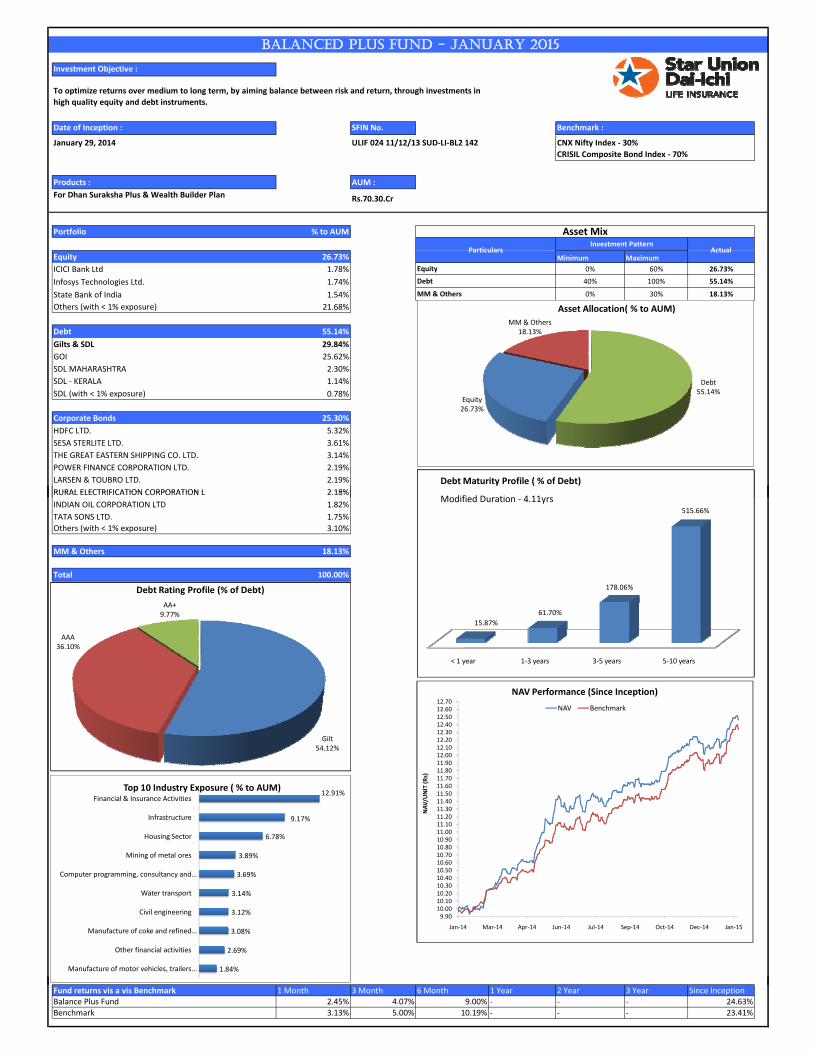
Investment Objective :
Date of Inception : SFIN No. Benchmark :
January 29, 2014 ULIF 024 11/12/13 SUD‐LI‐BL2 142 CNX Nifty Index ‐ 30%
CRISIL Composite Bond Index ‐ 70%
Products : AUM :
For Dhan Suraksha Plus & Wealth Builder Plan Rs.70.30.Cr
Portfolio % to AUM
`
Equity 26.73% Minimum Maximum
ICICI Bank Ltd 1.78% 0% 60% 26.73%
Infosys Technologies Ltd. 1.74% 40% 100% 55.14%
State Bank of India 1.54% 0% 30% 18.13%
Others (with < 1% exposure) 21.68%
Debt 55.14%
Gilts & SDL 29.84%
GOI 25.62%
SDL MAHARASHTRA 2.30%
SDL ‐ KERALA 1.14%
SDL (with < 1% exposure) 0.78%
Corporate Bonds 25.30%
HDFC LTD. 5.32%
SESA STERLITE LTD. 3.61%
THE GREAT EASTERN SHIPPING CO. LTD. 3.14%
POWER FINANCE CORPORATION LTD. 2.19%
LARSEN & TOUBRO LTD. 2.19%
RURAL ELECTRIFICATION CORPORATION L 2 18%
BALANCED PLUS FUND - JANUARY 2015
MM & Others
Equity
Debt
To optimize returns over medium to long term, by aiming balance between risk and return, through investments in
high quality equity and debt instruments.
Asset Mix
ParticularsInvestment Pattern
Actual
Debt Maturity Profile ( % of Debt)
Debt55.14%
Equity26.73%
MM & Others18.13%
Asset Allocation( % to AUM)
Modified Duration 4 11yrsRURAL ELECTRIFICATION CORPORATION L 2.18%
INDIAN OIL CORPORATION LTD 1.82%
TATA SONS LTD. 1.75%
Others (with < 1% exposure) 3.10%
MM & Others 18.13%
Total 100.00%
`
12.91%
9.17%
6.78%
3.89%
3.69%
3.14%
3.12%
3.08%
2.69%
1.84%
Financial & Insurance Activities
Infrastructure
Housing Sector
Mining of metal ores
Computer programming, consultancy and …
Water transport
Civil engineering
Manufacture of coke and refined …
Other financial activities
Manufacture of motor vehicles, trailers …
Top 10 Industry Exposure ( % to AUM)
< 1 year 1‐3 years 3‐5 years 5‐10 years
15.87%
61.70%
178.06%
515.66%
Debt Maturity Profile ( % of Debt)
Gilt54.12%
AAA36.10%
AA+9.77%
Debt Rating Profile (% of Debt)
9.9010.0010.1010.2010.3010.4010.5010.6010.7010.8010.9011.0011.1011.2011.3011.4011.5011.6011.7011.8011.9012.0012.1012.2012.3012.4012.5012.6012.70
Jan‐14 Mar‐14 Apr‐14 Jun‐14 Jul‐14 Sep‐14 Oct‐14 Dec‐14 Jan‐15
NAV/U
NIT (Rs)
NAV Performance (Since Inception)
NAV Benchmark
Debt55.14%
Equity26.73%
MM & Others18.13%
Asset Allocation( % to AUM)
Modified Duration ‐ 4.11yrs
Fund returns vis a vis Benchmark 1 Month 3 Month 6 Month 1 Year 2 Year 3 Year Since InceptionBalance Plus Fund 2.45% 4.07% 9.00% ‐ ‐ ‐ 24.63%Benchmark 3.13% 5.00% 10.19% ‐ ‐ ‐ 23.41%
12.91%
9.17%
6.78%
3.89%
3.69%
3.14%
3.12%
3.08%
2.69%
1.84%
Financial & Insurance Activities
Infrastructure
Housing Sector
Mining of metal ores
Computer programming, consultancy and …
Water transport
Civil engineering
Manufacture of coke and refined …
Other financial activities
Manufacture of motor vehicles, trailers …
Top 10 Industry Exposure ( % to AUM)
< 1 year 1‐3 years 3‐5 years 5‐10 years
15.87%
61.70%
178.06%
515.66%
Debt Maturity Profile ( % of Debt)
Gilt54.12%
AAA36.10%
AA+9.77%
Debt Rating Profile (% of Debt)
9.9010.0010.1010.2010.3010.4010.5010.6010.7010.8010.9011.0011.1011.2011.3011.4011.5011.6011.7011.8011.9012.0012.1012.2012.3012.4012.5012.6012.70
Jan‐14 Mar‐14 Apr‐14 Jun‐14 Jul‐14 Sep‐14 Oct‐14 Dec‐14 Jan‐15
NAV/U
NIT (Rs)
NAV Performance (Since Inception)
NAV Benchmark
Debt55.14%
Equity26.73%
MM & Others18.13%
Asset Allocation( % to AUM)
Modified Duration ‐ 4.11yrs
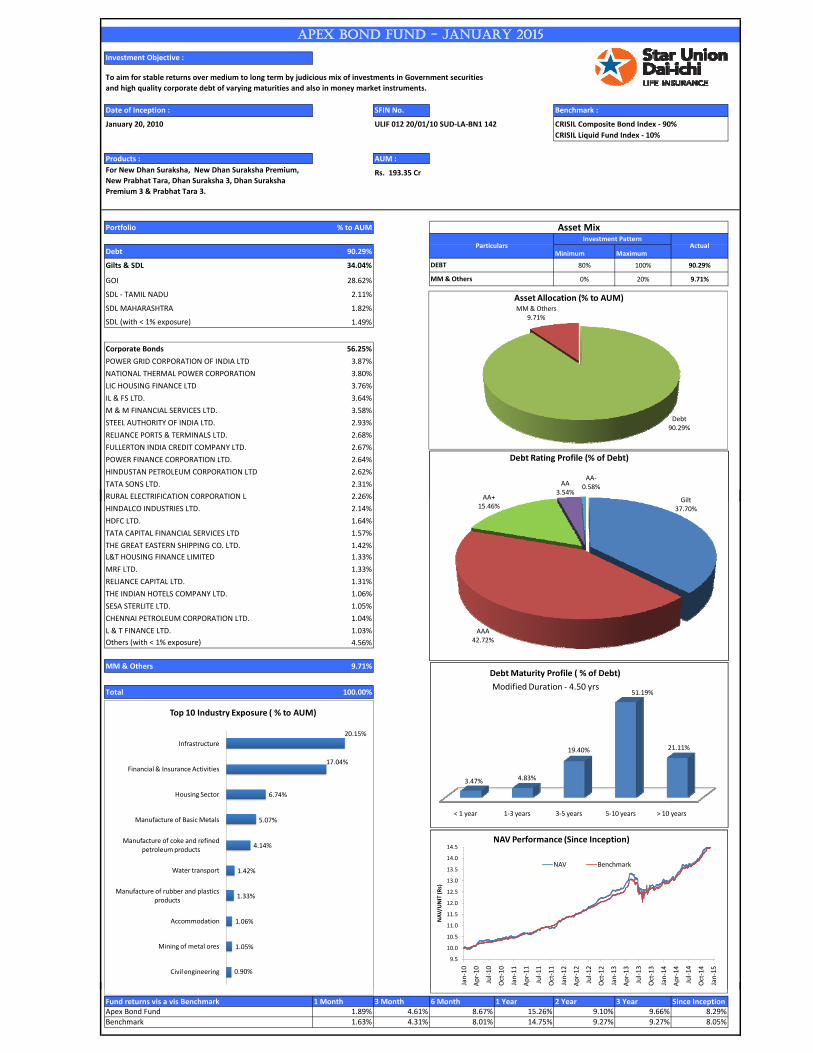
Investment Objective :
Date of Inception : SFIN No.
January 20, 2010 ULIF 012 20/01/10 SUD‐LA‐BN1 142
Products : AUM :
Rs. 193.35 Cr
Portfolio % to AUM
`
Debt 90.29% Minimum Maximum
Gilts & SDL 34.04% 80% 100% 90.29%
GOI 28.62% 0% 20% 9.71%
SDL ‐ TAMIL NADU 2.11%
SDL MAHARASHTRA 1.82%
SDL (with < 1% exposure) 1.49%
Corporate Bonds 56.25%
POWER GRID CORPORATION OF INDIA LTD 3.87%
NATIONAL THERMAL POWER CORPORATION 3.80%
LIC HOUSING FINANCE LTD 3.76%
IL & FS LTD. 3.64%
M & M FINANCIAL SERVICES LTD. 3.58%
STEEL AUTHORITY OF INDIA LTD. 2.93%
RELIANCE PORTS & TERMINALS LTD. 2.68%
FULLERTON INDIA CREDIT COMPANY LTD. 2.67%
POWER FINANCE CORPORATION LTD. 2.64%
HINDUSTAN PETROLEUM CORPORATION LTD 2.62%
TATA SONS LTD. 2.31%
APEX BOND FUND - JANUARY 2015
DEBT
MM & Others
Particulars
To aim for stable returns over medium to long term by judicious mix of investments in Government securities
and high quality corporate debt of varying maturities and also in money market instruments.
Investment PatternActual
Asset Mix
For New Dhan Suraksha, New Dhan Suraksha Premium,
New Prabhat Tara, Dhan Suraksha 3, Dhan Suraksha
Premium 3 & Prabhat Tara 3.
Benchmark :
CRISIL Composite Bond Index ‐ 90%
CRISIL Liquid Fund Index ‐ 10%
Debt90.29%
MM & Others9.71%
Asset Allocation (% to AUM)
GiltAA+
AA3.54%
AA‐0.58%
Debt Rating Profile (% of Debt)
RURAL ELECTRIFICATION CORPORATION L 2.26%
HINDALCO INDUSTRIES LTD. 2.14%
HDFC LTD. 1.64%
TATA CAPITAL FINANCIAL SERVICES LTD 1.57%
THE GREAT EASTERN SHIPPING CO. LTD. 1.42%
L&T HOUSING FINANCE LIMITED 1.33%
MRF LTD. 1.33%
RELIANCE CAPITAL LTD. 1.31%
THE INDIAN HOTELS COMPANY LTD. 1.06%
SESA STERLITE LTD. 1.05%
CHENNAI PETROLEUM CORPORATION LTD. 1.04%
L & T FINANCE LTD. 1.03%
Others (with < 1% exposure) 4.56%
MM & Others 9.71%
Total 100.00%
`
20.15%
17.04%
6.74%
5.07%
4.14%
1.42%
1.33%
1.06%
1.05%
0.90%
Infrastructure
Financial & Insurance Activities
Housing Sector
Manufacture of Basic Metals
Manufacture of coke and refined petroleum products
Water transport
Manufacture of rubber and plastics products
Accommodation
Mining of metal ores
Civil engineering
Top 10 Industry Exposure ( % to AUM)
< 1 year 1‐3 years 3‐5 years 5‐10 years > 10 years
3.47% 4.83%
19.40%
51.19%
21.11%
Debt Maturity Profile ( % of Debt)
Debt90.29%
MM & Others9.71%
Asset Allocation (% to AUM)
Gilt37.70%
AAA42.72%
AA+15.46%
AA3.54%
AA‐0.58%
Debt Rating Profile (% of Debt)
9.5
10.0
10.5
11.0
11.5
12.0
12.5
13.0
13.5
14.0
14.5
Jan‐10
Apr‐10
Jul‐10
Oct‐10
Jan‐11
Apr‐11
Jul‐11
Oct‐11
Jan‐12
Apr‐12
Jul‐12
Oct‐12
Jan‐13
Apr‐13
Jul‐13
Oct‐13
Jan‐14
Apr‐14
Jul‐14
Oct‐14
Jan‐15
NAV/U
NIT (Rs)
NAV Performance (Since Inception)
NAV Benchmark
Modified Duration ‐ 4.50 yrs
Fund returns vis a vis Benchmark 1 Month 3 Month 6 Month 1 Year 2 Year 3 Year Since InceptionApex Bond Fund 1.89% 4.61% 8.67% 15.26% 9.10% 9.66% 8.29%Benchmark 1.63% 4.31% 8.01% 14.75% 9.27% 9.27% 8.05%
20.15%
17.04%
6.74%
5.07%
4.14%
1.42%
1.33%
1.06%
1.05%
0.90%
Infrastructure
Financial & Insurance Activities
Housing Sector
Manufacture of Basic Metals
Manufacture of coke and refined petroleum products
Water transport
Manufacture of rubber and plastics products
Accommodation
Mining of metal ores
Civil engineering
Top 10 Industry Exposure ( % to AUM)
< 1 year 1‐3 years 3‐5 years 5‐10 years > 10 years
3.47% 4.83%
19.40%
51.19%
21.11%
Debt Maturity Profile ( % of Debt)
Debt90.29%
MM & Others9.71%
Asset Allocation (% to AUM)
Gilt37.70%
AAA42.72%
AA+15.46%
AA3.54%
AA‐0.58%
Debt Rating Profile (% of Debt)
9.5
10.0
10.5
11.0
11.5
12.0
12.5
13.0
13.5
14.0
14.5
Jan‐10
Apr‐10
Jul‐10
Oct‐10
Jan‐11
Apr‐11
Jul‐11
Oct‐11
Jan‐12
Apr‐12
Jul‐12
Oct‐12
Jan‐13
Apr‐13
Jul‐13
Oct‐13
Jan‐14
Apr‐14
Jul‐14
Oct‐14
Jan‐15
NAV/U
NIT (Rs)
NAV Performance (Since Inception)
NAV Benchmark
Modified Duration ‐ 4.50 yrs
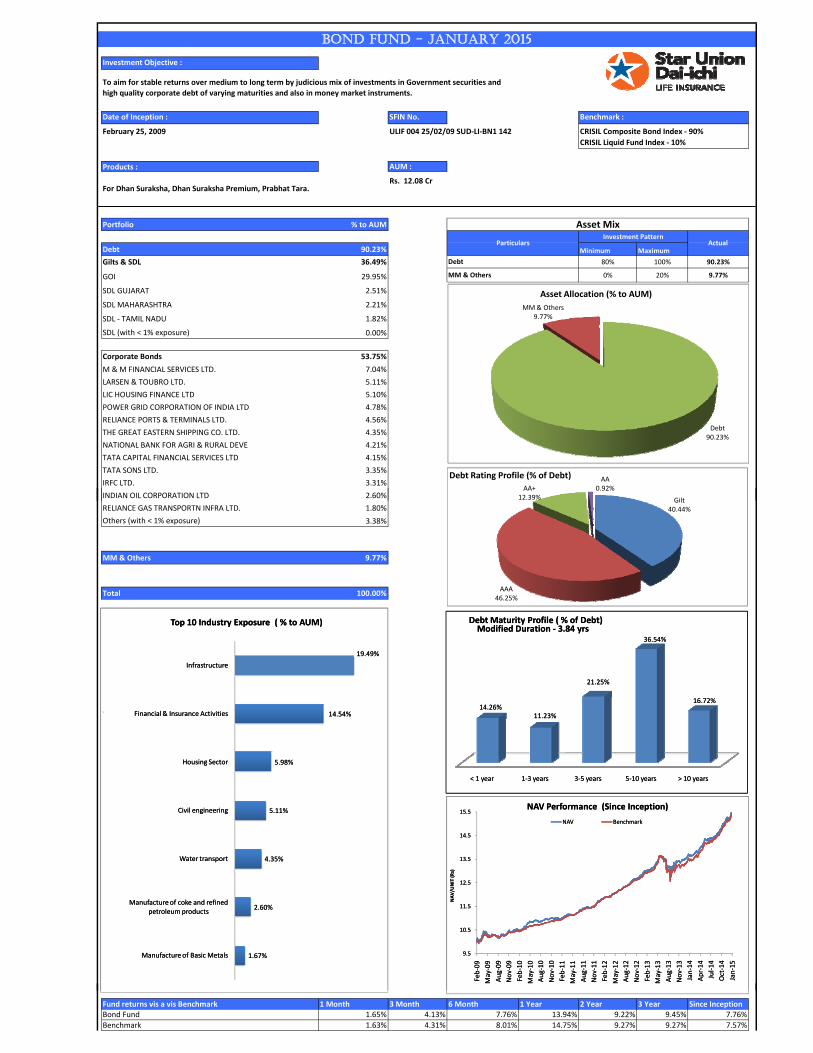
Investment Objective :
Date of Inception : SFIN No. Benchmark :
February 25, 2009 ULIF 004 25/02/09 SUD‐LI‐BN1 142 CRISIL Composite Bond Index ‐ 90%
CRISIL Liquid Fund Index ‐ 10%
Products : AUM :
Rs. 12.08 Cr
Portfolio % to AUM
`
Debt 90.23% Minimum Maximum
Gilts & SDL 36.49% 80% 100% 90.23%
GOI 29.95% 0% 20% 9.77%
SDL GUJARAT 2.51%
SDL MAHARASHTRA 2.21%
SDL ‐ TAMIL NADU 1.82%
SDL (with < 1% exposure) 0.00%
Corporate Bonds 53.75%
M & M FINANCIAL SERVICES LTD. 7.04%
LARSEN & TOUBRO LTD. 5.11%
LIC HOUSING FINANCE LTD 5.10%
POWER GRID CORPORATION OF INDIA LTD 4.78%
RELIANCE PORTS & TERMINALS LTD. 4.56%
THE GREAT EASTERN SHIPPING CO. LTD. 4.35%
NATIONAL BANK FOR AGRI & RURAL DEVE 4.21%
TATA CAPITAL FINANCIAL SERVICES LTD 4.15%
TATA SONS LTD. 3.35%
IRFC LTD. 3.31%
BOND FUND - JANUARY 2015
Debt
MM & Others
To aim for stable returns over medium to long term by judicious mix of investments in Government securities and
high quality corporate debt of varying maturities and also in money market instruments.
Investment PatternActual
Asset Mix
Particulars
For Dhan Suraksha, Dhan Suraksha Premium, Prabhat Tara.
Debt90.23%
MM & Others9.77%
Asset Allocation (% to AUM)
Gilt
AA+12.39%
AA0.92%
Debt Rating Profile (% of Debt)
INDIAN OIL CORPORATION LTD 2.60%
RELIANCE GAS TRANSPORTN INFRA LTD. 1.80%
Others (with < 1% exposure) 3.38%
MM & Others 9.77%
Total 100.00%
`
19.49%
14.54%
5.98%
5.11%
4.35%
2.60%
1.67%
Infrastructure
Financial & Insurance Activities
Housing Sector
Civil engineering
Water transport
Manufacture of coke and refined petroleum products
Manufacture of Basic Metals
Top 10 Industry Exposure ( % to AUM)
< 1 year 1‐3 years 3‐5 years 5‐10 years > 10 years
14.26%11.23%
21.25%
36.54%
16.72%
Debt Maturity Profile ( % of Debt)
Debt90.23%
MM & Others9.77%
Asset Allocation (% to AUM)
Gilt40.44%
AAA46.25%
AA+12.39%
AA0.92%
Debt Rating Profile (% of Debt)
9.5
10.5
11.5
12.5
13.5
14.5
15.5
Feb‐09
May‐09
Aug‐09
Nov‐09
Feb‐10
May‐10
Aug‐10
Nov‐10
Feb‐11
May‐11
Aug‐11
Nov‐11
Feb‐12
May‐12
Aug‐12
Nov‐12
Feb‐13
May‐13
Aug‐13
Nov‐13
Jan‐14
Apr‐14
Jul‐14
Oct‐14
Jan‐15
NAV/U
NIT (Rs)
NAV Performance (Since Inception)
NAV Benchmark
Modified Duration ‐ 3.84 yrs
Fund returns vis a vis Benchmark 1 Month 3 Month 6 Month 1 Year 2 Year 3 Year Since InceptionBond Fund 1.65% 4.13% 7.76% 13.94% 9.22% 9.45% 7.76%
Benchmark 1.63% 4.31% 8.01% 14.75% 9.27% 9.27% 7.57%
19.49%
14.54%
5.98%
5.11%
4.35%
2.60%
1.67%
Infrastructure
Financial & Insurance Activities
Housing Sector
Civil engineering
Water transport
Manufacture of coke and refined petroleum products
Manufacture of Basic Metals
Top 10 Industry Exposure ( % to AUM)
< 1 year 1‐3 years 3‐5 years 5‐10 years > 10 years
14.26%11.23%
21.25%
36.54%
16.72%
Debt Maturity Profile ( % of Debt)
Debt90.23%
MM & Others9.77%
Asset Allocation (% to AUM)
Gilt40.44%
AAA46.25%
AA+12.39%
AA0.92%
Debt Rating Profile (% of Debt)
9.5
10.5
11.5
12.5
13.5
14.5
15.5
Feb‐09
May‐09
Aug‐09
Nov‐09
Feb‐10
May‐10
Aug‐10
Nov‐10
Feb‐11
May‐11
Aug‐11
Nov‐11
Feb‐12
May‐12
Aug‐12
Nov‐12
Feb‐13
May‐13
Aug‐13
Nov‐13
Jan‐14
Apr‐14
Jul‐14
Oct‐14
Jan‐15
NAV/U
NIT (Rs)
NAV Performance (Since Inception)
NAV Benchmark
Modified Duration ‐ 3.84 yrs
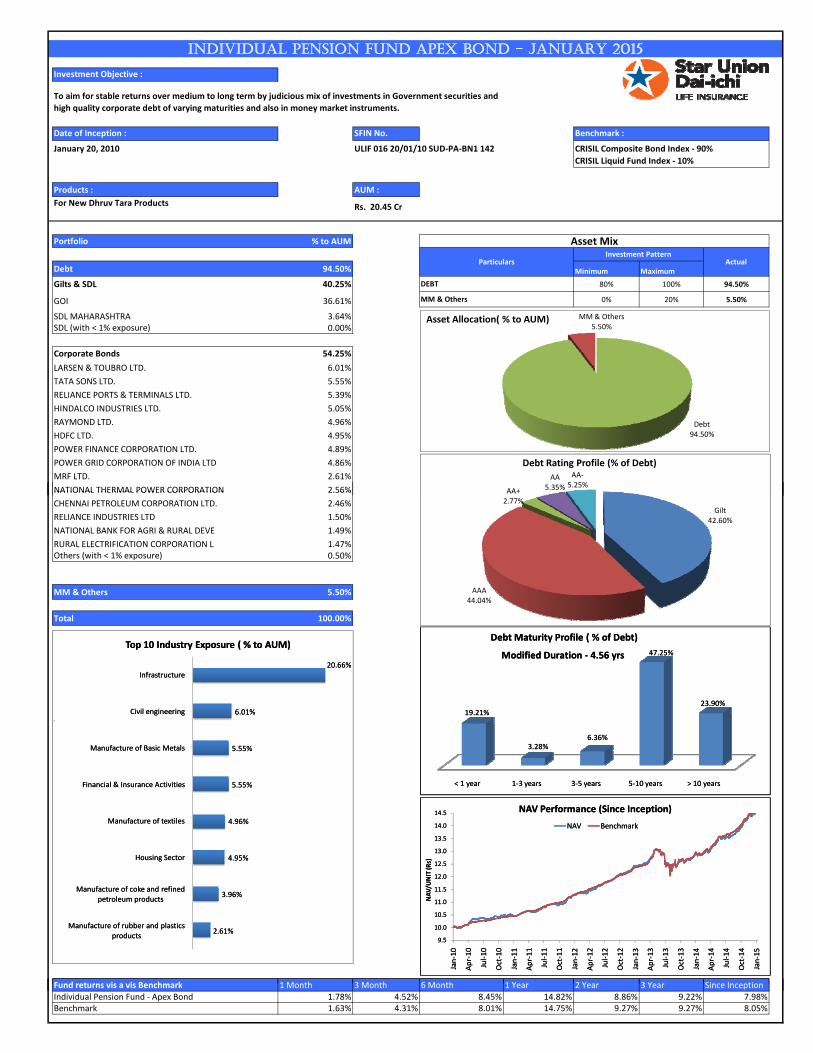
Investment Objective :
Date of Inception : SFIN No.
January 20, 2010 ULIF 016 20/01/10 SUD‐PA‐BN1 142
Products : AUM :
For New Dhruv Tara Products Rs. 20.45 Cr
Portfolio % to AUM
`
Debt 94.50% Minimum Maximum
Gilts & SDL 40.25% 80% 100% 94.50%
GOI 36.61% 0% 20% 5.50%
SDL MAHARASHTRA 3.64%SDL (with < 1% exposure) 0.00%
Corporate Bonds 54.25%
LARSEN & TOUBRO LTD. 6.01%
TATA SONS LTD. 5.55%
RELIANCE PORTS & TERMINALS LTD. 5.39%
HINDALCO INDUSTRIES LTD. 5.05%
RAYMOND LTD. 4.96%
HDFC LTD. 4.95%
POWER FINANCE CORPORATION LTD. 4.89%
POWER GRID CORPORATION OF INDIA LTD 4.86%
MRF LTD. 2.61%
NATIONAL THERMAL POWER CORPORATION 2.56%
INDIVIDUAL PENSION FUND APEX BOND - JANUARY 2015
DEBT
MM & Others
To aim for stable returns over medium to long term by judicious mix of investments in Government securities and
high quality corporate debt of varying maturities and also in money market instruments.
Asset Mix
ParticularsInvestment Pattern
Actual
Benchmark :
CRISIL Composite Bond Index ‐ 90%
CRISIL Liquid Fund Index ‐ 10%
Debt94.50%
MM & Others5.50%
Asset Allocation( % to AUM)
AA+
AA5.35%
AA‐5.25%
Debt Rating Profile (% of Debt)
NATIONAL THERMAL POWER CORPORATION 2.56%
CHENNAI PETROLEUM CORPORATION LTD. 2.46%
RELIANCE INDUSTRIES LTD 1.50%
NATIONAL BANK FOR AGRI & RURAL DEVE 1.49%
RURAL ELECTRIFICATION CORPORATION L 1.47%Others (with < 1% exposure) 0.50%
MM & Others 5.50%
Total 100.00%
`
Fund returns vis a vis Benchmark 1 Month 3 Month 6 Month 1 Year 2 Year 3 Year Since Inception
20.66%
6.01%
5.55%
5.55%
4.96%
4.95%
3.96%
2.61%
Infrastructure
Civil engineering
Manufacture of Basic Metals
Financial & Insurance Activities
Manufacture of textiles
Housing Sector
Manufacture of coke and refined petroleum products
Manufacture of rubber and plastics products
Top 10 Industry Exposure ( % to AUM)
< 1 year 1‐3 years 3‐5 years 5‐10 years > 10 years
19.21%
3.28%6.36%
47.25%
23.90%
Debt Maturity Profile ( % of Debt)
Debt94.50%
MM & Others5.50%
Asset Allocation( % to AUM)
Gilt42.60%
AAA44.04%
AA+2.77%
AA5.35%
AA‐5.25%
Debt Rating Profile (% of Debt)
9.5
10.0
10.5
11.0
11.5
12.0
12.5
13.0
13.5
14.0
14.5
Jan‐10
Apr‐10
Jul‐10
Oct‐10
Jan‐11
Apr‐11
Jul‐11
Oct‐11
Jan‐12
Apr‐12
Jul‐12
Oct‐12
Jan‐13
Apr‐13
Jul‐13
Oct‐13
Jan‐14
Apr‐14
Jul‐14
Oct‐14
Jan‐15
NAV/U
NIT (R
s)
NAV Performance (Since Inception)
NAV Benchmark
Modified Duration ‐ 4.56 yrs
Fund returns vis a vis Benchmark 1 Month 3 Month 6 Month 1 Year 2 Year 3 Year Since InceptionIndividual Pension Fund ‐ Apex Bond 1.78% 4.52% 8.45% 14.82% 8.86% 9.22% 7.98%Benchmark 1.63% 4.31% 8.01% 14.75% 9.27% 9.27% 8.05%
20.66%
6.01%
5.55%
5.55%
4.96%
4.95%
3.96%
2.61%
Infrastructure
Civil engineering
Manufacture of Basic Metals
Financial & Insurance Activities
Manufacture of textiles
Housing Sector
Manufacture of coke and refined petroleum products
Manufacture of rubber and plastics products
Top 10 Industry Exposure ( % to AUM)
< 1 year 1‐3 years 3‐5 years 5‐10 years > 10 years
19.21%
3.28%6.36%
47.25%
23.90%
Debt Maturity Profile ( % of Debt)
Debt94.50%
MM & Others5.50%
Asset Allocation( % to AUM)
Gilt42.60%
AAA44.04%
AA+2.77%
AA5.35%
AA‐5.25%
Debt Rating Profile (% of Debt)
9.5
10.0
10.5
11.0
11.5
12.0
12.5
13.0
13.5
14.0
14.5
Jan‐10
Apr‐10
Jul‐10
Oct‐10
Jan‐11
Apr‐11
Jul‐11
Oct‐11
Jan‐12
Apr‐12
Jul‐12
Oct‐12
Jan‐13
Apr‐13
Jul‐13
Oct‐13
Jan‐14
Apr‐14
Jul‐14
Oct‐14
Jan‐15
NAV/U
NIT (R
s)
NAV Performance (Since Inception)
NAV Benchmark
Modified Duration ‐ 4.56 yrs
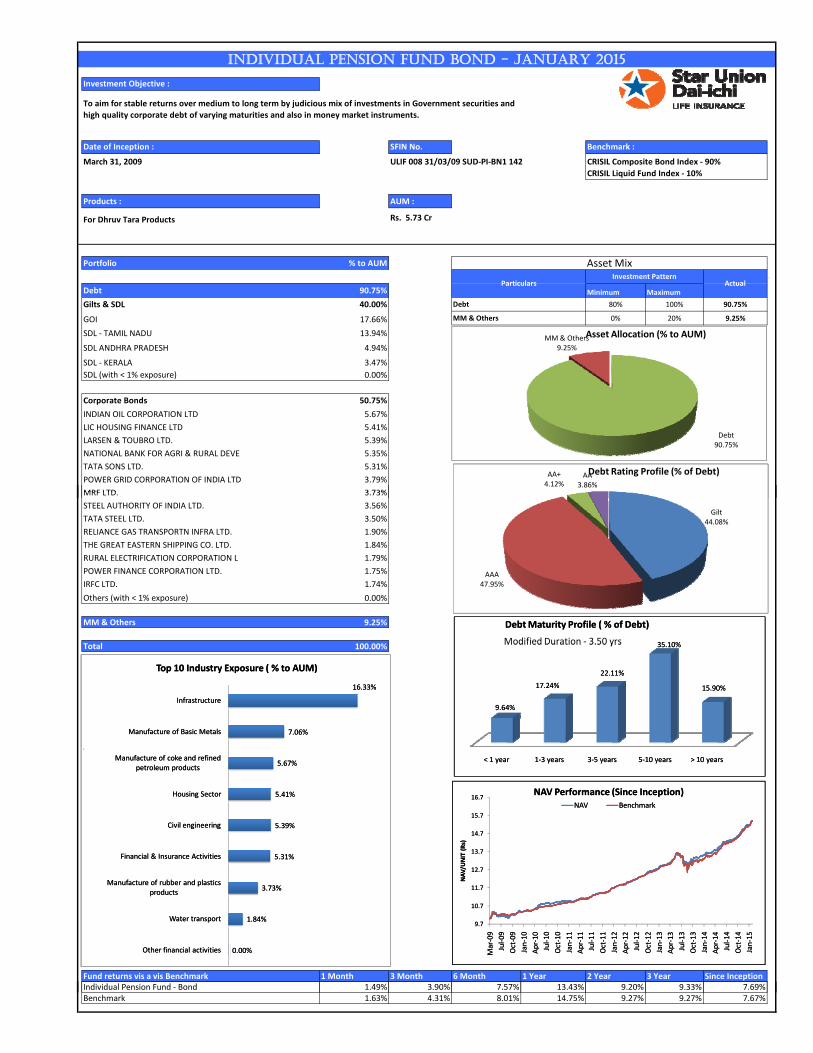
Investment Objective :
Date of Inception : SFIN No.
March 31, 2009 ULIF 008 31/03/09 SUD‐PI‐BN1 142
Products : AUM :
Rs. 5.73 Cr
Portfolio % to AUM
`
Debt 90.75% Minimum Maximum
Gilts & SDL 40.00% 80% 100% 90.75%
GOI 17.66% 0% 20% 9.25%
SDL ‐ TAMIL NADU 13.94%
SDL ANDHRA PRADESH 4.94%
SDL ‐ KERALA 3.47%
SDL (with < 1% exposure) 0.00%
Corporate Bonds 50.75%
INDIAN OIL CORPORATION LTD 5.67%
LIC HOUSING FINANCE LTD 5.41%
LARSEN & TOUBRO LTD. 5.39%
NATIONAL BANK FOR AGRI & RURAL DEVE 5.35%
TATA SONS LTD. 5.31%
POWER GRID CORPORATION OF INDIA LTD 3.79%
MRF LTD 3 73%
INDIVIDUAL PENSION FUND BOND - JANUARY 2015
Debt
For Dhruv Tara Products
MM & Others
To aim for stable returns over medium to long term by judicious mix of investments in Government securities and
high quality corporate debt of varying maturities and also in money market instruments.
Asset Mix
ParticularsInvestment Pattern
Actual
Benchmark :
CRISIL Composite Bond Index ‐ 90%
CRISIL Liquid Fund Index ‐ 10%
Debt90.75%
MM & Others9.25%
Asset Allocation (% to AUM)
AA+4.12%
AA3.86%
Debt Rating Profile (% of Debt)
MRF LTD. 3.73%
STEEL AUTHORITY OF INDIA LTD. 3.56%
TATA STEEL LTD. 3.50%
RELIANCE GAS TRANSPORTN INFRA LTD. 1.90%
THE GREAT EASTERN SHIPPING CO. LTD. 1.84%
RURAL ELECTRIFICATION CORPORATION L 1.79%
POWER FINANCE CORPORATION LTD. 1.75%
IRFC LTD. 1.74%
Others (with < 1% exposure) 0.00%
MM & Others 9.25%
Total 100.00%
`
Fund returns vis a vis Benchmark 1 Month 3 Month 6 Month 1 Year 2 Year 3 Year Since InceptionI di id l P i F d B d 1 49% 3 90% 7 57% 13 43% 9 20% 9 33% 7 69%
16.33%
7.06%
5.67%
5.41%
5.39%
5.31%
3.73%
1.84%
0.00%
Infrastructure
Manufacture of Basic Metals
Manufacture of coke and refined petroleum products
Housing Sector
Civil engineering
Financial & Insurance Activities
Manufacture of rubber and plastics products
Water transport
Other financial activities
Top 10 Industry Exposure ( % to AUM)
< 1 year 1‐3 years 3‐5 years 5‐10 years > 10 years
9.64%
17.24%
22.11%
35.10%
15.90%
Debt Maturity Profile ( % of Debt)
Debt90.75%
MM & Others9.25%
Asset Allocation (% to AUM)
Gilt44.08%
AAA47.95%
AA+4.12%
AA3.86%
Debt Rating Profile (% of Debt)
9.7
10.7
11.7
12.7
13.7
14.7
15.7
16.7
Mar‐09
Jul‐09
Oct‐09
Jan‐10
Apr‐10
Jul‐10
Oct‐10
Jan‐11
Apr‐11
Jul‐11
Oct‐11
Jan‐12
Apr‐12
Jul‐12
Oct‐12
Jan‐13
Apr‐13
Jul‐13
Oct‐13
Jan‐14
Apr‐14
Jul‐14
Oct‐14
Jan‐15
NAV/U
NIT (Rs)
NAV Performance (Since Inception)NAV Benchmark
Modified Duration ‐ 3.50 yrs
Individual Pension Fund ‐ Bond 1.49% 3.90% 7.57% 13.43% 9.20% 9.33% 7.69%Benchmark 1.63% 4.31% 8.01% 14.75% 9.27% 9.27% 7.67%
16.33%
7.06%
5.67%
5.41%
5.39%
5.31%
3.73%
1.84%
0.00%
Infrastructure
Manufacture of Basic Metals
Manufacture of coke and refined petroleum products
Housing Sector
Civil engineering
Financial & Insurance Activities
Manufacture of rubber and plastics products
Water transport
Other financial activities
Top 10 Industry Exposure ( % to AUM)
< 1 year 1‐3 years 3‐5 years 5‐10 years > 10 years
9.64%
17.24%
22.11%
35.10%
15.90%
Debt Maturity Profile ( % of Debt)
Debt90.75%
MM & Others9.25%
Asset Allocation (% to AUM)
Gilt44.08%
AAA47.95%
AA+4.12%
AA3.86%
Debt Rating Profile (% of Debt)
9.7
10.7
11.7
12.7
13.7
14.7
15.7
16.7
Mar‐09
Jul‐09
Oct‐09
Jan‐10
Apr‐10
Jul‐10
Oct‐10
Jan‐11
Apr‐11
Jul‐11
Oct‐11
Jan‐12
Apr‐12
Jul‐12
Oct‐12
Jan‐13
Apr‐13
Jul‐13
Oct‐13
Jan‐14
Apr‐14
Jul‐14
Oct‐14
Jan‐15
NAV/U
NIT (Rs)
NAV Performance (Since Inception)NAV Benchmark
Modified Duration ‐ 3.50 yrs
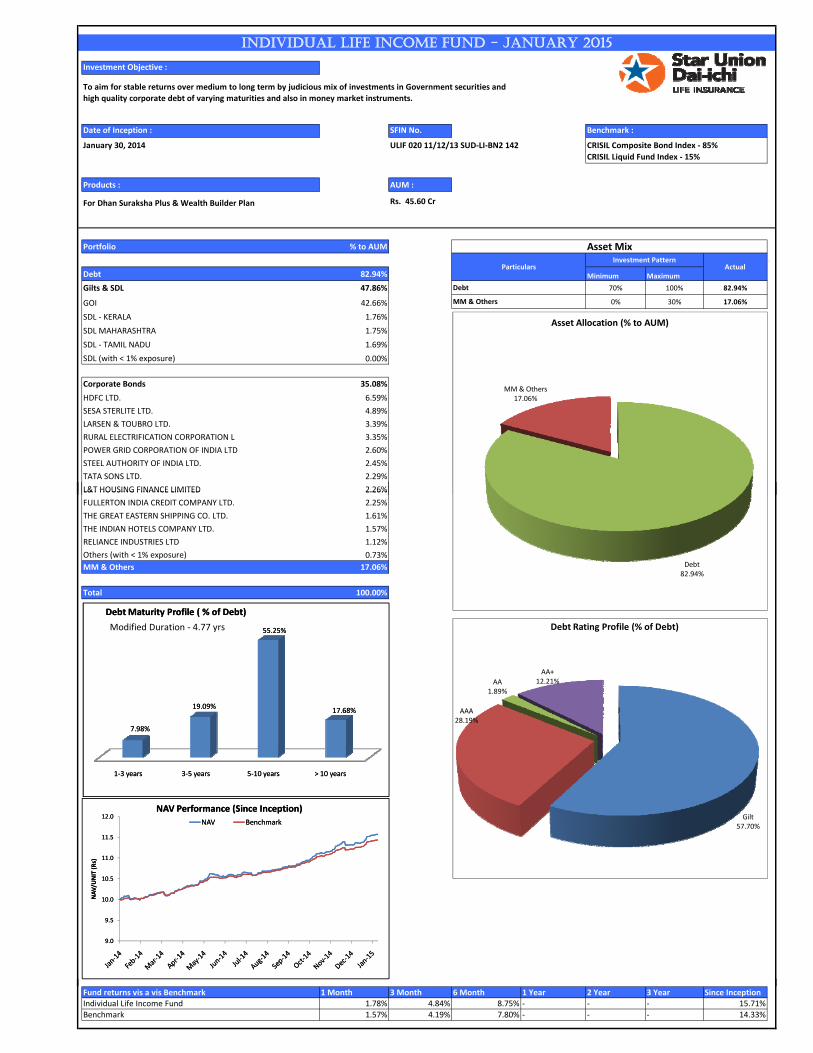
Investment Objective :
Date of Inception : SFIN No.
January 30, 2014 ULIF 020 11/12/13 SUD‐LI‐BN2 142
Products : AUM :
Rs. 45.60 Cr
Portfolio % to AUM
`
Debt 82.94% Minimum Maximum
Gilts & SDL 47.86% 70% 100% 82.94%
GOI 42.66% 0% 30% 17.06%
SDL ‐ KERALA 1.76%
SDL MAHARASHTRA 1.75%
SDL ‐ TAMIL NADU 1.69%
SDL (with < 1% exposure) 0.00%
Corporate Bonds 35.08%
HDFC LTD. 6.59%
SESA STERLITE LTD. 4.89%
LARSEN & TOUBRO LTD. 3.39%
RURAL ELECTRIFICATION CORPORATION L 3.35%
POWER GRID CORPORATION OF INDIA LTD 2.60%
STEEL AUTHORITY OF INDIA LTD. 2.45%
TATA SONS LTD. 2.29%
L&T HOUSING FINANCE LIMITED 2.26%
To aim for stable returns over medium to long term by judicious mix of investments in Government securities and
high quality corporate debt of varying maturities and also in money market instruments.
Benchmark :
CRISIL Composite Bond Index ‐ 85%
INDIVIDUAL LIFE INCOME FUND - JANUARY 2015
CRISIL Liquid Fund Index ‐ 15%
MM & Others
For Dhan Suraksha Plus & Wealth Builder Plan
Asset Mix
ParticularsInvestment Pattern
Actual
Debt
MM & Others17.06%
Asset Allocation (% to AUM)
L&T HOUSING FINANCE LIMITED 2.26%
FULLERTON INDIA CREDIT COMPANY LTD. 2.25%
THE GREAT EASTERN SHIPPING CO. LTD. 1.61%
THE INDIAN HOTELS COMPANY LTD. 1.57%
RELIANCE INDUSTRIES LTD 1.12%
Others (with < 1% exposure) 0.73%
MM & Others 17.06%
Total 100.00%
Debt82.94%
MM & Others17.06%
Asset Allocation (% to AUM)
Gilt57.70%
AAA28.19%
AA1.89%
AA+12.21%
Debt Rating Profile (% of Debt)
1‐3 years 3‐5 years 5‐10 years > 10 years
7.98%
19.09%
55.25%
17.68%
Debt Maturity Profile ( % of Debt)
9.0
9.5
10.0
10.5
11.0
11.5
12.0
NAV/U
NIT (Rs)
NAV Performance (Since Inception)
NAV Benchmark
Modified Duration ‐ 4.77 yrs
Fund returns vis a vis Benchmark 1 Month 3 Month 6 Month 1 Year 2 Year 3 Year Since InceptionIndividual Life Income Fund 1.78% 4.84% 8.75% ‐ ‐ ‐ 15.71%Benchmark 1.57% 4.19% 7.80% ‐ ‐ ‐ 14.33%
Debt82.94%
MM & Others17.06%
Asset Allocation (% to AUM)
Gilt57.70%
AAA28.19%
AA1.89%
AA+12.21%
Debt Rating Profile (% of Debt)
1‐3 years 3‐5 years 5‐10 years > 10 years
7.98%
19.09%
55.25%
17.68%
Debt Maturity Profile ( % of Debt)
9.0
9.5
10.0
10.5
11.0
11.5
12.0
NAV/U
NIT (Rs)
NAV Performance (Since Inception)
NAV Benchmark
Modified Duration ‐ 4.77 yrs
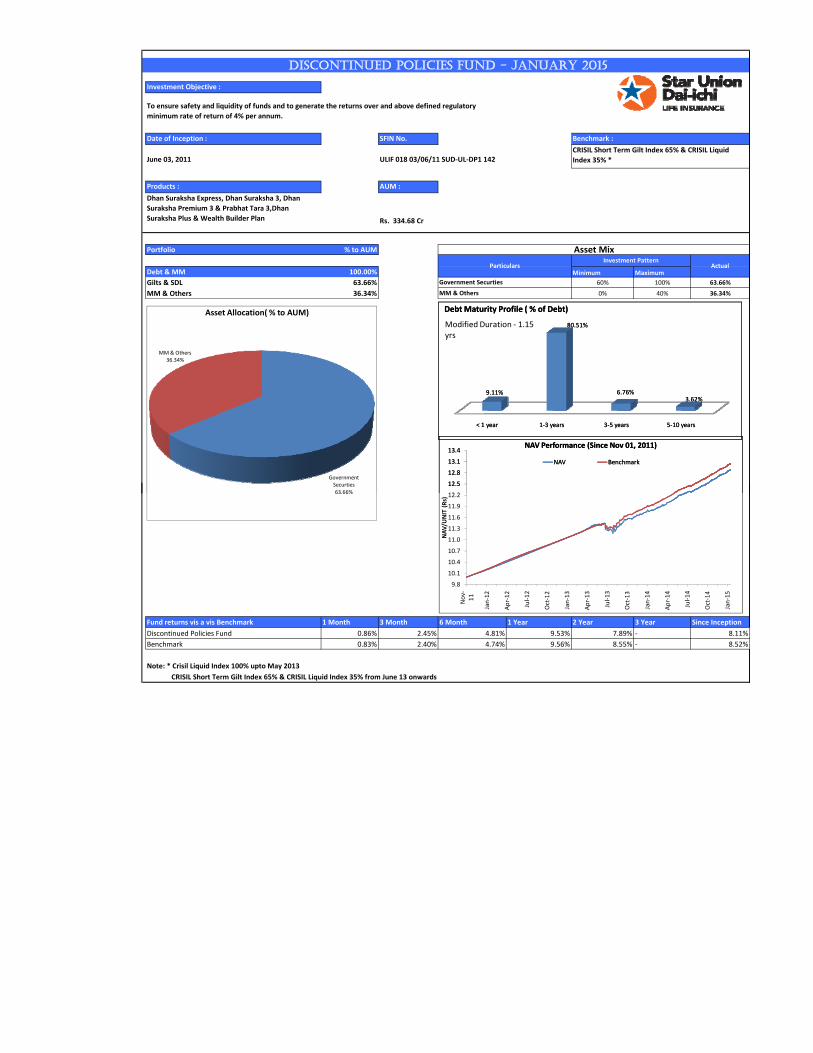
Investment Objective :
Date of Inception : SFIN No. Benchmark :
June 03, 2011 ULIF 018 03/06/11 SUD‐UL‐DP1 142
Products : AUM :
Dhan Suraksha Express, Dhan Suraksha 3, Dhan
Suraksha Premium 3 & Prabhat Tara 3,Dhan
Suraksha Plus & Wealth Builder Plan Rs. 334.68 Cr
Portfolio % to AUM
Debt & MM 100.00% Minimum Maximum
Gilts & SDL 63.66% 60% 100% 63.66%
MM & Others 36.34% 0% 40% 36.34%
DISCONTINUED POLICIES FUND - JANUARY 2015
Government Securties
MM & Others
To ensure safety and liquidity of funds and to generate the returns over and above defined regulatory
minimum rate of return of 4% per annum.
Asset Mix
CRISIL Short Term Gilt Index 65% & CRISIL Liquid
Index 35% *
ParticularsInvestment Pattern
Actual
Government Securties63.66%
MM & Others36.34%
Asset Allocation( % to AUM)
12 2
12.5
12.8
13.1
13.4NAV Performance (Since Nov 01, 2011)
NAV Benchmark
< 1 year 1‐3 years 3‐5 years 5‐10 years
9.11%
80.51%
6.76%3.62%
Debt Maturity Profile ( % of Debt)
Modified Duration ‐ 1.15 yrs
Fund returns vis a vis Benchmark 1 Month 3 Month 6 Month 1 Year 2 Year 3 Year Since Inception
Discontinued Policies Fund 0.86% 2.45% 4.81% 9.53% 7.89% ‐ 8.11%
Benchmark 0.83% 2.40% 4.74% 9.56% 8.55% ‐ 8.52%
Note: * Crisil Liquid Index 100% upto May 2013
CRISIL Short Term Gilt Index 65% & CRISIL Liquid Index 35% from June 13 onwards
Government Securties63.66%
MM & Others36.34%
Asset Allocation( % to AUM)
9.8
10.1
10.4
10.7
11.0
11.3
11.6
11.9
12.2
12.5
12.8
13.1
13.4
Nov‐
11
Jan‐12
Apr‐12
Jul‐12
Oct‐12
Jan‐13
Apr‐13
Jul‐13
Oct‐13
Jan‐14
Apr‐14
Jul‐14
Oct‐14
Jan‐15
NAV/U
NIT (Rs)
NAV Performance (Since Nov 01, 2011)
NAV Benchmark
< 1 year 1‐3 years 3‐5 years 5‐10 years
9.11%
80.51%
6.76%3.62%
Debt Maturity Profile ( % of Debt)
Modified Duration ‐ 1.15 yrs
Risk Factors
• This document has been prepared for providing general information only.
• Unit Linked Life Insurance products are different from traditional insurance products and are subject to various risk factors.
• Unit linked policies are subject to market risks associated with capital markets and NAVs of units may go up or down based on the performance of fund and factors influencing the capital market and the customers have to consider this aspect while taking any decision.
• Customers should take into account their personal investment objectives, risk appetite and other aspects of their financial situation before making an investment decision.
• Customers are advised to note that the details are based on past performance and are not indicative of its future prospects or returns.
• SUD Life shall not be responsible for any losses caused or any claims that arise due to investments made based on this document.
• All efforts have been made to ensure accuracy of the contents of this document, however, SUD Life shall not be held responsible for any errors or omissions.
Disclaimers related to Benchmark Indices
CRISIL Composite Bond Index and CRISIL Liquid Fund Index
CRISIL has taken due care and caution in compilation of data. Information has been obtained by CRISIL from sources it considers reliable. However, CRISIL does not guarantee the accuracy, adequacy or completeness of the information and is not responsible for any errors or omissions or for the results obtained from the use of such information. CRISIL is not responsible for any errors in data reproduction. CRISIL especially states that it has no financial liability whatsoever to the subscribers/ users/ transmitters/ distributors of this bulletin.
CNX NIFTY
“The Individual Life, Pension Life, Individual Apex Life Pension Apex Life funds, Blue Chip Equity Fund, Growth Plus Fund, Balanced Plus Fund and Individual Life Express Balanced Fund related to Equity, Growth and Balanced schemes, offered by SUD Life Insurance Co. Ltd are not sponsored, endorsed, sold or promoted by India Index Services & Products Limited ("IISL").
Neither IISL nor CNX Nifty and its affiliates makes any representation or warranty, express or implied (including warranties of merchantability or fitness for particular purpose or use) to the owners of aforesaid schemes or any member of the public regarding the advisability of investing in securities generally or in aforesaid schemes linked to CNX Nifty Index or particularly in the ability of the said Index to track general stock market performance in India”.