Fact Sheet Petrobras - 2010 - English
2
Company Profile Competitive Advantages The volume of proved oil and gas reserves and the ongoing success rate in the company’s exploration results have afforded Petrobras a prominent position and growth in the industry. Petrobras’ performance indicators in 2010 include: average oil and gas production of 2.6 million barrels per day; 16 refineries; 130,2 thousand square kilometers of exploration areas, with more than 15,000 producing wells; 132 production platforms; a fleet of 52 own vessels; 48 land and sea terminals and 8,477 service stations. In Brazil, Petrobras has the leadership in all segments of the value chain and the company’s growing production is fully supported by its discoveries. This dominant position combined with the strong local demand in one of the fastest growing global markets enhances the company’s logistical synergies and credit quality. FACT SHEET Founded in 1953, Petrobras is a publicly traded corporation operating in an integrated manner in the following segments of the oil, gas, and energy industry: exploration and production; downstream, marketing, transportation and petrochemicals; distribution; natural gas, energy and biofuels. Acknowledged as the leader in deep and ultra-deep water exploration and production, Petrobras is currently the world’s third largest energy company (source: PFC Energy, 2010), and the best managed company in Latin America (source: Euromoney, 2010). 10% - RTM 77% - E&P 4% - G&P 3% -Distribution 6% - International Dividend Payout Adjusted EBITDA: US$ 32.6 billion (2010) Dividends (US$) Dividends / Net Income US$ Million 1,000 2,000 3,000 4,000 5,000 6,000 7,000 8,000 20% 25% 30% 35% 40% 29% 28% 22% 29% 35% 2010 2006 2007 2008 2009 Net Income 2010 US$ Million 2006 2007 2008 2009 5,000 10,000 15,000 20,000 12.826 13.138 18.879 15.504 19.184 Net Income The 2010-2014 Business Plan provides for investments of $224 billion. Of this total, $212.3 billion are being allocated to projects in Brazil and a further $11.7 billion to overseas activities. The focus will be on the Exploration and Production segment, which will get $118 billion (Brazil and International), for a total of 53% of the investments. Of this amount, $33 billion will be set aside to develop the pre-salt alone, where average production is expected to be 241,000 bpd in 2014. The oil and natural gas production projected for 2014 is expected to top at 3.9 million boed, of which 3.6 million boed will represent the domestic production. Growth Strategy 2010-2014 Business Plan 1% 1% 2% 2% 8% 33% US$ 224.1 billion 53% International 5% Brazil 95% Petrochemicals E&P RTM G&P Corporate Biofuels Distribution Consolidated Financial Results In 2010, Petrobras reported a net profit of $19.184 billion, up 23,73% from 2009. In the period, EBITDA reached $32,6 billion, while investments totaled $45 billion. In October 2010, the Company completed a global public offering of common and preferred shares that resulted in a capital increase of $70,005 billion. The proceeds were allocated to pay for the Transfer of Rights Agreement and to finance the Business Plan. Net Income EBITDA Net Debt Shareholders Equity Net Debt / Net Capitalization Net Debt/EBITDA 18.879 31.083 20.624 61.909 25% 0,66 15.504 28.982 40.963 94.058 30% 1,41 19.184 32.626 36.701 181.494 17% 1,12 (Million US$) 2008 2009 2010
-
Upload
petrobras -
Category
Investor Relations
-
view
4.602 -
download
2
Transcript of Fact Sheet Petrobras - 2010 - English
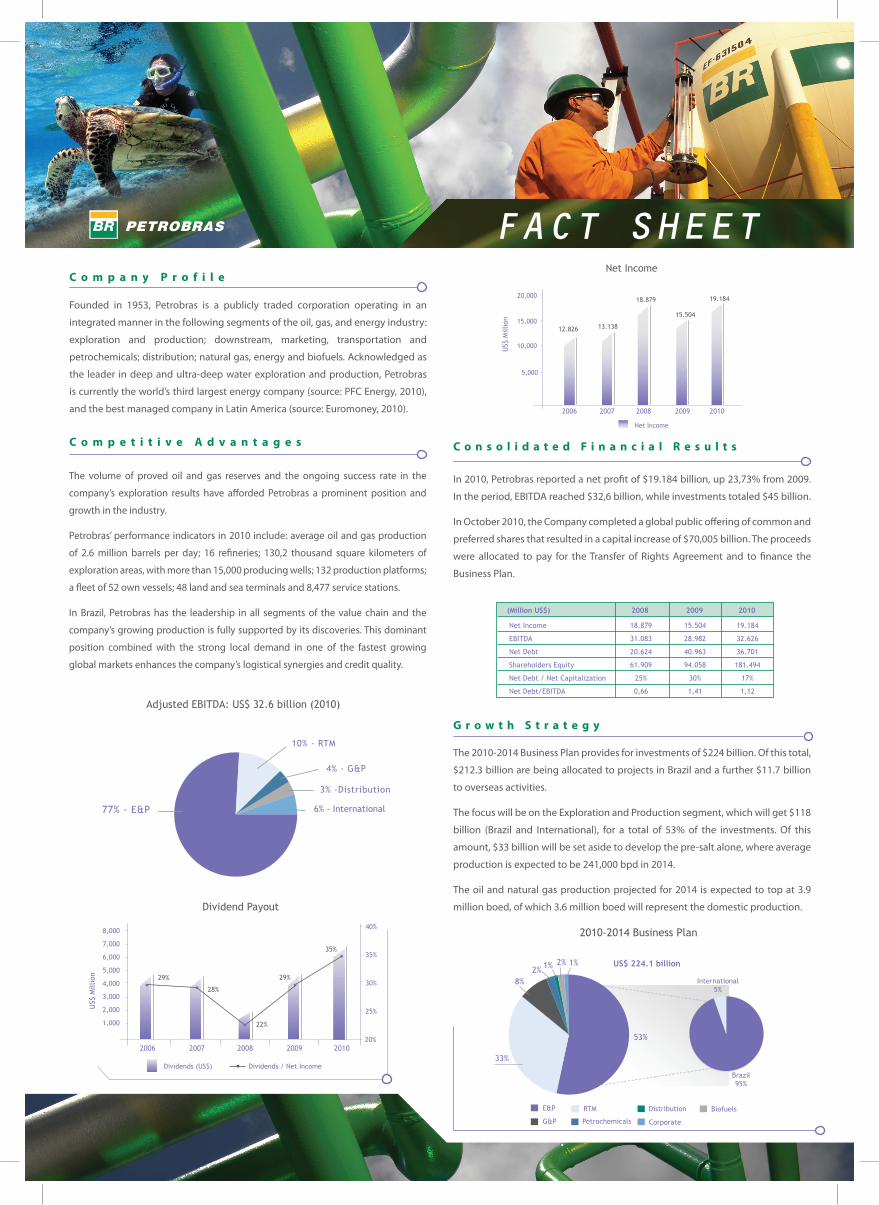
C o m p a n y P r o f i l e
C o m p e t i t i v e A d v a n t a g e s
The volume of proved oil and gas reserves and the ongoing success rate in the
company’s exploration results have afforded Petrobras a prominent position and
growth in the industry.
Petrobras’ performance indicators in 2010 include: average oil and gas production
of 2.6 million barrels per day; 16 refineries; 130,2 thousand square kilometers of
exploration areas, with more than 15,000 producing wells; 132 production platforms;
a fleet of 52 own vessels; 48 land and sea terminals and 8,477 service stations.
In Brazil, Petrobras has the leadership in all segments of the value chain and the
company’s growing production is fully supported by its discoveries. This dominant
position combined with the strong local demand in one of the fastest growing
global markets enhances the company’s logistical synergies and credit quality.
FACT SHEET
Founded in 1953, Petrobras is a publicly traded corporation operating in an
integrated manner in the following segments of the oil, gas, and energy industry:
exploration and production; downstream, marketing, transportation and
petrochemicals; distribution; natural gas, energy and biofuels. Acknowledged as
the leader in deep and ultra-deep water exploration and production, Petrobras
is currently the world’s third largest energy company (source: PFC Energy, 2010),
and the best managed company in Latin America (source: Euromoney, 2010).
10% - RTM
77% - E&P
4% - G&P
3% -Distribution
6% - International
Dividend Payout
Adjusted EBITDA: US$ 32.6 billion (2010)
Dividends (US$) Dividends / Net Income
US$
Mill
ion
1,000
2,000
3,000
4,000
5,000
6,000
7,000
8,000
20%
25%
30%
35%
40%
29%
28%
22%
29%
35%
20102006 2007 2008 2009
Net Income
2010
US$
Mill
ion
2006 2007 2008 2009
5,000
10,000
15,000
20,000
12.826 13.138
18.879
15.504
19.184
Net Income
The 2010-2014 Business Plan provides for investments of $224 billion. Of this total,
$212.3 billion are being allocated to projects in Brazil and a further $11.7 billion
to overseas activities.
The focus will be on the Exploration and Production segment, which will get $118
billion (Brazil and International), for a total of 53% of the investments. Of this
amount, $33 billion will be set aside to develop the pre-salt alone, where average
production is expected to be 241,000 bpd in 2014.
The oil and natural gas production projected for 2014 is expected to top at 3.9
million boed, of which 3.6 million boed will represent the domestic production.
G r o w t h S t r a t e g y
2010-2014 Business Plan
1%1%2%2%
8%
33%
US$ 224.1 billion
53%
International5%
Brazil95%
Petrochemicals
E&P RTM G&P
Corporate
BiofuelsDistribution
C o n s o l i d a t e d F i n a n c i a l R e s u l t s
In 2010, Petrobras reported a net profit of $19.184 billion, up 23,73% from 2009.
In the period, EBITDA reached $32,6 billion, while investments totaled $45 billion.
In October 2010, the Company completed a global public offering of common and
preferred shares that resulted in a capital increase of $70,005 billion. The proceeds
were allocated to pay for the Transfer of Rights Agreement and to finance the
Business Plan.
Net Income
EBITDA
Net Debt
Shareholders Equity
Net Debt / Net Capitalization
Net Debt/EBITDA
18.879
31.083
20.624
61.909
25%
0,66
15.504
28.982
40.963
94.058
30%
1,41
19.184
32.626
36.701
181.494
17%
1,12
(Million US$) 2008 2009 2010

In 2010, an average of 90% of the refi ning capacity was used. Sales on the Brazilian
market last year were 13% higher than those in 2009 at 2,378,000 barrels per day.
Oil products sales increased 11% vs. 2009, surpassing the growth of Brazilian
economy (7%). There was also a strong growth in natural gas sales (33%) and an
increase of oil exports due to the production growth.
The proved oil and natural gas reserves amounted to 15.985 billion boe in 2010,
according to the SPE criterion, representing a 5% growth compared to 2009.
Petrobras maintains its goal of increasing reserves at a faster pace than production
and of reaching a minimum 100% Reserve Replacement Index (RRI). In 2010, the
RRI was 229%. As a result, according to the SPE criterion, the Reserve/Production
ratio stood at 18,4 years.
Last year Petrobras invested US$ 3,4 billion in international activities aimed
at growing production in the deep-water regions. The Company currently
operates on five continents and in 28 countries, focusing principally on the
United States and on the west coast of Africa.
In 2010, Petrobras invested US$ 402,2 million in social, environmental, cultural,
and sports projects in Brazil and abroad. Since 2006, Petrobras has been listed
on the Dow Jones Sustainability World Index (DSJI), the most important of its
category, recognition of the company’s socio-environmental responsibility and
commitment. It should be pointed out that the company has been a signatory to
the UN’s Global Compact since 2003.
O p e r a t i n g D a t a
I n t e r n a t i o n a l P e r f o r m a n c e
S o c i a l a n d E n v i r o n m e n t a l R e s p o n s i b i l i t y
C o n t a c t s
www.petrobras.com.br/irE-mail: [email protected]: Av. República do Chile, 65, sala 2202-B, CentroRio de janeiro - RJ / ZIP: 20031-912Telephones: 0800-282-1540 / (21) 3224-1510 / 3224-9947
FACT SHEET
E q u i t y p e r f o r m a n c e
Ticker* PETR4 PETR3 PBRA PBR
Last Price 27,29 30,55 34,17 37,84
Maximum 12 month 41,81 37,50 43,82 48,90
Minimum 12 month 24,16 26,68 28,63 31,90
*December, 31 2010
Preferred
BM&F Bovespa (R$ per stock) NY SE (US$ per ADR**)
Commom CommomPreferred
P r e - s a l t
Petrobras, the global leader in exploration and production in deep and ultra-deep
waters, made one of the biggest discoveries in recent times in the oil industry: the
pre-salt area, which potentially ranks Brazil among the countries with the largest
oil and gas reserves in the world.
In the Lula (previously Tupi) and Cernambi (previously Iracema) fi elds, and in
the Iara, Guará, and Parque das Baleias blocks alone, the recoverable volume is
estimated between 8.1 and 9.6 billion barrels of oil equivalent (boe). This amount,
added to the right to explore a volume of 5 billion boe acquired through the
Transfer of Rights Agreement, may more than double the current Petrobras
reserves. Prospecting at a depth of 5,600 meters from the surface of the sea,
cutting through a 2,000-meter-thick layer of salt, and operating at a distance of
nearly 230 km off the coastline, the company had 100% success rate in all wells
drilled in the Santos Basin pre-salt area.
In October 2010, the production started at the Lula Field, and in last December,
the commerciality of Lula and Cernambi fi elds were declared, considering a total
recoverable volume of 8.3 billion boe. Also in December, the extended well test
(EWT) got underway in the Guará area.
Northeast Carioca
North Guará
Iara Horst
Libra
South Cernambi
P7 Lula Pilot
IG1 Lula Pilot
South Lula
Transfer of Rights
South Guará
Rio de Janeiro
Under Concession
Thou
s bo
e/da
y
Oil and Gas Production
Oil, NLG and Condensate Natural Gas Total
2.400
2.2972.301
2.5262.583
1.97
8
1.91
8
1.92
0 2.11
3
2.15
642
7
413
422
383
377
20102006 2007 2008 2009