Fact Sheet: Paper Nautical Charts Accuracy and reliability ...
6
Page | 1 Copyright © Commonwealth of Australia Jan 2020 Fact Sheet: Paper Nautical Charts Accuracy and reliability of Paper Nautical Charts How accurate are nautical charts? How much faith can be placed in them? Unfortunately, the answer is quite complex – far more complex than simply saying one chart is accurate whilst another is not. However, having the necessary skills should be essential for any mariner venturing into unfamiliar waters. All charts, whether paper or electronic, contain data which varies in quality due to the age and accuracy of individual surveys. In general, remote areas away from shipping routes tend to be less well surveyed, and less frequently, while areas of high commercial traffic are re-surveyed frequently to very high levels of accuracy, particularly where under-keel clearances are small. It is quite accurate to consider a chart as a jigsaw of individual surveys pieced together to form a single image. Zones of Confidence Electronic Navigation Charts (ENC), and Paper Nautical Charts (PNC) produced by the AHO, use a common ‘Zones of Confidence’ system to categorise the accuracy and reliability of content in those charts. However, as the categorisation method uses different symbology in each format, accuracy and reliability of ENC is covered by a separate Fact Sheet, as well as by a separate chapter within AHP20 Mariners Handbook for Australian Waters. Both AHP20, and the separate chapter ‘supplement’ on accuracy and reliability of ENC, can be downloaded from the AHO website: www.hydro.gov.au/prodserv/publications/ahp20.htm On PNC the Zones of Confidence information is contained in a small diagram, usually in the corner of the chart, along with table detailing the various attributes. On PNC the categories are denoted by letters, with good modern surveys generally categorised as ‘A1’ or ‘A2’, relatively modern and fair surveys as ‘B’, while poorly surveyed and unsurveyed areas are categorised as ‘C’ or ‘D’. Typical ZOC diagram Zone Of Confidence categories
Transcript of Fact Sheet: Paper Nautical Charts Accuracy and reliability ...

Page | 1
Copyright © Commonwealth of Australia
Jan 2020
Fact Sheet: Paper Nautical Charts
Accuracy and reliability of Paper Nautical Charts
How accurate are nautical charts? How much faith can be placed in them? Unfortunately, the answer is quite complex – far more complex than simply saying one chart is accurate whilst another is not. However, having the necessary skills should be essential for any mariner venturing into unfamiliar waters.
All charts, whether paper or electronic, contain data which varies in quality due to the age and accuracy of individual surveys. In general, remote areas away from shipping routes tend to be less well surveyed, and less frequently, while areas of high commercial traffic are re-surveyed frequently to very high levels of accuracy, particularly where under-keel clearances are small. It is quite accurate to consider a chart as a jigsaw of individual surveys pieced together to form a single image.
Zones of Confidence
Electronic Navigation Charts (ENC), and Paper Nautical Charts (PNC) produced by the AHO, use a common ‘Zones of Confidence’ system to categorise the accuracy and reliability of content in those charts. However, as the categorisation method uses different symbology in each format, accuracy and reliability of ENC is covered by a separate Fact Sheet, as well as by a separate chapter within AHP20 Mariners Handbook for Australian Waters. Both AHP20, and the separate chapter ‘supplement’ on accuracy and reliability of ENC, can be downloaded from the AHO website:
www.hydro.gov.au/prodserv/publications/ahp20.htm
On PNC the Zones of Confidence information is contained in a small diagram, usually in the corner of the chart, along with table detailing the various attributes. On PNC the categories are denoted by letters, with good modern surveys generally categorised as ‘A1’ or ‘A2’, relatively modern and fair surveys as ‘B’, while poorly surveyed and unsurveyed areas are categorised as ‘C’ or ‘D’.
Typical ZOC diagram Zone Of Confidence categories

Page | 2
Copyright © Commonwealth of Australia
Jan 2020
Early surveys
Before the 1940s the position of the survey ship or boat was determined by measuring angles with a sextant between large flags erected on the shore, while depths were measured with either a lead-line (a marked and tagged rope with a lead weight) to measure depth beneath the ship, or very early echo-sounders. These limitations mean that positions in coastal areas may be out by up to 500 metres, even when shifted to fit a modern coastline, while it is quite possible that the lead-line or sounding line may have passed between two shoals that consequently remained undetected. Early electronic positioning systems became more common from the 1950s, improving horizontal accuracy to 100-200 metres.
The common factor for all these early surveys is the relatively low confidence that these separate soundings did not miss anything between the survey lines – this was frequently based upon the surveyor’s intuition and that the regular sounding pattern was sufficient to at least detect the edge of a shoal. However, the observation and recording of features rising to or near the sea surface was usually very good, even though the positioning may be poor by modern standards. Overall, confidence that there were no undetected ‘surprises’ between the lines was relatively low, especially in reef, rocky and sandwave areas.
In older surveys such as the 1945 survey below, the ship measured a series of individual depths as it steamed along each line of soundings. Confidence that these separate soundings did not miss anything between the lines was frequently based upon the surveyor’s intuition and that the regular sounding pattern was sufficient to at least detect the edge of a shoal. These surveys are typically categorised as ‘depth anomalies may be expected’.
1945 single beam survey, approaches to Darwin

Page | 3
Copyright © Commonwealth of Australia
Jan 2020
1971 – 2000
In contrast, those surveys dating from around 1970 onward are progressively more reliable. By then, use of electronic positioning systems had improved horizontal accuracies to around 50-100 metres, while the use of echo sounders combined with sonar provided a significantly greater level of confidence that features between the individual lines of sounding were detected and did not remain unexamined. The RAN first included use of a towed side scan sonar as part of a survey in 1971.
On each nautical chart, such as the 2006 edition of Aus 835, the accuracy and reliability of the information used to compile the chart is shown on a Zones of Confidence (ZOC) Diagram. Within official Electronic Navigational Charts (ENCs), the same information is shown as a layer which can be switched on and off by the mariner.
Modern surveys
However, modern surveys are quite different. Equipment performance has improved allowing most surveys from the 1970s and later to be categorised as ‘Uncharted features hazardous to surface navigation are not expected’. Current multi-beam systems can achieve 100% coverage, leaving nothing greater than 1 to 2m objects potentially undetected. The beams from these echo-sounders spread like a fan beneath the ship and completely sweep the seabed both directly below the ship and to either side. Aircraft using lasers can achieve similar results. Multi-beam systems lay down thousands of soundings every minute as close as 30 centimetres apart and are typically categorised as ‘All significant seafloor features detected’. In these areas an object the size of a 200 litre oil drum is considered significant.
Modern multi-beam survey, approaches to Darwin
Page | 4
Copyright © Commonwealth of Australia
Jan 2020
Interpreting Zones Of Confidence
Zone Of Confidence assessments are made based upon four criteria, following which a single ZOC rating is derived for each area of differing quality, based upon the lowest individually assessed criteria for that area. Individual criteria are:
position accuracy
depth accuracy (in reference to what has been detected, not what might or might not have been missed)
seafloor coverage i.e. the certainty of feature detection (this is not related to depth accuracy, but relates only to what might or might not have been missed)
typical survey characteristics
Of these, the most important is the assessment of seafloor coverage, as this determines how much clearance should be maintained between a ship’s keel and the seabed in most areas, and where any additional precautions may need to be taken.
Each surveyed area will be assigned to one of five quality categories for assessed data (ZOC A1, A2, B, C, D), with a sixth category used for data which has not been assessed (ZOC U). The table shown on page 1 is an abbreviated version of the full table published by the International Hydrographic Organization. A copy may be found in AHP20 Mariners Handbook for Australian waters.
ZOC A1 and A2
Surveys within these categories have all met the requirements for full seabed search. Within these categories ZOC A1 requires very high accuracy surveys which are only achievable with recent technology.
ZOC A1 surveys cover only those areas requiring exceptionally stringent standards for special reasons, such as areas of minimal under-keel clearance in harbours and shallow channels.
ZOC A2 surveys are typically modern surveys of coastal shipping routes and port approach areas.
In both cases a very high degree of confidence can be had that there are no uncharted features between the charted depths and between other features already shown on the chart. In practical terms, mariners should make an allowance within their planning for an under-keel clearance at least equivalent to the quoted depth accuracy for that area. For a 10m draft ship this would be an allowance of at least 0.51m in a ZOC A1 area, and at least 1.2m in a ZOC A2 area. Additional allowances may need to be made to allow for movement of the ship and differences between static and dynamic draft.
All soundings of ZOC A1 and A2 quality are shown in italic on paper charts. All contours in these areas are shown as continuous and unbroken.
ZOC B
Surveys within this category have met practical requirements for seabed search. They are generally adequate for coastal navigation by surface vessels as undetected features are not expected, but may exist up to a certain size.
ZOC B typically includes very well conducted surveys in coastal and offshore areas, but generally conducted before the late 1990s. Many sea lanes regarded as adequately surveyed may carry a ZOC B classification. Some surveys are still conducted to this standard away from shipping routes.

Page | 5
Copyright © Commonwealth of Australia
Jan 2020
While the vertical accuracy of charted depths is the same as for ZOC A2, the difference is in the size of seabed objects which may not have been detected and therefore are not charted. Depending upon depth, these undetected features may range in height from 2m to 4m above the charted seabed. In general, this suggests an allowance of at least 5m under-keel clearance should be made in a ZOC B area. Additional allowances may need to be made to allow for differences between static and dynamic draft, as well as where the nature of the seabed is particularly irregular (such as a coral or rocky seabed), or subject to change (such as a sandwave area).
All depths of ZOC B quality and higher are shown in italic on paper charts. All contours in these areas are shown as continuous and unbroken.
ZOC C
This is a very broad category which covers a range of surveys, from those which may be very thorough but just fail to meet the higher accuracy ZOC B standard, through to data taken from significantly older planned and controlled surveys. The existence of uncharted features hazardous to surface navigation will vary from one area to another, but should be expected - a typical ZOC C survey is unlikely to have included a comprehensive sonar sweep to ascertain the presence of depth anomalies between adjacent survey lines, instead relying primarily upon the survey ship’s echo sounders only. Caution is therefore advised when navigating close to shore or adjacent reefs, or where the nature of the seabed appears likely to be irregular or subject to change.
At the upper end of the ZOC C category soundings of good horizontal and vertical accuracy are shown in italic on paper charts with depth contours shown as continuous and unbroken. However, caution should still be taken if navigating in any ZOC C area. If possible, ships should attempt to remain within the limits of regularly used routes.
At the lower end of the ZOC C category lie those controlled surveys which can best be described as “historic” - conducted to the standards of their time but limited by the technology of that era. In ZOC C areas depth anomalies should be expected and caution should be taken at all times. These surveys are generally considered to be inadequate by modern standards, particularly in depths of 30 metres or less.
ZOC D
Soundings in ZOC D areas are similarly sourced from historic surveys, but in this case those conducted with large distances between adjacent survey lines, or even simply soundings collected on an opportunity basis by ships undertaking routine passage. Soundings in ZOC D areas will always be shown as upright to denote that they are approximate, while depth contours may be broken or non-existent. In a ZOC D area an uncharted hazard be large enough to reach the sea surface.
ZOC D includes unsurveyed areas.
ZOC U
This category is used to indicate areas where information has not been assessed for accuracy. It is generally only used on small scale charts due to the difficulty in showing individual ZOC areas at this scale. Mariners should refer to the larger scale charts, particularly in coastal areas, to determine how much confidence they should have in any particular area.
Page | 6
Copyright © Commonwealth of Australia
Jan 2020
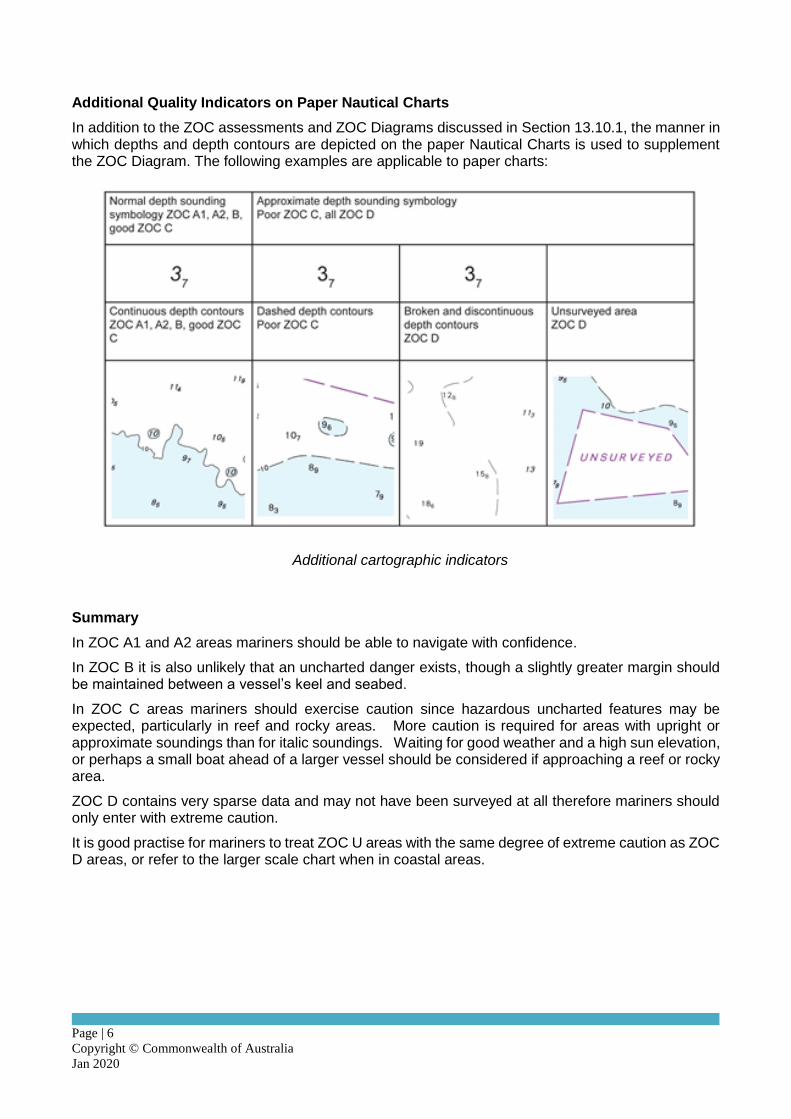
Additional Quality Indicators on Paper Nautical Charts
In addition to the ZOC assessments and ZOC Diagrams discussed in Section 13.10.1, the manner in which depths and depth contours are depicted on the paper Nautical Charts is used to supplement the ZOC Diagram. The following examples are applicable to paper charts:
Additional cartographic indicators
Summary
In ZOC A1 and A2 areas mariners should be able to navigate with confidence.
In ZOC B it is also unlikely that an uncharted danger exists, though a slightly greater margin should be maintained between a vessel’s keel and seabed.
In ZOC C areas mariners should exercise caution since hazardous uncharted features may be expected, particularly in reef and rocky areas. More caution is required for areas with upright or approximate soundings than for italic soundings. Waiting for good weather and a high sun elevation, or perhaps a small boat ahead of a larger vessel should be considered if approaching a reef or rocky area.
ZOC D contains very sparse data and may not have been surveyed at all therefore mariners should only enter with extreme caution.
It is good practise for mariners to treat ZOC U areas with the same degree of extreme caution as ZOC D areas, or refer to the larger scale chart when in coastal areas.