FACT SHEET - azdeq.govlegacy.azdeq.gov/environ/water/assessment/download/harquahala_f… · Ambient...
5
Arizona Department of Environmental Quality FACT SHEET Janice K. Brewer, Governor • Henry R. Darwin, Director Introduction A baseline groundwater quality study of the Harquahala basin was conducted from 2009 to 2014 by the Arizona Depart- ment of Environmental Quality (ADEQ) Ambient Groundwater Monitoring Pro- gram. ADEQ carried out this task pursu- ant to Arizona Revised Statutes §49-225 that mandates monitoring of waters of the state including its aquifers. The fact sheet is a synopsis of the ADEQ Open File Report 14-04. 1 Located 60 miles west of Phoenix along Interstate 10, the Harquahala ground- water basin contains approximately 766 square miles within La Paz and Maricopa counties (Map 1). 2 The basin consists of a broad alluvial plain bordered by rugged mountain ranges. Low-intensity livestock grazing is the predominant land use but there is irrigated agriculture in the northwest and, especially, in the south- east portion within the Harquahala Valley Irrigation District (HVID). Land ownership consists of federal lands (62 percent) managed by the Bureau of Land Man- agement, private land (25 percent), and State Trust lands (13 percent). There are no incorporated communities within the basin, which had a population of approxi- mately 600 people in 2000. 2 Hydrology The basin is drained by Centennial Wash, a tributary of the Gila River. Centennial Wash enters the basin from the northwest at the Harrisburg Valley “Narrows,” and runs southeast until exiting at Mullens Cut. 3 All washes are ephemeral, flowing only after heavy precipitation. Ground- water is used for irrigation with minor amounts used for public water, domestic, industrial, and stock uses. Since 1985, water from the Colorado River delivered Ambient Groundwater Quality of the Harquahala Basin: A 2009-2014 Baseline Study – June 2014 Janice K. Brewer, Governor • Henry R. Darwin, Director Publication Number: FS 14-09 Map 1 – Sample sites in the Harquahala basin are color- coded according to their water quality status. Based on these water quality results, ground- water in the basin is generally not suitable for drinking water use without proper treatment. Figure 1 – Agriculture is the largest water use in the basin with most farmland located in the Harquahala Valley Irrigation District (HVID). Irrigation needs are met by a combination of groundwater and, since 1985, surface water from the Colorado River provided by the Central Arizona Project (CAP) lateral shown by the Eagletail Mountains. (Map by Douglas Towne)
Transcript of FACT SHEET - azdeq.govlegacy.azdeq.gov/environ/water/assessment/download/harquahala_f… · Ambient...
Arizona Departmentof Environmental Quality
FACT SHEETJanice K. Brewer, Governor • Henry R. Darwin, Director
Introduction
A baseline groundwater quality study of the Harquahala basin was conducted from 2009 to 2014 by the Arizona Depart-ment of Environmental Quality (ADEQ) Ambient Groundwater Monitoring Pro-gram. ADEQ carried out this task pursu-ant to Arizona Revised Statutes §49-225 that mandates monitoring of waters of the state including its aquifers. The fact sheet is a synopsis of the ADEQ Open File Report 14-04.1
Located 60 miles west of Phoenix along Interstate 10, the Harquahala ground-water basin contains approximately 766 square miles within La Paz and Maricopa counties (Map 1).2 The basin consists of a broad alluvial plain bordered by rugged mountain ranges. Low-intensity livestock grazing is the predominant land use but there is irrigated agriculture in the northwest and, especially, in the south-east portion within the Harquahala Valley Irrigation District (HVID). Land ownership consists of federal lands (62 percent) managed by the Bureau of Land Man-agement, private land (25 percent), and State Trust lands (13 percent). There are no incorporated communities within the basin, which had a population of approxi-mately 600 people in 2000.2
Hydrology
The basin is drained by Centennial Wash, a tributary of the Gila River. Centennial Wash enters the basin from the northwest at the Harrisburg Valley “Narrows,” and runs southeast until exiting at Mullens Cut.3 All washes are ephemeral, flowing only after heavy precipitation. Ground-water is used for irrigation with minor amounts used for public water, domestic, industrial, and stock uses. Since 1985, water from the Colorado River delivered
Ambient Groundwater Quality of the Harquahala Basin:A 2009-2014 Baseline Study – June 2014
Janice K. Brewer, Governor • Henry R. Darwin, Director Publication Number: FS 14-09
Map 1 – Sample sites in the Harquahala basin are color-coded according to their water quality status. Based on these water quality results, ground-water in the basin is generally not suitable for drinking water use without proper treatment.
Figure 1 – Agriculture is the largest water use in the basin with most farmland located in the Harquahala Valley Irrigation District (HVID). Irrigation needs are met by a combination of groundwater and, since 1985, surface water from the Colorado River provided by the Central Arizona Project (CAP) lateral shown by the Eagletail Mountains.
(Map by Douglas Towne)
We advocate for Arizona’s environment.
We adhere to the highest standards of technical professionalism. We commit to the highest standardsof ethical behavior. We are committed to openness, honestyand transparency.
We foster relationships built on respect, courtesy and service.
We value creativity, innovationand performance.
We turn challenges into opportunities. We value our employees and work as a team.
Arizona Departmentof Environmental Quality
To protect and enhancepublic health and the environment
in Arizona.
To lead Arizona and the nation in protecting the environment and improving the quality of life for the people of our state.
OUR VISION
OUR MISSION
PRINCIPLES AND VALUES
FACT SHEET
2
via the Central Arizona Project (CAP) has supplemented irrigation and stock uses and is also recharged at the Vidler Water facility (Figure 1).2
The main aquifer is basin-fill alluvium composed of heterogeneous deposits of clay, silt, sand, and gravel. The aquifer is especially productive in the south-ern part of the basin where irrigation wells can yield up to 3,000 gallons per minute in the HVID (Figure 2).4 Basin-fill alluvium generally does not produce enough water for irrigation use in areas north of Interstate 10. In parts of the basin, overlying the coarse-grained de-posits are fine-grained beds composed mainly of clay, which can exceed 1,000 feet and create perched water zones.2 In the former agricultural area that is now part of the Vidler Recharge Project, wells produced water through alternating fine and coarse layers until encounter-ing conglomerate about 900 feet below land surface (bls).4 In the northwest part
from northwest to southeast parallel-ing Centennial Wash and discharged from the basin at Mullens Cut.3 Irriga-tion withdrawals halted groundwater outflow by 1957 and created a large cone of depression in the HVID by 1966. Declines in water level of as much as 27 feet per year and 325 feet overall occurred in wells by 1980.4 The intro-duction of CAP water in 1985 resulted in water level increases of up to 70 feet. The basin is still in hydrologic overdraft, however, because of limited recharge and the recent increase in groundwater pumping due to reduced availability of CAP water. Groundwater continues to move to the cone of depression from the edges of the basin (Figure 4). 2
Methods of Investigation
To characterize regional groundwater quality, samples were collected from 51 wells. These were used for irrigation (32 wells), domestic (eight wells), stock (six wells), public supply (three wells), and monitoring (two wells). Samples for inorganic constituents and oxygen and deuterium isotopes were collected from all 51 wells. Other samples collected
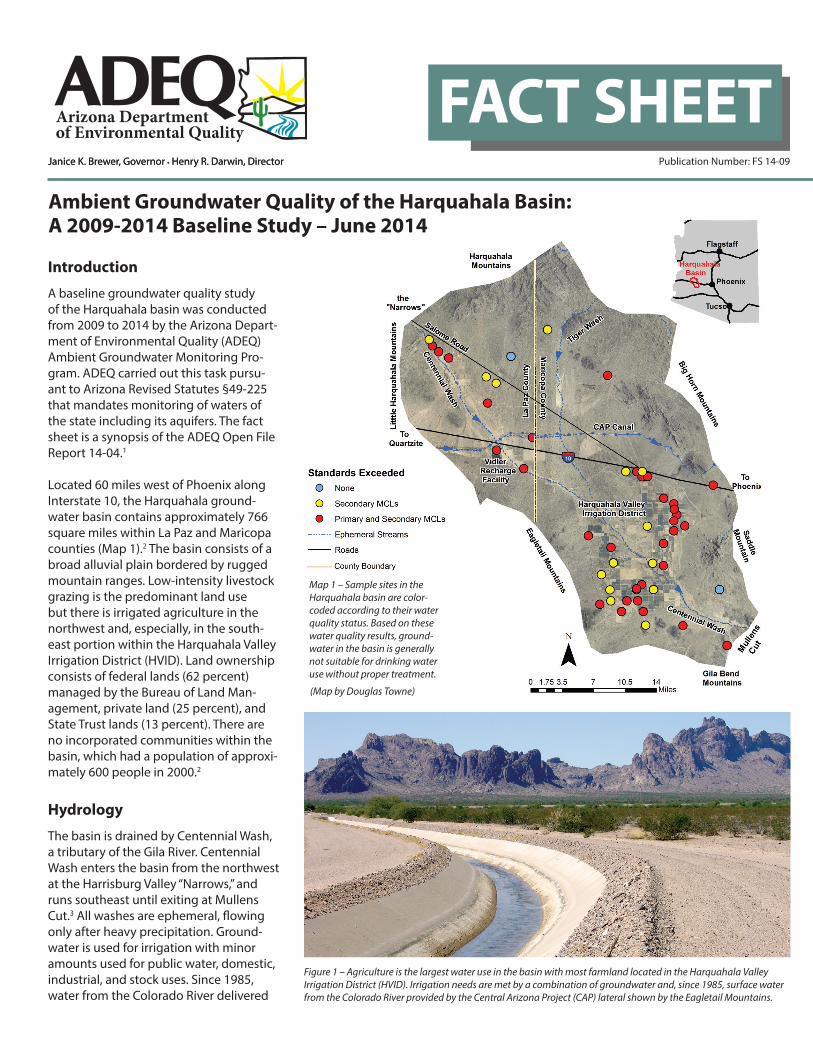
Figure 2 – Former ADEQ employee Susan Determann collects a sample from a 1,200 foot-deep irrigation well in the HVID. Groundwater pumping has recently increased in the HVID due to reduced availability of Colorado River water from the CAP.
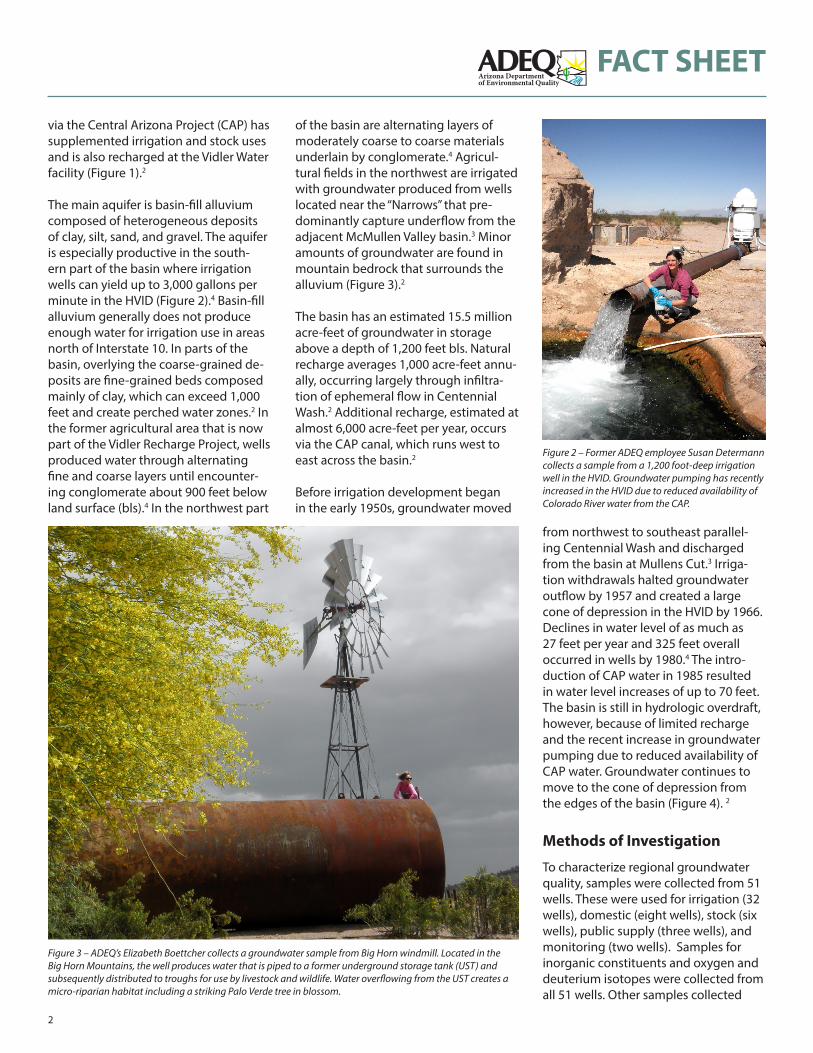
Figure 3 – ADEQ’s Elizabeth Boettcher collects a groundwater sample from Big Horn windmill. Located in the Big Horn Mountains, the well produces water that is piped to a former underground storage tank (UST) and subsequently distributed to troughs for use by livestock and wildlife. Water overflowing from the UST creates a micro-riparian habitat including a striking Palo Verde tree in blossom.
of the basin are alternating layers of moderately coarse to coarse materials underlain by conglomerate.4 Agricul-tural fields in the northwest are irrigated with groundwater produced from wells located near the “Narrows” that pre-dominantly capture underflow from the adjacent McMullen Valley basin.3 Minor amounts of groundwater are found in mountain bedrock that surrounds the alluvium (Figure 3).2
The basin has an estimated 15.5 million acre-feet of groundwater in storage above a depth of 1,200 feet bls. Natural recharge averages 1,000 acre-feet annu-ally, occurring largely through infiltra-tion of ephemeral flow in Centennial Wash.2 Additional recharge, estimated at almost 6,000 acre-feet per year, occurs via the CAP canal, which runs west to east across the basin.2
Before irrigation development began in the early 1950s, groundwater moved
We advocate for Arizona’s environment.
We adhere to the highest standards of technical professionalism. We commit to the highest standardsof ethical behavior. We are committed to openness, honestyand transparency.
We foster relationships built on respect, courtesy and service.
We value creativity, innovationand performance.
We turn challenges into opportunities. We value our employees and work as a team.
Arizona Departmentof Environmental Quality
To protect and enhancepublic health and the environment
in Arizona.
To lead Arizona and the nation in protecting the environment and improving the quality of life for the people of our state.
OUR VISION
OUR MISSION
PRINCIPLES AND VALUES
FACT SHEET
3
include nitrogen isotopes (34 wells), radon (31 wells) and radionuclide (10 wells). Sampling protocol followed the ADEQ Quality Assurance Project Plan (see www.azdeq.gov/function/programs/lab). The effects of sampling equipment and procedures were not significant based on quality assurance/quality control evaluations.
Water Quality Sampling Results
Groundwater sample results were compared with the Safe Drinking Water Act (SDWA) health and aesthetics-based water quality standards.5 Of the 51 wells sampled, only two sites met all drinking water quality standards.
Public drinking water systems must meet health-based, water quality stan-dards, called Primary Maximum Con-taminant Levels (MCLs), when supplying water to their customers. These enforce-able standards are based on a lifetime (70 years) consumption of two liters per day.5 Primary MCLs were exceeded at 36 of the 51 wells (76 percent). Constitu-ents exceeding Primary MCLs include nitrate (24 wells), arsenic (19 wells), fluoride (five wells), and gross alpha and uranium (one well each).
Public drinking water systems are encouraged by the SDWA to meet unenforceable, aesthetics-based water quality guidelines, called Secondary MCLs, when supplying water to their customers. Water exceeding Secondary MCLs may be unpleasant to drink and/or create unwanted cosmetic or laundry effects but is not considered a health concern.5 Secondary MCLs were ex-ceeded at 48 of the 51 wells (94 percent). Constituents exceeding Secondary MCLs include total dissolved solids (TDS) (48 wells), fluoride (38 wells), sulfate (19 wells), chloride (17 wells), pH-field (two wells), and iron (one well).
Radon is a naturally occurring, inter-mediate breakdown product from the radioactive decay of uranium-238 to lead-206. Of the 31 sites sampled for ra-don, none exceeded the proposed 4,000 picocuries per liter (pCi/L) standard that would apply if Arizona establishes a multimedia program to address the health risks from radon in indoor air.6 Twenty-five sites (81 percent) exceeded the proposed 300 pCi/L standard that would apply if Arizona does not develop a multimedia program.6
Groundwater Composition
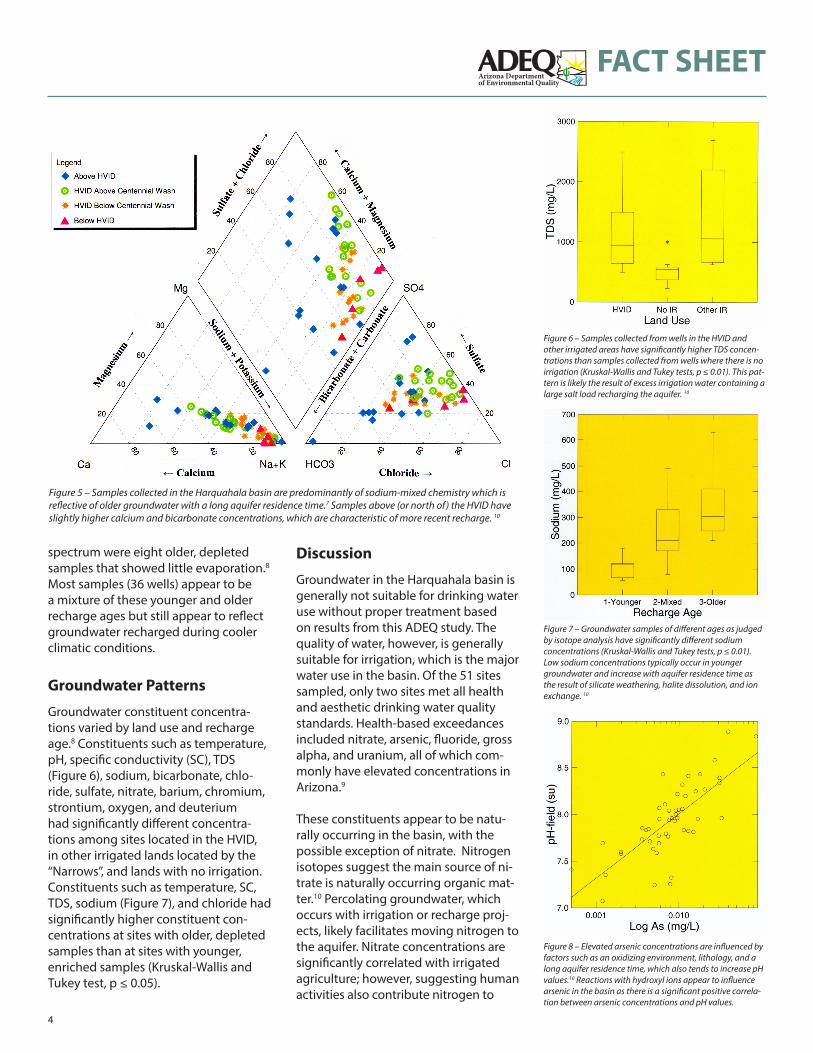
Groundwater chemistry in the basin is predominantly sodium-mixed (Figure 5). Other groundwater characteristics are summarized in Table 1.
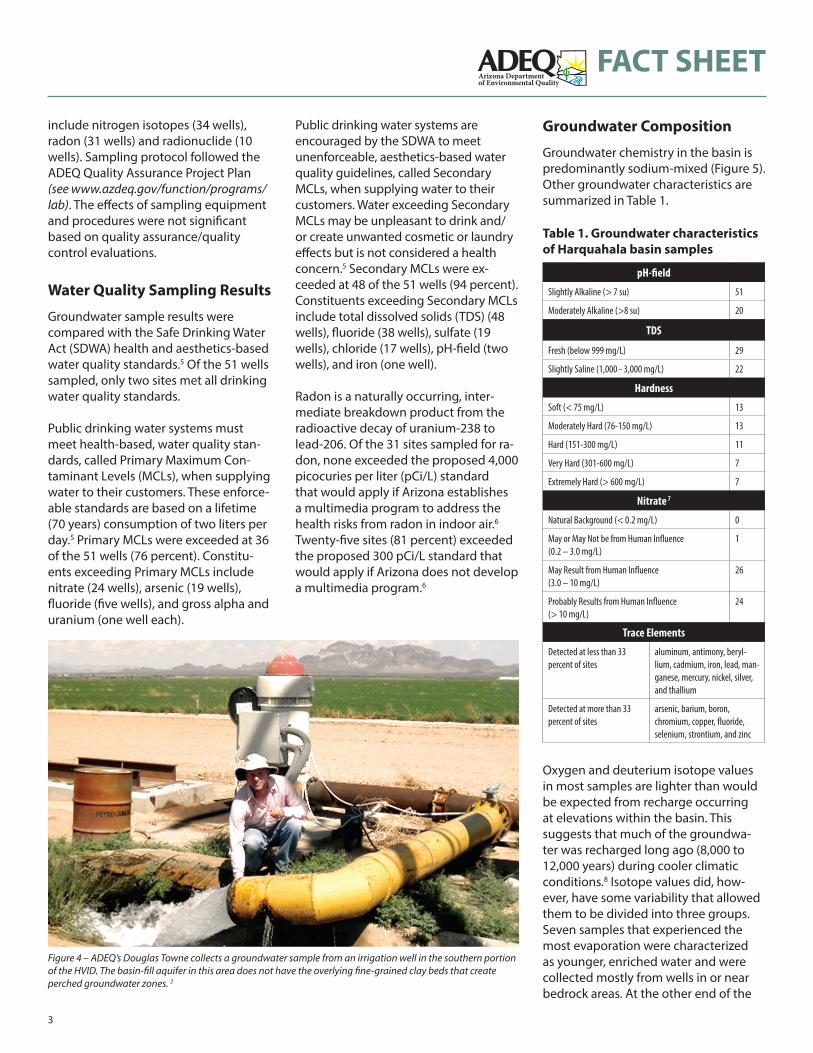
Figure 4 – ADEQ’s Douglas Towne collects a groundwater sample from an irrigation well in the southern portion of the HVID. The basin-fill aquifer in this area does not have the overlying fine-grained clay beds that create perched groundwater zones. 2
Table 1. Groundwater characteristics of Harquahala basin samples
pH-field
Slightly Alkaline (> 7 su) 51
Moderately Alkaline (>8 su) 20
TDS
Fresh (below 999 mg/L) 29
Slightly Saline (1,000 - 3,000 mg/L) 22
Hardness
Soft (< 75 mg/L) 13
Moderately Hard (76-150 mg/L) 13
Hard (151-300 mg/L) 11
Very Hard (301-600 mg/L) 7
Extremely Hard (> 600 mg/L) 7
Nitrate 7
Natural Background (< 0.2 mg/L) 0
May or May Not be from Human Influence(0.2 – 3.0 mg/L)
1
May Result from Human Influence(3.0 – 10 mg/L)
26
Probably Results from Human Influence(> 10 mg/L)
24
Trace Elements
Detected at less than 33 percent of sites
aluminum, antimony, beryl-lium, cadmium, iron, lead, man-ganese, mercury, nickel, silver, and thallium
Detected at more than 33 percent of sites
arsenic, barium, boron, chromium, copper, fluoride, selenium, strontium, and zinc
Oxygen and deuterium isotope values in most samples are lighter than would be expected from recharge occurring at elevations within the basin. This suggests that much of the groundwa-ter was recharged long ago (8,000 to 12,000 years) during cooler climatic conditions.8 Isotope values did, how-ever, have some variability that allowed them to be divided into three groups. Seven samples that experienced the most evaporation were characterized as younger, enriched water and were collected mostly from wells in or near bedrock areas. At the other end of the
We advocate for Arizona’s environment.
We adhere to the highest standards of technical professionalism. We commit to the highest standardsof ethical behavior. We are committed to openness, honestyand transparency.
We foster relationships built on respect, courtesy and service.
We value creativity, innovationand performance.
We turn challenges into opportunities. We value our employees and work as a team.
Arizona Departmentof Environmental Quality
To protect and enhancepublic health and the environment
in Arizona.
To lead Arizona and the nation in protecting the environment and improving the quality of life for the people of our state.
OUR VISION
OUR MISSION
PRINCIPLES AND VALUES
FACT SHEET
4
spectrum were eight older, depleted samples that showed little evaporation.8 Most samples (36 wells) appear to be a mixture of these younger and older recharge ages but still appear to reflect groundwater recharged during cooler climatic conditions.
Groundwater Patterns
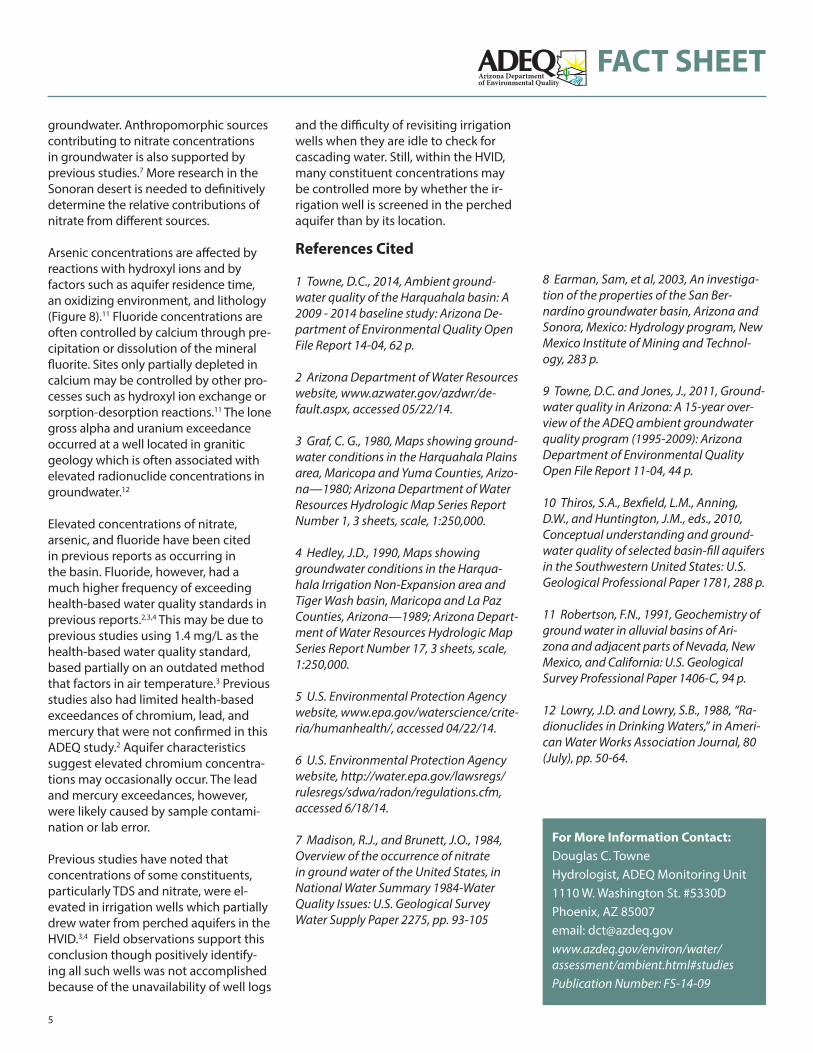
Groundwater constituent concentra-tions varied by land use and recharge age.8 Constituents such as temperature, pH, specific conductivity (SC), TDS (Figure 6), sodium, bicarbonate, chlo-ride, sulfate, nitrate, barium, chromium, strontium, oxygen, and deuterium had significantly different concentra-tions among sites located in the HVID, in other irrigated lands located by the “Narrows”, and lands with no irrigation. Constituents such as temperature, SC, TDS, sodium (Figure 7), and chloride had significantly higher constituent con-centrations at sites with older, depleted samples than at sites with younger, enriched samples (Kruskal-Wallis and Tukey test, p ≤ 0.05).
Figure 5 – Samples collected in the Harquahala basin are predominantly of sodium-mixed chemistry which is reflective of older groundwater with a long aquifer residence time.7 Samples above (or north of) the HVID have slightly higher calcium and bicarbonate concentrations, which are characteristic of more recent recharge. 10
Figure 7 – Groundwater samples of different ages as judged by isotope analysis have significantly different sodium concentrations (Kruskal-Wallis and Tukey tests, p ≤ 0.01). Low sodium concentrations typically occur in younger groundwater and increase with aquifer residence time as the result of silicate weathering, halite dissolution, and ion exchange. 10
Figure 8 – Elevated arsenic concentrations are influenced by factors such as an oxidizing environment, lithology, and a long aquifer residence time, which also tends to increase pH values.10 Reactions with hydroxyl ions appear to influence arsenic in the basin as there is a significant positive correla-tion between arsenic concentrations and pH values.
Figure 6 – Samples collected from wells in the HVID and other irrigated areas have significantly higher TDS concen-trations than samples collected from wells where there is no irrigation (Kruskal-Wallis and Tukey tests, p ≤ 0.01). This pat-tern is likely the result of excess irrigation water containing a large salt load recharging the aquifer. 10
Discussion
Groundwater in the Harquahala basin is generally not suitable for drinking water use without proper treatment based on results from this ADEQ study. The quality of water, however, is generally suitable for irrigation, which is the major water use in the basin. Of the 51 sites sampled, only two sites met all health and aesthetic drinking water quality standards. Health-based exceedances included nitrate, arsenic, fluoride, gross alpha, and uranium, all of which com-monly have elevated concentrations in Arizona.9
These constituents appear to be natu-rally occurring in the basin, with the possible exception of nitrate. Nitrogen isotopes suggest the main source of ni-trate is naturally occurring organic mat-ter.10 Percolating groundwater, which occurs with irrigation or recharge proj-ects, likely facilitates moving nitrogen to the aquifer. Nitrate concentrations are significantly correlated with irrigated agriculture; however, suggesting human activities also contribute nitrogen to
We advocate for Arizona’s environment.
We adhere to the highest standards of technical professionalism. We commit to the highest standardsof ethical behavior. We are committed to openness, honestyand transparency.
We foster relationships built on respect, courtesy and service.
We value creativity, innovationand performance.
We turn challenges into opportunities. We value our employees and work as a team.
Arizona Departmentof Environmental Quality
To protect and enhancepublic health and the environment
in Arizona.
To lead Arizona and the nation in protecting the environment and improving the quality of life for the people of our state.
OUR VISION
OUR MISSION
PRINCIPLES AND VALUES
FACT SHEET
5
groundwater. Anthropomorphic sources contributing to nitrate concentrations in groundwater is also supported by previous studies.7 More research in the Sonoran desert is needed to definitively determine the relative contributions of nitrate from different sources.
Arsenic concentrations are affected by reactions with hydroxyl ions and by factors such as aquifer residence time, an oxidizing environment, and lithology (Figure 8).11 Fluoride concentrations are often controlled by calcium through pre-cipitation or dissolution of the mineral fluorite. Sites only partially depleted in calcium may be controlled by other pro-cesses such as hydroxyl ion exchange or sorption-desorption reactions.11 The lone gross alpha and uranium exceedance occurred at a well located in granitic geology which is often associated with elevated radionuclide concentrations in groundwater.12
Elevated concentrations of nitrate, arsenic, and fluoride have been cited in previous reports as occurring in the basin. Fluoride, however, had a much higher frequency of exceeding health-based water quality standards in previous reports.2,3,4 This may be due to previous studies using 1.4 mg/L as the health-based water quality standard, based partially on an outdated method that factors in air temperature.3 Previous studies also had limited health-based exceedances of chromium, lead, and mercury that were not confirmed in this ADEQ study.2 Aquifer characteristics suggest elevated chromium concentra-tions may occasionally occur. The lead and mercury exceedances, however, were likely caused by sample contami-nation or lab error.
Previous studies have noted that concentrations of some constituents, particularly TDS and nitrate, were el-evated in irrigation wells which partially drew water from perched aquifers in the HVID.3,4 Field observations support this conclusion though positively identify-ing all such wells was not accomplished because of the unavailability of well logs
and the difficulty of revisiting irrigation wells when they are idle to check for cascading water. Still, within the HVID, many constituent concentrations may be controlled more by whether the ir-rigation well is screened in the perched aquifer than by its location.
References Cited
1 Towne, D.C., 2014, Ambient ground-water quality of the Harquahala basin: A 2009 - 2014 baseline study: Arizona De-partment of Environmental Quality Open File Report 14-04, 62 p.
2 Arizona Department of Water Resources website, www.azwater.gov/azdwr/de-fault.aspx, accessed 05/22/14.
3 Graf, C. G., 1980, Maps showing ground-water conditions in the Harquahala Plains area, Maricopa and Yuma Counties, Arizo-na—1980; Arizona Department of Water Resources Hydrologic Map Series Report Number 1, 3 sheets, scale, 1:250,000.
4 Hedley, J.D., 1990, Maps showing groundwater conditions in the Harqua-hala Irrigation Non-Expansion area and Tiger Wash basin, Maricopa and La Paz Counties, Arizona—1989; Arizona Depart-ment of Water Resources Hydrologic Map Series Report Number 17, 3 sheets, scale, 1:250,000.
5 U.S. Environmental Protection Agency website, www.epa.gov/waterscience/crite-ria/humanhealth/, accessed 04/22/14.
6 U.S. Environmental Protection Agency website, http://water.epa.gov/lawsregs/rulesregs/sdwa/radon/regulations.cfm, accessed 6/18/14.
7 Madison, R.J., and Brunett, J.O., 1984, Overview of the occurrence of nitrate in ground water of the United States, in National Water Summary 1984-Water Quality Issues: U.S. Geological Survey Water Supply Paper 2275, pp. 93-105
8 Earman, Sam, et al, 2003, An investiga-tion of the properties of the San Ber-nardino groundwater basin, Arizona and Sonora, Mexico: Hydrology program, New Mexico Institute of Mining and Technol-ogy, 283 p.
9 Towne, D.C. and Jones, J., 2011, Ground-water quality in Arizona: A 15-year over-view of the ADEQ ambient groundwater quality program (1995-2009): Arizona Department of Environmental Quality Open File Report 11-04, 44 p.
10 Thiros, S.A., Bexfield, L.M., Anning, D.W., and Huntington, J.M., eds., 2010, Conceptual understanding and ground-water quality of selected basin-fill aquifers in the Southwestern United States: U.S. Geological Professional Paper 1781, 288 p.
11 Robertson, F.N., 1991, Geochemistry of ground water in alluvial basins of Ari-zona and adjacent parts of Nevada, New Mexico, and California: U.S. Geological Survey Professional Paper 1406-C, 94 p.
12 Lowry, J.D. and Lowry, S.B., 1988, “Ra-dionuclides in Drinking Waters,” in Ameri-can Water Works Association Journal, 80 (July), pp. 50-64.
For More Information Contact:Douglas C. TowneHydrologist, ADEQ Monitoring Unit1110 W. Washington St. #5330DPhoenix, AZ 85007email: [email protected]/environ/water/assessment/ambient.html#studiesPublication Number: FS-14-09