Fact-finding study on opportunities to enhance the energy...
63
Fact-finding study on opportunities to enhance the energy efficiency and environmental impacts of ports in the Baltic Sea Region
Transcript of Fact-finding study on opportunities to enhance the energy...

Fact-finding study on opportunities to enhance the energy efficiency and environmental impacts of ports in the Baltic Sea Region

Helsinki, October 2014
2
Fact-finding study on opportunities to enhance the energy efficiency and environmental im-
pacts of ports in the Baltic Sea Region
Motiva Services Ltd.
Ilkka Hippinen
Jaana Federley
Cover photo: The Port of Gothenburg, Sweden

3
Foreword
Almost 15% of the world’s maritime transportation is carried out in the Baltic Sea, where over
800 million tonnes of cargo is handled yearly. The countries in the Baltic Sea region have strong
trade relations with each other. Efficient transport and logistics solutions are needed to get
goods to market. Seaports are key parts of logistic chains that provide vital links between indus-
tries and their markets and supply sources. Ports are often also significant locations for industri-
al activities which need energy for their production processes.
Energy use, energy efficiency and environmental issues have become more important as
energy prices have risen, while the operational environment is constantly changing and tougher
environmental regulations are putting pressure on all industrial and commercial sectors. These
issues are all also evident regarding ports. At the same time, competition for customers is hard-
er than ever. In maritime ports and related activities, new environmental issues are constantly
emerging and becoming additional competitive factors. Energy consumption and emissions in
shipping and the port sector are increasingly the focus of public concern and political attention.
Several different actors operate in any port area, including the port authorities, stevedor-
ing companies, shipping companies and logistic companies. Energy consumption is often spread
among a number of different operations. Energy efficiency and environmental awareness at
ports can only be enhanced with the help of advanced know-how and co-operation between
different actors. Several ports have implemented energy efficiency measures, but in general
ports evidently still lack a systematic approach to energy efficiency.
Compared to other more energy intensive sectors, ports still remain a less explored area
concerning energy efficiency. It is clear, however, that as in all other commercial and industrial
sectors systematic energy efficiency analyses will be able to find potential for further improve-
ments in energy efficiency.
The aim of this study is to describe the current situation regarding energy efficiency at Bal-
tic ports and examine the most important related issues. We have also aimed to analyse wheth-
er there is a need for a larger collaboration project concerning the energy efficiency of ports
around the Baltic Sea. The study has been funded by the Baltic Sea Region Energy Co-operation
(BASREC). The seven-month project has been led by Motiva Services Ltd. The ports included in
the study were HaminaKotka, Tallinn, Riga, Klaipeda, Gothenburg and Copenhagen-Malmö.
Representatives of stevedoring companies, The Finnish Port Association and The Finnish Port
Operators Association were also interviewed.
Helsinki, October 2014
Ilkka Hippinen
Jaana Federley

4
Abstract
This study aims to clarify the current state of energy efficiency at the Baltic Sea ports and exam-
ine the most important related issues. The project has been divided in to two tasks. Firstly, ear-
lier studies and projects were examined in a literature study. Based on the findings of the litera-
ture study, the representatives of six ports at the Baltic Sea region were then interviewed about
energy efficiency issues.
Energy savings can be achieved at ports with the help of new techniques and technologies,
reshaped terminal layout and operations, and changes in the attitudes and behaviour of per-
sonnel. In the literature study we identified several aspects of operation that affect the energy
efficiency of any port, including: energy monitoring and management systems; lighting technol-
ogies and lighting control; the energy efficiency of buildings, terminals and warehouses; the en-
ergy use and operation of machines and vehicles; the use of shore-to-ship power systems; and
co-operation between different actors at the port.
The ports included in the interview study were HaminaKotka, Tallinn, Riga, Klaipeda,
Gothenburg and Copenhagen-Malmö. The representatives of various stevedoring companies,
The Finnish Port Association and The Finnish Port Operators Association were also interviewed.
The interviews revealed that different levels of importance are given to energy efficiency
in the management of different ports. In general, energy costs only account for a relatively low
share of total costs, so energy efficiency has not played an important part in operations or in-
vestments. However, with energy prices increasing and environmental friendliness becoming
ever more significant, energy issues are today gaining importance.
Spreading information between ports is recommended in the report as an effective way to
improve energy efficiency. This could be done by presenting the good practices compiled here.
As energy efficiency is not a key business area for the companies in a port, collaboration be-
tween ports and between different actors within ports could be possible, and this would lead to
a situation where all the participants will benefit.
Lighting technologies are evidently the main energy efficiency issue that ports are already
considering or addressing. Light sources have been switched to LEDs especially in indoor loca-
tions, but LEDs are also in use in some outdoor applications. Lighting controls have also been
developed to save energy and reduce light pollution.
Novel energy efficient technologies are available for machinery in ports. Heavy machinery
is expensive, and service lifetimes are long, so these factors slow the commissioning of more
efficient technologies. However, when new investments are under consideration, energy effi-
ciency is already taken into account in decision making.
Training in eco-driving is commonly provided for port drivers. Through such training and
the consequent energy efficient practices energy use can be decreased without further invest-
ments. Attention should also be paid to other potential behavioural changes among personnel:
how can personnel be effectively encouraged to save energy?
It is important to develop resource efficiency monitoring and reporting systems to meet
the needs of ports. It would also be important to monitor and report on both the energy effi-

5
ciency of port facilities, and vehicles’ fuel consumption rates. Development work is needed to
combine these measurements and system technologies. In addition to energy and fuel con-
sumption follow-up, the system could be developed to monitor and report on material flows
within ports. The resulting information could then help to improve the material efficiency of
ports.
6
Contents
Foreword 3
Abstract 4
Contents 6
1 Literature study 8
1.1 Ports in general 8
1.1.1 Different types of ports 8
1.1.2 Different actors in ports 9
1.1.3 The port sector in Europe 11
1.1.4 Baltic Sea ports 11
1.1.5 Regulations and legislation 11
1.1.6 Energy consumption 12
1.2 Energy efficiency 14
1.2.1 Previous projects examining the energy efficiency of ports 14
1.2.2 Monitoring and management systems 17
1.2.3 Lighting technologies and lighting control 23
1.2.4 Buildings, terminals and warehouses 26
1.2.5 Machines, cranes, and vehicles 29
1.2.6 Shore-to-ship power systems 32
1.2.7 Co-operation between different actors 35
1.3 Environmental issues 38
2 Interviews 42
2.1 The ports visited 43
2.2 Energy consumption 46
2.3 Shore-to-ship systems 47
2.4 Renewable energy and alternative fuels 48
2.5 Energy efficiency 49
2.5.1 Monitoring and management 49
2.5.2 Infrastructure 49
2.5.3 Machines and vehicles 51
2.6 CO2 footprints 52
2.7 Industrial parks 52
2.8 Environmental factors 53

7
2.9 Co-operation 53
3 Conclusions 55
References 57

8
1 Literature study
The goal of this study has been to collect background information on best practices relating to
energy efficiency and environmental issues at ports, not only in the countries around the Baltic
Sea, but also in Europe in general. In this chapter we compile case studies that have been car-
ried out in ports in order to improve their energy efficiency. Wider environmental issues are
covered here only in the context of the energy consumption of actors working in the ports.
1.1 Ports in general
1.1.1 Different types of ports
A port can be defined as a harbour or an area that is able to provide shelter to numerous boats
and vessels. Ports consist of the dock area, fields, quays, fairways, and land routes. Ports also
include related to the port activities, infrastructure such as warehouses, cranes and terminals.
The widest definitions of ports also include all the services provided by different organizations
within the port. (1)
Ports are strategic geographical locations situated beside oceans, seas, rivers or lakes. The
facilities provided for a port depend on the purpose for which the port is being used. The depth
of the water plays a vital role in enabling various types of ships to enter and dock at the port.
Today most ports, especially seaports, are well-equipped with specialized fixtures such as fork-
lifts and gantry cranes to facilitate regular trans-shipments of cargo. Ports can be of great signif-
icance to a nation, as they promote commerce and trade. (2)
Considering factors such as location, water depth and ship sizes, ports can be classified in-
to various types. Some of the main types are as follows (2):
Seaports are the most common types of ports used around the world for commercial
shipping activities. Numerous seaports are situated along many of the world’s coast-
lines to actively handle cargo transactions. Seaports can be further categorized as car-
go ports or cruise ports. (2)
Inland ports are ports built on comparatively smaller water bodies such as rivers or
lakes. Some inland ports have access to the sea with the help of canal systems. Ports
built on inland waterways typically function like seaports except that they are not usu-
ally able to accommodate deep draft ship traffic. Some inland ports specifically creat-
ed for recreational purposes may only be able to take small sized vessels, such as pas-
senger ferries and fishing boats. (2)
“Dry ports” are inland terminals that can be interconnected with a seaport via road or
rail transportation facilities. They usually function as centers of multimodal logistics.
Dry ports may prove useful for the importing and exporting of cargo where they may
reduce congestion at a nearby seaport. Their functions are quite similar to those of
seaports, with the difference that they are not situated on the coastline. (2)
9
Cruise Home Ports specialize in catering for cruise ships, by providing a platform for
passengers to enter and disembark from their cruise vessels at the beginning and the
end of their journeys. (2)
Cargo Ports function variously according to the cargo they manage, and the amenities
available differ from one port to the other. Cargo ports utilise many mechanical tech-
niques to load or unload shipments. A cargo port may be designed to deal with single
or multiple types of products. Items such as liquid fuels, chemicals, grain, timber, ma-
chines and motorcars, are often transported via cargo ports. A cargo port which en-
gages in the transfer of containerized goods is referred to as a container port. Steve-
dores are companies which act as terminal operators and manage the functioning of
diverse operating terminals. (2)
Terminals are sets of specific facilities at ports where the loading and unloading of cargos or
containers takes place. (2) Terminals may consist of marine structures, yards, cranes, building
infrastructures, power infrastructure, vehicles, equipment and tenant operations. (3) Terminals
can be classified on the basis of the types of cargo they can handle. Common types of terminals
include container terminals, bulk cargo terminals and LNG terminals, etc. (2)
Different types of traffic require different types of ports and handling equipment. Exam-
ples of the kinds of traffic that can be handled by different port types include (4):
Ro-ro1 ports: trucks, cars, rail wagons
Container ports: containers
General cargo/break bulk ports: cargo which is bundled but not stowed in containers,
e.g. project cargo (power generation plants), turbines, iron and steel products (bars,
coils) and forest products
Dry bulk ports: coal, iron ore
Liquid bulk ports: crude oil, LNG, gasoline
1.1.2 Different actors in ports
The port concept can vary depending on approach, but when speaking of a port, the term rarely
refers only to a port authority. According to most definitions, the port authority is described
more as a landlord or regulator, even though other functions also exist. Commonly the port
concept includes the entire port community, consisting of several companies and authorities
operating in the port area. Companies that operate within the port area can include for example
stevedoring companies, terminal operators, shipping companies, carriers, shipbuilding and re-
pair companies, logistic companies, maintenance services, piloting services, tugging services,
vessel traffic services, marine services, container services, packing service providers and truck-
ing companies. Also several different authorities such as hydrographic institutes, customs, im-
migration, police and fire brigade may operate in facilities located within port areas. (5)
1 RoRo ships are vessels designed to carry wheeled cargo (i.e. vehicles such as cars and trucks, or
trailers) that are driven on and off the ship on their own wheels or using a platform vehicle, such as a self-propelled modular transporter.

10
Figure 1. Different actors operating in a port area.
The set-up of port management varies considerably across Europe. In some countries ports are
managed by private entities which own the land where the port is located, or have similar rights
to those of an owner. In most cases ports are managed by public entities or undertakings. With-
in this group of public port authorities, there may be differences regarding the degree of auton-
omy from other public authorities, the level of government they belong to, and the range of
services they provide. (6) According to the different roles of the public and private sector con-
cerning the provision of port services and infrastructural development, four main management
models can be described: (7)
Public Service-Port model
Tool-Port model
Landlord model
Private Service-Port model
In the Public Service-Port model, the port authority (a public body) invests in all kinds of infra-
structures and superstructures and provides all the port services (goods handling and storage,
pilotage, towage, mooring, etc.). (7)
In the Tool-Port model, the port authority invests in all kinds of infrastructures and super-
structures, but private companies provide the services at the port. (7)
The Landlord model is the most representative port management model in Europe. In such
ports the public port authority usually invests in maritime accessibility infrastructure and pro-
tection works (dredging, docks, etc.), whereas the private operators invest in superstructure
(handling equipment, installations, etc.) and occasionally in port infrastructures (berths). (7)
Finally, in the Private Service-Port model, the port authority (a private body) invests in all kinds
of infrastructures and superstructures as well as providing all the goods handling and technical
port services, just as they are provided by the public port authority in the Public Service-Port
model. (7)
There are significant differences in terms of the objectives and functions of port authori-
ties between different countries and ports. Their institutional frameworks and financial capabili-
ties also differ. Port authorities furthermore differ in terms of market power, but also in terms
of the knowledge, skills and competence they can utilise. Most port authorities in Europe have
Port authority
Customers using the
port's services
Companies operating in the port
area
Public authorities

11
ambitions to go beyond a passive landlord role, but those ambitions may be limited or enabled
by the diversity in governance frameworks. (6)
1.1.3 The port sector in Europe
The European Union is highly dependent on seaports for trade with the rest of the world and
within its internal market. 74% of goods imported and exported and 37% of exchanges within
the EU transit through seaports. Ports guarantee the territorial continuity of the EU by servicing
regional and local maritime traffic to link peripheral and island areas. They are the nodes from
where the multimodal logistic flows of the trans-European network can be organized, using
short sea shipping, rail and inland waterways links to minimize road congestion and energy con-
sumption. (8)
Bottlenecks in ports and their hinterlands due to the lack of high quality infrastructure or
low performing port services may result in congestion and extra costs for shippers, transport
operators and consumers. European ports face common challenges which will require substan-
tial private and public investment, including: the need to adapt infrastructure to changing de-
mands, notably the increasing size of vessels; and the need to comply with new environmental
legal requirements such as the obligation to provide waste reception facilities, LNG refueling
stations and shore-to-ship power. (8)
1.1.4 Baltic Sea ports
Almost 15% of the world’s maritime transportation is carried out in the Baltic Sea. (5) There are
approximately 250 ports in the Baltic Sea area. The total amount of cargo handled in ports bor-
dering the Baltic Sea was 839.4 million tonnes in 2012. Measured by total cargo volume, Russia
is the leading country in the Baltic Sea region, with a market share of a 25%, followed by Swe-
den with 21%. The three biggest ports in the Baltic Sea Region are the Russian ports Primorsk,
St. Petersburg and Ust-Luga. (9)
Liquid bulk is the largest cargo type by volume (41% share) in the Baltic Sea Region, with a
total volume of 319 million tonnes in 2012. Dry bulk volumes totalled 197 million tonnes, and
other dry bulk than cargo totalled 258 million tonnes in 2012. The numbers of containers han-
dled by the Baltic Sea ports amounted to 9.4 million TEUs2. St. Petersburg was clearly the big-
gest container port with approximately 2.5 million TEUs handled. (9)
1.1.5 Regulations and legislation
The main goals behind the EU’s energy policy are the security of energy supply and combating
climate change. The EU has created an ambitious energy strategy extending to the year 2020,
aiming to reduce emissions of greenhouse gases by 20% (compared to 1990 levels), to increase
the share of renewable energies to 20% of final energy consumption, and to increase energy
efficiency by 20%. (6, 5)
2 TEU: twenty-foot equivalent unit; an inexact unit of cargo capacity based on the volume of a 20-
foot-long (6.1 m) intermodal container.

12
Unlike most other transport sectors, ports are not specifically regulated by EU legislation. In
2001 the Commission proposed to regulate market access, but the European Parliament reject-
ed the proposal in 2003. In 2004 a second proposal was formulated, but it was again turned
down. (10)
The aim of the Port Reception Facilities Directive (Directive 2000/59/EC on port reception
facilities for ship-generated waste and cargo residues) is to prevent and reduce discharges of
ship-generated waste and cargo residues into the sea. This can be done by making available and
improving port reception facilities. (5, 11)
Another directive concerning ship-source pollution is the directive 2005/35/EC on ship-
source pollution and the introduction of penalties for infringements. This directive aims to in-
corporate international standards for ship-source pollution into Community law and to ensure
that persons responsible for discharges are subject to adequate penalties, in order to improve
maritime safety and enhance the protection of the marine environment. (5)
The latest relevant EU policy documents are the White Paper on Transport and the Single
Market Act II, issued in 2011 and 2012. (10)
In 2013, the European Commission put the European seaports on the political agenda of
the EU and proposed a strategy to develop their competitiveness together with an action plan
combining legislative and non-legislative measures. The new guidelines for the development of
the trans-European transport network (TEN-T) have identified 329 key seaports along Europe’s
coasts that will become part of a unified network boosting growth and competitiveness in Eu-
rope's Single Market. The Connecting Europe Facility financial instrument will provide up to €26
billion to support the development of transport infrastructures, including ports and connections
from ports to their hinterlands, over the period 2014–2020. (8)
One key measures will involve raising the environmental profile of the European ports by
providing guidelines and promoting the exchange of good practices and innovations. In the
Clean Power Transport Directive 2014/94/EU of 22 October 2014, the European Parliament and
the Council agreed to include provisions which require all core ports to provide Liquefied Natu-
ral Gas refueling points and shore-side electricity (unless not economically viable) by 2025. (8)
In a future the Commission will provide financial support to ports implementing good environ-
mental practices and investing in Liquefied Natural Gas and shore-side electricity infrastructure.
The Commission will develop analytical tools and criteria that ports can use on a voluntary basis
to vary port infrastructure charges according to environmental criteria in a cost effective way.
The industry will be invited to assist in this in order to contribute to the greening of the shipping
industry at low cost. (8)
1.1.6 Energy consumption
The profiles of terminals’ energy use vary according to geography, available energy sources and
port type. In Europe, for example, the typical split of diesel fuel to electricity usage is 70:30 de-
pending on the types of equipment used. Diesel is typically used to fuel mobile equipment,
while electricity is purchased to power cranes, reefers, electrically powered mobile vehicles,
lighting and buildings. (1) Port container terminals are huge energy consumers, especially with
regard to energy sources based on fossil fuels. Average values show a yearly fuel consumption
of almost 10 million fuel liters (in form of diesel oil). This figure illustrates the true scale of the
13
high energy intensity needed for container handling operations. Great economic, environmental
and social impacts are generated by the massive use of diesel oil for developing non-stop opera-
tives at ports. (7)
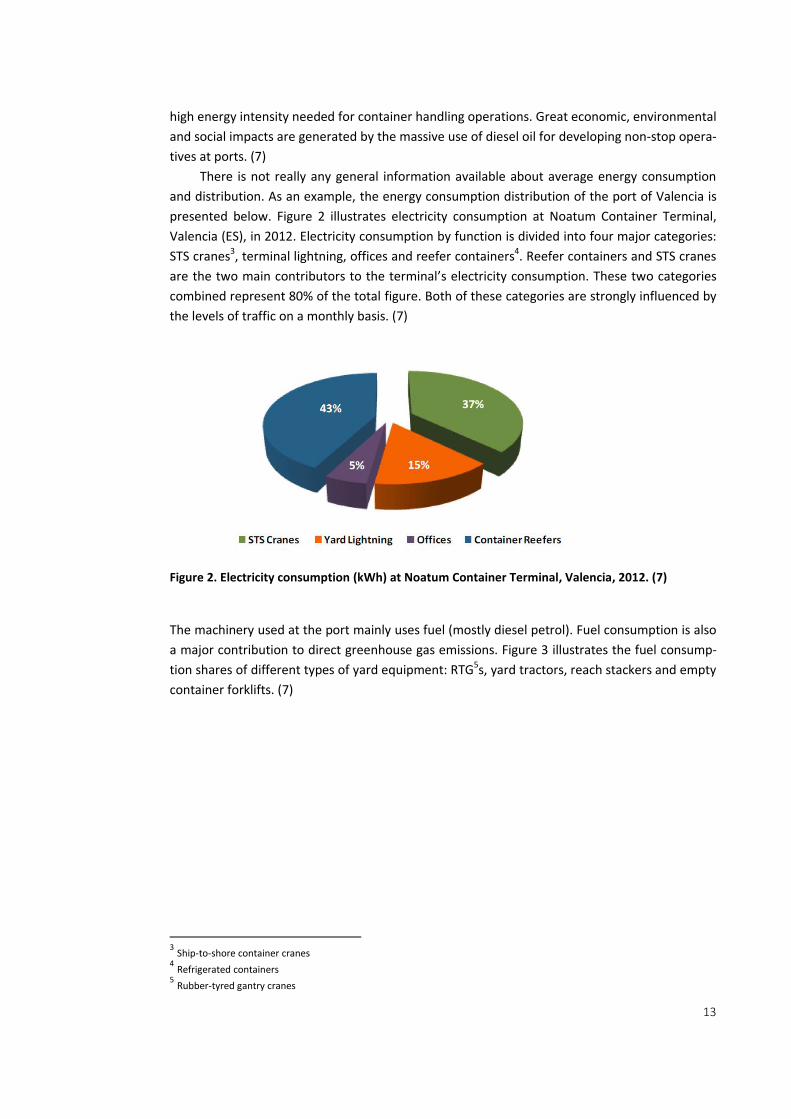
There is not really any general information available about average energy consumption
and distribution. As an example, the energy consumption distribution of the port of Valencia is
presented below. Figure 2 illustrates electricity consumption at Noatum Container Terminal,
Valencia (ES), in 2012. Electricity consumption by function is divided into four major categories:
STS cranes3, terminal lightning, offices and reefer containers4. Reefer containers and STS cranes
are the two main contributors to the terminal’s electricity consumption. These two categories
combined represent 80% of the total figure. Both of these categories are strongly influenced by
the levels of traffic on a monthly basis. (7)
Figure 2. Electricity consumption (kWh) at Noatum Container Terminal, Valencia, 2012. (7)
The machinery used at the port mainly uses fuel (mostly diesel petrol). Fuel consumption is also
a major contribution to direct greenhouse gas emissions. Figure 3 illustrates the fuel consump-
tion shares of different types of yard equipment: RTG5s, yard tractors, reach stackers and empty
container forklifts. (7)
3 Ship-to-shore container cranes
4 Refrigerated containers
5 Rubber-tyred gantry cranes

14
Figure 3. Yard machinery fuel consumption at Noatum Container Terminal, Valencia, 2012. (7)
In 2012, 62% of the total fuel consumption was associated with the operation of RTGs, whereas
33% was used by yard tractors. These two types of machines represent around 95% of the total
fuel consumption of the terminal. The remaining 5% is divided between reach stackers (4%) and
empty container forklifts (1%). (7)
1.2 Energy efficiency
This chapter presents the most common actions that can be carried out in ports to improve
their energy efficiency. The whole chapter is based on publicly available literature. Our aim is to
briefly introduce the most common opportunities to improve ports’ energy efficiency. The in-
terview-based study presented in chapter 3 was based on the findings of this literature study.
1.2.1 Previous projects examining the energy efficiency of ports
The ESPO Port Environmental Review 2013, published by the European Sea Ports Organisation
(ESPO), identified the most significant environmental issues for EU ports. This survey highlights
the progress that has been achieved over the years. 79 ports from 216 European Maritime
States participated in this survey. (6) ESPO and EcoPorts have been monitoring the top envi-
ronmental priorities of the European port sector since 1996 through regular respective surveys
(Table 1). Similar surveys were made in 1996, 2004 and 2009. Interest in environmental issues
has increased in recent decades, and the related priorities have also evolved. The table below
summarises changes in ports’ environmental priorities from 1996 to 2013. Many of these reflect
prevailing political drivers. Priority issues change their ranking over time, but certain compo-
nents have retained their significance for the sector. (12)
6 The Maritime States and the number of ports represented were: Albania (11), Belgium (2), Bulgaria
(1), Croatia (2), Cyprus (1), Denmark (5), Estonia (1), Finland (3), France (11), Germany (4), Greece (8), Ireland (3), Italy (5), Latvia (1), Lithuania (1), Netherlands (6), Norway (1), Portugal (2), Spain (5), Sweden (4), and United Kingdom (12).

15
Table 1. Evolution of environmental priorities over time (1996-2013). (12)
Some environmental issues such as dredging operations, port land development and dust have
been among the top 10 priorities in Europe over the last 17 years. These highly prioritized envi-
ronmental issues form a basis for environmental collaboration in the port sector.
Energy consumption made it to the list in 2009, and by 2013 it was already the third most
important environmental issue. This clearly reflects new political priorities on energy efficiency
and climate change. Energy consumption and efficiency can be seen as a rising topics for the
port industry. (12)
According to the The ESPO/EcoPorts Port Environmental Review 2009, 33% of ports meas-
ure or estimate their carbon footprint, 51% of ports take measures to reduce their carbon foot-
print, 57% of ports have a programme to increase energy efficiency, and 20 % of ports produce
some form of renewable energy. (6)
Several projects have striven to gather information on ports’ energy efficiency. One of
them is EcoPorts – an environmental project run by ESPO which publishes guides and tools to
improve several environmental factors in ports, including energy efficiency. (13)
The Climeport project proposes the assessment of different methodologies in order to
combat global climate change. The project takes place in several countries in the Mediterranean
region. The project aims to develop and implement solutions in order to mitigate climate
change by means of actions in maritime and inland transport, energy saving and efficiency, im-
plementing the world port climate declarations, and designing an environmental indicators sys-
tem as a footprint based on CO2 emission levels. In the Climeport project 30 good practices for
reducing the greenhouse gas emissions and carbon footprints of ports were identified and test-
ed. Table 2 lists the 17 highest ranked practices. Several of these practises are similar to those
identified in this study as good practices that can improve the energy efficiency of ports. (14)
1996 2004 2009 2013
1Port Development (water) Garbage / Port waste Noise Air qual i ty
2Water qual i ty Dredging operations Air qual i ty Garbage / Port waste
3Dredging disposal Dredging disposal Garbage / Port waste Energy consumption
4 Dredging operations Dust Dredging operations Noise
5 Dust Noise Dredging disposal Ship waste
6 Port Development (land) Air qual i tyRelationship with
loca l community
Relationship with
loca l community
7 Contaminated land Hazardous cargo Energy consumption Dredging operations
8 Habitat loss /degradation Bunkering Dust Dust
9 Traffic volumePort Development
(land)
Port Development
(water)
Port Development
(land)
10Industria l effluent
Ship discharge
(bi lge)
Port Development
(land)Water qual i ty

16
Table 2. The 17 Best Practices with the highest ranking in the Climeport project. (14)
17
According to the Green Cranes report, the main challenge nowadays concerning energy is to
improve the way that energy is used, by obtaining the same benefits from fewer resources. In
this context eco-efficiency at ports is becoming more and more significant in line with other
strategic sectors. The study describes the main objectives of eco-efficiency at ports as follows:
To reduce losses within the electrical distribution network by means of monitoring and
control of installations, as well as the operation in real time over the network
behaviour.
To plan the development of the different infrastructures and networks within the port
attending to operational and environmental criteria.
To increase the awareness and training of port personnel in order to promote the more
efficient use of energy resources.
Electrical energy at ports is essential to develop the great majority of activities related
to cargo handling and logistics, especially with containerized cargo. The evolution of
these activities and their complexity demand nowadays huge amounts of energy. (7)
Green EFFORTS, "Green and Effective Operations at Terminals and in Ports", is a collaborative
research project, co-funded by the European Commission under the Seventh Framework
Programme. Its goal is to investigate the current energy mix in ports and terminals while identi-
fying activities which account for real energy savings, and investigating the range of regenera-
tive energy sources which could be adapted to port and terminal environments, with the
knowledge and project achievements transferred to stakeholders in the maritime sector
through dissemination activities. (43)
For the purposes of this study, we have identified several aspects of operation that affect
the energy efficiency of a port. These aspects are covered in more detail in the following chap-
ters:
Energy monitoring and management systems
Lighting technologies and lighting control
Building and warehouse energy efficiency
Energy use and operation of the machines and vehicles
Shore-to-ship power systems
Co-operation between different actors at the port
1.2.2 Monitoring and management systems
Management systems
Energy efficiency should not be a one-off project, but a continuous process in company. It is
crucial that the management in particular, but also the entire organization, should be commit-
ted to purposeful improvement of the efficiency of energy use. On the company’s side, continu-
ous improvement of energy efficiency demands good monitoring and management systems.
Activities that needs to be included in any management system are: (15)
the setting of reduction targets
monitoring and analyzing the energy use of the port
identifying opportunities to save energy, for example by carrying out an energy audit
18
identifying areas of high energy consumption and waste
identification and implementation of energy-saving measures that are techno-
economically feasible
using energy efficiency indicators and calculating carbon footprint
consideration of energy efficiency in the company’s practices, investments and pro-
curements
knowledge of the various options for energy procurement
the creation and implementation of a good energy procurement strategy
The concept of port environmental management has developed in Europe over the last 15
years. Collaboration between the port sector, research institutions and specialist organizations
has driven this progress. There is an increasing trend for ports to produce an environmental
policy and publish an annual environmental report. Many ports have also established activities
and procedures to manage their environmental risks such as designating environmental per-
sonnel, adopting an environmental management system, and monitoring environmental per-
formance through the systematic use of environmental performance indicators. (6)
Environmental management systems enable a systematic approach to environmental is-
sues. This should include setting up a functional organizational structure that sets respective
targets, implements measures, monitors impacts, evaluates, reviews and takes corrective ac-
tions when and where necessary. In this way ports can achieve and demonstrate continuous
environmental improvement. Energy efficiency can be part of a company’s environmental man-
agement system. Different tools and well established environmental management standards
already exist that ports may choose to implement when they build environmental management
systems such as EcoPorts, ISO 14001 and EMAS. (6) The energy star system has also listed seven
steps that are needed to complete a suitable energy management system (Figure 4). These
steps can also be applied to ports’ energy management systems (16):
Make a Commitment: Recognize that the economic, environmental and political im-
pacts of energy consumption are sufficient motivation to change our energy use pat-
terns.
Assess Performance: Make a personalized accounting of energy use and costs. Bench-
mark your facility by comparing its energy performance with similar sites.
Set Goals: Review your objectives and constraints. Establish priorities and set measura-
ble goals with target dates.
Create an Action Plan: Define the technical steps. Apply proven methods to increase
energy efficiency or get specialized guidance.
Assign roles and resources: Consider rolling savings from earlier efforts into future,
more complex initiatives.
Implement Action Plan: Install equipment and change operational procedures. Establish
a maintenance schedule. Train equipment operators and building occupants on the
changes. Track and monitor conditions.
Evaluate Progress: Compare current performance to established goals. Understand
what worked well in order to identify best practices. Adjust procedures, goals, and
schedule the next evaluation.

19
Recognize Achievements: Provide internal recognition for the efforts and achievement
of individuals, teams, and facilities. Seek external recognition from government agen-
cies, media, or third party organizations.
Figure 4. ENERGY STAR®’S steps for energy management (16)
The ISO 50001 energy management standard provides organizations a framework to manage
and improve their energy performance. An energy management system helps an organization
internalize the policies, procedures, and tools to systematically track, analyze, and improve en-
ergy efficiency. It considers maintenance practices, operational controls, and the design and
procurement of renovated, modified, and new equipment, systems, processes, and facilities.
(44)
Energy audits
Energy audits are a good way to identify energy-saving measures that are techno-economically
feasible. The purpose of energy auditing is to analyze the energy use of the facility being audit-
ed, to work out the potential for energy savings, and to present a profitability calculation on the
basis of the proposed investments and savings. (17)
An energy audit is based on data concerning output, energy consumption and use during
the implementation period, though it also tries as far as possible to take account of existing in-
formation and planned alterations. The point is to link the energy audit closely with the
company’s other operational processes so that it can be used for monitoring and maintaining
the facility’s energy efficiency in the future. (17)
The Directive of the European Parliament and of the Council 2012/27/EU on energy effi-
ciency contains measures to promote energy audits. Among other provisions, it stipulates that
Member States shall develop programmes to encourage small and medium sized enterprises to

20
undergo energy audits, and subsequently implement the recommendations resulting from
these audits. (18)
Barriers
Despite the presence of environmental specialists (69% of ports have at least one) and the fact
that 72% of ports have an environmental policy, less than half of the ports examined have any
specific form of Environmental Management System (30% are certified under ISO 14001, and
17% by EcoPorts PERS). Concerning publicity, only 36% of ports publish factual data on their
environmental performance that can be accessed by the public, even if 69% publish some sort
of environmental information on their websites. (10)
Table 3. Changes over time in selected environmental indicators. (10)
According to this study, 71% of ports still experience some difficulties in implementing envi-
ronmental management, due to both internal and external factors. The main challenges are: (6)
Number of authorities/stakeholders involved
Expense
The lack of awareness of good practice
Status given to environmental issues
Identification of responsible authority
Information and guidance related to legislation
Monitoring
To improve energy management at a port, better knowledge is needed about where and how
energy is consumed. Various software tools exist that enable measured data to be managed,
interpreted and distributed. After being connected to port machinery such tools are able to
provide accurate measurements of voltage, current, power and energy, comprehensive logging
and advanced power quality measurement and compliance verification functions. (7)
Environmental Management conponents
1996
(%)
2004
(%)
2009
(%)
Change 04-09
(%)
Port authori ty has an environmental pol icy 45 58 72 + 14
Pol icy information avai lable to the publ ic - 59 62 + 3
Pol icy improves over legal requirements 32 49 58 + 9
Publ ishing of annual environmental review/report - 31 43 + 12
Presence of environmental specia l i s t(s ) 55 67 69 + 2
Presence of environmental management system - 21 48 + 27
Presence of environmental monitoring 53 65 77 + 12
Presence of environmental indicators for trends
monitoring- 48 60 + 12
Presence of procedure for consulting with the loca l
community on port's environmental programme- 36 37 + 1
Source: ESPO / EcoPorts 2010

21
Due to the huge amount of information exchanged, it is essential to deploy information and
communication technologies to assure the efficiency and reliability of operations within the
container terminal as well as exchanges of information with external agents (shipping compa-
nies, port authorities, freight forwarders, shipping agencies, etc.). (7)
At internal level, the most essential information is associated with the containers them-
selves (identification, position and transport mode) and the machinery (operative, position,
work orders, etc.). In order to manage the above-mentioned exchange of data, port container
terminals need to adopt Terminal Operating Systems (TOS). TOS are software tools structured
into different modules of information management and control connected to a general data
base. (7)
A sophisticated TOS will help to determine optimum workflows and improve energy effi-
ciency. ln most cases, it also will increase productivity. Solutions can range from modifying the
stacking layout and organization of import and export containers via the "chaotic" allocation of
prime movers to cranes, i.e. with the TOS always selecting the most appropriate equipment in-
stead of working with crane-related gangs, to the implementation of fuel-saving technologies
such as start-stop automation for prime movers and RTGs to minimize idle operations. (45) Dif-
ferent solutions are provided in the market, so terminals are able to choose from several op-
tions according to their specific needs and business strategies. The implementation of a TOS in a
terminal has the following benefits: (7)
Planning and controlling all movements of containers within the terminal increases the
efficiency of the yard machinery and equipment.
Reductions in waiting and idle times at the container terminal gates
Optimization of the available surface of the terminal
Optimization of vessel planning
Improvements in the precision of the available data
Reduced operation costs for the terminal
Increases in the safety and security of the installation
Significant savings have been achieved in several ports by adopting energy management sys-
tems, energy efficiency audit programmes or carbon footprint calculation systems. Four of
these cases are introduced below. All of these examples are from ESPO’s “Green guide; Good
practice examples in line with the 5 Es” (18).
Energy management case: the Port of Dover (UK)
Energy Management has been a high profile environmental programme at the Port of Dover
since it began in 2006. Reductions have been achieved year after year in the use of electricity,
which is the most significant source of carbon emissions. These savings have significantly im-
proved the efficiency and cost effectiveness of the port operations, as well as their sustainabil-
ity. (18)
The monitoring data is collected by meters and a building energy management system. Af-
ter the data is displayed in an online graphics package, the port’s technical team can analyze the
energy use of the port and more tightly control heating, ventilation and air conditioning systems
to meet operational demand. Areas of high consumption and waste are identified, and opera-

22
tions where savings can be made are determined. The energy graphics package is used to
measure the energy efficiency of the operation by comparing throughput with energy consump-
tion. (18)
Staff and significant port tenants are encouraged to participate in the scheme, and given
feedback on their performance against targets through an energy monitors scheme, regular
meetings and newsletters. (18)
Energy efficiency audit programme case: the Port of Antwerp (NL)
The Antwerp Port Authority has promoted a voluntary energy efficiency audit programme. An
energy efficiency expert assists the port authority in the implementation of the initiative. The
port users pay a very modest sum for the energy efficiency audit. The energy audits’ results in-
clude tailor-made proposals for concrete measures and estimations of the economic feasibility
of these measures. The engagement of the port authority also includes co-operation and assis-
tance regarding the follow-up of the audit results. (18)
At the same time, the Antwerp Port Authority is able to share its knowledge regarding the
subsidy landscape for rational energy use, and even to provide assistance with regard to appli-
cations for possible subsidies. By developing this initiative, the port authority intends to engage
and encourage private companies to invest in energy efficiency measures. (18)
Under the first energy efficiency audit scheme, launched in 2010 with a budget of €100,
000, nine companies participated and benefited from the offer. Since the audit reports tend to
show clear potential for energy savings, other companies have also now shown serious interest
and might follow the path. (18)
Carbon footprint case: the Port of Valencia (ES)
In partnership within the Climeport project the Port Authority of Valencia has developed a
methodology to obtain an accurate estimate of the port’s carbon footprint. This method distin-
guishes between 4 levels; the port as a whole, port activities, services, and port equipment and
machinery. This distinction allows for the calculation of the carbon footprint of port activities
both in total, and for each of these separate aspects. This helps to define targeted measures for
reducing greenhouse gas emissions. An online tool (ECOABACUS) has been designed to facilitate
the calculation of the carbon footprint of ports. (18)
CO2 emission reductions case: the Port of Rotterdam (NL)
Since 2007, the Port of Rotterdam Authority has published a yearly footprint report regarding
CO2 emissions from its own operational activities. This footprint addresses CO2-emissions de-
rived from the energy use of buildings and transportation needed for daily activities and opera-
tions. In 2010 the port authority published a business plan for the period 2011-2015 with the
following objectives regarding the port’s carbon footprint: (18)
a CO2-emission reduction of 10% targeted for the business plan period 2011-2015
reported 2010-emissions of 9.8 kilotonnes as a new baseline for ambitious reductions
in the business plan
23
operational activities to be CO2-neutral as of 2011
CO2 emission reductions to become part of the sustainable procurement criteria used
in respect investment projects such as maintenance dredging, construction quay walls
and other port development projects
1.2.3 Lighting technologies and lighting control
Lighting of yards accounts for a high share of ports’ electricity consumption, so installing an ef-
fective lightning system is good way to reduce total electricity consumption. (18) Lighting also
represents the largest share of energy costs in warehouses (41%). Improving the lightning tech-
nology is one of the best ways to enhance a port’s energy efficiency. Efficient lamps, fixtures,
and controls save money and improve working conditions. By adopting these energy-saving
steps, the amounts of energy needed for lighting can be reduced significantly. (16)
Indoor and warehouse lighting
Light sources
High-intensity discharge (HID) light sources, such as metal halide and high-pressure sodium
lamps, have long dominated the market for lighting indoor spaces with high ceilings, but today
other technologies have proven more efficient in many common situations. Historically, cold
storage facilities have used metal halide lamps, despite their inefficiency, since fluorescent
lamps did not function well in cold temperatures. With the advent of LEDs, however, cold stor-
age spaces now have an alternative which, while expensive, is vastly more energy efficient. (19)
LED lighting is the most efficient option, and prices have dropped enough for it to be cost-
effective for many warehouses. (20) LEDs use a small fraction (10% or less) of the energy re-
quired for compact fluorescent or incandescent lamps, and they last at least 10 years, which
saves on maintenance requirements. (16)
Sensors
With lighting, it’s important to start by asking two questions: How much light is really necessary
in the warehouse; and where is it needed? Automated warehouses, where there is little human
activity, require much less lighting than a fully staffed facility. Work stations require a different
kind of lighting than a warehouse floor. (21) It is not necessary to have each bulb in a facility
turned on where lighting isn't critical. Timers or sensors can turn off lights when no one is in a
particular part of the warehouse. (20) Photo-sensors activate lamps automatically when day-
light diminishes, and motion sensors can be used in less busy areas. (16)
Another major advantage of LEDs is their capability to be integrated with automated sys-
tems. By using sensors, such systems allow facility managers to control when and where lighting
is used within a space. Previously, a manager might have had to turn on every metal halide in a
facility just to get access to a single aisle. By making it possible to use far more sophisticated
controls, LEDs can save refrigerated storage spaces up to 90% of their lighting-related energy
costs. Because LEDs have no warm-up time, as metal halide lamps do, LEDs can be turned on

24
and off as needed. Moreover, the very long expected service life of LEDs promises to reduce
maintenance costs.
Other methods
Lighting fixtures often have more lamps than are required for recommended lighting levels. One
easy way to reduce energy consumption is to remove unnecessary lamps. (22) Another easy
way to improve lighting levels while reducing energy expenses is to simply keep the lighting fix-
tures clean. (21) When lamps are regularly cleaned and replaced according to a fixed schedule
to prevent the accumulation of dirt and dust, full-light output is ensured. (16)
Painting walls white and installing windows and skylights to let in natural light is also a
good way to reduce the energy consumption of lighting. Skylights are becoming commonplace
because of exhaust requirements, but the light that they let in is an extra benefit. Thermal glass
in the skylights can enhance indoor climate control. (21)
Outdoor lighting
Light sources
The technology currently most used for high mast lighting systems is high pressure sodium
lights fitted with 400W light bulbs. Depending on the height of the mast and the numbers of
lights installed on the mast, the required lighting level of 20 Lux at 1 meter above ground (EN
13201) can be achieved in various ways. Usually between 10 and 30 single light bulbs are at-
tached to a single high mast. Due to new developments, technological advances and market
demand, new lighting solutions, that can further reduce power consumption – during night op-
erations, for example – have recently entered the market. LED lights have become the new
trend, with numerous applications arising. (23, 46)
The use of LED lights in ports and terminals around the world has seen a jump in populari-
ty simply due to the huge consequent reductions in electricity consumption. The directionality
of LED light is good, and properly balanced high-end LED fixtures are beginning to achieve satis-
factory colour rendering indexes (CRI) and colour temperatures, although this comes at a signif-
icant premium. (23)
Heavy industrial equipment and above-ground mining equipment now often operate with
LED lighting. While LED lighting is touted for reducing power consumption, ports and terminal
operators will realize the greatest savings from reductions in maintenance expenses. Properly
designed and manufactured LED fixtures installed on port container cranes will last, mainte-
nance free, for 50,000 hours, all the while reducing crane electricity draw and maintenance ex-
penses. Over the last two years, high brightness LED chips have increased the potential light
output from a single fixture. (24)
Light fixtures installed on port container cranes endure constant vibration, moisture and
corrosion. These factors are always significant in coastal environments. These extreme condi-
tions often result in premature lighting fixture failure, which necessitates constant maintenance
and increases material and labor costs. Installing properly designed LED fixtures on port con-

25
tainer cranes can immediately reduce energy usage, decrease crane maintenance costs, and
increase operator safety. (24)
New optic technology can distribute a very even light over a wider target area than tradi-
tional lighting options. This means that fewer lighting units are required, and exterior units can
be mounted lower. Light pollution is also reduced as the light output is focused only where it is
needed. The quantitative reduction in fixtures achievable by using LED technology offsets the
additional costs, and allows for a reasonable two year payback period on investments. (25)
Automation
Automating terminals also presents new opportunities to reduce maintenance expenses and
environmental impacts. Automated equipment lighting requirements are different than those
for standard equipment. Less lighting is needed overall, through lighting must still be available
on-demand for remote control and maintenance operations. Furthermore, LED lights come on
instantly, as opposed to many traditional lighting options that require extended warm-up times.
This means that lights only need to be turned on when they are needed. There is a strong trend
to fit Automated Stacking Cranes (ASCs) with LED lighting, since this significantly reduces energy
costs, minimizes downtime, and improves sustainability overall. Lighting is often perceived to be
a fixed expense, but adopting LED technology can reduce the power consumption of lighting by
up to 75%. (25)
Significant savings have been achieved in a several ports by updating the lighting systems
at the port. Some of these cases are introduced below.
Mobile lighting control case: the Port of HaminaKotka (FI)
At the Port of HaminaKotka only one third of all lightning comes on automatically at nightfall.
This ensures the basic lighting needed for safety and security. Full lighting must be ordered from
the port authority for any sector where operations are ongoing. The full lighting is then on for a
predetermined time, after which lighting is automatically reduced again, unless a new cycle is
ordered. The next step is to arrange mobile control for the lighting of different sectors. (18)
In the future new measuring systems will be practical in order to optimize energy use. En-
ergy use and cost savings go hand in hand here. Lower lighting levels also reduce light pollution
from the port. The design of lights can also maximize the effectiveness of lighting and minimize
dispersion. (18)
Focusing lighting case: the Port of Dover (UK)
Successfully implemented projects include a complete refit of high mast lighting, which subse-
quently delivered increased light output with much fewer lamps, by focusing the light where it
is needed and reducing light loss. (18)
26
Lighting control case: the Port of Pori (FI)
In 2009, a new lighting control system was installed at the Port of Pori. Taking a little over a
year, this project set up environmentally friendly and intelligent lighting for the Mäntyluoto
harbour area. The most important objectives were to focus lighting more efficiently, to have a
user-friendly system, and to save energy. The project was challenging, since the irregular work-
ing hours in the harbour area necessitate flexible lighting control. Operations are primarily con-
ducted during the morning and evening shifts, but ships are also often loaded and unloaded
during the night. The new system enables energy savings of 10–30%, depending on how the
lights are used. (26)
LED lighting case: the Port of Amsterdam (NL)
Rietlanden Terminals at the Port of Amsterdam has become in 2014 the world’s first terminal
facility to be illuminated entirely by high-power LEDs. Using LED lighting will increase the com-
pany’s sustainability, and fit in well with the Port of Amsterdam’s environmental plans. The en-
ergy savings amount to around 60% compared to existing lighting solutions. The new LEDs
means the light is less diffused, providing further environmental benefits, while the white light
also increases safety, which in turn improves working conditions. (27)
1.2.4 Buildings, terminals and warehouses
Office buildings
Port organizations and companies operating within port areas often have office buildings at the
port. The energy efficiency of these buildings can be improved in several ways. Energy use is the
greatest environmental burden and cost factor during a building’s lifetime. The choices made
during building design and construction have an impact for decades to come, and such decisions
may subsequently be impossible or very costly to alter. (17)
Passive house case: the Port of Aalborg (DK)
A 200 square meter office building constructed in the 1970s at the Port of Aalborg recently
needed to be rebuilt and modernised. It was decided to use this opportunity to gain experience
with passive house standards. By fitting effective insulation, energy recovery from ventilation,
and state of the art windows, it was possible to reduce the building’s use of energy for heating
by 94%. On top of that, employees will experience a much better indoor climate and comfort
inside the building. (18)
Head office building case: the Port of Ghent (BE)
The Ghent Port Company’s offices are partly housed in a new office building that was taken into
use in 2005. The new building project consisted of a new wing built onto the port’s original head
office building. As the Ghent Port Company wanted to see its attention to sustainable develop-
ment reflected in its own offices, the company resolutely opted for a construction that priori-

27
tised sustainable techniques and materials. The reuse of original cobblestones from the quay
flooring at the Grootdok symbolizes the sustainability aspect. The environment-friendliness of
the office furniture was also crucial. (18)
Ghent Port Company’s main building was the first office building in Belgium to be entirely
constructed according to the “passive house” concept. This means taking advantage of ad-
vanced insulation and sophisticated heat recuperation techniques to reduce the energy con-
sumption of the building to an absolute minimum. Thanks to this advanced insulation, airtight-
ness, sunblinds and well-planned ventilation, the building has no need for air-conditioning in-
stallations or any conventional heating installation (although a small natural gas system – com-
parable to systems installed in typical family homes – has been installed for when additional
heating is needed during severe winters). (18)
Warehouses
Warehouses are not always seen as a potential target for great energy savings even though they
represent a significant opportunity to improve operations, lower operational costs, reduce cli-
mate impacts, and achieve a more sustainable building stock through energy management.
Warehouses are often only partially heated to prevent freezing, and they are rarely cooled. (16)
With a little research into new lighting, roofing and HVAC technologies, however, creative ways
to reduce the costs of operating warehouses can be found. (21) The lightning of the warehouses
is covered in more detail in chapter 1.2.3.
Heating and lighting are the two largest components in the energy use of warehouses, to-
gether accounting for 64% of total energy use (Figure 5). Lighting and heating are therefore pri-
ority targets for energy cost reduction measures. Adopting modern technologies for lighting,
the building envelope, heating and cooling systems, and refrigeration systems, can help ware-
house owners to attain their energy efficiency goals. (16)
Figure 5. Typical energy use in a warehouse. (28)
Insulation
Improving insulation is a proven way to reduce both heating and cooling costs. (21) Wall and
roof insulation levels vary according to needs determined by the climate zone. (16) Warehouses

28
with older insulation typically lose energy to the environment. Traditional batt insulation can be
replaced by more efficient spray foam or loose fill insulation. Spray foam insulation is the most
expensive option, but it is twice as efficient as batt. Loose fill is a compromise alternative that is
easy to install in existing spaces, but still provides superior insulation. (20) Doors also need to be
insulated to reduce conduction losses. It is also important to properly insulate interior partition
walls between semi-heated and conditioned spaces. (16)
Proper sealants are also a good way to improve the energy efficiency of a warehouse.
Weather stripping and caulking need to be fitted to ensure that windows and doors are airtight.
Also air seal building seams and joints (tops and bottom of walls, around windows, etc.) and
penetrations (electrical wires and conduit, plumbing, flue or HVAC ducts, etc.) with site-
appropriate sealing material (tape, caulk, weather stripping, grout, foam, etc.) are worth in-
stalling to create a continuous air barrier around conditioned spaces. (16)
One of the greatest sources of energy losses for heated or refrigerated warehouse spaces
is air infiltration through the gaps around loading-dock doors during loading and unloading op-
erations. Regularly checking and repairing any gaps in seals is a simple energy-saving measure.
(22)
Docking shelters which enclose the entire back of a truck are more energy-efficient than
roll-up dock doors, because they reduce outside air exchanges. Docking shelters are unlikely to
be found in warehouse facilities built on spec, because they are more expensive than typical
loading docks. However, if facility executives have the opportunity for a build-to-suit facility, this
is an option to consider. (21)
Indoor temperature
In many warehouse facilities, especially in loading areas, it is costly and inefficient to maintain
temperatures of 16° to 21°C to keep staff comfortable. In such situations, reflector focused gas
or electric radiant heaters can be mounted above smaller areas that require heat, keeping em-
ployees comfortable with the ambient interior air temperature as low as 4° to 10°C. This reduc-
tion in overall indoor air temperature can dramatically reduce heat loss and energy consump-
tion, sometimes by as much as 50%. The radiant heaters should be controlled by timers or oc-
cupancy sensors to minimize their operation when areas are unoccupied. (22)
HVAC systems are a huge drain on energy where they are needed. Not all areas of a build-
ing require climate control at all times, however. If a warehouse is automated or unoccupied
much of the time, it is important to evaluate the level of heating and air conditioning really nec-
essary to make the environment comfortable or store the company’s products. (21) Program-
mable thermostats with timeclocks, setbacks, and demand control ventilation can be used to
reduce energy requirements. Installing internet thermostats on remote unit heaters will enable
monitoring and control of multiple units that may sometimes get left in the heating position
even during the summer. Buildings should be divided into thermal zones with separate controls
based on space functions. (16)
Regular maintenance of heating, ventilation, cooling, and refrigeration systems, including
changing filters, is important for good operation and to avoid wasting energy. (22) With heat
recovery systems, exhaust heat from mechanical equipment can be captured and used for space

29
heating. Heat recovery options include condenser coils or heat recovery for the hot water sup-
ply. (16)
Passenger terminals
Passenger terminal case: the Port of Portsmouth (UK)
Portsmouth International Port is experiencing a growing number of calls by cruise ships. The
existing passenger terminal required replacement. From the outset one of the main considera-
tions was to make the new terminal as efficient and environmentally friendly as reasonably pos-
sible. In particular the means of heating and cooling the building were put under scrutiny to
minimize the energy demand and future running costs. As a result the terminal is the first public
building in the UK to use a seawater source heat pump allowing thermal energy from the sea to
heat the building in winter and cool it in summer. In addition wind-catchers have been installed
on the roof and equipped with automated louvres allowing precise control of ventilation re-
quirements. Further unusual features of the terminal include a seawater flushing system for
toilet facilities. (42)
1.2.5 Machines, cranes, and vehicles
The forms of cargo-handling equipment used in a port are determined by the nature of the port
and the type of cargo and packing used. (29)
Dry bulk cargoes are often handled by power-propelled conveyor belts, usually fed at the
landward end by a hopper or grabs, which may be magnetic for handling ores, or fixed to a high
capacity travelling crane or travelling gantries. These two types of equipment are suitable for
handling coal and ores. In the case of bulk sugar, or when the grab is also used, the sugar would
be discharged into a hopper, feeding by gravity a railway wagon or road vehicle below. (29)
Transfers of liquid bulk cargo, crude oil and derivatives from tankers are undertaken by means
of pipelines connected to shore-based storage tanks. Oil cargo is discharged from the ship’s
tanks via the cargo piping system. From ship’s manifold oil is transferred by means of shore-
based loading arms to the shore manifold and then distributed to shore-based storage tanks
within the oil terminal. (29)
With regard to general cargo (goods, merchandise, commodities), almost 90% of the total
cargo volume is today containerized. General cargo is handled by cranes on the quay, floating
cranes or by the ship's own cargo gear. There are numerous types of tools or loose gear that can
be attached to shipboard or shore-based lifting gear. These include the sling or strop, which is
probably the most common form of loose gear. (29)
A couple of types of crane may operate within a terminal. Firstly there are the ship-to-
shore (STS) cranes that have to load or unload container ships. Usually multiple cranes work on
a single ship. The containers then have to be transported “horizontally” to the stacking yard
behind the STS cranes. This is done by much smaller vehicles like container tractors, automated
guided vehicles (AGVs) or straddle carriers. Finally, the containers are stacked for the most effi-
cient use of space and time, before they are transferred onto trucks or trains that will transport
30
them overland. In smaller terminals, this stacking can also be done by straddle carriers, but usu-
ally this is done by larger rubber-tired gantry (RTG) or rail-mounted gantry (RMG) cranes. (30)
New technology
Rubber-tired gantry (RTG) cranes are commonly used in shipping ports around the world to
move containers weighing up to 40 tonnes. These cranes are mobile and obtain the electrical
power needed for their hoist motors from a diesel engine and generator set, rather than from
the utility system. Container cranes, such as the RTG crane, are major contributors to port-
based diesel emissions. These cranes employ conventional power trains consisting of a diesel
engine coupled to an alternator that provides electrical power for a set of hoist, trolley, and
gantry motors. The diesel engine prime mover allows an RTG crane to be unencumbered by a
utility mains connection as it moves around the yard. When a shipping container is lifted by a
conventional RTG crane, the diesel engine provides the energy demanded by the hoist motor.
When the container is lowered, the container’s potential energy is converted by the hoist motor
into electrical form, but the conventional drive system has no means to store this regenerated
energy. Consequently, this energy is typically dissipated as heat in resistor banks, resulting in a
reduced overall system efficiency and increased fuel consumption and emissions. (31)
Fully electrical operation of cranes at container terminals is the most environmentally
friendly means of operation compared to other power sources. Many suppliers are now offering
solutions for electrification using, for example, cable reels or conductive wires to connect ma-
chines to terminals’ electrical power grids. (32)
Eco-driving
Container and trailer management are fundamental activities in the operation of a port. The
loading and unloading of vessels requires working machines such as straddle trucks and forklifts,
reach stackers and terminal tractors. These vehicles are usually the largest direct source of CO2
emissions within a port, and they account for approximately 70% of emissions caused by traffic
on land within the port area. Eco-driving is a way of driving that contributes to reduced fuel
consumption. It is also called “economical driving”. Working Eco-driving is a method of driving
developed specifically for working machines. (33)
Working Eco-driving involves (33):
Driving with consideration in order to predict various events and avoid unneces-
sary halts. Well-planned logistics can avoid unwanted detours.
Keeping a steady speed, as the most important way to save fuel and protect the
environment.
Keeping to a suitable revolutions per minute (rpm) range through each stage of
driving and lifting.
Avoiding high rpms, which mean higher fuel consumption and increased engine
wear.
Accelerating machines in an environmental-friendly and efficient way.

31
Eco-driving is a term used to describe the energy efficient use of vehicles. It is tempting to drive
a little too aggressively when you move from one task to the next using a terminal tractor or a
straddle carrier. But this is very hard on the vehicles and expensive on fuel. Eco-driving is all
about learning to drive as economically as possible. One parallel benefit is that driving at slower
speeds is also less stressful for machine operators. (34)
Route optimization
Ports can also utilize software process optimization tools to enhance equipment deployment
procedures, resulting in further operating efficiencies, and reduced pollution and emissions with
expected fuel savings of 5-8%. The optimization tools anticipate yard traffic and container flows,
and minimize RTG moves in the yard through sophisticated planning algorithms. Global Pooling
processes also eliminate unproductive driving, idling, crane delays and traffic congestion. (35)
Significant savings have been achieved in a several ports by adopting eco-driving tech-
niques. Two of these cases are introduced below.
Eco-driving case: the Port of Copenhagen(DK) and Malmö (SWE)
For several years, machine operators at the Port of Malmö have been driving in accordance with
the rules of eco-driving, and this has reduced fuel consumption by 10-15% a year on average.
Combined with the lower level of wear-and-tear on the vehicles, this led to savings of around
€110,000 (I million SEK) in 2009. (34)
Machine operators at the Port of Copenhagen are also learning to drive in more environ-
mentally friendly ways when they handle containers. The port’s eco-driving programme aims to
reduce the burden on the environment by promoting more economic driving, while also there-
by reducing expenditure on fuel and wear-and-tear on vehicles. (34)
Eco-driving is part of the twin ports’ initiative to improve the environment. One important ele-
ment in the company’s environmental policy is that gas and particle emissions from fuel con-
sumption must be reduced, as must the consumption of diesel fuel per tonne of goods handled.
Around 80 employees are to be trained in eco-driving, including the teams in the workshops
who also operate all of the machinery types when they have to be serviced. The entire training
course takes place down at the port in familiar surroundings, and it should be a successful expe-
rience. (34)
Eco-driving case: the Port of Gothenburg (SWE)
Previous assessments show that the Port of Gothenburg has the potential to reduce its fuel con-
sumption by 15–20% by introducing Working Eco-driving without increasing the time required
for the work. The working machines at the Port of Gothenburg use approximately 4.5 million
litres of diesel each year. This means CO2 emissions could be reduced by approximately 2,000
tonnes annually. The benefits of Working Eco-driving also include financial savings as a result of
reduced fuel consumption and lower maintenance costs. It also contributes to an improved
working environment for both machine operators and those working close by, as it reduces
both noise and stress. (33)

32
The Port of Gothenburg’s key environmental objective is to limit its impact on the climate. A
long-term goal has therefore been set to introduce Working Eco-driving for working machines in
all production areas. When purchasing new machines, these will be adapted to ensure simple
installation of an onboard computer that monitors the vehicle’s fuel consumption. All new ma-
chine operators will also receive training in Working Eco-driving. (33)
In order to measure the possible fuel savings achievable through Working Eco-driving the
following assessment methods have been used (33):
Onboard computers that register fuel consumption were installed on working
machines.
Working machines were operated in the normal way, and their fuel consumption rates
were recorded.
Machine operators received theoretical and practical training in Working Eco-driving.
Working machines were operated in the new way, and their fuel consumption rates
were recorded again.
Fuel consumption rates before and after training were compared to calculate the re-
sults of the change.
1.2.6 Shore-to-ship power systems
Air quality is one of the highest priorities on the environmental and political agenda. The im-
pacts of air pollutants such as CO2, NOx, SO2, hydrocarbons (HCs), volatile organic compounds
(VOCs), lead and particulates vary in scale and range from locally based to regional and global
effects. (6) Ports are quite often situated within or in close proximity to densely populated ur-
ban areas that are often critically affected by air pollution. In addition, being major nodes link-
ing and bringing together international transport chains and related economic activities, port
areas are often part of critical geographical areas when it comes to air quality considerations.
Although port-related emissions contribute only partially to air quality problems in ports and
surrounding areas, these problems can negatively affect the image of ports vis-à-vis their sur-
rounding residential zones, and put serious pressure on port development ambitions. Air quality
issues often lie at the heart of the political and societal debate about economic development
plans and port development projects. The emissions of air pollutants by port operations are
therefore a high priority issue for European port authorities. The main challenge that port au-
thorities face is to apply appropriate control mechanisms in order to manage and reduce port-
related air pollution. (6)
When berthed, ships require electricity to support activities like loading, unloading, heat-
ing and lighting and other onboard activities. Today, this power is generally provided by auxilia-
ry engines that emit carbon dioxide (CO2) and air pollutants, affecting local air quality and ulti-
mately the health of both port workers and nearby residents. The same holds for noise nui-
sance. (36)
As an alternative to onboard power generation, vessels can be hooked up to an onshore
power supply, i.e. connected to the local electricity grid. In this way ships’ operations can pro-
ceed uninterrupted, while eliminating negative side-effects. (36)
Ports nowadays are not normally equipped to supply vessels with electricity from the
dockside, nor are vessels usually equipped to receive power in this way. Around the world,

33
though, many activities in this direction are now underway and interest in such technology is
rapidly growing, spurred on by tougher environmental legislation, a greater focus on emissions
in ports from shipping, and, more recently, rising fuel prices. (36)
A shore-to-ship electric power supply can help eliminate pollution problems such as emis-
sions of carbon dioxide (CO2), sulphur oxides (SOx), nitrogen oxide (NOx) and particles, as well
as noise and vibrations generated by ships in port. With shore-to-ship power, ships can shut
down their engines while berthed, and plug into an onshore power source. The ship’s power
load is thus seamlessly transferred to the shore-side power supply without disruption to
onboard services, thereby eliminating emissions to the local environment. (36)
Shore-to-ship power supply is one of the strategies recommended by the World Port Cli-
mate Initiative for reducing the environmental impact of seagoing vessels in ports. (36) The EU’s
Strategy for the Baltic Sea Region also promotes measures to reduce emissions from ships and
enhance the development of shore-side electricity facilities or emission treatment in all major
ports around the Baltic Sea. (37)
While shore-to-ship systems eliminate onboard emissions at berth, consideration needs to
be given to the emissions associated with power generation as such, as the source of this power
will have a major influence on the overall emission reductions achieved. In particular, if renew-
able energy is used, near-zero emissions of all kinds of air pollutants can be achieved. Studies
suggest that the average carbon dioxide emissions from the EU electricity mix are around 50%
lower than emissions from diesel engines. While coal-fired power plants emit more CO2, they
have lower emissions of nitrogen oxides, particulate matter and sulphur oxides compared with
the alternative of burning marine diesel fuel with a 0.1 sulphur content. (36)
In July 2012 the first international standard for shore-to-ship systems was published, called
IEC/ISO/IEEE 80005-1 Utility connections in port – Part 1: High Voltage Shore Connection (HVSC)
Systems – General requirements. This standard was jointly developed by the International Elec-
trotechnical Commission (IEC), the International Organization for Standardization (ISO) and the
Institute of Electrical and Electronics Engineers (IEEE). (36)
Shore-to-ship systems are today being installed in more and more ports around the world. Most
installations can be found along the east coast of North America and in Northern Europe, due to
these regions’ strong environmental legislation, community pressure and social responsibility. In
Asia they are an upcoming technology in the context of reducing local emissions. (36)
Some ports have already built shore-to-ship electric power systems. The first ports using
such systems are listed in table 4.
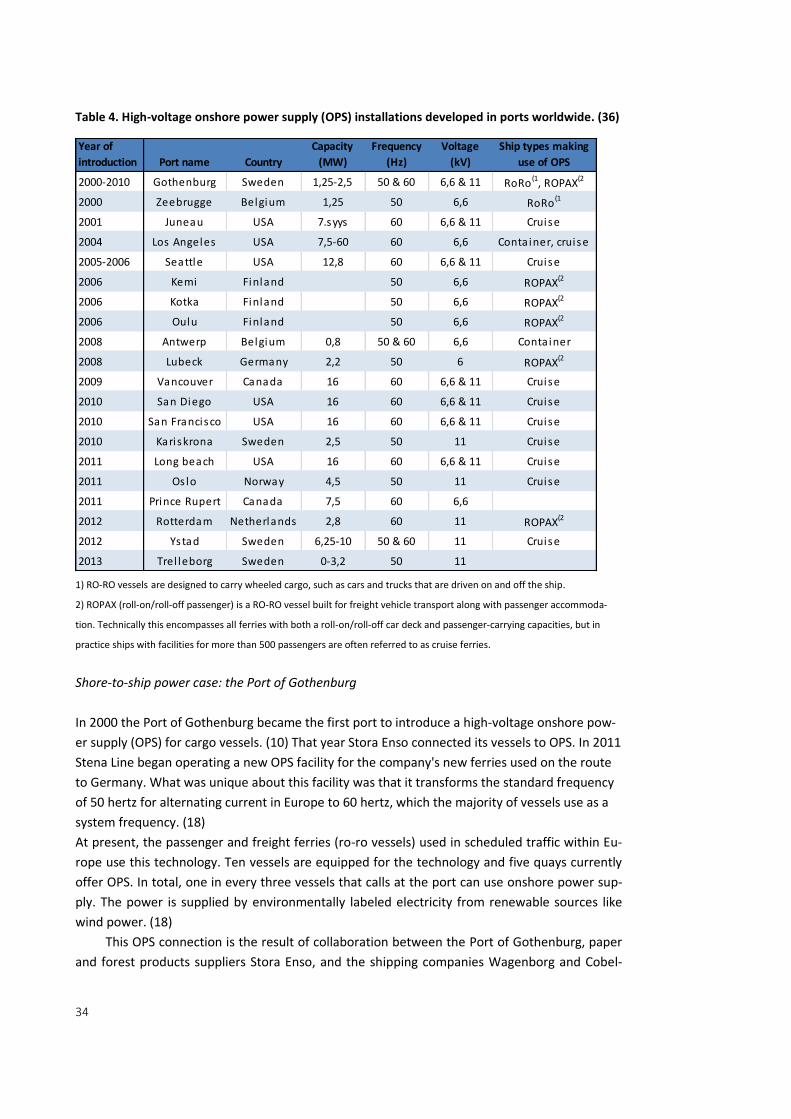
34
Table 4. High-voltage onshore power supply (OPS) installations developed in ports worldwide. (36)
1) RO-RO vessels are designed to carry wheeled cargo, such as cars and trucks that are driven on and off the ship.
2) ROPAX (roll-on/roll-off passenger) is a RO-RO vessel built for freight vehicle transport along with passenger accommoda-
tion. Technically this encompasses all ferries with both a roll-on/roll-off car deck and passenger-carrying capacities, but in
practice ships with facilities for more than 500 passengers are often referred to as cruise ferries.
Shore-to-ship power case: the Port of Gothenburg
In 2000 the Port of Gothenburg became the first port to introduce a high-voltage onshore pow-
er supply (OPS) for cargo vessels. (10) That year Stora Enso connected its vessels to OPS. In 2011
Stena Line began operating a new OPS facility for the company's new ferries used on the route
to Germany. What was unique about this facility was that it transforms the standard frequency
of 50 hertz for alternating current in Europe to 60 hertz, which the majority of vessels use as a
system frequency. (18)
At present, the passenger and freight ferries (ro-ro vessels) used in scheduled traffic within Eu-
rope use this technology. Ten vessels are equipped for the technology and five quays currently
offer OPS. In total, one in every three vessels that calls at the port can use onshore power sup-
ply. The power is supplied by environmentally labeled electricity from renewable sources like
wind power. (18)
This OPS connection is the result of collaboration between the Port of Gothenburg, paper
and forest products suppliers Stora Enso, and the shipping companies Wagenborg and Cobel-
Year of
introduction Port name Country
Capacity
(MW)
Frequency
(Hz)
Voltage
(kV)
Ship types making
use of OPS
2000-2010 Gothenburg Sweden 1,25-2,5 50 & 60 6,6 & 11 RoRo (1, ROPAX(2
2000 Zeebrugge Belgium 1,25 50 6,6 RoRo(1
2001 Juneau USA 7.syys 60 6,6 & 11 Cruise
2004 Los Angeles USA 7,5-60 60 6,6 Container, cruise
2005-2006 Seattle USA 12,8 60 6,6 & 11 Cruise
2006 Kemi Finland 50 6,6 ROPAX(2
2006 Kotka Finland 50 6,6 ROPAX(2
2006 Oulu Finland 50 6,6 ROPAX(2
2008 Antwerp Belgium 0,8 50 & 60 6,6 Container
2008 Lubeck Germany 2,2 50 6 ROPAX(2
2009 Vancouver Canada 16 60 6,6 & 11 Cruise
2010 San Diego USA 16 60 6,6 & 11 Cruise
2010 San Francisco USA 16 60 6,6 & 11 Cruise
2010 Kariskrona Sweden 2,5 50 11 Cruise
2011 Long beach USA 16 60 6,6 & 11 Cruise
2011 Os lo Norway 4,5 50 11 Cruise
2011 Prince Rupert Canada 7,5 60 6,6
2012 Rotterdam Netherlands 2,8 60 11 ROPAX(2
2012 Ystad Sweden 6,25-10 50 & 60 11 Cruise
2013 Trel leborg Sweden 0-3,2 50 11

35
fret. The high-voltage system was initiated by Stora Enso as a way of achieving a green logistics
concept via the port of Gothenburg. (36)
The aim in the short term is that all ro-ro vessels and passenger ferries will be connected
to shore-side power. In the longer term, the aim is that by 2015, 40% of all vessels visiting the
port will use OPS. (18)
Shore-to-ship system case: the Port of Ystad (SWE)
The Port of Ystad has installed shore-to-ship power systems at all ferry berths. This facility,
which currently is the world’s largest, enables the vessels to turn off all main and auxiliary en-
gines powered by fossil fuels during laytime in the Port. Various measurements are performed
making it possible to calculate the achieved effect in terms of emissions of carbon dioxide, sul-
phur dioxide, nitrogen dioxide and noise. (18)
1.2.7 Co-operation between different actors
The management and improvement of port-related supply chains is challenging due to the
complex and heterogeneous operations of the ports, with several actors and processes in-
volved. For this reason the effective sharing of information is of vital importance in port con-
texts. However, the information exchange between different port-related actors is often chal-
lenging. (38)
Environmental considerations can be different for each port, since they depend on the
specific location and characteristics of the port area. The dilemma for the port authority is that
it may not necessarily be directly and legally responsible for the activities, products and services
of certain components of the logistic chain, but its overarching administrative role, ownership of
the estate (land and water) and permanency of operational presence, means that the port is the
obvious point of contact and the readily identifiable player for any environmental issues con-
cerning the whole port area. (6)
There is potential for further integration as seaports proactively act as facilitators of pro-
cedures and of communication between the different parties involved in the logistic chain. The
concept of ports as facilitators refers to the contribution that ports can make in helping the
whole port community (including partners in the logistic chain) to deliver compliance with legis-
lation, prevent pollution, reduce and mitigate environmental impacts, promote sustainable de-
velopment and provide evidence of their satisfactory performance. This has resulted in the
trend within some ports to include their efforts regarding sustainability, as part of their corpo-
rate social responsibility, in their yearly audited, financial reports. (6)
Port authorities do not only work in co-operation with other companies and actors at the
port area, since they may also encourage shipping companies to use cleaner flues and pay more
attention to environmental issues. Quite many ports have launched projects applying the Envi-
ronmental Ship Index (ESI). The ESI is a good indication of the environmental performance of
vessels, and it generally helps to identify “cleaner ships”. Vessels that have good ESI while oper-
ating in the port's fairways, can for example be given financial incentives.

36
Quite many ports have likewise started related co-operation projects, and several examples are
introduced below. All these examples are from ESPO’s “Green guide; Good practice examples in
line with the 5 Es”. (18)
Network for Sustainable Development case: the Port of Aalborg
Together with a few neighbor companies the Port of Aalborg have initiated a network for com-
panies and institutions situated in south-eastern districts of Aalborg. During the first year more
than 50 companies joined the network, which is still growing. The network will contribute to the
development of infrastructure, services, employment and social life within the area. Ten com-
panies have joined forces in a focus group on environment and energy, aiming to create envi-
ronmental improvements through collaboration, the sharing of knowledge and industrial sym-
biosis. (18)
Information sharing case: the Port of Dover
The Port of Dover recognizes the importance of its environmental responsibilities, and experi-
ence has shown that there is much value in publishing and sharing information on environmen-
tal matters. The Port of Dover website has a dedicated environmental section which provides an
array of general information as well as specific environmental reports and polices. This infor-
mation is easily accessible, and updated on a regular basis. (18)
An annual Environmental Bulletin is produced and published on the website, with hard
copies also made available to tenants and local groups. The bulletin highlights progress against
annual environmental objectives and targets, detailing the port’s work and its achievements on
waste, energy, water as well as environmental incidents and environmental quality issues. (18)
Environmental issues are aired at quarterly meetings of the Port Consultative Committee.
This is the main stakeholder engagement forum in which over 60 organizations participate,
ranging from local residents groups through to government agencies. The Port Consultative
Committee provides stakeholders with the opportunity to raise their own port-related issues,
including environmental matters. (18)
Health, Safety and Environment Liaison Group meetings are held quarterly with major ten-
ants, during which environmental issues within the port can be raised and discussed. Tenants
play an important part in the port’s energy consumption, as well as regarding environmental
incidents, so it is important that they are fully engaged with the port on environmental matters.
(18)
Heat and power generation case: the Port of Dover
Port land has been made available to a third party which operates a combined heat and power
(CHP) plant powered by used cooking oil. This plant provides the port with renewable electricity
and free heating. A working partnership has been developed with a tenant whose operation
within the port is very energy intensive. (18)
Environmental Ship Index case: the Port of Hamburg (GER)
37
Stricter air quality standards and interest from nearby residents have prompted the port au-
thorities to take stricter measures to improve air quality. The development of an Environmental
Ship Index (ESI) is a project within the World Ports Climate Initiative (WPCI). The ESI identifies
seagoing ships that perform better in reducing air emissions than required by the current emis-
sion standards of the International Maritime Organization. The ESI evaluates emissions of nitro-
gen oxides (NOx) and sulphur oxides (SOx), and rewards ships that report on their greenhouse
gas emissions. The ESI is a good indication of the environmental performance of ocean-going
vessels, and assists in generally identifying cleaner ships. The index is intended to be used by
ports to reward ships when they participate in the ESI, and it will thus promote clean ships, but
it can also be used by shippers and ship-owners for their own promotional purposes. The ESI
aims at achieving genuine reductions in emissions of NOx, SOx and particulates, as well as CO2
in the longer term, to be achieved by initiating changes in behaviour among ship-
owners/operators and ports. In Hamburg, vessels with an ESI score above 20 points are granted
discounts on harbour fees of up to 10%. (18)
Environmental Ship Index case: the Ports of Bremen/Bremerhaven
The Ports of Bremen/Bremerhaven together with other European ports have applied the Envi-
ronmental Ship Index (ESI) in their port charge system since January 2012. The ESI is one key
project of World Port Climate Initiative where Bremen/Bremerhaven together with 54 other key
ports around the world have committed themselves to reduce their greenhouse gas emissions.
ESI was worked out by a group of ports in North-west Europe including Bremen /Bremerhaven.
If a ship performs better than is legally required, participating ports may reward them with vari-
ous incentives. In Bremen, environmentally friendly ships can be granted a discount on tonnage
charges on submission of an ESI certificate. A total of 25 ships with the best ESI score will re-
ceive such a discount. (18)
Environmental Ship Index case: the Port of Gothenburg
During 2011-2012 the Port of Gothenburg organized a campaign directed at shipping compa-
nies. The vessels that opted for cleaner fuel whilst operating in the port’s fairways were com-
pensated financially. Vessels classified as green according to an international index were also
compensated. Shipping companies could also apply for financial support to convert their vessels
to run on LNG or equivalent clean fuels. (18)
For several years the Port of Gothenburg has applied an environmentally differentiated
port charge. Shipping lines that use fuel with a sulphur content higher than 0.5 % pay a sur-
charge. Income from this sulphur surcharge is then channelled into shipping lines that are in-
vesting in more environmentally friendly equipment. The reimbursement has been arranged in
consultation with the Gothenburg Shipbrokers' Association, environmental organizations and a
number of the port’s customers. (18)

38
Environmental Ship Index case: the Port of Le Havre
In 2009 the Port of Le Havre, in close partnership with the ports of Amsterdam, Antwerp, Bre-
men, Hamburg and Rotterdam, started to establish and implement an Environmental Ship Index
(ESI). The aim of this project is to encourage shipping companies to go beyond the requirements
of current regulations. (18)
The ten cleanest container or Ro-Ro shipping lines, with regard to their emissions into the
air, will be granted an “environmental reward”. An agreement has been signed between the
Port and each shipping company wishing to join the scheme. This agreement specifies the joint
commitments, terms and conditions under which the ESI is applied in Le Havre. A special fund
dedicated to the ESI has been created within the port’s Environment Department to finance the
environmental rewards. (18)
1.3 Environmental issues
As ports are often located in sensitive environmental settings they can result in a range of envi-
ronmental impacts. This chapter introduces the most typical and most important environmental
issues related to port operations.
The environmental issues that ports need to take into consideration include waste man-
agement, dredging, dredging disposal, dust, noise, air quality, bunkering, hazardous cargo, the
land use impacts of port development, and finally discharges from shipping (Table 5). These are
issues that all ports worldwide need to cope with. (39)
Table 5. Environmental issues that ports need to take into consideration. (39)
Ports generate large amounts of waste every year. The handling of this waste is a complex issue,
because it is affected by both national and international legislation. Two different classes of
waste can be defined, originating from two different sources: port-related waste and ship-
related waste. Waste management procedures involve two main phases, handling and treat-
ment.
The environmental issues considered
at the ports
Waste management
Hazardous cargo
Bal last water
Dust
Dredging
Dredging disposal
Land use
Noise
Air qual i ty
Bunkering

39
Although international conventions are followed and accepted by the majority of shipping com-
panies and seafaring nations, there are still too many cases of ship-generated waste being
dumped in the sea and left to pollute the marine environment. (39) Waste
Waste products generated by shipping can affect the marine environment if they are not han-
dled properly. One example of the irresponsible handling of waste products is the disposal of
garbage or contaminated bilge water directly into the sea. (40)
Ships’ garbage includes all kinds of food-related, domestic and operational waste generat-
ed during the normal operation of a ship. Such wastes need to be disposed of continuously or
periodically. More specifically, ships’ garbage consists of ordinary household waste such as
cardboard boxes, empty glass and plastic bottles, tins and other small containers, as well as
food waste, together with cargo-associated wastes generated in cargo holds, such as dunnage,
wire slings and covering materials (e.g. plastic sheets). (39)
Whereas general cargo and container-handling ports and terminals typically only generate
small amounts of wastes, usually restricted to the waste oils from trucks and other equipment;
the situation at oil terminals and tank farms is quite different. In such ports visiting ships may
generate large amounts of waste oils either from operational spills or from accidental spills. Op-
erational oil spills are predictable by their nature, although the amounts should be minimized.
Accidental oil spills should primarily be prevented to ensure there are only minor problems with
the handling of waste. (39)
Almost all commercial ports need to handle hazardous substances at times. This requires
special care due to the related risks to the environment and the workers handling such trans-
shipments. (40) Ballast water
Ships make use of ballast water to control their balance and buoyancy. Intakes and releases of
ballast water may occur in locations that have completely different marine ecosystems. This
may result in the accidental release in ballast water of marine species alien to their new sur-
roundings. Some of these species may thrive in their new surroundings and become problemat-
ic “invasive species”. Such species can have serious impacts on the ecosystems they are re-
leased into. The Baltic Sea and the North Sea have both suffered from the negative impacts of
such invasive species. To minimize the risks associated with ballast water releases, the water
can for example be treated with chemical substances or filtered. (40) Air pollution
Port-related activities are heavily dependent on energy. Large amounts of energy are used, for
example, during the incoming flows of goods, various kinds of processes taking place in the
port, and subsequently the outgoing flows of goods. These different processes consume vast
amounts of energy, mostly derived from fossil fuels, so they result in high emissions of green-
house gasses. (40)
40
The most significant sources of air pollution from port operations include combustion emissions
from ships’ propulsion and auxiliary engines and boilers. These emissions include sulphur diox-
ide (SO2), nitrogen oxides (NOX), carbon dioxide (CO2), carbon monoxide (CO), fine particulate
matter [PM], and volatile organic compounds (VOCs). Several of these pollutants are important
greenhouse gases. The next most significant emission sources are vehicles and land-based en-
gines and boilers, whose combustion processes emit similar pollutants. (41)
Ports and port-related areas are large, and traffic flows within, into and out of ports are al-
so huge. Ports’ annual environmental permits include emissions from working machines, road
transport, rail traffic and heating. In wintertime, office buildings and some warehouses must be
warmed. (5)
Ships’ combustion exhaust gases vary depending on the type of engine, the speed and the
load at which they are run, and of course the composition of the fuel used. It is well-known that
diesel exhaust contains identified mutagens and carcinogens. Diesel exhaust particles are small
enough to penetrate to the alveolar region while breathing. (39)
A wide variety of initiatives have been launched to encourage port authorities to under-
take to reduce air pollution through targeted measures and controls. Ideally, newly constructed
ports should be located far away from cities or city centres. The latest trends worldwide are to
site new terminals close to the mouth of the harbour, close to existing transportation infrastruc-
ture, and far from residential areas. Another factor that helps to limit air pollution is the devel-
opment of cleaner diesel fuels. Although high-sulphur diesel is most widely available and
cheaper, other more favourable options available include low-sulphur diesel (≤ 15 ppm sul-
phur), diesel emulsions, biodiesel and Fischer-Tropsch diesel. (39) Fugitive dust in city ports
Problems with fugitive dust emissions in ports are similar to those related to air pollution. Dust
emissions form part of the wider air pollution problem, and they are covered by the same direc-
tives, conventions and international agreements. Dust is considered as a set of particles emitted
to air that may constitute visual, physical, chemical or health hazards for employees and the
public. The most common sources of dust include the open storage, handling and spillages of
dry bulk cargoes. Fine particles require little wind to create dust. (39)
Fugitive dust is particularly emitted from coal and iron ore storage and handling sites in
ports. Even though numerous reports and research studies have focused on fugitive dust emis-
sions from traffic on roads and in industrial areas, few attempts have been made to measure
and estimate the amounts of dust emitted during port activities. (39) Dredging and the disposal of dredged materials
Dredging activities involve the periodic removal of material from the seabed in the approach
channels to ports and harbour basins, in order to maintain channel widths and depths in previ-
ously dredged areas to ensure safe access for vessels. (39)
Dredging activities have two main aspects that affect the environment. The first is the
dredging process itself, and the second concerns how and where the dredged materials is dis-
posed of. Dredging may significantly affect the environment by reducing water quality. (39)

41
Noise
Noise pollution is another aspect of pollution created by port activities. Noise pollution should
not be underestimated. Noise can play an important role in people’s lives and health. Certain
types of noise, either too loud or too low frequency sounds, may become a health risk for hu-
mans. It is therefore important for the port authorities to have all the appropriate equipment
needed to measure noise levels, as well as opportunities to control potential noise pollution.
(39)
One aspect of the noise pollution problem in ports concerns the diesel-powered auxiliary
engines used when ships approach ports and lie idle at dock. The noise levels produced by these
engines can reach 80-120 dB. As port activities have expanded over the decades, the levels of
noise emitted from ships and particularly from large vessels have been increasing as well. (39) Land Use
Shortages of space and the increasing numbers of industries located in port areas may necessi-
tate their expansion into surrounding areas. The needs of many ports are increasing, and at
some point a port may need to be expanded or completely relocated. Most ports are located
near cities and towns. The wastes that they generate contribute to the general environmental
degradation of the nearby urban environment. The scale of their land use may generate several
consequences: (39)
Natural areas close to the port may be destroyed or degraded. In many cases ports are
located next to wetlands or dune systems. Any expansion of a port towards such natu-
ral areas might increase instability and be detrimental to the species that live or feed in
these habitats.
Flora and fauna living in the area affected by expansion may be disturbed. Even if such
areas are not in a natural state, they will host natural flora and fauna. The flora and
fauna living in the area of the expansion will be either lost or forced to move.
The relocation of some port installations may generate social conflicts. Certain installa-
tions might have to be moved to a residential area, for instance. The consequent social
conflicts may be sizeable, and difficult for the state or the local authorities to cope with.
The very existence of the port may result in significant landscape impacts. For instance,
the port infrastructure, the related land-based traffic and the lighting used during night
operations give ports the appearance of a busy industrialized district. This might affect
the aesthetics of the whole environment or the urban areas neighboring the port.

42
2 Interviews
This study aims to find ideas for co-operation on energy efficiency and environmental issues
between ports in countries involved in the Baltic Sea Region Energy Co-operation (BASREC).
Representatives from six ports in the Baltic Sea Region were interviewed and surveyed for this
study: HaminaKotka in Finland, Tallinn in Estonia, Riga in Latvia, Klaipeda in Lithuania, Gothen-
burg in Sweden, and Copenhagen-Malmö in Denmark and Sweden.
The ports were chosen as representing different Baltic Sea coastal countries and different
types of ports, including both cargo and passenger ports. The list of the selected ports was pre-
sented to officials from BASREC, who made related suggestions.
The purpose of the survey was not to compare the ports to each other, but to build up a
picture of the situation in general, and to identify good practices and possible means to en-
hance energy efficiency.
Table 5: Ports visited
Cargo Million tonnes Containers Dry bulk Liquid bulk Gas Cars
Number of passengers
HaminaKotka 14 y y y y y minor
Klaipeda 60 y y y
LNG terminal under construction
45 000
Riga 35 y y y LNG terminal in plans
838 000
Tallinn 28 y y y y 9 200 000
Gothenburg 39 y y y
y 1 690 000
Copenhagen-Malmö
24 y y y y 840 000
The port authorities were contacted before the port visits and received the study plan and the
questionnaires (Annex 1) in advance. The visits took place in April-August 2014, with each visit
lasting one day. Four of the visits were carried out by Mr Hippinen and Ms Federley, and two by
Mr Hippinen alone. The port authorities hosted the visits, but other actors from the ports also
participated in parts of visits or were able to submit information. The stevedoring companies
were particularly of interest because of their important role in energy use. The hosts of the vis-
its are listed in Table 6. Deputy Director Ms Kirsti Tarnanen-Sariola from the Finnish Port Associ-
ation and Director Mr Markku Hakala from the Finnish Port Operators Association were addi-
tionally interviewed.

43
Table 6: The hosts of the visits
2.1 The ports visited
Basic information on the ports’ types, owners and organisations are given below, together with
the names of companies operating within them.
HaminaKotka (FIN)
HaminaKotka is the biggest universal, export, container and transit port in Finland, with regular
connections to all major European seaports and thereby to other parts of the world. As the
largest full-service universal port in Finland, the Port of HaminaKotka deals with all types of car-
go: containers, Ro-ro, liquid bulk, dry bulk, LoLo, gas, project shipments and passenger traffic;
and also provides versatile value-added services.
The port company is owned by the municipalities of Hamina and Kotka. The land area is
owned by the municipalities; the port company has rented the land and sub-lets areas on to
tenants. The tenants are responsible for the warehouses, the machinery and their energy use in
The hosts of the visits
HaminaKotka
Teppo Jokimies, Technical director
Saana Vuorinen, Maintenance engineer
Arto Sinikannas, Production Manager Steveco
Klaipeda:
Dalia Gun, Marketing specialist
Riga
Inita Luna, Director of Environmental and Development Departament
Vilis Avotins, Head of Environmental division
Vilis Uzulis, Powerman
Imants Zurins, Representative of Riga Commercial port
Vita Gerharde, Specialist of Marketing Department
Tallinn
Ellen Kaasik, Head of Quality and Environmental Management Department
Carl-Juri Piht, CEO of Green Marine
Patrick Gerber, TS Energy
Gothenburg
Jan Inganäs, Senior Advisor
Susan Dutt, Quality Manager and Sustainability Specialist
Copenhagen-Malmö
Petra König, Environmental manager, Civil Engineering Department Malmö
Hans-Olov Ivarsson, Manager, Civil Engineering Department Malmö
Other
Kirsti Tarnanen-Sariola, Deputy director, Finnish Port Association
Markku Hakala, Director, Finnish Port Operators Association

44
their respective areas; while the port company is mainly responsible for infrastructure, such us
the lighting of roads and yards.
About 200 companies operate within the port. These companies have their own contracts
with power companies, and details about total power consumption are not available. District
heat and natural gas are available.
Industrial production facilities also operate within the port, and these are the biggest en-
ergy user of the port. Some of these facilities have their own heat production (steam boilers).
Cranes are the biggest energy consumers within the port operations as such. They are
mainly owned and operated by the stevedoring companies.
There is widespread collaboration between companies within the port, including joint pur-
chases of oil spill response capacity and shared development work for the port area. The com-
panies have joint meetings concerning port development, although energy issues only play a
minor role in these discussions.
Tallinn (EE)
The port of Tallinn consists of five separate harbours: the Old City Harbour in Tallinn, Muuga,
Paljassaare, Paldiski South and Saaremaa. The Old City Harbour mainly functions as a passenger
harbour, but also handles ro-ro cargo carried between Estonia, Finland, Sweden and Russia.
Muuga harbour, the biggest harbour in Estonia, is located 20 km east of Tallinn and specialises
in handling transit traffic: containers, solid and liquid bulk goods, general and ro-ro cargo.
Paljassaare handles break bulk, coal, oil products, timber and perishables. Paldiski South is lo-
cated 45 km southwest of Tallinn, and serves Estonian foreign trade and also transit traffic via
Estonia. Saaremaa serves passenger traffic, recreational vessels and cruise ships.
The port is a state-owned limited liability company, which provides infrastructure, land,
quays and sea approaches, while private operators provide superstructure such as handling
equipment and warehousing. The port’s energy is provided by a subsidiary, and another subsid-
iary handles waste management. The existence of this port energy company enhances the over-
all planning of the port’s energy use, although tenants are still responsible for energy use and
energy efficiency in their respective areas.
Riga (LAT)
The Freeport of Riga lies on both banks of the River Daugava and has a total length of 15 kil-
omet-res. The estimated loading capacity of the terminals of the Freeport of Riga amounts to 45
million tonnes per annum. By cargo turnover Riga is Latvia’s biggest port, and also the biggest
port in the Baltic States (36 million tonnes and 3,956 vessels in 2012). Up to 80% of the Free-
port’s cargo turnover is made up of transit cargoes. 34 stevedoring companies and 28 shipping
agents operate at the port. The main types of cargo handled are containers, various metals,
timber, coal, mineral fertilizers, chemical cargoes, oil and food products.
The port company is owned by the State of Latvia and the City of Riga. 34 stevedoring
companies work in the area. A total of 5,000 people work in the port, of whom 385 work for the
port authority. Tenant companies are responsible for the warehouses, cranes and other tech-

45
nologies used in the port. Industrial facilities also operate in the port area, including shipbuild-
ing yards and oil refining plants.
Klaipeda (LT)
Klaipeda State Seaport is the northernmost ice–free port on the east coast of the Baltic Sea. It is
the largest and most important Lithuanian transport hub, connecting sea, land and railway
routes from east to west.
Klaipeda is a multipurpose, universal, deep-water port, providing high quality services. 14
major stevedoring companies, ship repair works and shipbuilding yards operate within the port,
as well as many types of marine business and cargo handling services.
The port is well connected with important industrial regions in its Eastern hinterland (in
Russia, Belarus, Ukraine etc.).
The port company is state-owned. The company rents out areas to stevedoring companies.
These tenants are responsible for infrastructure, including the lighting of the areas they rent. 14
stevedoring companies operating in the port, all of them Lithuanian. Information on their ener-
gy consumption is collected from these companies, but consumption is not monitored. The port
reports on its annual total consumption of electricity, heat, natural gas and water.
Gothenburg (SWE)
The Port of Gothenburg is the largest port in Scandinavia, with over 11,000 vessel calling each
year. Almost 30% of Swedish foreign trade passes through the port. The Port of Gothenburg
offers a very wide range of routes, with traffic to over 140 destinations throughout the world,
including direct routes to the USA, the Middle East, India and other parts of Asia.
The Port of Gothenburg is the only port in Sweden with the capacity to receive the very
largest ocean-going container vessels.
Around 25 rail shuttles depart each day, offering companies throughout Sweden and Nor-
way a direct, environmentally favourable link to the port, and the opportunity to utilise a broad
range of routes.
The Port of Gothenburg has terminals for containers, ro-ro, cars, passengers and oil and
other energy products. Since 2010 the port has been divided into a municipal Port Authority and
separate terminal companies that deal with operational functions.
The port company is owned by the City of Gothenburg. The company owns the land and
the infrastructure. Terminal operations are carried out by privately owned companies. The con-
cession agreements between each terminal operator and the Port Authority oblige co-operation
on common environmental issues, including climate impacts (CO2 footprints).
Copenhagen-Malmö (CMP)
CMP is located in the heart of the Øresund Region within a short distance of almost four million
consumers. The region is experiencing increasing integration between the Danish and Swedish
sides of the strait. At the same time, the region is the gateway to the entire Baltic Sea Region
with its population of more than 100 million people.
46
CMP provides access to an infrastructure that ensures goods are processed quickly and safely.
The company is the major port operator in the Øresund Region, and meets demands for the
transport of consumer goods, new cars, aviation fuel, building materials, passengers, etc.
CMP is one of the biggest port and terminal operators in the whole Nordic Region, and al-
so one of the largest Northern European cruise-ship ports, also occupying a key position in the
Baltic Sea Region for the distribution of cars and transit oil.
The port is situated in two cities in two countries. The port company has different owners:
the Danish part is owned by the State of Denmark and the City of Copenhagen; and the Swedish
part by the City of Malmö and private investors. The port company also operates the stevedor-
ing, which makes it different to the other ports visited for this study. The port company pur-
chases the energy used in the port, and the tenants pay for energy according to their consump-
tion levels. The port company is responsible for all the machinery, vehicles and infrastructure,
and makes decisions related to energy use.
2.2 Energy consumption
The ports were asked if they can specify how much energy is consumed, and where. The goals
here were to discover the extent of knowledge of energy use, to examine how the monitoring of
energy consumption is arranged, to find out where the big energy consumers are, and to identi-
fy where there may be possibilities to increase energy efficiency.
HaminaKotka
The companies have their own contracts with power companies: the total consumption of the
port is not known. District heating and natural gas is also delivered, and some companies have
steam boilers of their own. The stevedoring companies are the biggest energy users.
Klaipeda
The companies have their own contracts with the power companies. Figures for the total con-
sumption of the 14 stevedoring companies are compiled, including electricity, heat, natural gas,
drinking water and process water. The authority does not know the details of different partners’
contracts or the prices of the energy purchased. Energy consumption itself does not play an im-
portant role in decision making, but energy prices seem to be important.
Riga
An old coal-fired power plant provides heating in the port. Electricity is purchased. The pur-
chased electricity is from the Latvian national grid and it is both imported and produced in Lat-
via based on natural gas and hydropower. Energy costs account for about 10% of all the port’s
costs. Some cranes have their own power metering.

47
Tallinn
The energy subsidiary of the port supplies energy for actors within the port and tenants are
billed directly by the company, based on their directly measured monthly consumption levels.
End-users are responsible for controlling their own energy use. The energy company does not
have production of its own. Lighting, cranes and heating were described as the biggest source of
energy consumption.
Gothenburg
The Port Authority and each operating company are responsible for controlling energy use in
the areas and buildings under their own responsibility. Energy consumption levels are measured
through metering for electricity and heat, and by using fuel invoices.
Copenhagen-Malmö
As the port company takes care of stevedoring in the port, it also consumes most of the energy
used in the port. The energy consumption of tenants is metered for charging purposes. The
company is also responsible for decisions related to energy. The port’s environmental permits
require reporting of energy consumption levels. Fuels play an important role in energy use. The
diesel fuel used by various vehicles is seen to be the most important energy usage, and it is
hoped that consumption levels can be cut because of its high price. Electric and hybrid vehicles
have been considered as replacements for diesel-fuelled vehicles. Electricity use is metered by
more than 100 meters for the purposes of billing tenants with many separate contracts. The
fuel consumption rates and CO2 emissions of all vehicles are monitored and calculated.
2.3 Shore-to-ship systems
Shore-to-ship systems are used to improve the air quality near the port area and/or to reduce
the CO2-emissions of the port activities.
As the ports are often situated near to residential districts or city centres, air emissions
from visiting ships may play an important role in local air quality conditions. Emissions can be
decreased by supplying the power needed by ships in the harbour from the local grid, so that
ships do not have to use their engines for power production.
If the port purchases or produces renewable energy, the CO2-footprint will decrease when
the ships use energy from the grid instead of generating their own electricity.
The Port of Gothenburg can be seen as forerunner in building shore-to-systems. Its high-
voltage system since has been in use since 2000, and a low-voltage system was set up in 1989.
Ships using shore-to-ship systems get a 97% reduction in their electricity taxation. The port is
also collaborating with other ports along the same shipping routes to promote shore-to-ship
systems.

48
Table 7: The shore-to-ship system in Gothenburg.
Klaipeda and Riga have low-voltage connections for smaller vessels.
As HaminaKotka has little passenger traffic and the stevedoring is done by machinery on
the berth, not by the cranes of vessels, there has been little interest in ship-to-shore systems.
Moreover, there are no crowded residential areas near the port, so exhaust emissions from the
vessels have not been seen as a problem.
The Port of Tallinn has a plan to establish a shore-to-ship system for ferries. This is de-
pendent on the commitment of ferry lines and support from regulatory frameworks. In the port
of Copenhagen-Malmö discussions with shipping companies concerning a possible shore-to-ship
system are ongoing. As a major investment, this development is competing with planned in-
vestments for an LNG terminal.
Shore-to-ship systems are expensive investments, and commitment to use a new system is
needed from ferry operators and shipping companies.
There is still lack of standardisation of such systems, which hinders their use, especially for
vessels that may not visit a particular port regularly. This process may be easier for ferry lines
with regularly scheduled visits.
New systems compete for financing with other investments such as LNG terminals in ports
side and sulphur scrubbers on ships.
The driving forces behind investments in shore-to-ships systems may be the opportunity
for ports, ferry lines and shipping companies to have a greener image, possibly under pressure
from their clients.
Cruisers and ferries typically remain in harbours for relatively long periods, and their ener-
gy consumption levels in harbour are high compared to cargo vessels. These factors increase the
attractiveness of using grid electricity.
2.4 Renewable energy and alternative fuels
The ports were asked if they produce or purchase renewable energy, or if alternative fuels are
used in machinery or vehicles, or if there are plans to switch to such energy sources.
As stated earlier, the tenants in the ports usually have their own contracts for electricity
supply, and the port company does not make decisions on the origin of the purchased electrici-
ty. Both Copenhagen-Malmö and Gothenburg purchase renewable electricity.

49
The ports did not have electricity production of their own. Some had plans to utilize solar ener-
gy for heating, or replace natural gas with biogas. The wide areas of warehouse roofs give good
possibilities for utilizing solar energy.
As diesel fuel consumption was seen problematic in Copenhagen-Malmö, alternative ener-
gy sources for vehicles were under consideration, including electric, hybrid and gas-fuelled vehi-
cles, which may be used when possible. Employees have access to a carpool with a gas-fuelled
car that can be used for business appointments.
2.5 Energy efficiency
Questions relating to energy efficiency covered energy monitoring and management, infrastruc-
ture, machines and vehicles, and the behaviour of personnel.
2.5.1 Monitoring and management
Port representatives were asked to rate the importance of the role that energy efficiency plays
in decisions made by the port, and to specify whether the port has an action plan to increase
energy efficiency, either as a separate programme or part of a wider environmental
programme. They were also asked how responsibilities are shared and collaboration is arranged
between different actors. Targets and levels of monitoring of energy use were also discussed.
None of the ports have a specific action plan for energy efficiency. Their environmental
programmes or environmental permit conditions may, however, include energy issues or de-
mands related to the monitoring and reporting of energy consumption.
The allocation of responsibility for energy issues varied between ports. Since many differ-
ent actors are present in ports, responsibilities are sometimes spread widely, and there is a lack
of overall management of energy issues. Energy issues are typically one of the areas of collabo-
ration between companies in a port, but they have not been given a high priority. Data on ener-
gy consumption in a port area is usually collected from the companies working there, but no
detailed information is available on exactly where the energy is consumed or how efficiency
could be increased.
In the Port of Tallinn, the port energy company is responsible for supplying energy
throughout the port, but tenants are responsible for their own energy use.
As operations in Copenhagen-Malmö Port are carried mainly by the port company, energy
questions are easier to review at the port level.
2.5.2 Infrastructure
This section of the interviews concentrated on lighting and storage conditions (i.e. heating, cool-
ing etc.) Responsibility for these issues is divided between different actors within the ports.
Usually the port company or authority is responsible for the lighting of the shared areas of the
port, and the tenants are responsible for the lighting of the areas they rent. The situation was
same regarding buildings and warehouses.
50
Lighting
Lighting is one of the biggest energy consumers in the ports. Thanks to the rapid development
of new lighting technologies, it is also one of the areas where energy consumption can most
easily be reduced This can be done by changing the light sources, or by controlling or focusing
the lights better so that lights are only on when and where they are needed.
The ports are actively switching to LED technology. This technology is developing quickly,
and the prices of lighting solutions are decreasing. LED lights have already been installed for
indoor lighting in warehouses, offices and passenger terminals in many places. The use of LED
applications outdoors for lighting roads and yards is still rare, however, and companies are still
evidently seeking reliable applications for these purposes.
Lights controlled with presence detectors are especially used in indoor locations. Motion
detectors switch on the lights when they are needed, and the lights are automatically switched
off when they are no longer needed.
The port of HaminaKotka has in some areas installed lighting systems that can be switched
on and off remotely by mobile phone.
One special area within the ports is the car terminals. In one of the visited ports an agree-
ment of with a car importer stipulated that the lighting in the car terminal must be kept on at a
certain level during the night. In another port, contrastingly, a car terminal could be left unlit,
with lighting controlled by motion detectors.
Even in locations where control systems for lighting are available, their effect on energy ef-
ficiency may be limited if they are not used properly. Respondents mentioned several locations
where personnel often forget to switch of lights when they are no longer needed. Here, as in
many other areas for action, the training and motivation of personnel plays an important role.
Buildings: warehouses, offices, staff rooms, passenger terminals
Warehouses were not generally heated. Their heating, ventilation and insulation may however
need to be taken into account in energy efficiency contexts in future.
The port authorities typically reported that the energy efficiency of their offices or other
buildings where staff is based is an issue that arises whenever energy efficiency is considered.
Many buildings have undergone energy audits and renovations involving improvements in their
energy usage. These methods are no different to those used for buildings in other sectors, and
there are no special issues related to ports in this context. However, the port companies and
their tenants could be given incentives or rewards for auditing their buildings.
Relatively little information about passenger terminals was obtained from the interview-
ees, as the terminals are not within the responsibility of the authorities or companies inter-
viewed, but are run by other operators or their subsidiaries. Some answers were obtained after
the visits, however.
In Tallinn, over the last 5-7 years many actions designed to improve the energy efficiency
of passenger terminals have been carried out in relation to lighting (replacement and automa-
tion), HVAC and general control systems. One ongoing concrete action is the implementation of
a new energy concept for Passenger Terminal D. This terminal is going to be enlarged, and its
heating system (currently 100% electric) will be changed, with air or seawater source heat pump

51
solutions presently seen as the most favourable options. The insulation of the existing terminal
will also be reevaluated, while the new part of the building will be so large that the whole build-
ing has to fulfil criteria in the EU building directive, so this may entail the total refurbishment of
insulation. Tallinn has performed energy audits for the terminal buildings, and has plans for the
continuous monitoring of their energy consumption.
2.5.3 Machines and vehicles
Another part of the questionnaire covered the energy efficiency of the machines and vehicles
used in ports:
Heavy machinery
The heavy machinery used for loading and unloading ships is mainly owned by the companies
who use them, though in some cases machinery is owned by the port company and rented to
users.
This type of heavy machinery usually has a long service life, typically 20-25 years. Even
though the energy efficiency of such machines has increased greatly, thanks for instance to the
use of generators that can recover potential energy from the lifted cargo, the rate of machine
replacement remains low due to the machines’ long service life time and high investment costs.
The energy consumption characteristics of machinery and vehicles were in general taken
into account during purchasing processes. In Copenhagen-Malmö, for example, environmental
personnel participate in purchasing decisions.
On the other hand, reliability is widely seen as a much more important parameter when
choosing machines or vehicles, and this may lead to the choice of a less energy efficient alterna-
tive.
Use of machines and vehicles
Training in eco-driving is commonly given in the ports visited. However, the effectiveness of
work was seen as more important than energy savings. Even where fuel consumption is moni-
tored, there are no related incentives for fuel-savings, while there may be incentives for effi-
cient work, so for operators it is more important to work quickly than to save energy. It was also
noted that since operators may not benefit from energy saving, they may not bother to turn
vehicles when they are not in use. Also in some cases a less efficient older vehicle may be used
instead of a newer one considered to be less comfortable or more difficult to operate.
There are two ways to affect energy consumption by routing. The first involves making the
road network as efficient as possible to eliminate unnecessary kilometres. The ports are cur-
rently working to improve the efficiency of their routing and road networks. This work is more
driven by considerations related to overall efficiency and safety, though such measures also
save energy.
The second way is to use software optimisation tools to enhance equipment deployment
procedures, resulting in further operating efficiencies. These tools are designed to optimise yard
52
traffic and reduce unnecessary transfers and lifting of cargo, so they may also lead to consider-
able energy savings.
2.6 CO2 footprints
The ports were asked if they have estimated their CO2 footprint. A carbon footprint is defined as
“the total set of greenhouse gas emissions caused by an organization, event, product or per-
son”.
Practices regarding estimates of the CO2 footprints of port activities differed greatly be-
tween different ports. The Port of Gothenburg has set a good example by calculating its CO2
emissions and having an action plan for decreasing greenhouse gas emissions:
Monitoring is conducted by collecting data on energy consumption, and estimating the
related CO2 emissions.
The development of the Carbon Footprint of the Port Authority has been based on ISO
14064–1:2006 & the Greenhouse Gas Protocol. The port’s footprint has been estimated
every year since 2010 (when the Port of Gothenburg was transformed into a Port Au-
thority and Terminal Operating Companies). The CO2 emissions of the port authority
and the terminal operators are compiled for an annual report published within the
port’s Climate programme.
The port is required to report emission data annually to its licensing authority.
The port authority also compiles data for its own annual sustainability report and quar-
terly internal target reviews.
The other ports visited have not estimated their carbon footprints. Estimates may have been
made for some aspects of operations, such as fuel consumption, but not for the whole port.
However, ports acknowledged that such procedures will be necessary in the future.
2.7 Industrial parks
Industrial activities are carried out in many ports. These may involve production units where
raw materials arriving at the port are refined for export or import; while other industrial activi-
ties may be present to support the port operations. These industrial operations have their own
needs with regard to energy use, and they may also have surplus or waste heat or secondary
material flows that can be used in other parts of the port complex.
Ports are increasingly developing new harbour areas as industrial parks, where industrial
production is integrated with other port operations and industrial companies aim to take ad-
vantage of the harbour infrastructure. This will open up new opportunities to realise industrial
symbioses, where energy and material flows can be utilised effectively.

53
2.8 Environmental factors
Various environmental issues arose during discussions (see below). These issues are not de-
scribed in detail here, and the ports where specific issues were mentioned are not named.
Noise and light pollution where a harbour is near a residential area.
Air pollution involving volatile emissions released during the loading/unloading of oil
products.
Dust emissions from the handling of coal.
Pollution of water with storm water, especially if sea levels increase and storms be-
come more common due to climate change.
Soil contamination due to dredging.
Polluted land: during the long history of one port the ground has been polluted, and
soils have to be decontaminated.
Wastes from scrubbers: Since ships will have to clean their flue gases because of new
SO2 regulations, ports will need facilities for handling scrubber wastes.
As many small companies operate within the port, exact sources of pollution can be
hard to find and eliminate.
The need to use land within the present port area for residential purposes, and to move
harbour operations to new areas.
It is becoming more difficult for companies to operate because environmental rules and
permit conditions are getting tighter all the time.
An example of a port’s environmental activities: the Port of Tallinn
The Port of Tallinn has established a subsidiary to look after waste management. The company
collects and handles different waste fractions from the vessels visiting Tallinn’s harbours. The
company has developed methods and technologies for sorting and refining wastes including
cardboard, used cooking oil, glass and wood, as well as means to handle oily water and sort
hazardous wastes. Wastes are collected from ferries already sorted – and the ferries participat-
ing in the system will get discounts on their fees. Representatives reported that 90% of the
wastes generated in the port are recycled.
2.9 Co-operation
Port representatives were asked about co-operation on energy and environmental issues be-
tween actors within their ports, and between their ports and other actors such as research insti-
tutes.
The different ports are in many respects competitors. However, energy efficiency and en-
vironmental issues are not major business areas for them, so it has been possible for them to
build up co-operation on these areas. Since only a few people within the ports deal with these
issues, networking with their counterparts in other ports can be fruitful in terms of spreading
information and good practices.
Different companies and other actors working in the ports often attend common meetings
about ports’ operations and development.

54
As mentioned above, hundreds of different companies may operate within a port. Some of
these companies are competitors, and co-operation can therefore be seen as problematic even
in areas outside their core business areas. For example, if a company has a steam boiler, it will
be unwilling to sell steam to its competitor even though this would benefit both companies.
Examples of co-operation between port actors have been presented above in this report.
As mentioned earlier, the ports are organized in different platforms, such as the European
Sea Port Organisation (ESPO) and the Baltic Ports Organization (BPO), which have environmen-
tal issues in their Agenda. The ports interviewed are members in both of those organisations,
and most of them are members in the Cruise Europe and the Cruise Baltic organisations, where
environmental issues are also elaborated. Moreover, the ports have different bilateral or group
partnerships going on (such as Tallinn with Helsinki and Stockholm). It may be useful in the fu-
ture, instead of building new networks, utilise those networks on information spreading on en-
ergy efficiency issues.

55
3 Conclusions
Energy efficiency issues related to ports were examined both in existing literature and through
visits to selected ports in countries around the Baltic Sea. In general, it seems that the energy
does not play a very important role in decision-making in the ports and the companies working
in them. However, even if the share of energy costs in ports’ total turnover is still relatively low,
energy efficiency will play a more important role in future because of increasing energy prices
and the present economic situation. Increasing pressure due to environmental reasons and
from ports’ clients may further intensify the need for energy efficiency improvements.
Energy use can be improved in ports in different ways, including: technical improvements
in infrastructure and machines; behavioural changes in the use of machines and infrastructure,
including monitoring and management systems; choices of energy sources; and the comprehen-
sive examination of the different port operations in co-operation with different users in the
port. Seeing a port as industrial park or from perspectives such as process integration and in-
dustrial symbiosis may open up new ideas and opportunities for improvements.
Responsibility for energy and environmental issues in ports is typically divided among dif-
ferent actors within the ports, and there may be no overall vision with regard to energy use and
opportunities to enhance the efficiency of port operations.
Two main driving forces may promote the increased installation of shore-to-ship power
systems in ports. One is the imposition of environmental regulations or permit conditions that
require such systems. Another is the willingness of ferry or cruise companies to use such sys-
tems wherever they are available.
Energy use can in many contexts be reduced through purposeful training and energy effi-
cient practices without additional investments. Training in eco-driving is already widely used in
the ports. Attention should also be paid to the behaviour of port personnel: how can personnel
be encouraged to save energy? Energy efficiency incentive or award systems are not in use in
ports as yet, but they might be possible tools for encouraging improvements.
Recommendations for further work
Information spreading: information about opportunities to increase energy efficiency and its
benefits should be made more widely available among the port authorities and other actors in
ports. This includes information on technologies as well as energy monitoring and management
methods. It could be well worth producing a compilation of examples of best practices for ener-
gy efficiency in ports.
A collaboration network focusing on energy issues at ports in the Baltic Sea countries
could be established to promote the exchange of information. The network should include oth-
er actors in the port sector in addition to the port authorities. Research institutes working with
energy issues could also be asked to join such a network. Another possibility is, instead of new
networks, utilise existing networks for information spreading.

56
Harbour areas could be seen more as industrial parks with different activities including indus-
trial production. This opens up opportunities to use energy and materials more wisely, and to
plan greener production methods and new services. As nodal points of transportation networks
ports are suitable locations for different refining processes related to either the importing or
exporting of goods. New tools should be developed to facilitate the examination of energy and
material flows and potential synergies between different actors.
It is important to develop a resource efficiency monitoring and reporting system to meet
the needs of ports. The existing commercial energy monitoring and reporting systems are not
completely applicable to ports. In such a system it would be important to monitor and report on
both the energy efficiency of port facilities, and vehicle fuel consumption. Development work is
needed to combine the necessary measurement and system technologies. Such a system would
enable a comprehensive environmental monitoring and reporting system to be set up for ports.
Energy Performance Indicators (EnPIs) and other values and process parameters affecting envi-
ronmental efficiency are important factors that should be defined and analysed during the de-
velopment and definition phase of such a monitoring and reporting system. In addition to ad-
dressing energy and fuel consumption, such a system could also be developed to monitor and
report on material flows within ports. The resulting information could then be used to improve
the material efficiency of ports.

57
References
1. Green Port. Ports’ key role in the sustainable logistics chain
http://www.greenport.com/news101/vessel-build-and-maintenance/initiatives/ports-key-role-
in-the-sustainable-logistics-chain [September 30, 2014]
2. Dasgupta, S. What Are Different Types of Ports For Ships?
http://www.marineinsight.com/marine/marine-news/headline/what-are-the-various-types-of-
ports/ [September 30, 2014]
3. Janowicz, K. Energy Efficiency in Sustainable Port Development and Operations. [Presenta-
tion]. AAPA 2013 Marine Terminal Management Training Program. 2013
4. BTO. Baltic Transport Outlook – Workshop. [Online].
http://www.baltictransportoutlook.eu/files/BTO_Strategic%20Port%20Network_Peter_Cardebr
ing_Vilnius%202010-12-06.pdf [September 30, 2014]
5. Brunila, O. The Environmental status of the Port of HaminaKotka A69. 2013. Publications of
the centre for maritime studies University of Turku.
6. ESPO. Green Guide, towards excellence in port environmental management and sustainabil-
ity. 2012. European Sea Port Organization
7. Green Cranes. Green Technologies and Eco-Efficient Alternatives for Cranes and Operations
at Port Container Terminals. [Online]. http://www.greencranes.eu/M2Report.pdf [September
30, 2014]
8. European Commission. Mobility and Transport – Martine.
http://ec.europa.eu/transport/modes/maritime/ports/ports_en.htm [September 30, 2014]
9. University of Turku. Stagnant cargo development in the Baltic Sea ports in 2012.
http://www.utu.fi/en/units/cms/research/projects/marketreview/marketreview2012/Pages/ho
me.aspx [September 30, 2014]
10. PwC & Panteia. Final Report, Study aimed at supporting an impact assessment on:
“Measures to enhance the efficiency and quality of port services in the EU”
http://ec.europa.eu/transport/modes/maritime/studies/doc/2013-07-ia-port-services.pdf [Sep-
tember 30, 2014]
11. ESPO. Green Guide, Annex 2, Legislation influencing European ports. 2012. European Sea
Port Organization

58
12. ESPO, EcoPorts. Top environmental priorities of European Ports for 2013.
http://www.ecoports.com/templates/frontend/blue/images/pdf/Analysis_of_top_environment
al_priorities_2013.pdf [September 30, 2014]
13. Ecoports. Ecoports web page. http://www.ecoports.com/ [September 30, 2014]
14. Climeport. Methodology assessment handbook. http://www.climeport.com/en/news.html
[September 30, 2014]
15. Energy Efficiency Agreements. Continuous improvement of energy efficiency.
http://www.energiatehokkuussopimukset.fi/en/about_the_agreements/cornerstones_of_the_
agreement_scheme/continuous_improvement_of_energy_efficiency/ [September 30, 2014]
16. The Illinois Smart Energy Design Assistance Center. Energy smart tips for warehouses.
http://smartenergy.illinois.edu/pdf/Warehouses%20Niche%20Market%20Report%20FINAL%20-
%2005.02.2011.pdf [September 30, 2014]
17. Motiva Ltd. Motiva Ltd. web page. www.motiva.fi [September 30, 2014]
18. ESPO. Green Guide, Annex 1, Good practice examples in line with the 5 Es. 2013. European
Sea Port Organization
19. Goulding, C. Warehouse Retrofits Can Lead to Big Energy, Tax Savings Thanks to EPAct.
http://www.facilitiesnet.com/energyefficiency/article/Warehouse-Retrofits-Can-Lead-to-Big-
Energy-Tax-Savings-Thanks-to-EPAct--13316 [September 30, 2014]
20. Huston, J. Save Energy in Your Warehouse to Meet Green Initiatives.
http://www.supplychaindigital.com/warehousing/1905/Save-Energy-in-Your-Warehouse-to-
Meet-Green-Initiatives [September 30, 2014]
21. Windle, P. Energy Efficiency Measures for Warehouses.
http://www.facilitiesnet.com/energyefficiency/article/Stock-Up-on-Energy-Savings--5388#
[September 30, 2014]
22. E Source Companies. Improving Energy Efficiency in Warehouses.
http://bea.coopwebbuilder2.com/sites/bea/files/PDF/Sector/Warehouses.pdf [September 30,
2014]
23. World Port Development. New lighting technology saves energy.
http://www.brightlightsystems.com/company/articles/WorldPortDevelopmentTerminalLighting
4-13.pdf [September 30, 2014]

59
24. Hertel, R. LED lighting delivers cost savings to terminal operators.
http://www.porttechnology.org/images/uploads/technical_papers/PTI-22.pdf [September 30,
2014]
25. Green Port. Improved Lighting Technology Supports Port Sustainability.
http://www.greenport.com/news101/marine-civils/technology/improved-lighting-technology-
supports-port-sustainability [September 30, 2014]
26. C2Smartlight. The Pori port entered the era of intelligent lighting.
http://www.c2is.fi/wp/?page_id=373 [September 30, 2014]
27. Green Ports. Amsterdam lights up Rietlanden Terminals.
http://www.greenport.com/news101/marine-civils/technology/amsterdam-lights-up-
rietlanden-terminals#sthash.nSk2OMUI.dpuf [September 30, 2014]
28. DTE Energy. Improve the Energy Efficiency of your Warehouse.
https://www2.dteenergy.com/ [September 30, 2014]
29. University of Rijeka, Faculty of Maritime Studies. Cargo handling equiment on board and in
port. http://www.pfri.uniri.hr/~bopri/documents/16-ME-tal_001.pdf [September 30, 2014]
30. Mulder, S. Energy Management Strategy for a Hybrid Container Crane. 2009. [Master of Sci-
ence Thesis]. Faculty of Mechanical, Maritime and Materials Engineering, Delft University of
Technology
31. Flynn, M. Saving energu using fly-
wheels.https://www.utexas.edu/research/cem/Energy_storage_photos/PR%20492%20Flynn%2
0flywheels.pdf [September 30, 2014]
32. Fredrik, J. Efficient use of energy in container cranes.
http://www.porttechnology.org/technical_papers/efficient_use_of_energy_in_container_crane
s/ [September 30, 2014]
33. Skandia Container. Working Ecodriving at the Port of Goteborg
http://www.skandiacontainer.se/prod/hamnen/ghab/dalis2b.nsf/vyFilArkiv/ecodriving_E.pdf/$f
ile/ecodriving_E.pdf [September 15, 2014]
34. Kristensen, B. ECO Driving benefits the environment and saves money for the Port of Co-
penhagen. http://www.cmport.dk/news-and-media/news/2009/2009-12-01 [September 30,
2014]
35. Green Port. APM Terminals and the eco-efficiency philosophy.
http://www.greenport.com/news101/vessel-build-and-maintenance/initiatives/apm-terminals-
and-the-eco-efficiency-philosophy [September 30, 2014]

60
36. WPCI. Onshore Power Supply. http://www.onshorepowersupply.org/ [September 30, 2014]
37. European Commission. EU Strategy for the Baltic Sea Region.
http://ec.europa.eu/regional_policy/cooperate/baltic/index_en.cfm [September 30, 2014]
38. Posti, A. E-PORT, Improving the efficiency of Finnish ports with intelligent systems, Final re-
port of the Mobile Port project, A58. 2012. Publication from the centre for maritime studies,
University of Turku
39. Antoniou, E., Stamatiou, K. Environmental protection and management of sea ports, The
case of Volvos sea port.
http://connectedcities.eu/downloads/showcases/ENVIRONMENTAL_PROTECTION_AND_MANA
GEMENT_OF_VOLOS_SEA-PORT.pdf [September 30, 2014]
40. Braathen, N. Environmental impacts on international shipping, A case study of the Port of
Rotterdam.
http://www.oecd.org/officialdocuments/publicdisplaydocumentpdf/?cote=env/epoc/wpnep/t(
2009)6/final&doclanguage=en [September 30, 2014]
41. IFC. Environmental, Health, and Safety Guidelines for Ports, Harbors, and Terminals.
http://www.ifc.org/wps/wcm/connect/554e8d80488658e4b76af76a6515bb18/Final+-
+General+EHS+Guidelines.pdf?MOD=AJPERES [September 30, 2014]
42. Green Port. The art of green patchwork: European ports collaborate to innovate.
http://www.greenport.com/news101/Footprint-and-Initiatives/New-Initiatives/the-art-of-
green-patchwork-european-ports-collaborate-to-innovate
43. Green and Effective Operations at Terminals and in Ports. http://www.transport-
research.info/web/projects/project_details.cfm?id=45000
44. Energy.cov. ISO 50001 Energy Management Standard.
http://www.energy.gov/eere/amo/iso-50001-energy-management-standard
45. Green Efforts. Reduction of carbon footprint of ports and terminals – Fiction and reality.
http://www.green-efforts.eu/sites/default/files/Greenport%20Magazine_ Win-
ter%202013_GREEN%20EFFORTS.pdf
46. Green EFFORTS. LED Technology for Container Terminals. http://www.transport-
research.info/Upload/Documents/201211/20121116_
115221_18710_Green_EFFORTS_white_paper_LED_2012_09_28.pdf

61
ANNEX Fact-finding study on opportunities to enhance the energy ef-ficiency and environmental impacts of ports in the Baltic Sea Region – Port survey
The following questions have been listed to help guide discussions during port visits and to find
the proper people and possible background data for the discussions. The findings from the port
survey will be published in the final report of the fact-finding study. Please inform us if any of
the information provide needs to be treated as confidential.
The purpose of the survey is to compile information on important features related to efforts to
enhance energy efficiency at ports. The results will not be used for any kind of comparison of
the ports.
If you have any questions or require further information please contact
Basic information
Basic information on the port
The actors in the port
The owner
Tasks and responsibilities of different actors, especially in relation to energy and
environmental issues
Co-operation between different actors on energy and environmental issues
(information sharing, common projects etc.)
National and international legislation concerning energy efficiency and environmental
issues
Energy consumption
What is the total energy consumption of the whole port
What is the share of energy costs in the total costs of the port
How are energy costs divided between port actors?
What are the areas/operations that use most energy in the port area, or what is distri-
bution of the energy use in the port area?
How do you measure energy use in the port area? What is measured, and how often?
(Port and tenant operations, facilities, vehicles, equipment, power generation, heat pro-
duction and consumption, etc.)
Who is responsible for the control of energy use (heating, ventilation or air conditioning
systems) of the buildings?
Is secondary or waste heat used for heating purposes?

62
Shore-to-ship systems
Do you have a shore-to-ship power system or are you planning to build one?
The share of visiting ships using any shore-to-ship system
Availability of the system for different users
Financial compensation for ships using the shore-to-ship system
Barriers hindering the use of shore-to-ship systems
Other measures taken to enhance the use of any shore-to-ship system
Experiences, need for development
Renewable energy and alternative fuels
Do you purchase or produce renewable energy? Which kind(s)?
Have you shifted to other sources of energy?
Do you use or do you have plans to use alternative fuels or energy sources for vehicles
or machines in the port?
Energy efficiency
Driving forces and barriers with regard to enhancing energy efficiency
Monitoring and management system
How important a role does energy efficiency play in the decisions of the port?
Do you have an action plan to increase your energy efficiency or reduce energy use?
Is it a separate programme or part of a wider scheme such as an environmental pro-
gramme?
Have you set targets for your energy consumption or energy efficiency work?
Who is responsible for energy efficiency or environmental issues, and how is the work
organised between different actors?
Have you surveyed opportunities to improve the energy efficiency of the port?
How do you monitor your energy efficiency (collecting data, analysing data, energy effi-
ciency indicators, reporting results)? When did you start the monitoring?
Do you estimate your CO2 emissions?
Infrastructure
Which kinds of actions have been taken to achieve improvements?
What kind of lighting technologies do you use? How is the lighting controlled?
Any special features of the heating of buildings (economically wise temperatures, waste
heat for space heating etc.)
How are different needs for storing conditions taken into account?
Plans or needs for improvements?

63
The operation of machines and vehicles
Energy efficiency in the procurement of machines and vehicles
Energy efficiency practices for operators
Training of drivers in efficient driving; optimisation of routes
The use of renewable/alternative fuels, or any changes in energy sources
Any other plans?
Personnel
Have organised any training regarding energy efficiency at the port?
Do you have instructions for employees on energy efficiency issues?
Are personnel actively engaged in energy efficiency issues in their everyday work?
Is there any incentive or award system for suggestions related to energy efficiency im-
provements?
Environmental factors
Which are the most important environmental issues for your port? (air emissions, solid
waste, wastewater, noise, dredging, light pollution, etc.)
Are there special needs for the future?
Is financial compensation provided for environmentally friendly vessels or ships?
Co-operation
Co-operation between different actors at the port
Activities involving the exchange of information on energy and environmental issues
Collaboration projects for improvements
Co-operation between ports
Have you co-operated with any other ports regarding energy efficiency or environmen-
tal issues?
Research and development
Are you participating in any research or development projects related to energy
efficiency or environmental issues?
Other issues related to energy use and environmental issues
Any other important issues related to energy or environmental impacts not mentioned
earlier
Future needs and barriers/challenges