Fact book 2014 Q4 - handelsbanken.sefile/hb_q4_14_factbook.pdf · 2014 Q4. HANDELSBANKEN - FACT...
40
Fact book 2014 Q4
-
Upload
dinhkhuong -
Category
Documents
-
view
219 -
download
1
Transcript of Fact book 2014 Q4 - handelsbanken.sefile/hb_q4_14_factbook.pdf · 2014 Q4. HANDELSBANKEN - FACT...
Fact book
2014 Q4
HANDELSBANKEN - FACT BOOK
2 Handelsbanken
Contents
This is Handelsbanken 3
Income statement o Income statement – Handelsbanken Group 4
o EPS - Earnings Per Share 4
o Key figures 5
o Consolidated statement of comprehensive income 5
o One-offs and special items 6
o Fees for the Stabilisation Fund, etc. 6
o Exchange rates 7
o Notes
Net interest income 8 Net fee and commission income 8 Net gains/losses on financial transactions 9 Other administrative expenses 9 Loan losses 10 Impaired loans 10
Segment information 11
Branch operations in Sweden 12 Branch operations in Great Britain 13 Branch operations in Denmark 14 Branch operations in Finland 15 Branch operations in Norway 16 Branch operations in the Netherlands 17 Handelsbanken Capital Markets 18 Other 20
Balance sheet 21
Business volumes 22
o Lending to the public
By sector 22 Credit risk exposure 23 By country, end of period 24
o Savings and deposits
Assets under management 25 Deposits from the public by country 25
Own funds and capital requirement 27
Funding 31
Liquidity 35
Share and shareholders 38
Contacts and Financial calender 40
HANDELSBANKEN – FACT BOOK
3 Handelsbanken
This is Handelsbanken
Founded in 1871, Handelsbanken is one of the leading banks in the Nordic region, with more than 800 branches in 24 countries. The Bank regards Sweden, Denmark, Finland, Norway, Great Britain and the Netherlands as its domestic markets.
HANDELSBANKEN'S GOAL
Handelsbanken's financial goal is to have higher
profitability than the average of its competitors through
having more satisfied customers and lower costs (including
loan losses) than its competitors. This goal has been
reached every year since 1972, or for 43 consecutive years.
BUSINESS PHILOSOPHY
Decentralisation – the branch is the bank
The branches are fully responsible for all customer
relationships, both corporate and private and regardless of
size. For a credit to be granted it always has to be approved
at the branch level. The branch manager is fully responsible
for all business transactions with the customer.
Depending on the size of a credit, additional approvals
may be required at regional and central level.
Focus on customers, not on products
The focus is always on the need of the individual customer
and not on the sale of specific products. As a consequence,
the bank does not perform any central marketing
campaigns. The branch has the best knowledge of the local
customer and marketing activities are therefore decided
locally.
Not a mass market bank
Handelsbanken targets corporate and private customers
with a better cash flow than average.
No sales targets
The business focus is always on profitability and never on
volumes. As a consequence, the bank has no sales targets or
market share goals.
No bonuses
Handelsbanken believes bonuses should be avoided in risk-
taking operations, mainly because they risk providing the
wrong incentives. Consequently, the bank has no bonus
programme for any members of management or for any
staff in the branch office operations, who all work on fixed
salaries.
Fixed salaries, without bonuses, apply to all employees
in the group except for a limited number of staff in the
investment banking and asset management operations.
No budgets
The bank abolished budgets in 1972. In banking, where the
ability to manage and minimize the risk is central, budgets
or other longer term plans risks creating unwanted
incentives and behaviour. Instead, the bank’s decentralised
organisation is focused on being flexible and quick in
adapting to changes in the business environment.
Credit policy
The bank’s credit policy is centralised and non-negotiable.
It is the same in all markets and it remains unchanged over
the business cycle.
Credit decisions should always be made based on the
cash flow and repayment capacity of the customer. A weak
or uncertain repayment capacity can never be offset by a
high margin or by collateral. (For more information, please
see the bank’s Pillar III report available at
www.handelsbanken.se/ireng.)
Low risk tolerance
The bank has a low risk tolerance and the business model is
focused on underwriting and managing ultimate credit
default risk at branch level. The aim is to minimise market
risks and all other risks. Position taking is only accepted in
client-driven transactions and within strictly defined limits.
The bank also aims at reducing macro risks in order to
have a business model that is as independent as possible
from the shifts in the business cycle.
Follow-up and business control
The need for follow-up and control increases with the
degree of decentralisation. Consequently, the business
control system is centralised and monitors profitability and
business activity at individual branch office level.
Regional banks and other business segments are
evaluated on return on equity. Branch offices are monitored
on the cost/income ratio, including risk-weighted cost of
capital, the true funding cost and actual loan losses.
HANDELSBANKEN - FACT BOOK
4 Handelsbanken
Income statement
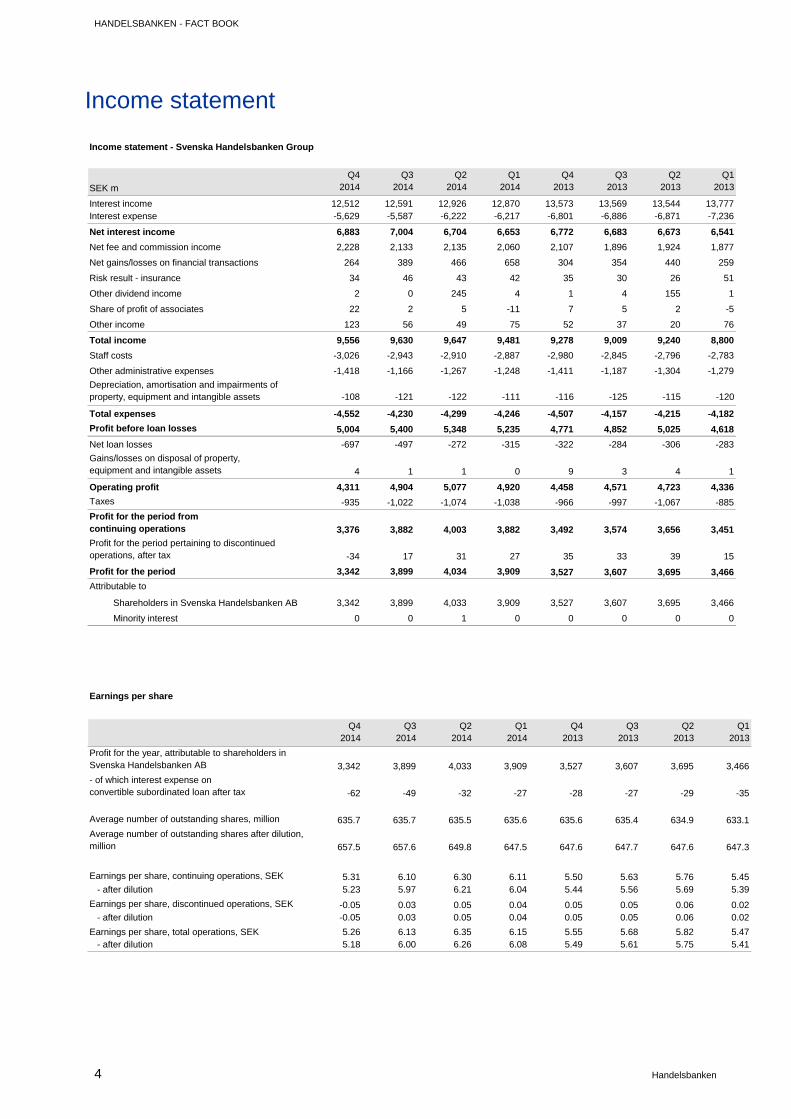
Income statement - Svenska Handelsbanken Group
SEK m
Q42014
Q32014
Q2 2014
Q12014
Q42013
Q32013
Q2 2013
Q12013
Interest income 12,512 12,591 12,926 12,870 13,573 13,569 13,544 13,777Interest expense -5,629 -5,587 -6,222 -6,217 -6,801 -6,886 -6,871 -7,236
Net interest income 6,883 7,004 6,704 6,653 6,772 6,683 6,673 6,541
Net fee and commission income 2,228 2,133 2,135 2,060 2,107 1,896 1,924 1,877
Net gains/losses on financial transactions 264 389 466 658 304 354 440 259
Risk result - insurance 34 46 43 42 35 30 26 51
Other dividend income 2 0 245 4 1 4 155 1
Share of profit of associates 22 2 5 -11 7 5 2 -5
Other income 123 56 49 75 52 37 20 76
Total income 9,556 9,630 9,647 9,481 9,278 9,009 9,240 8,800
Staff costs -3,026 -2,943 -2,910 -2,887 -2,980 -2,845 -2,796 -2,783
Other administrative expenses -1,418 -1,166 -1,267 -1,248 -1,411 -1,187 -1,304 -1,279
Depreciation, amortisation and impairments of property, equipment and intangible assets -108 -121 -122 -111 -116 -125 -115 -120
Total expenses -4,552 -4,230 -4,299 -4,246 -4,507 -4,157 -4,215 -4,182
Profit before loan losses 5,004 5,400 5,348 5,235 4,771 4,852 5,025 4,618
Net loan losses -697 -497 -272 -315 -322 -284 -306 -283
Gains/losses on disposal of property, equipment and intangible assets 4 1 1 0 9 3 4 1
Operating profit 4,311 4,904 5,077 4,920 4,458 4,571 4,723 4,336
Taxes -935 -1,022 -1,074 -1,038 -966 -997 -1,067 -885
Profit for the period from continuing operations 3,376 3,882 4,003 3,882 3,492 3,574 3,656 3,451
Profit for the period pertaining to discontinued operations, after tax -34 17 31 27 35 33 39 15
Profit for the period 3,342 3,899 4,034 3,909 3,527 3,607 3,695 3,466
Attributable to
Shareholders in Svenska Handelsbanken AB 3,342 3,899 4,033 3,909 3,527 3,607 3,695 3,466
Minority interest 0 0 1 0 0 0 0 0
Earnings per share
Q42014
Q32014
Q2 2014
Q12014
Q42013
Q32013
Q2 2013
Q12013
Profit for the year, attributable to shareholders in Svenska Handelsbanken AB 3,342 3,899 4,033 3,909 3,527 3,607 3,695 3,466
- of which interest expense on convertible subordinated loan after tax -62 -49 -32 -27 -28 -27 -29 -35
Average number of outstanding shares, million 635.7 635.7 635.5 635.6 635.6 635.4 634.9 633.1
Average number of outstanding shares after dilution, million 657.5 657.6 649.8 647.5 647.6 647.7 647.6 647.3
Earnings per share, continuing operations, SEK 5.31 6.10 6.30 6.11 5.50 5.63 5.76 5.45 - after dilution 5.23 5.97 6.21 6.04 5.44 5.56 5.69 5.39
Earnings per share, discontinued operations, SEK -0.05 0.03 0.05 0.04 0.05 0.05 0.06 0.02 - after dilution -0.05 0.03 0.05 0.04 0.05 0.05 0.06 0.02
Earnings per share, total operations, SEK 5.26 6.13 6.35 6.15 5.55 5.68 5.82 5.47 - after dilution 5.18 6.00 6.26 6.08 5.49 5.61 5.75 5.41
HANDELSBANKEN – FACT BOOK
5 Handelsbanken
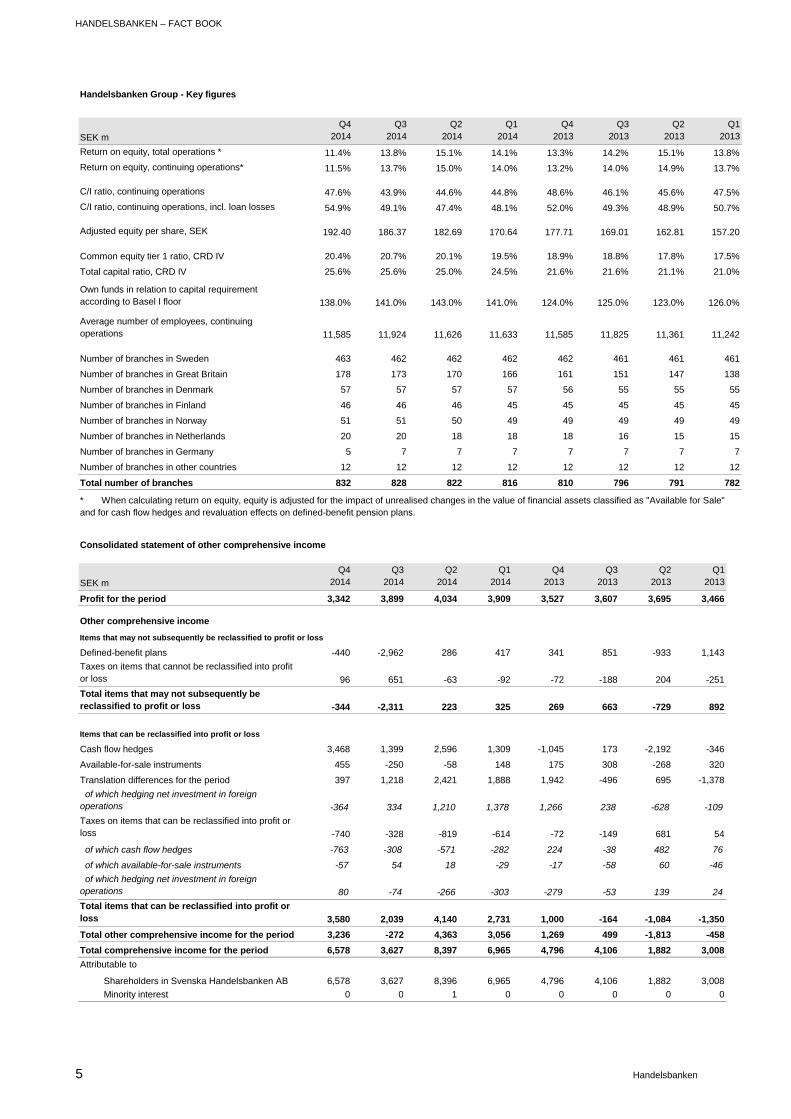
Handelsbanken Group - Key figures
SEK m
Q42014
Q32014
Q2 2014
Q12014
Q42013
Q32013
Q2 2013
Q12013
Return on equity, total operations * 11.4% 13.8% 15.1% 14.1% 13.3% 14.2% 15.1% 13.8%
Return on equity, continuing operations* 11.5% 13.7% 15.0% 14.0% 13.2% 14.0% 14.9% 13.7%
C/I ratio, continuing operations 47.6% 43.9% 44.6% 44.8% 48.6% 46.1% 45.6% 47.5%
C/I ratio, continuing operations, incl. loan losses 54.9% 49.1% 47.4% 48.1% 52.0% 49.3% 48.9% 50.7%
Adjusted equity per share, SEK 192.40 186.37 182.69 170.64 177.71 169.01 162.81 157.20
Common equity tier 1 ratio, CRD IV 20.4% 20.7% 20.1% 19.5% 18.9% 18.8% 17.8% 17.5%
Total capital ratio, CRD IV 25.6% 25.6% 25.0% 24.5% 21.6% 21.6% 21.1% 21.0%
Own funds in relation to capital requirement according to Basel I floor 138.0% 141.0% 143.0% 141.0% 124.0% 125.0% 123.0% 126.0%
Average number of employees, continuing operations 11,585 11,924 11,626 11,633 11,585 11,825 11,361 11,242
Number of branches in Sweden 463 462 462 462 462 461 461 461
Number of branches in Great Britain 178 173 170 166 161 151 147 138
Number of branches in Denmark 57 57 57 57 56 55 55 55
Number of branches in Finland 46 46 46 45 45 45 45 45
Number of branches in Norway 51 51 50 49 49 49 49 49
Number of branches in Netherlands 20 20 18 18 18 16 15 15
Number of branches in Germany 5 7 7 7 7 7 7 7
Number of branches in other countries 12 12 12 12 12 12 12 12
Total number of branches 832 828 822 816 810 796 791 782
* When calculating return on equity, equity is adjusted for the impact of unrealised changes in the value of financial assets classified as "Available for Sale" and for cash flow hedges and revaluation effects on defined-benefit pension plans.
Consolidated statement of other comprehensive income
SEK m
Q42014
Q32014
Q2 2014
Q12014
Q42013
Q32013
Q2 2013
Q12013
Profit for the period 3,342 3,899 4,034 3,909 3,527 3,607 3,695 3,466
Other comprehensive income
Items that may not subsequently be reclassified to profit or loss
Defined-benefit plans -440 -2,962 286 417 341 851 -933 1,143
Taxes on items that cannot be reclassified into profit or loss 96 651 -63 -92 -72 -188 204 -251
Total items that may not subsequently be reclassified to profit or loss -344 -2,311 223 325 269 663 -729 892
Items that can be reclassified into profit or loss
Cash flow hedges 3,468 1,399 2,596 1,309 -1,045 173 -2,192 -346
Available-for-sale instruments 455 -250 -58 148 175 308 -268 320
Translation differences for the period 397 1,218 2,421 1,888 1,942 -496 695 -1,378
of which hedging net investment in foreign operations -364 334 1,210 1,378 1,266 238 -628 -109
Taxes on items that can be reclassified into profit or loss -740 -328 -819 -614 -72 -149 681 54
of which cash flow hedges -763 -308 -571 -282 224 -38 482 76
of which available-for-sale instruments -57 54 18 -29 -17 -58 60 -46
of which hedging net investment in foreign operations 80 -74 -266 -303 -279 -53 139 24
Total items that can be reclassified into profit or loss 3,580 2,039 4,140 2,731 1,000 -164 -1,084 -1,350
Total other comprehensive income for the period 3,236 -272 4,363 3,056 1,269 499 -1,813 -458
Total comprehensive income for the period 6,578 3,627 8,397 6,965 4,796 4,106 1,882 3,008
Attributable to
Shareholders in Svenska Handelsbanken AB 6,578 3,627 8,396 6,965 4,796 4,106 1,882 3,008
Minority interest 0 0 1 0 0 0 0 0
HANDELSBANKEN - FACT BOOK
6 Handelsbanken
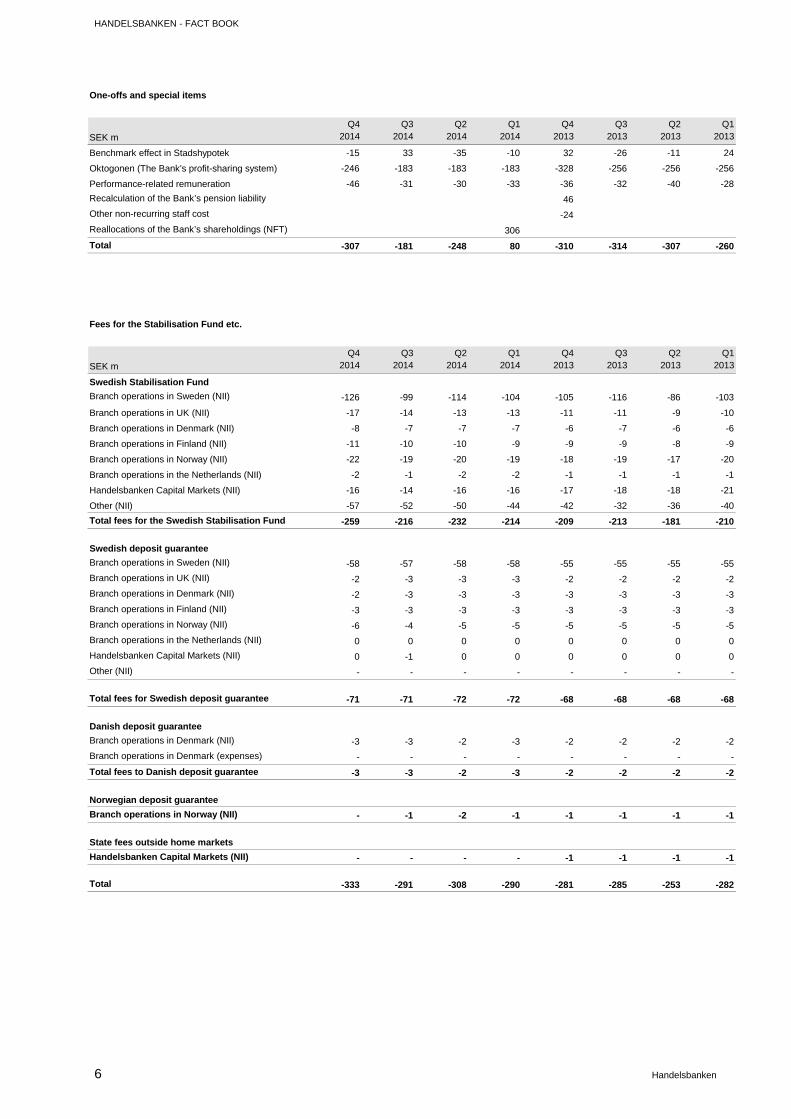
One-offs and special items
SEK m
Q42014
Q32014
Q2 2014
Q12014
Q42013
Q32013
Q2 2013
Q12013
Benchmark effect in Stadshypotek -15 33 -35 -10 32 -26 -11 24
Oktogonen (The Bank's profit-sharing system) -246 -183 -183 -183 -328 -256 -256 -256
Performance-related remuneration -46 -31 -30 -33 -36 -32 -40 -28
Recalculation of the Bank’s pension liability 46
Other non-recurring staff cost -24
Reallocations of the Bank’s shareholdings (NFT) 306
Total -307 -181 -248 80 -310 -314 -307 -260
Fees for the Stabilisation Fund etc.
SEK m
Q42014
Q32014
Q2 2014
Q12014
Q42013
Q32013
Q2 2013
Q12013
Swedish Stabilisation Fund
Branch operations in Sweden (NII) -126 -99 -114 -104 -105 -116 -86 -103
Branch operations in UK (NII) -17 -14 -13 -13 -11 -11 -9 -10
Branch operations in Denmark (NII) -8 -7 -7 -7 -6 -7 -6 -6
Branch operations in Finland (NII) -11 -10 -10 -9 -9 -9 -8 -9
Branch operations in Norway (NII) -22 -19 -20 -19 -18 -19 -17 -20
Branch operations in the Netherlands (NII) -2 -1 -2 -2 -1 -1 -1 -1
Handelsbanken Capital Markets (NII) -16 -14 -16 -16 -17 -18 -18 -21
Other (NII) -57 -52 -50 -44 -42 -32 -36 -40
Total fees for the Swedish Stabilisation Fund -259 -216 -232 -214 -209 -213 -181 -210
Swedish deposit guarantee
Branch operations in Sweden (NII) -58 -57 -58 -58 -55 -55 -55 -55
Branch operations in UK (NII) -2 -3 -3 -3 -2 -2 -2 -2
Branch operations in Denmark (NII) -2 -3 -3 -3 -3 -3 -3 -3
Branch operations in Finland (NII) -3 -3 -3 -3 -3 -3 -3 -3
Branch operations in Norway (NII) -6 -4 -5 -5 -5 -5 -5 -5
Branch operations in the Netherlands (NII) 0 0 0 0 0 0 0 0
Handelsbanken Capital Markets (NII) 0 -1 0 0 0 0 0 0
Other (NII) - - - - - - - -
Total fees for Swedish deposit guarantee -71 -71 -72 -72 -68 -68 -68 -68
Danish deposit guarantee
Branch operations in Denmark (NII) -3 -3 -2 -3 -2 -2 -2 -2
Branch operations in Denmark (expenses) - - - - - - - -
Total fees to Danish deposit guarantee -3 -3 -2 -3 -2 -2 -2 -2
Norwegian deposit guarantee
Branch operations in Norway (NII) - -1 -2 -1 -1 -1 -1 -1
State fees outside home markets
Handelsbanken Capital Markets (NII) - - - - -1 -1 -1 -1
Total -333 -291 -308 -290 -281 -285 -253 -282
HANDELSBANKEN – FACT BOOK
7 Handelsbanken
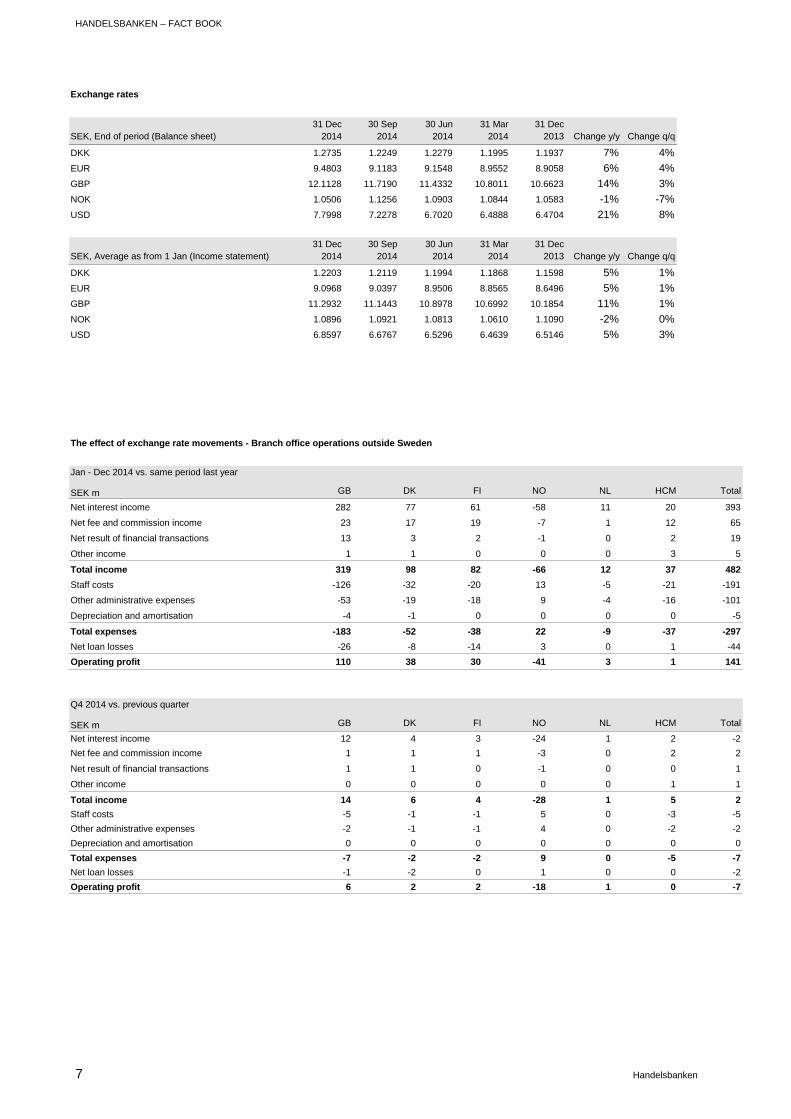
Exchange rates
SEK, End of period (Balance sheet)31 Dec
201430 Sep
201430 Jun
201431 Mar
201431 Dec
2013 Change y/y Change q/q
DKK 1.2735 1.2249 1.2279 1.1995 1.1937 7% 4%
EUR 9.4803 9.1183 9.1548 8.9552 8.9058 6% 4%
GBP 12.1128 11.7190 11.4332 10.8011 10.6623 14% 3%
NOK 1.0506 1.1256 1.0903 1.0844 1.0583 -1% -7%
USD 7.7998 7.2278 6.7020 6.4888 6.4704 21% 8%
SEK, Average as from 1 Jan (Income statement)31 Dec
201430 Sep
201430 Jun
201431 Mar
201431 Dec
2013 Change y/y Change q/q
DKK 1.2203 1.2119 1.1994 1.1868 1.1598 5% 1%
EUR 9.0968 9.0397 8.9506 8.8565 8.6496 5% 1%
GBP 11.2932 11.1443 10.8978 10.6992 10.1854 11% 1%
NOK 1.0896 1.0921 1.0813 1.0610 1.1090 -2% 0%
USD 6.8597 6.6767 6.5296 6.4639 6.5146 5% 3%
The effect of exchange rate movements - Branch office operations outside Sweden
Jan - Dec 2014 vs. same period last year
SEK m GB DK FI NO NL HCM Total
Net interest income 282 77 61 -58 11 20 393
Net fee and commission income 23 17 19 -7 1 12 65
Net result of financial transactions 13 3 2 -1 0 2 19
Other income 1 1 0 0 0 3 5
Total income 319 98 82 -66 12 37 482
Staff costs -126 -32 -20 13 -5 -21 -191
Other administrative expenses -53 -19 -18 9 -4 -16 -101
Depreciation and amortisation -4 -1 0 0 0 0 -5
Total expenses -183 -52 -38 22 -9 -37 -297
Net loan losses -26 -8 -14 3 0 1 -44
Operating profit 110 38 30 -41 3 1 141
Q4 2014 vs. previous quarter
SEK m GB DK FI NO NL HCM Total
Net interest income 12 4 3 -24 1 2 -2
Net fee and commission income 1 1 1 -3 0 2 2
Net result of financial transactions 1 1 0 -1 0 0 1
Other income 0 0 0 0 0 1 1
Total income 14 6 4 -28 1 5 2
Staff costs -5 -1 -1 5 0 -3 -5
Other administrative expenses -2 -1 -1 4 0 -2 -2
Depreciation and amortisation 0 0 0 0 0 0 0
Total expenses -7 -2 -2 9 0 -5 -7
Net loan losses -1 -2 0 1 0 0 -2
Operating profit 6 2 2 -18 1 0 -7
HANDELSBANKEN - FACT BOOK
8 Handelsbanken
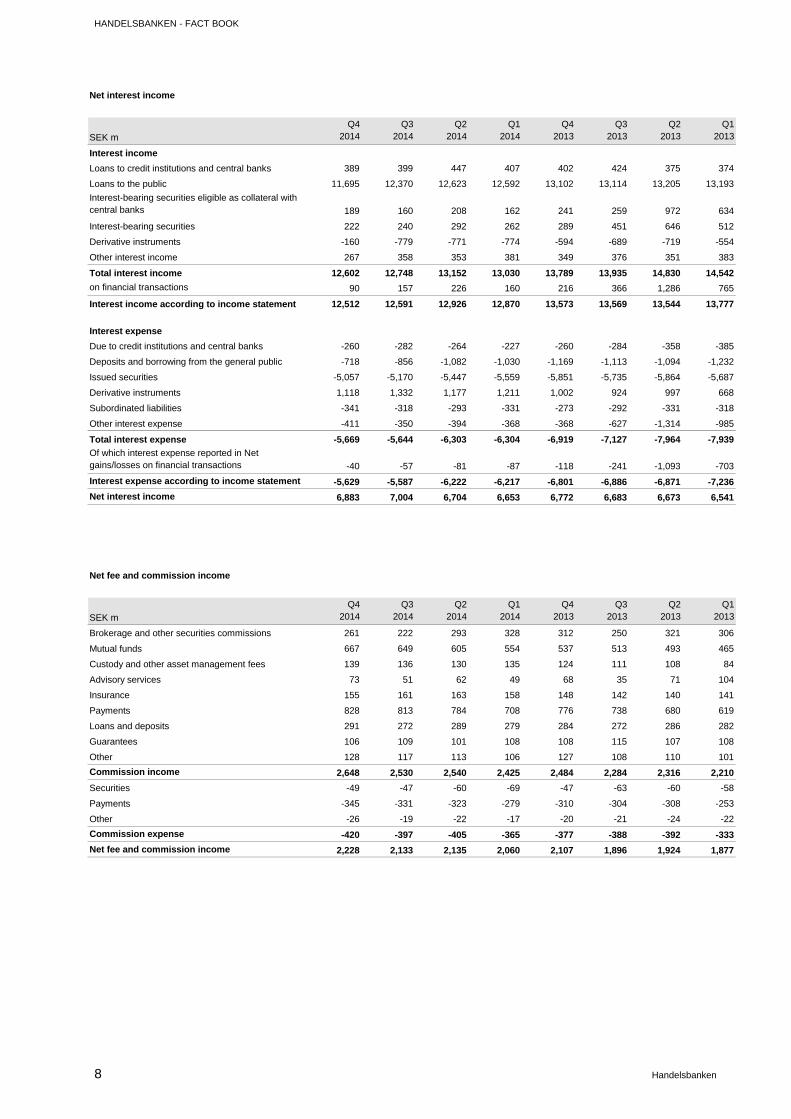
Net interest income
SEK m
Q42014
Q32014
Q2 2014
Q12014
Q42013
Q32013
Q2 2013
Q12013
Interest income
Loans to credit institutions and central banks 389 399 447 407 402 424 375 374
Loans to the public 11,695 12,370 12,623 12,592 13,102 13,114 13,205 13,193
Interest-bearing securities eligible as collateral with central banks 189 160 208 162 241 259 972 634
Interest-bearing securities 222 240 292 262 289 451 646 512
Derivative instruments -160 -779 -771 -774 -594 -689 -719 -554
Other interest income 267 358 353 381 349 376 351 383
Total interest income 12,602 12,748 13,152 13,030 13,789 13,935 14,830 14,542
on financial transactions 90 157 226 160 216 366 1,286 765
Interest income according to income statement 12,512 12,591 12,926 12,870 13,573 13,569 13,544 13,777
Interest expense
Due to credit institutions and central banks -260 -282 -264 -227 -260 -284 -358 -385
Deposits and borrowing from the general public -718 -856 -1,082 -1,030 -1,169 -1,113 -1,094 -1,232
Issued securities -5,057 -5,170 -5,447 -5,559 -5,851 -5,735 -5,864 -5,687
Derivative instruments 1,118 1,332 1,177 1,211 1,002 924 997 668
Subordinated liabilities -341 -318 -293 -331 -273 -292 -331 -318
Other interest expense -411 -350 -394 -368 -368 -627 -1,314 -985
Total interest expense -5,669 -5,644 -6,303 -6,304 -6,919 -7,127 -7,964 -7,939
Of which interest expense reported in Net gains/losses on financial transactions -40 -57 -81 -87 -118 -241 -1,093 -703
Interest expense according to income statement -5,629 -5,587 -6,222 -6,217 -6,801 -6,886 -6,871 -7,236
Net interest income 6,883 7,004 6,704 6,653 6,772 6,683 6,673 6,541
Net fee and commission income
SEK m
Q42014
Q32014
Q2 2014
Q12014
Q42013
Q32013
Q2 2013
Q12013
Brokerage and other securities commissions 261 222 293 328 312 250 321 306
Mutual funds 667 649 605 554 537 513 493 465
Custody and other asset management fees 139 136 130 135 124 111 108 84
Advisory services 73 51 62 49 68 35 71 104
Insurance 155 161 163 158 148 142 140 141
Payments 828 813 784 708 776 738 680 619
Loans and deposits 291 272 289 279 284 272 286 282
Guarantees 106 109 101 108 108 115 107 108
Other 128 117 113 106 127 108 110 101
Commission income 2,648 2,530 2,540 2,425 2,484 2,284 2,316 2,210
Securities -49 -47 -60 -69 -47 -63 -60 -58
Payments -345 -331 -323 -279 -310 -304 -308 -253
Other -26 -19 -22 -17 -20 -21 -24 -22
Commission expense -420 -397 -405 -365 -377 -388 -392 -333
Net fee and commission income 2,228 2,133 2,135 2,060 2,107 1,896 1,924 1,877
HANDELSBANKEN – FACT BOOK
9 Handelsbanken
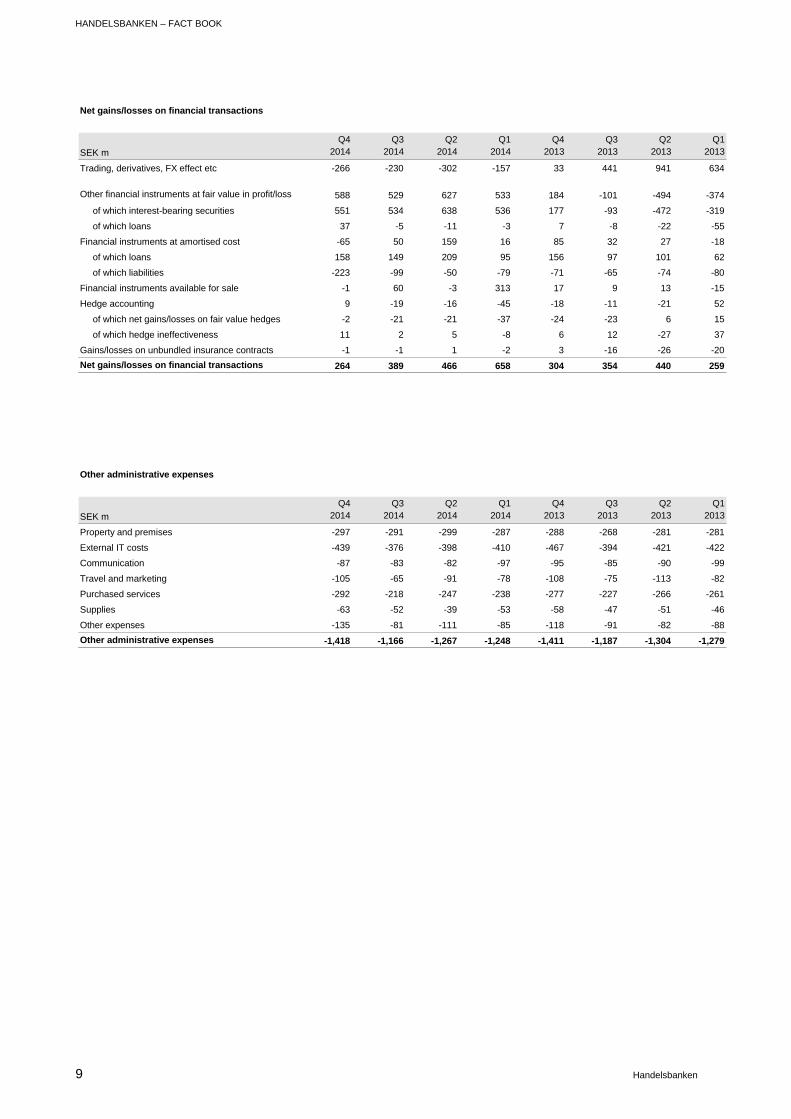
Net gains/losses on financial transactions
SEK m
Q42014
Q32014
Q2 2014
Q12014
Q42013
Q32013
Q2 2013
Q12013
Trading, derivatives, FX effect etc -266 -230 -302 -157 33 441 941 634
Other financial instruments at fair value in profit/loss 588 529 627 533 184 -101 -494 -374
of which interest-bearing securities 551 534 638 536 177 -93 -472 -319
of which loans 37 -5 -11 -3 7 -8 -22 -55
Financial instruments at amortised cost -65 50 159 16 85 32 27 -18
of which loans 158 149 209 95 156 97 101 62
of which liabilities -223 -99 -50 -79 -71 -65 -74 -80
Financial instruments available for sale -1 60 -3 313 17 9 13 -15
Hedge accounting 9 -19 -16 -45 -18 -11 -21 52
of which net gains/losses on fair value hedges -2 -21 -21 -37 -24 -23 6 15
of which hedge ineffectiveness 11 2 5 -8 6 12 -27 37
Gains/losses on unbundled insurance contracts -1 -1 1 -2 3 -16 -26 -20
Net gains/losses on financial transactions 264 389 466 658 304 354 440 259
Other administrative expenses
SEK m
Q42014
Q32014
Q2 2014
Q12014
Q42013
Q32013
Q2 2013
Q12013
Property and premises -297 -291 -299 -287 -288 -268 -281 -281
External IT costs -439 -376 -398 -410 -467 -394 -421 -422
Communication -87 -83 -82 -97 -95 -85 -90 -99
Travel and marketing -105 -65 -91 -78 -108 -75 -113 -82
Purchased services -292 -218 -247 -238 -277 -227 -266 -261
Supplies -63 -52 -39 -53 -58 -47 -51 -46
Other expenses -135 -81 -111 -85 -118 -91 -82 -88
Other administrative expenses -1,418 -1,166 -1,267 -1,248 -1,411 -1,187 -1,304 -1,279
HANDELSBANKEN - FACT BOOK
10 Handelsbanken
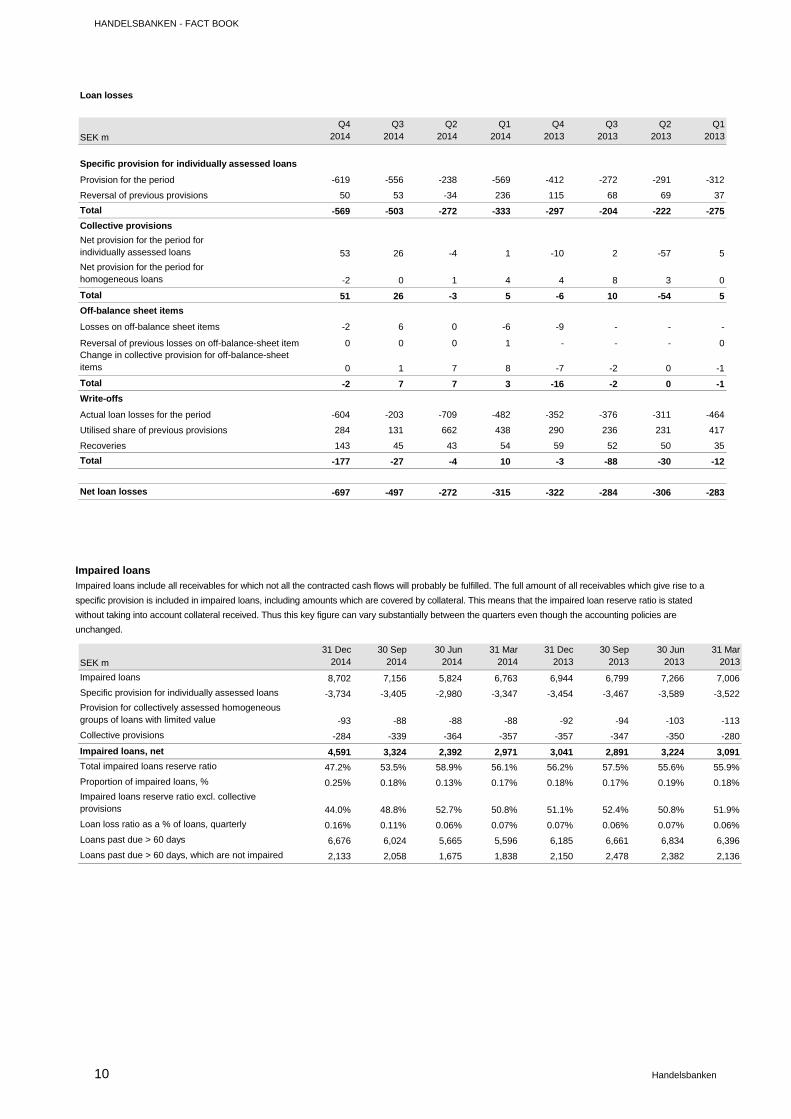
Impaired loans
Impaired loans include all receivables for which not all the contracted cash flows will probably be fulfilled. The full amount of all receivables which give rise to a
specific provision is included in impaired loans, including amounts which are covered by collateral. This means that the impaired loan reserve ratio is stated
without taking into account collateral received. Thus this key figure can vary substantially between the quarters even though the accounting policies are
unchanged.
Loan losses
SEK m
Q42014
Q32014
Q2 2014
Q12014
Q42013
Q32013
Q2 2013
Q12013
Specific provision for individually assessed loans
Provision for the period -619 -556 -238 -569 -412 -272 -291 -312
Reversal of previous provisions 50 53 -34 236 115 68 69 37
Total -569 -503 -272 -333 -297 -204 -222 -275
Collective provisions
Net provision for the period for individually assessed loans 53 26 -4 1 -10 2 -57 5
Net provision for the period for homogeneous loans -2 0 1 4 4 8 3 0
Total 51 26 -3 5 -6 10 -54 5
Off-balance sheet items
Losses on off-balance sheet items -2 6 0 -6 -9 - - -
Reversal of previous losses on off-balance-sheet item 0 0 0 1 - - - 0Change in collective provision for off-balance-sheet items 0 1 7 8 -7 -2 0 -1
Total -2 7 7 3 -16 -2 0 -1
Write-offs
Actual loan losses for the period -604 -203 -709 -482 -352 -376 -311 -464
Utilised share of previous provisions 284 131 662 438 290 236 231 417
Recoveries 143 45 43 54 59 52 50 35
Total -177 -27 -4 10 -3 -88 -30 -12
Net loan losses -697 -497 -272 -315 -322 -284 -306 -283
SEK m
31 Dec 2014
30 Sep 2014
30 Jun 2014
31 Mar 2014
31 Dec 2013
30 Sep 2013
30 Jun 2013
31 Mar 2013
Impaired loans 8,702 7,156 5,824 6,763 6,944 6,799 7,266 7,006
Specific provision for individually assessed loans -3,734 -3,405 -2,980 -3,347 -3,454 -3,467 -3,589 -3,522
Provision for collectively assessed homogeneous groups of loans with limited value -93 -88 -88 -88 -92 -94 -103 -113
Collective provisions -284 -339 -364 -357 -357 -347 -350 -280
Impaired loans, net 4,591 3,324 2,392 2,971 3,041 2,891 3,224 3,091
Total impaired loans reserve ratio 47.2% 53.5% 58.9% 56.1% 56.2% 57.5% 55.6% 55.9%
Proportion of impaired loans, % 0.25% 0.18% 0.13% 0.17% 0.18% 0.17% 0.19% 0.18%
Impaired loans reserve ratio excl. collective provisions 44.0% 48.8% 52.7% 50.8% 51.1% 52.4% 50.8% 51.9%
Loan loss ratio as a % of loans, quarterly 0.16% 0.11% 0.06% 0.07% 0.07% 0.06% 0.07% 0.06%
Loans past due > 60 days 6,676 6,024 5,665 5,596 6,185 6,661 6,834 6,396
Loans past due > 60 days, which are not impaired 2,133 2,058 1,675 1,838 2,150 2,478 2,382 2,136
11 Handelsbanken
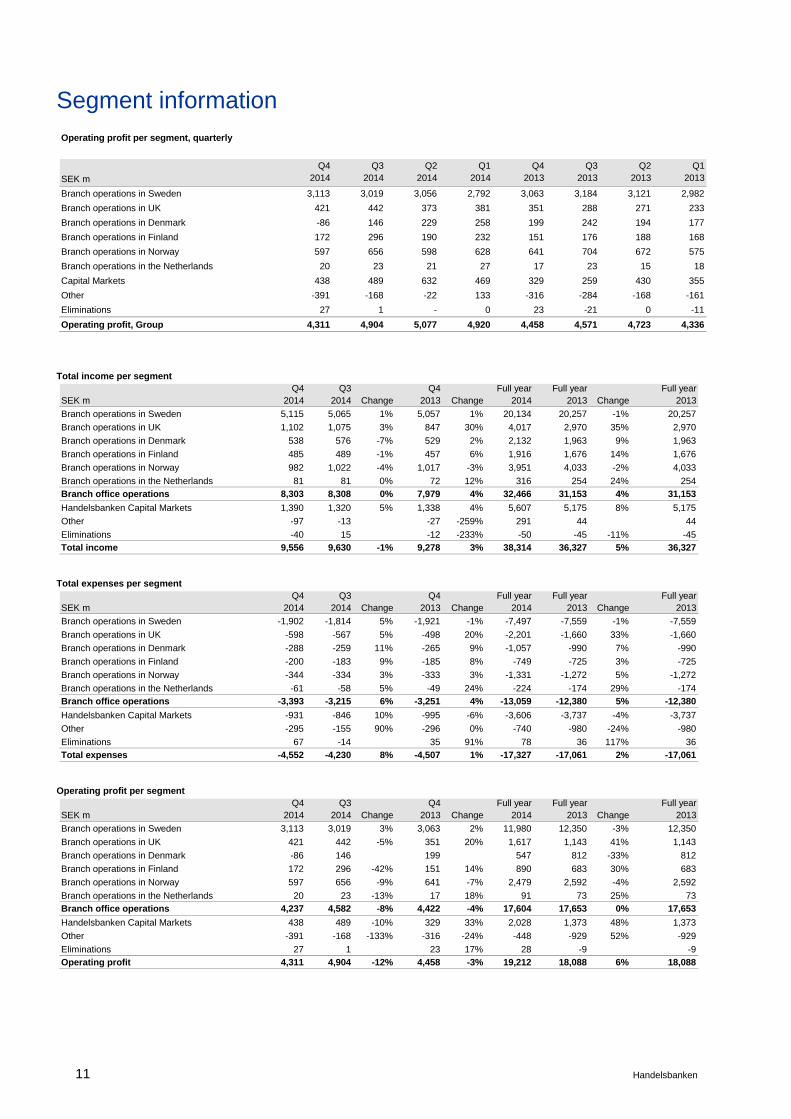
Segment information
Total income per segment
Total expenses per segment
Operating profit per segment
Operating profit per segment, quarterly
SEK m
Q42014
Q32014
Q2 2014
Q12014
Q42013
Q32013
Q2 2013
Q12013
Branch operations in Sweden 3,113 3,019 3,056 2,792 3,063 3,184 3,121 2,982
Branch operations in UK 421 442 373 381 351 288 271 233
Branch operations in Denmark -86 146 229 258 199 242 194 177
Branch operations in Finland 172 296 190 232 151 176 188 168
Branch operations in Norway 597 656 598 628 641 704 672 575
Branch operations in the Netherlands 20 23 21 27 17 23 15 18
Capital Markets 438 489 632 469 329 259 430 355
Other -391 -168 -22 133 -316 -284 -168 -161
Eliminations 27 1 - 0 23 -21 0 -11
Operating profit, Group 4,311 4,904 5,077 4,920 4,458 4,571 4,723 4,336
SEK mQ4
2014Q3
2014 ChangeQ4
2013 ChangeFull year
2014Full year
2013 ChangeFull year
2013
Branch operations in Sweden 5,115 5,065 1% 5,057 1% 20,134 20,257 -1% 20,257
Branch operations in UK 1,102 1,075 3% 847 30% 4,017 2,970 35% 2,970
Branch operations in Denmark 538 576 -7% 529 2% 2,132 1,963 9% 1,963
Branch operations in Finland 485 489 -1% 457 6% 1,916 1,676 14% 1,676
Branch operations in Norway 982 1,022 -4% 1,017 -3% 3,951 4,033 -2% 4,033
Branch operations in the Netherlands 81 81 0% 72 12% 316 254 24% 254
Branch office operations 8,303 8,308 0% 7,979 4% 32,466 31,153 4% 31,153
Handelsbanken Capital Markets 1,390 1,320 5% 1,338 4% 5,607 5,175 8% 5,175
Other -97 -13 -27 -259% 291 44 44
Eliminations -40 15 -12 -233% -50 -45 -11% -45
Total income 9,556 9,630 -1% 9,278 3% 38,314 36,327 5% 36,327
SEK mQ4
2014Q3
2014 ChangeQ4
2013 ChangeFull year
2014Full year
2013 ChangeFull year
2013
Branch operations in Sweden -1,902 -1,814 5% -1,921 -1% -7,497 -7,559 -1% -7,559
Branch operations in UK -598 -567 5% -498 20% -2,201 -1,660 33% -1,660
Branch operations in Denmark -288 -259 11% -265 9% -1,057 -990 7% -990
Branch operations in Finland -200 -183 9% -185 8% -749 -725 3% -725
Branch operations in Norway -344 -334 3% -333 3% -1,331 -1,272 5% -1,272
Branch operations in the Netherlands -61 -58 5% -49 24% -224 -174 29% -174
Branch office operations -3,393 -3,215 6% -3,251 4% -13,059 -12,380 5% -12,380
Handelsbanken Capital Markets -931 -846 10% -995 -6% -3,606 -3,737 -4% -3,737
Other -295 -155 90% -296 0% -740 -980 -24% -980
Eliminations 67 -14 35 91% 78 36 117% 36
Total expenses -4,552 -4,230 8% -4,507 1% -17,327 -17,061 2% -17,061
SEK mQ4
2014Q3
2014 ChangeQ4
2013 ChangeFull year
2014Full year
2013 ChangeFull year
2013
Branch operations in Sweden 3,113 3,019 3% 3,063 2% 11,980 12,350 -3% 12,350
Branch operations in UK 421 442 -5% 351 20% 1,617 1,143 41% 1,143
Branch operations in Denmark -86 146 199 547 812 -33% 812
Branch operations in Finland 172 296 -42% 151 14% 890 683 30% 683
Branch operations in Norway 597 656 -9% 641 -7% 2,479 2,592 -4% 2,592
Branch operations in the Netherlands 20 23 -13% 17 18% 91 73 25% 73
Branch office operations 4,237 4,582 -8% 4,422 -4% 17,604 17,653 0% 17,653
Handelsbanken Capital Markets 438 489 -10% 329 33% 2,028 1,373 48% 1,373
Other -391 -168 -133% -316 -24% -448 -929 52% -929
Eliminations 27 1 23 17% 28 -9 -9
Operating profit 4,311 4,904 -12% 4,458 -3% 19,212 18,088 6% 18,088
HANDELSBANKEN - FACT BOOK
12 Handelsbanken
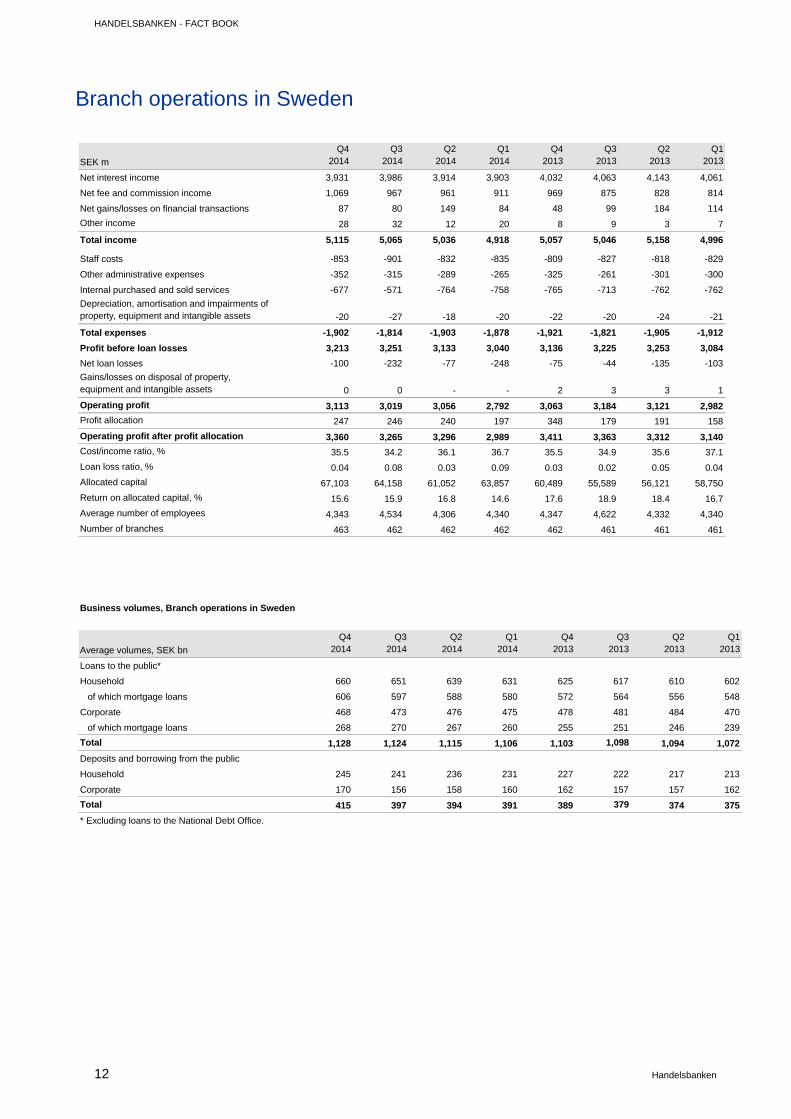
Branch operations in Sweden
SEK m
Q42014
Q32014
Q2 2014
Q12014
Q42013
Q32013
Q2 2013
Q12013
Net interest income 3,931 3,986 3,914 3,903 4,032 4,063 4,143 4,061
Net fee and commission income 1,069 967 961 911 969 875 828 814
Net gains/losses on financial transactions 87 80 149 84 48 99 184 114
Other income 28 32 12 20 8 9 3 7
Total income 5,115 5,065 5,036 4,918 5,057 5,046 5,158 4,996
Staff costs -853 -901 -832 -835 -809 -827 -818 -829
Other administrative expenses -352 -315 -289 -265 -325 -261 -301 -300
Internal purchased and sold services -677 -571 -764 -758 -765 -713 -762 -762
Depreciation, amortisation and impairments of property, equipment and intangible assets -20 -27 -18 -20 -22 -20 -24 -21
Total expenses -1,902 -1,814 -1,903 -1,878 -1,921 -1,821 -1,905 -1,912
Profit before loan losses 3,213 3,251 3,133 3,040 3,136 3,225 3,253 3,084
Net loan losses -100 -232 -77 -248 -75 -44 -135 -103
Gains/losses on disposal of property, equipment and intangible assets 0 0 - - 2 3 3 1
Operating profit 3,113 3,019 3,056 2,792 3,063 3,184 3,121 2,982
Profit allocation 247 246 240 197 348 179 191 158
Operating profit after profit allocation 3,360 3,265 3,296 2,989 3,411 3,363 3,312 3,140
Cost/income ratio, % 35.5 34.2 36.1 36.7 35.5 34.9 35.6 37.1
Loan loss ratio, % 0.04 0.08 0.03 0.09 0.03 0.02 0.05 0.04
Allocated capital 67,103 64,158 61,052 63,857 60,489 55,589 56,121 58,750
Return on allocated capital, % 15.6 15.9 16.8 14.6 17.6 18.9 18.4 16.7
Average number of employees 4,343 4,534 4,306 4,340 4,347 4,622 4,332 4,340
Number of branches 463 462 462 462 462 461 461 461
Business volumes, Branch operations in Sweden
Average volumes, SEK bn
Q42014
Q32014
Q2 2014
Q12014
Q42013
Q32013
Q2 2013
Q12013
Loans to the public*
Household 660 651 639 631 625 617 610 602
of which mortgage loans 606 597 588 580 572 564 556 548
Corporate 468 473 476 475 478 481 484 470
of which mortgage loans 268 270 267 260 255 251 246 239
Total 1,128 1,124 1,115 1,106 1,103 1,098 1,094 1,072
Deposits and borrowing from the public
Household 245 241 236 231 227 222 217 213
Corporate 170 156 158 160 162 157 157 162
Total 415 397 394 391 389 379 374 375
* Excluding loans to the National Debt Office.
HANDELSBANKEN – FACT BOOK
13 Handelsbanken
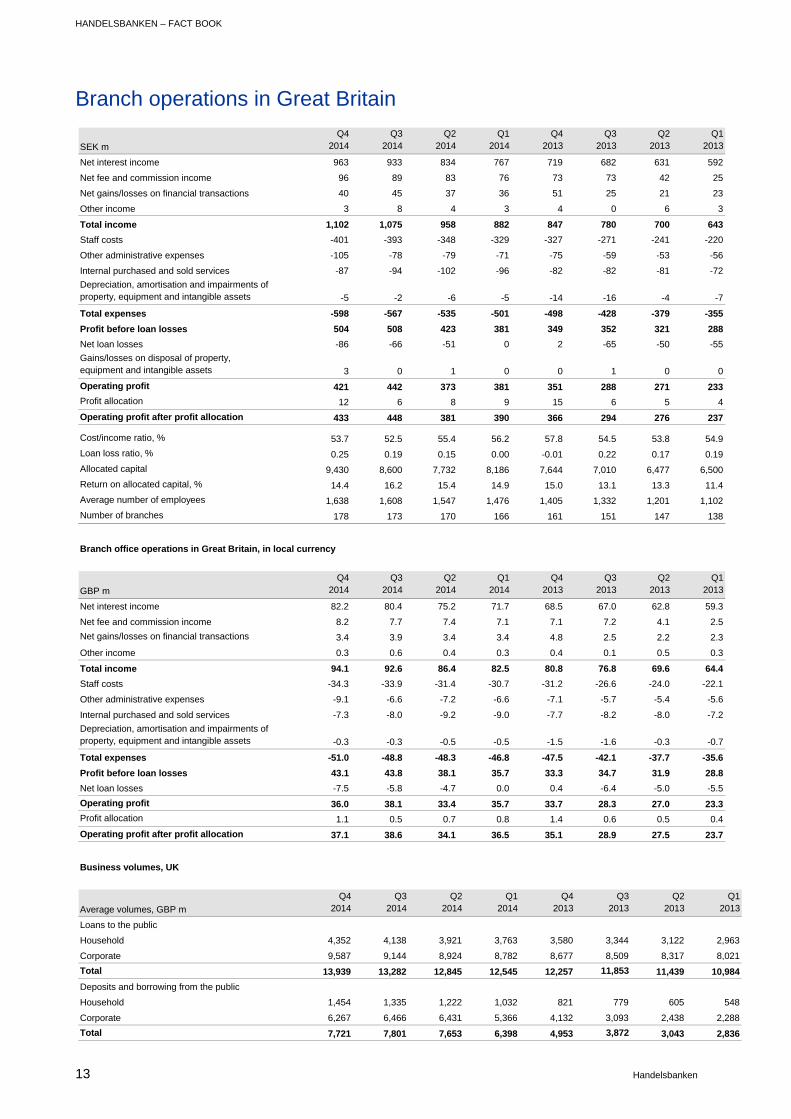
Branch operations in Great Britain
SEK m
Q42014
Q32014
Q2 2014
Q12014
Q42013
Q32013
Q2 2013
Q12013
Net interest income 963 933 834 767 719 682 631 592
Net fee and commission income 96 89 83 76 73 73 42 25
Net gains/losses on financial transactions 40 45 37 36 51 25 21 23
Other income 3 8 4 3 4 0 6 3
Total income 1,102 1,075 958 882 847 780 700 643
Staff costs -401 -393 -348 -329 -327 -271 -241 -220
Other administrative expenses -105 -78 -79 -71 -75 -59 -53 -56
Internal purchased and sold services -87 -94 -102 -96 -82 -82 -81 -72
Depreciation, amortisation and impairments of property, equipment and intangible assets -5 -2 -6 -5 -14 -16 -4 -7
Total expenses -598 -567 -535 -501 -498 -428 -379 -355
Profit before loan losses 504 508 423 381 349 352 321 288
Net loan losses -86 -66 -51 0 2 -65 -50 -55
Gains/losses on disposal of property, equipment and intangible assets 3 0 1 0 0 1 0 0
Operating profit 421 442 373 381 351 288 271 233
Profit allocation 12 6 8 9 15 6 5 4
Operating profit after profit allocation 433 448 381 390 366 294 276 237
Cost/income ratio, % 53.7 52.5 55.4 56.2 57.8 54.5 53.8 54.9
Loan loss ratio, % 0.25 0.19 0.15 0.00 -0.01 0.22 0.17 0.19
Allocated capital 9,430 8,600 7,732 8,186 7,644 7,010 6,477 6,500
Return on allocated capital, % 14.4 16.2 15.4 14.9 15.0 13.1 13.3 11.4
Average number of employees 1,638 1,608 1,547 1,476 1,405 1,332 1,201 1,102
Number of branches 178 173 170 166 161 151 147 138
Branch office operations in Great Britain, in local currency
GBP m
Q42014
Q32014
Q2 2014
Q12014
Q42013
Q32013
Q2 2013
Q12013
Net interest income 82.2 80.4 75.2 71.7 68.5 67.0 62.8 59.3
Net fee and commission income 8.2 7.7 7.4 7.1 7.1 7.2 4.1 2.5
Net gains/losses on financial transactions 3.4 3.9 3.4 3.4 4.8 2.5 2.2 2.3
Other income 0.3 0.6 0.4 0.3 0.4 0.1 0.5 0.3
Total income 94.1 92.6 86.4 82.5 80.8 76.8 69.6 64.4
Staff costs -34.3 -33.9 -31.4 -30.7 -31.2 -26.6 -24.0 -22.1
Other administrative expenses -9.1 -6.6 -7.2 -6.6 -7.1 -5.7 -5.4 -5.6
Internal purchased and sold services -7.3 -8.0 -9.2 -9.0 -7.7 -8.2 -8.0 -7.2
Depreciation, amortisation and impairments of property, equipment and intangible assets -0.3 -0.3 -0.5 -0.5 -1.5 -1.6 -0.3 -0.7
Total expenses -51.0 -48.8 -48.3 -46.8 -47.5 -42.1 -37.7 -35.6
Profit before loan losses 43.1 43.8 38.1 35.7 33.3 34.7 31.9 28.8
Net loan losses -7.5 -5.8 -4.7 0.0 0.4 -6.4 -5.0 -5.5
Operating profit 36.0 38.1 33.4 35.7 33.7 28.3 27.0 23.3
Profit allocation 1.1 0.5 0.7 0.8 1.4 0.6 0.5 0.4
Operating profit after profit allocation 37.1 38.6 34.1 36.5 35.1 28.9 27.5 23.7
Business volumes, UK
Average volumes, GBP m
Q42014
Q32014
Q2 2014
Q12014
Q42013
Q32013
Q2 2013
Q12013
Loans to the public
Household 4,352 4,138 3,921 3,763 3,580 3,344 3,122 2,963
Corporate 9,587 9,144 8,924 8,782 8,677 8,509 8,317 8,021
Total 13,939 13,282 12,845 12,545 12,257 11,853 11,439 10,984
Deposits and borrowing from the public
Household 1,454 1,335 1,222 1,032 821 779 605 548
Corporate 6,267 6,466 6,431 5,366 4,132 3,093 2,438 2,288
Total 7,721 7,801 7,653 6,398 4,953 3,872 3,043 2,836
HANDELSBANKEN - FACT BOOK
14 Handelsbanken
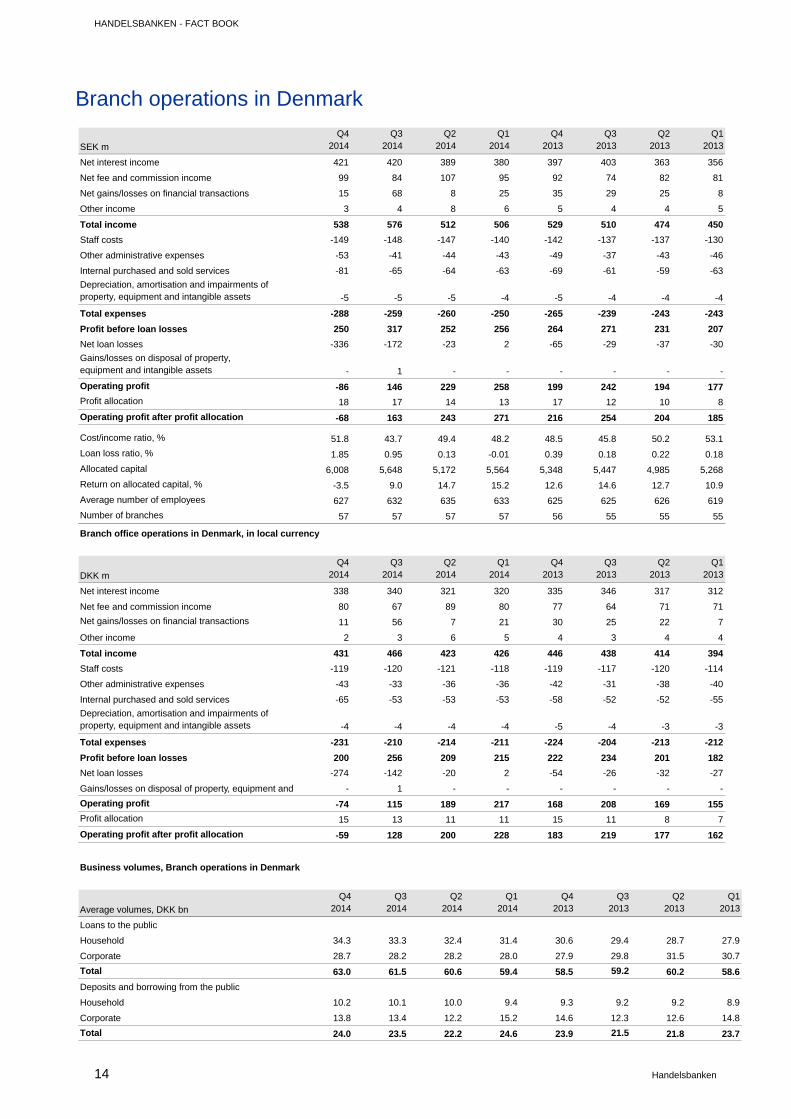
Branch operations in Denmark
SEK m
Q42014
Q32014
Q2 2014
Q12014
Q42013
Q32013
Q2 2013
Q12013
Net interest income 421 420 389 380 397 403 363 356
Net fee and commission income 99 84 107 95 92 74 82 81
Net gains/losses on financial transactions 15 68 8 25 35 29 25 8
Other income 3 4 8 6 5 4 4 5
Total income 538 576 512 506 529 510 474 450
Staff costs -149 -148 -147 -140 -142 -137 -137 -130
Other administrative expenses -53 -41 -44 -43 -49 -37 -43 -46
Internal purchased and sold services -81 -65 -64 -63 -69 -61 -59 -63
Depreciation, amortisation and impairments of property, equipment and intangible assets -5 -5 -5 -4 -5 -4 -4 -4
Total expenses -288 -259 -260 -250 -265 -239 -243 -243
Profit before loan losses 250 317 252 256 264 271 231 207
Net loan losses -336 -172 -23 2 -65 -29 -37 -30
Gains/losses on disposal of property, equipment and intangible assets - 1 - - - - - -
Operating profit -86 146 229 258 199 242 194 177
Profit allocation 18 17 14 13 17 12 10 8
Operating profit after profit allocation -68 163 243 271 216 254 204 185
Cost/income ratio, % 51.8 43.7 49.4 48.2 48.5 45.8 50.2 53.1
Loan loss ratio, % 1.85 0.95 0.13 -0.01 0.39 0.18 0.22 0.18
Allocated capital 6,008 5,648 5,172 5,564 5,348 5,447 4,985 5,268
Return on allocated capital, % -3.5 9.0 14.7 15.2 12.6 14.6 12.7 10.9
Average number of employees 627 632 635 633 625 625 626 619
Number of branches 57 57 57 57 56 55 55 55
Branch office operations in Denmark, in local currency
DKK m
Q42014
Q32014
Q2 2014
Q12014
Q42013
Q32013
Q2 2013
Q12013
Net interest income 338 340 321 320 335 346 317 312
Net fee and commission income 80 67 89 80 77 64 71 71
Net gains/losses on financial transactions 11 56 7 21 30 25 22 7
Other income 2 3 6 5 4 3 4 4
Total income 431 466 423 426 446 438 414 394
Staff costs -119 -120 -121 -118 -119 -117 -120 -114
Other administrative expenses -43 -33 -36 -36 -42 -31 -38 -40
Internal purchased and sold services -65 -53 -53 -53 -58 -52 -52 -55
Depreciation, amortisation and impairments of property, equipment and intangible assets -4 -4 -4 -4 -5 -4 -3 -3
Total expenses -231 -210 -214 -211 -224 -204 -213 -212
Profit before loan losses 200 256 209 215 222 234 201 182
Net loan losses -274 -142 -20 2 -54 -26 -32 -27
Gains/losses on disposal of property, equipment and i - 1 - - - - - -
Operating profit -74 115 189 217 168 208 169 155
Profit allocation 15 13 11 11 15 11 8 7
Operating profit after profit allocation -59 128 200 228 183 219 177 162
Business volumes, Branch operations in Denmark
Average volumes, DKK bn
Q42014
Q32014
Q2 2014
Q12014
Q42013
Q32013
Q2 2013
Q12013
Loans to the public
Household 34.3 33.3 32.4 31.4 30.6 29.4 28.7 27.9
Corporate 28.7 28.2 28.2 28.0 27.9 29.8 31.5 30.7
Total 63.0 61.5 60.6 59.4 58.5 59.2 60.2 58.6
Deposits and borrowing from the public
Household 10.2 10.1 10.0 9.4 9.3 9.2 9.2 8.9
Corporate 13.8 13.4 12.2 15.2 14.6 12.3 12.6 14.8
Total 24.0 23.5 22.2 24.6 23.9 21.5 21.8 23.7
HANDELSBANKEN – FACT BOOK
15 Handelsbanken
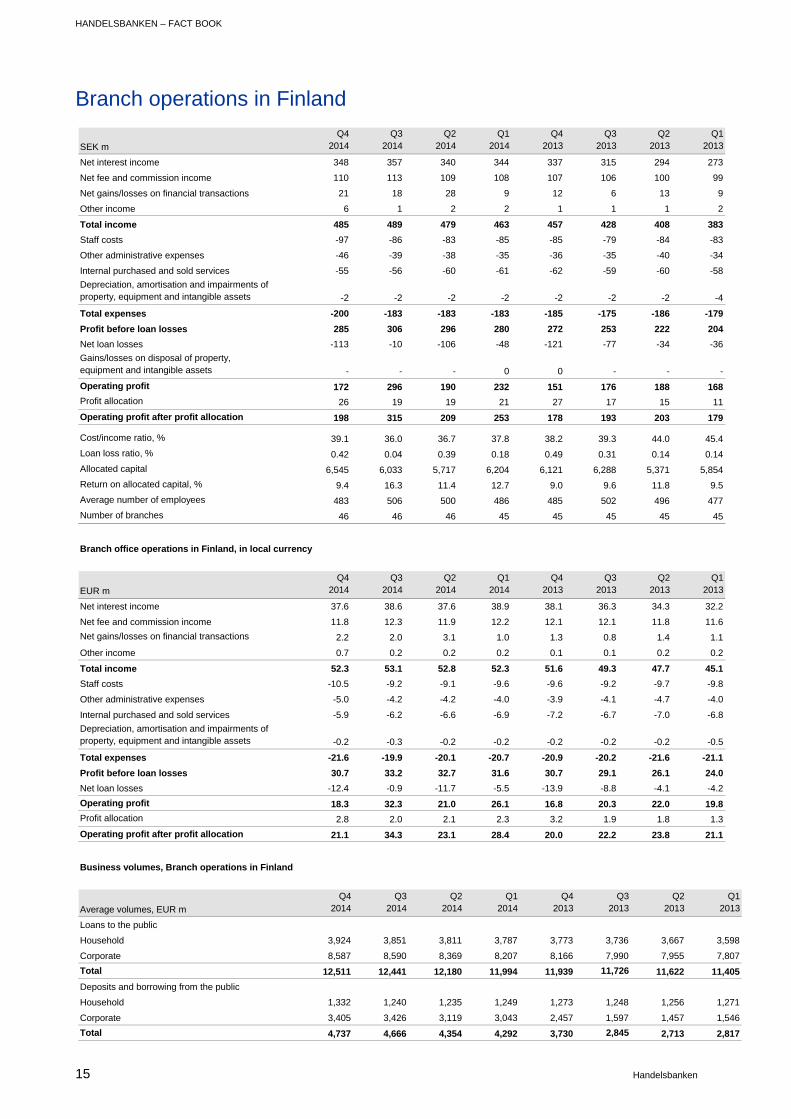
Branch operations in Finland
SEK m
Q42014
Q32014
Q2 2014
Q12014
Q42013
Q32013
Q2 2013
Q12013
Net interest income 348 357 340 344 337 315 294 273
Net fee and commission income 110 113 109 108 107 106 100 99
Net gains/losses on financial transactions 21 18 28 9 12 6 13 9
Other income 6 1 2 2 1 1 1 2
Total income 485 489 479 463 457 428 408 383
Staff costs -97 -86 -83 -85 -85 -79 -84 -83
Other administrative expenses -46 -39 -38 -35 -36 -35 -40 -34
Internal purchased and sold services -55 -56 -60 -61 -62 -59 -60 -58
Depreciation, amortisation and impairments of property, equipment and intangible assets -2 -2 -2 -2 -2 -2 -2 -4
Total expenses -200 -183 -183 -183 -185 -175 -186 -179
Profit before loan losses 285 306 296 280 272 253 222 204
Net loan losses -113 -10 -106 -48 -121 -77 -34 -36
Gains/losses on disposal of property, equipment and intangible assets - - - 0 0 - - -
Operating profit 172 296 190 232 151 176 188 168
Profit allocation 26 19 19 21 27 17 15 11
Operating profit after profit allocation 198 315 209 253 178 193 203 179
Cost/income ratio, % 39.1 36.0 36.7 37.8 38.2 39.3 44.0 45.4
Loan loss ratio, % 0.42 0.04 0.39 0.18 0.49 0.31 0.14 0.14
Allocated capital 6,545 6,033 5,717 6,204 6,121 6,288 5,371 5,854
Return on allocated capital, % 9.4 16.3 11.4 12.7 9.0 9.6 11.8 9.5
Average number of employees 483 506 500 486 485 502 496 477
Number of branches 46 46 46 45 45 45 45 45
Branch office operations in Finland, in local currency
EUR m
Q42014
Q32014
Q2 2014
Q12014
Q42013
Q32013
Q2 2013
Q12013
Net interest income 37.6 38.6 37.6 38.9 38.1 36.3 34.3 32.2
Net fee and commission income 11.8 12.3 11.9 12.2 12.1 12.1 11.8 11.6
Net gains/losses on financial transactions 2.2 2.0 3.1 1.0 1.3 0.8 1.4 1.1
Other income 0.7 0.2 0.2 0.2 0.1 0.1 0.2 0.2
Total income 52.3 53.1 52.8 52.3 51.6 49.3 47.7 45.1
Staff costs -10.5 -9.2 -9.1 -9.6 -9.6 -9.2 -9.7 -9.8
Other administrative expenses -5.0 -4.2 -4.2 -4.0 -3.9 -4.1 -4.7 -4.0
Internal purchased and sold services -5.9 -6.2 -6.6 -6.9 -7.2 -6.7 -7.0 -6.8
Depreciation, amortisation and impairments of property, equipment and intangible assets -0.2 -0.3 -0.2 -0.2 -0.2 -0.2 -0.2 -0.5
Total expenses -21.6 -19.9 -20.1 -20.7 -20.9 -20.2 -21.6 -21.1
Profit before loan losses 30.7 33.2 32.7 31.6 30.7 29.1 26.1 24.0
Net loan losses -12.4 -0.9 -11.7 -5.5 -13.9 -8.8 -4.1 -4.2
Operating profit 18.3 32.3 21.0 26.1 16.8 20.3 22.0 19.8
Profit allocation 2.8 2.0 2.1 2.3 3.2 1.9 1.8 1.3
Operating profit after profit allocation 21.1 34.3 23.1 28.4 20.0 22.2 23.8 21.1
Business volumes, Branch operations in Finland
Average volumes, EUR m
Q42014
Q32014
Q2 2014
Q12014
Q42013
Q32013
Q2 2013
Q12013
Loans to the public
Household 3,924 3,851 3,811 3,787 3,773 3,736 3,667 3,598
Corporate 8,587 8,590 8,369 8,207 8,166 7,990 7,955 7,807
Total 12,511 12,441 12,180 11,994 11,939 11,726 11,622 11,405
Deposits and borrowing from the public
Household 1,332 1,240 1,235 1,249 1,273 1,248 1,256 1,271
Corporate 3,405 3,426 3,119 3,043 2,457 1,597 1,457 1,546
Total 4,737 4,666 4,354 4,292 3,730 2,845 2,713 2,817
HANDELSBANKEN - FACT BOOK
16 Handelsbanken
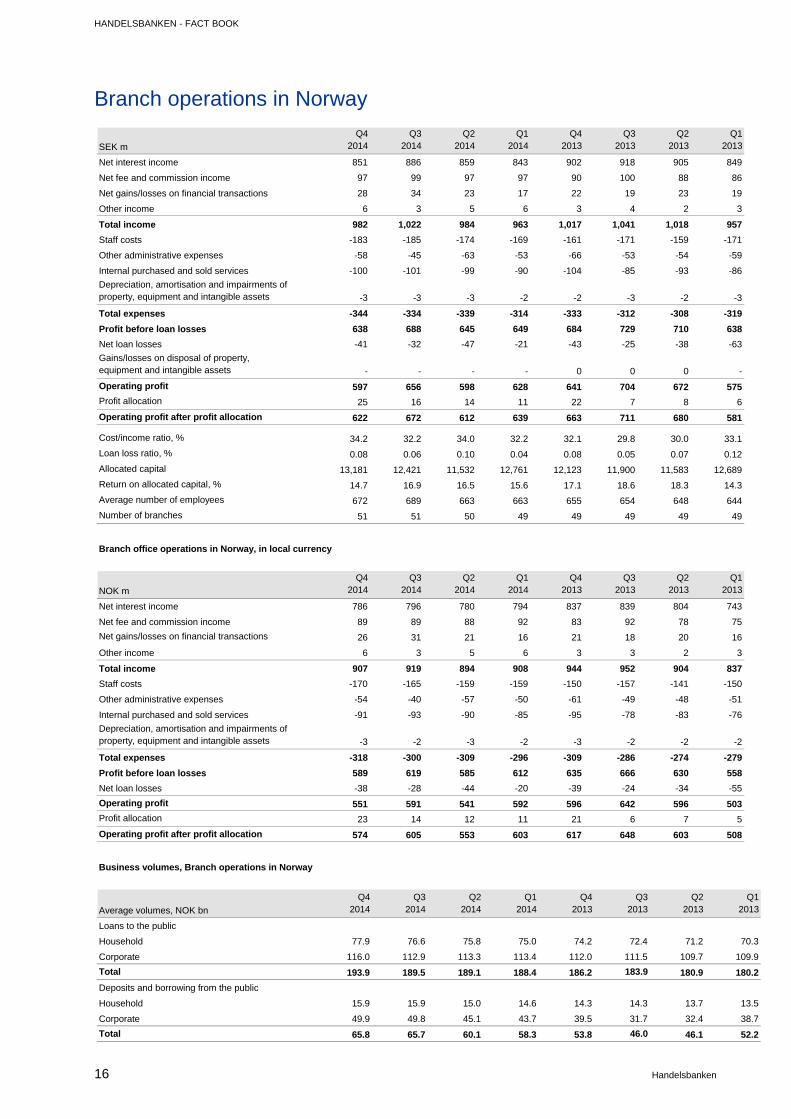
Branch operations in Norway
SEK m
Q42014
Q32014
Q2 2014
Q12014
Q42013
Q32013
Q2 2013
Q12013
Net interest income 851 886 859 843 902 918 905 849
Net fee and commission income 97 99 97 97 90 100 88 86
Net gains/losses on financial transactions 28 34 23 17 22 19 23 19
Other income 6 3 5 6 3 4 2 3
Total income 982 1,022 984 963 1,017 1,041 1,018 957
Staff costs -183 -185 -174 -169 -161 -171 -159 -171
Other administrative expenses -58 -45 -63 -53 -66 -53 -54 -59
Internal purchased and sold services -100 -101 -99 -90 -104 -85 -93 -86
Depreciation, amortisation and impairments of property, equipment and intangible assets -3 -3 -3 -2 -2 -3 -2 -3
Total expenses -344 -334 -339 -314 -333 -312 -308 -319
Profit before loan losses 638 688 645 649 684 729 710 638
Net loan losses -41 -32 -47 -21 -43 -25 -38 -63
Gains/losses on disposal of property, equipment and intangible assets - - - - 0 0 0 -
Operating profit 597 656 598 628 641 704 672 575
Profit allocation 25 16 14 11 22 7 8 6
Operating profit after profit allocation 622 672 612 639 663 711 680 581
Cost/income ratio, % 34.2 32.2 34.0 32.2 32.1 29.8 30.0 33.1
Loan loss ratio, % 0.08 0.06 0.10 0.04 0.08 0.05 0.07 0.12
Allocated capital 13,181 12,421 11,532 12,761 12,123 11,900 11,583 12,689
Return on allocated capital, % 14.7 16.9 16.5 15.6 17.1 18.6 18.3 14.3
Average number of employees 672 689 663 663 655 654 648 644
Number of branches 51 51 50 49 49 49 49 49
Branch office operations in Norway, in local currency
NOK m
Q42014
Q32014
Q2 2014
Q12014
Q42013
Q32013
Q2 2013
Q12013
Net interest income 786 796 780 794 837 839 804 743
Net fee and commission income 89 89 88 92 83 92 78 75
Net gains/losses on financial transactions 26 31 21 16 21 18 20 16
Other income 6 3 5 6 3 3 2 3
Total income 907 919 894 908 944 952 904 837
Staff costs -170 -165 -159 -159 -150 -157 -141 -150
Other administrative expenses -54 -40 -57 -50 -61 -49 -48 -51
Internal purchased and sold services -91 -93 -90 -85 -95 -78 -83 -76
Depreciation, amortisation and impairments of property, equipment and intangible assets -3 -2 -3 -2 -3 -2 -2 -2
Total expenses -318 -300 -309 -296 -309 -286 -274 -279
Profit before loan losses 589 619 585 612 635 666 630 558
Net loan losses -38 -28 -44 -20 -39 -24 -34 -55
Operating profit 551 591 541 592 596 642 596 503
Profit allocation 23 14 12 11 21 6 7 5
Operating profit after profit allocation 574 605 553 603 617 648 603 508
Business volumes, Branch operations in Norway
Average volumes, NOK bn
Q42014
Q32014
Q2 2014
Q12014
Q42013
Q32013
Q2 2013
Q12013
Loans to the public
Household 77.9 76.6 75.8 75.0 74.2 72.4 71.2 70.3
Corporate 116.0 112.9 113.3 113.4 112.0 111.5 109.7 109.9
Total 193.9 189.5 189.1 188.4 186.2 183.9 180.9 180.2
Deposits and borrowing from the public
Household 15.9 15.9 15.0 14.6 14.3 14.3 13.7 13.5
Corporate 49.9 49.8 45.1 43.7 39.5 31.7 32.4 38.7
Total 65.8 65.7 60.1 58.3 53.8 46.0 46.1 52.2
HANDELSBANKEN – FACT BOOK
17 Handelsbanken
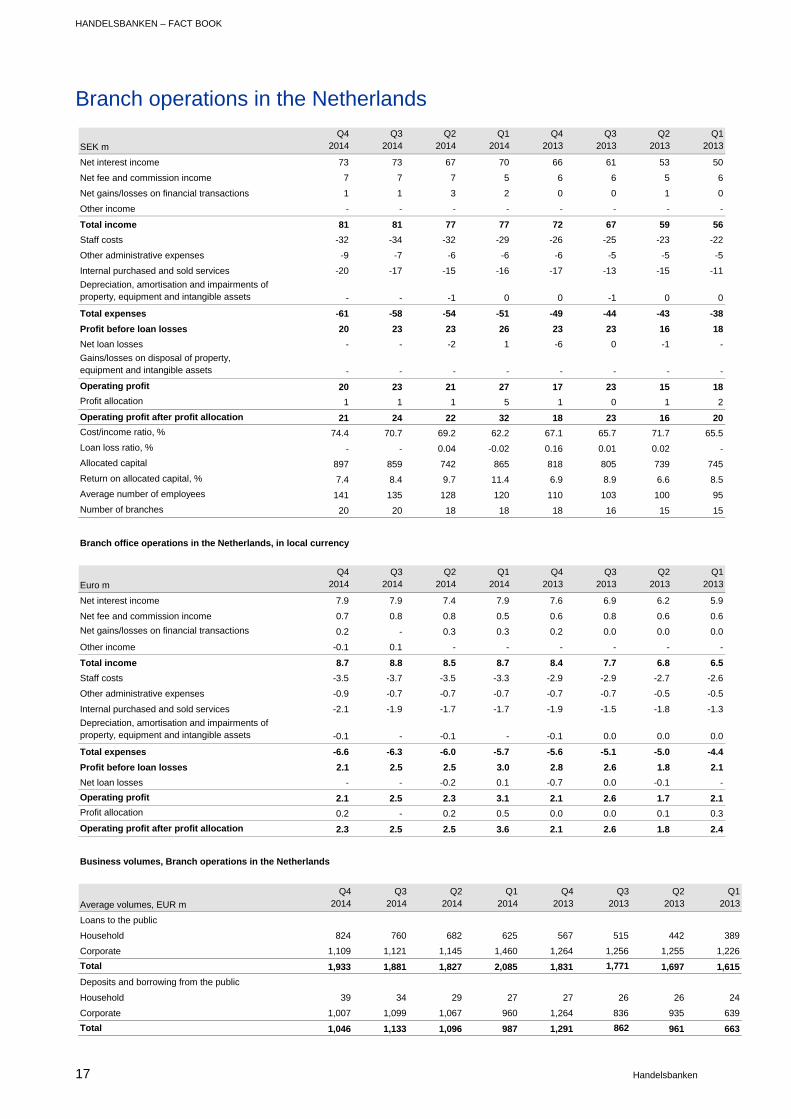
Branch operations in the Netherlands
SEK m
Q42014
Q32014
Q2 2014
Q12014
Q42013
Q32013
Q2 2013
Q12013
Net interest income 73 73 67 70 66 61 53 50
Net fee and commission income 7 7 7 5 6 6 5 6
Net gains/losses on financial transactions 1 1 3 2 0 0 1 0
Other income - - - - - - - -
Total income 81 81 77 77 72 67 59 56
Staff costs -32 -34 -32 -29 -26 -25 -23 -22
Other administrative expenses -9 -7 -6 -6 -6 -5 -5 -5
Internal purchased and sold services -20 -17 -15 -16 -17 -13 -15 -11
Depreciation, amortisation and impairments of property, equipment and intangible assets - - -1 0 0 -1 0 0
Total expenses -61 -58 -54 -51 -49 -44 -43 -38
Profit before loan losses 20 23 23 26 23 23 16 18
Net loan losses - - -2 1 -6 0 -1 -
Gains/losses on disposal of property, equipment and intangible assets - - - - - - - -
Operating profit 20 23 21 27 17 23 15 18
Profit allocation 1 1 1 5 1 0 1 2
Operating profit after profit allocation 21 24 22 32 18 23 16 20
Cost/income ratio, % 74.4 70.7 69.2 62.2 67.1 65.7 71.7 65.5
Loan loss ratio, % - - 0.04 -0.02 0.16 0.01 0.02 -
Allocated capital 897 859 742 865 818 805 739 745
Return on allocated capital, % 7.4 8.4 9.7 11.4 6.9 8.9 6.6 8.5
Average number of employees 141 135 128 120 110 103 100 95
Number of branches 20 20 18 18 18 16 15 15
Branch office operations in the Netherlands, in local currency
Euro m
Q42014
Q32014
Q2 2014
Q12014
Q42013
Q32013
Q2 2013
Q12013
Net interest income 7.9 7.9 7.4 7.9 7.6 6.9 6.2 5.9
Net fee and commission income 0.7 0.8 0.8 0.5 0.6 0.8 0.6 0.6
Net gains/losses on financial transactions 0.2 - 0.3 0.3 0.2 0.0 0.0 0.0
Other income -0.1 0.1 - - - - - -
Total income 8.7 8.8 8.5 8.7 8.4 7.7 6.8 6.5
Staff costs -3.5 -3.7 -3.5 -3.3 -2.9 -2.9 -2.7 -2.6
Other administrative expenses -0.9 -0.7 -0.7 -0.7 -0.7 -0.7 -0.5 -0.5
Internal purchased and sold services -2.1 -1.9 -1.7 -1.7 -1.9 -1.5 -1.8 -1.3
Depreciation, amortisation and impairments of property, equipment and intangible assets -0.1 - -0.1 - -0.1 0.0 0.0 0.0
Total expenses -6.6 -6.3 -6.0 -5.7 -5.6 -5.1 -5.0 -4.4
Profit before loan losses 2.1 2.5 2.5 3.0 2.8 2.6 1.8 2.1
Net loan losses - - -0.2 0.1 -0.7 0.0 -0.1 -
Operating profit 2.1 2.5 2.3 3.1 2.1 2.6 1.7 2.1
Profit allocation 0.2 - 0.2 0.5 0.0 0.0 0.1 0.3
Operating profit after profit allocation 2.3 2.5 2.5 3.6 2.1 2.6 1.8 2.4
Business volumes, Branch operations in the Netherlands
Average volumes, EUR m
Q42014
Q32014
Q2 2014
Q12014
Q42013
Q32013
Q2 2013
Q12013
Loans to the public
Household 824 760 682 625 567 515 442 389
Corporate 1,109 1,121 1,145 1,460 1,264 1,256 1,255 1,226
Total 1,933 1,881 1,827 2,085 1,831 1,771 1,697 1,615
Deposits and borrowing from the public
Household 39 34 29 27 27 26 26 24
Corporate 1,007 1,099 1,067 960 1,264 836 935 639
Total 1,046 1,133 1,096 987 1,291 862 961 663
HANDELSBANKEN - FACT BOOK
18 Handelsbanken
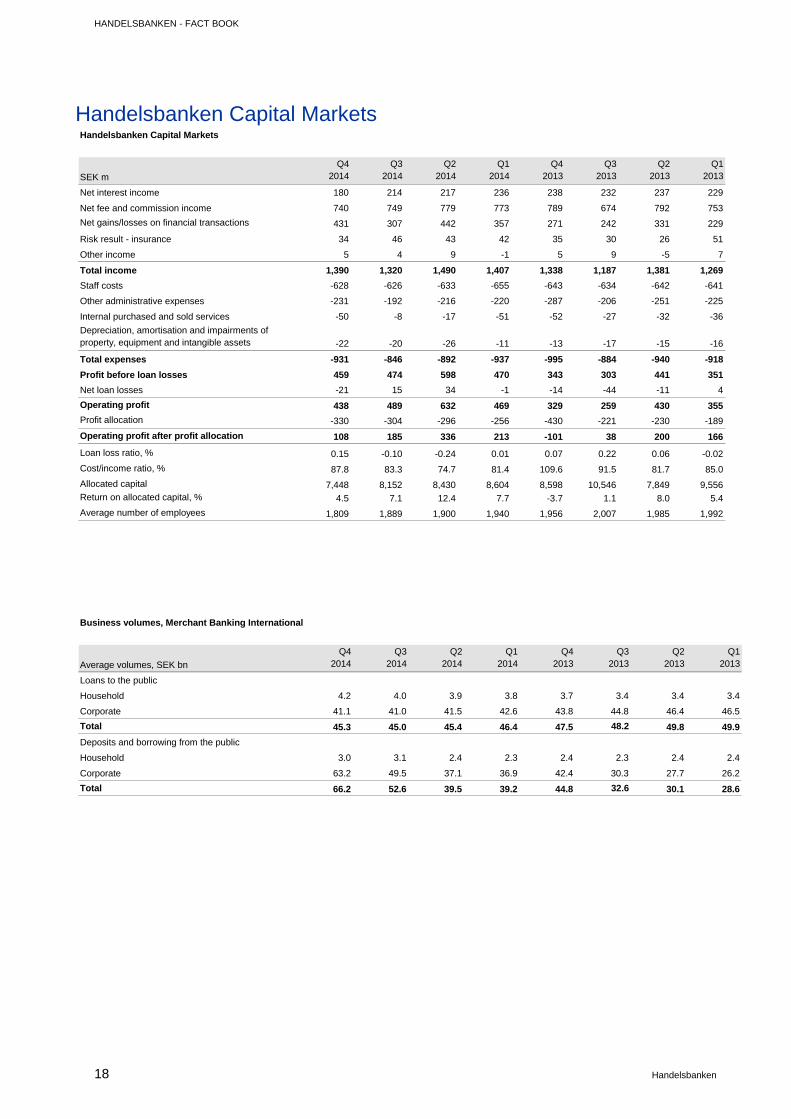
Handelsbanken Capital Markets
Handelsbanken Capital Markets
SEK m
Q42014
Q32014
Q2 2014
Q12014
Q42013
Q32013
Q2 2013
Q12013
Net interest income 180 214 217 236 238 232 237 229
Net fee and commission income 740 749 779 773 789 674 792 753
Net gains/losses on financial transactions 431 307 442 357 271 242 331 229
Risk result - insurance 34 46 43 42 35 30 26 51
Other income 5 4 9 -1 5 9 -5 7
Total income 1,390 1,320 1,490 1,407 1,338 1,187 1,381 1,269
Staff costs -628 -626 -633 -655 -643 -634 -642 -641
Other administrative expenses -231 -192 -216 -220 -287 -206 -251 -225
Internal purchased and sold services -50 -8 -17 -51 -52 -27 -32 -36
Depreciation, amortisation and impairments of property, equipment and intangible assets -22 -20 -26 -11 -13 -17 -15 -16
Total expenses -931 -846 -892 -937 -995 -884 -940 -918
Profit before loan losses 459 474 598 470 343 303 441 351
Net loan losses -21 15 34 -1 -14 -44 -11 4
Operating profit 438 489 632 469 329 259 430 355
Profit allocation -330 -304 -296 -256 -430 -221 -230 -189
Operating profit after profit allocation 108 185 336 213 -101 38 200 166
Loan loss ratio, % 0.15 -0.10 -0.24 0.01 0.07 0.22 0.06 -0.02
Cost/income ratio, % 87.8 83.3 74.7 81.4 109.6 91.5 81.7 85.0
Allocated capital 7,448 8,152 8,430 8,604 8,598 10,546 7,849 9,556Return on allocated capital, % 4.5 7.1 12.4 7.7 -3.7 1.1 8.0 5.4
Average number of employees 1,809 1,889 1,900 1,940 1,956 2,007 1,985 1,992
Business volumes, Merchant Banking International
Average volumes, SEK bn
Q42014
Q32014
Q2 2014
Q12014
Q42013
Q32013
Q2 2013
Q12013
Loans to the public
Household 4.2 4.0 3.9 3.8 3.7 3.4 3.4 3.4
Corporate 41.1 41.0 41.5 42.6 43.8 44.8 46.4 46.5
Total 45.3 45.0 45.4 46.4 47.5 48.2 49.8 49.9
Deposits and borrowing from the public
Household 3.0 3.1 2.4 2.3 2.4 2.3 2.4 2.4
Corporate 63.2 49.5 37.1 36.9 42.4 30.3 27.7 26.2
Total 66.2 52.6 39.5 39.2 44.8 32.6 30.1 28.6
HANDELSBANKEN – FACT BOOK
19 Handelsbanken
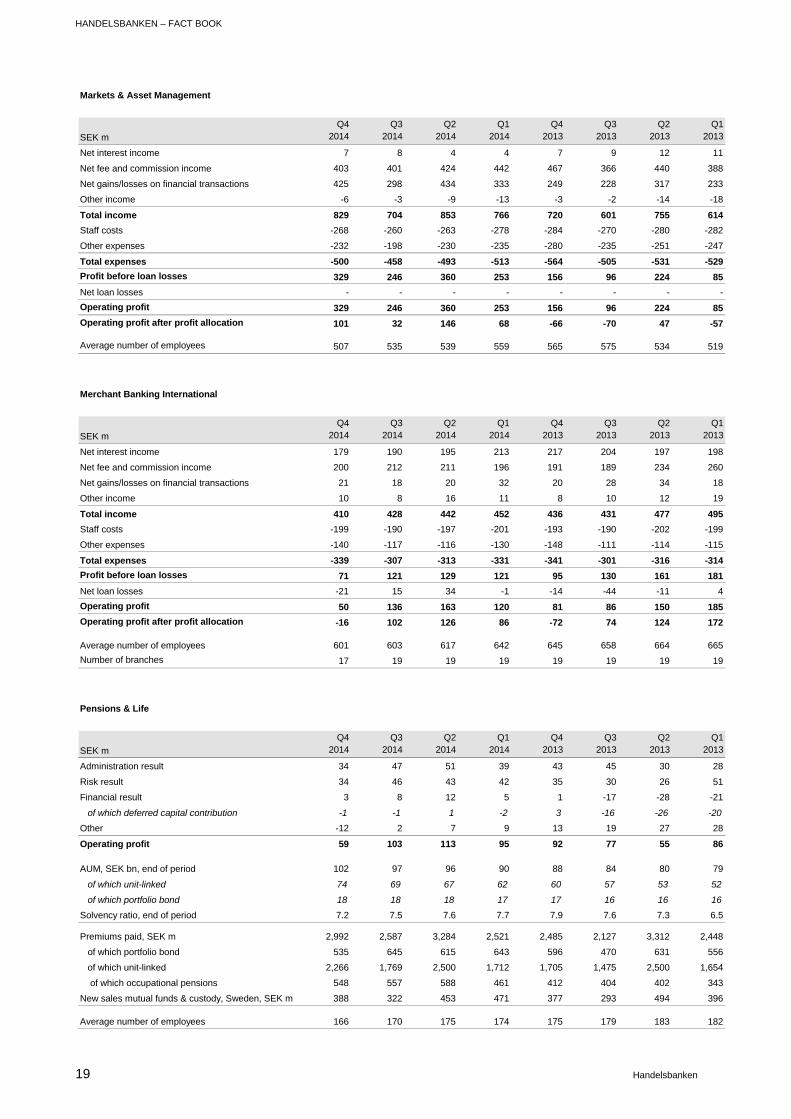
Markets & Asset Management
SEK m
Q42014
Q32014
Q2 2014
Q12014
Q42013
Q32013
Q2 2013
Q12013
Net interest income 7 8 4 4 7 9 12 11
Net fee and commission income 403 401 424 442 467 366 440 388
Net gains/losses on financial transactions 425 298 434 333 249 228 317 233
Other income -6 -3 -9 -13 -3 -2 -14 -18
Total income 829 704 853 766 720 601 755 614
Staff costs -268 -260 -263 -278 -284 -270 -280 -282
Other expenses -232 -198 -230 -235 -280 -235 -251 -247
Total expenses -500 -458 -493 -513 -564 -505 -531 -529
Profit before loan losses 329 246 360 253 156 96 224 85
Net loan losses - - - - - - - -
Operating profit 329 246 360 253 156 96 224 85
Operating profit after profit allocation 101 32 146 68 -66 -70 47 -57
Average number of employees 507 535 539 559 565 575 534 519
Merchant Banking International
SEK m
Q42014
Q32014
Q2 2014
Q12014
Q42013
Q32013
Q2 2013
Q12013
Net interest income 179 190 195 213 217 204 197 198
Net fee and commission income 200 212 211 196 191 189 234 260
Net gains/losses on financial transactions 21 18 20 32 20 28 34 18
Other income 10 8 16 11 8 10 12 19
Total income 410 428 442 452 436 431 477 495
Staff costs -199 -190 -197 -201 -193 -190 -202 -199
Other expenses -140 -117 -116 -130 -148 -111 -114 -115
Total expenses -339 -307 -313 -331 -341 -301 -316 -314
Profit before loan losses 71 121 129 121 95 130 161 181
Net loan losses -21 15 34 -1 -14 -44 -11 4
Operating profit 50 136 163 120 81 86 150 185
Operating profit after profit allocation -16 102 126 86 -72 74 124 172
Average number of employees 601 603 617 642 645 658 664 665
Number of branches 17 19 19 19 19 19 19 19
Pensions & Life
SEK m
Q42014
Q32014
Q2 2014
Q12014
Q42013
Q32013
Q2 2013
Q12013
Administration result 34 47 51 39 43 45 30 28
Risk result 34 46 43 42 35 30 26 51
Financial result 3 8 12 5 1 -17 -28 -21
of which deferred capital contribution -1 -1 1 -2 3 -16 -26 -20
Other -12 2 7 9 13 19 27 28
Operating profit 59 103 113 95 92 77 55 86
AUM, SEK bn, end of period 102 97 96 90 88 84 80 79
of which unit-linked 74 69 67 62 60 57 53 52
of which portfolio bond 18 18 18 17 17 16 16 16
Solvency ratio, end of period 7.2 7.5 7.6 7.7 7.9 7.6 7.3 6.5
Premiums paid, SEK m 2,992 2,587 3,284 2,521 2,485 2,127 3,312 2,448
of which portfolio bond 535 645 615 643 596 470 631 556
of which unit-linked 2,266 1,769 2,500 1,712 1,705 1,475 2,500 1,654
of which occupational pensions 548 557 588 461 412 404 402 343
New sales mutual funds & custody, Sweden, SEK m 388 322 453 471 377 293 494 396
Average number of employees 166 170 175 174 175 179 183 182
HANDELSBANKEN - FACT BOOK
20 Handelsbanken
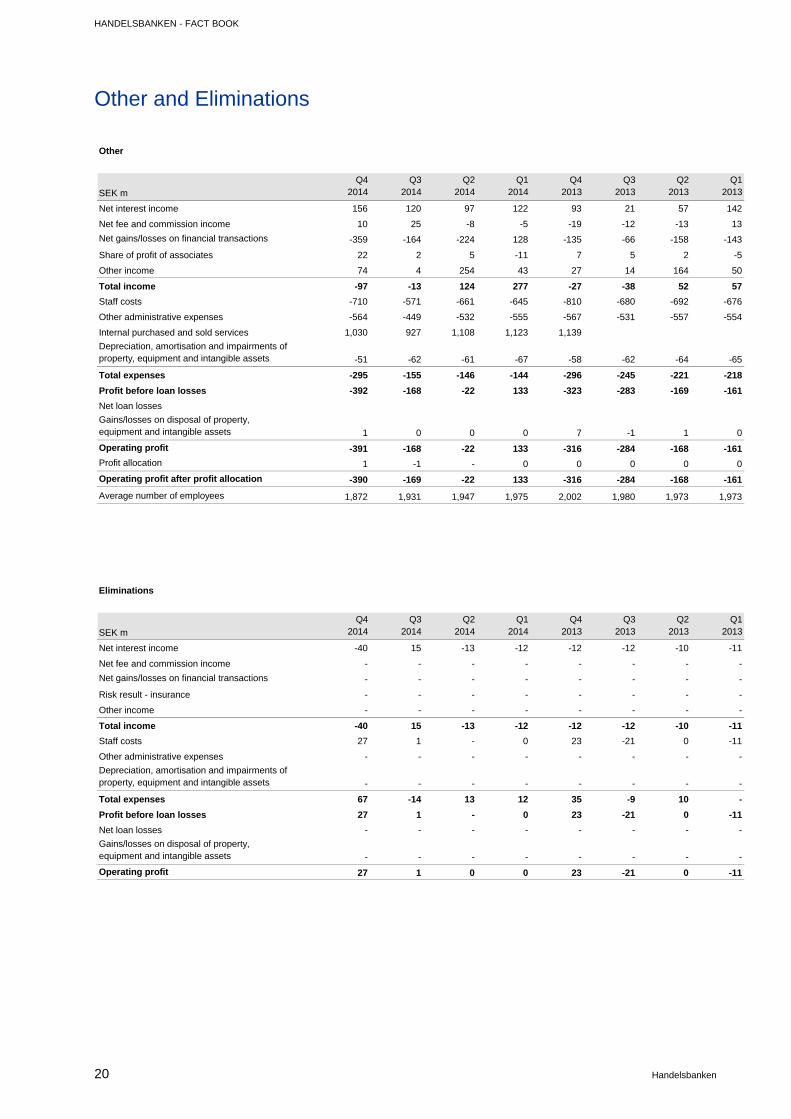
Other and Eliminations
Other
SEK m
Q42014
Q32014
Q2 2014
Q12014
Q42013
Q32013
Q2 2013
Q12013
Net interest income 156 120 97 122 93 21 57 142
Net fee and commission income 10 25 -8 -5 -19 -12 -13 13
Net gains/losses on financial transactions -359 -164 -224 128 -135 -66 -158 -143
Share of profit of associates 22 2 5 -11 7 5 2 -5
Other income 74 4 254 43 27 14 164 50
Total income -97 -13 124 277 -27 -38 52 57
Staff costs -710 -571 -661 -645 -810 -680 -692 -676
Other administrative expenses -564 -449 -532 -555 -567 -531 -557 -554
Internal purchased and sold services 1,030 927 1,108 1,123 1,139
Depreciation, amortisation and impairments of property, equipment and intangible assets -51 -62 -61 -67 -58 -62 -64 -65
Total expenses -295 -155 -146 -144 -296 -245 -221 -218
Profit before loan losses -392 -168 -22 133 -323 -283 -169 -161
Net loan losses
Gains/losses on disposal of property, equipment and intangible assets 1 0 0 0 7 -1 1 0
Operating profit -391 -168 -22 133 -316 -284 -168 -161
Profit allocation 1 -1 - 0 0 0 0 0
Operating profit after profit allocation -390 -169 -22 133 -316 -284 -168 -161
Average number of employees 1,872 1,931 1,947 1,975 2,002 1,980 1,973 1,973
Eliminations
SEK m
Q42014
Q32014
Q2 2014
Q12014
Q42013
Q32013
Q2 2013
Q12013
Net interest income -40 15 -13 -12 -12 -12 -10 -11
Net fee and commission income - - - - - - - -
Net gains/losses on financial transactions - - - - - - - -
Risk result - insurance - - - - - - - -
Other income - - - - - - - -
Total income -40 15 -13 -12 -12 -12 -10 -11
Staff costs 27 1 - 0 23 -21 0 -11
Other administrative expenses - - - - - - - -
Depreciation, amortisation and impairments of property, equipment and intangible assets - - - - - - - -
Total expenses 67 -14 13 12 35 -9 10 -
Profit before loan losses 27 1 - 0 23 -21 0 -11
Net loan losses - - - - - - - -
Gains/losses on disposal of property, equipment and intangible assets - - - - - - - -
Operating profit 27 1 0 0 23 -21 0 -11
HANDELSBANKEN – FACT BOOK
21 Handelsbanken
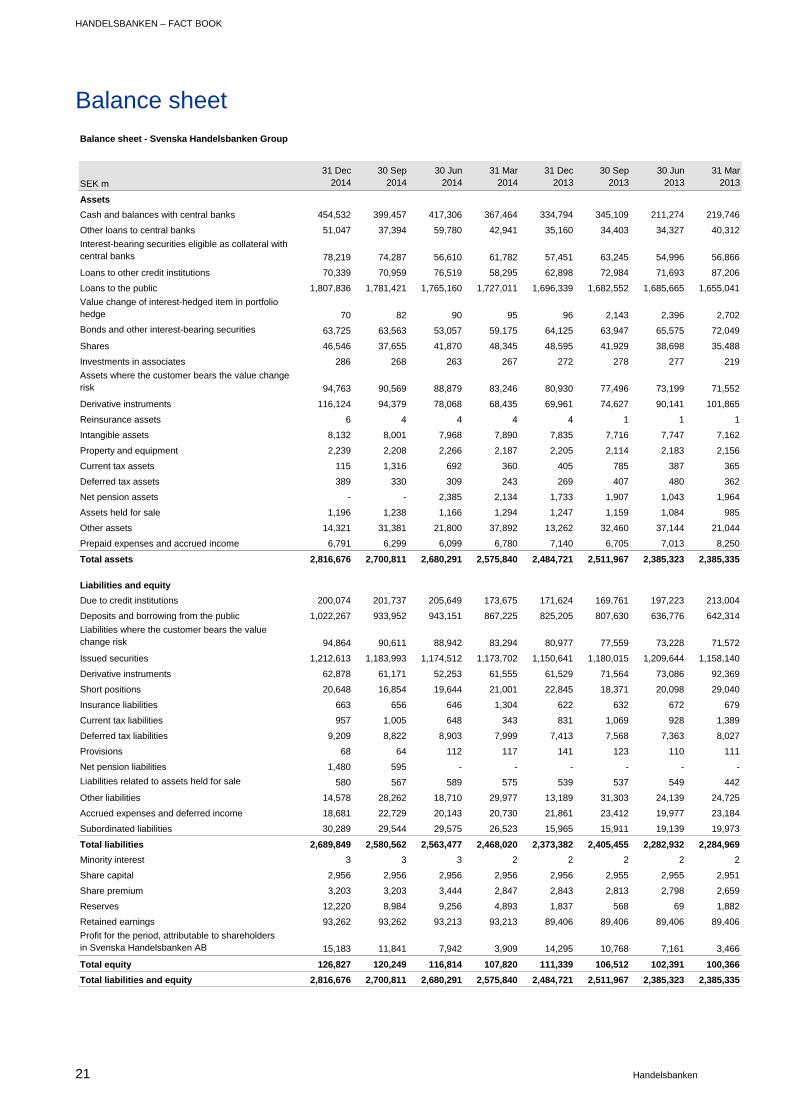
Balance sheet
Balance sheet - Svenska Handelsbanken Group
SEK m
31 Dec 2014
30 Sep 2014
30 Jun 2014
31 Mar 2014
31 Dec 2013
30 Sep 2013
30 Jun 2013
31 Mar 2013
Assets
Cash and balances with central banks 454,532 399,457 417,306 367,464 334,794 345,109 211,274 219,746
Other loans to central banks 51,047 37,394 59,780 42,941 35,160 34,403 34,327 40,312
Interest-bearing securities eligible as collateral with central banks 78,219 74,287 56,610 61,782 57,451 63,245 54,996 56,866
Loans to other credit institutions 70,339 70,959 76,519 58,295 62,898 72,984 71,693 87,206
Loans to the public 1,807,836 1,781,421 1,765,160 1,727,011 1,696,339 1,682,552 1,685,665 1,655,041
Value change of interest-hedged item in portfolio hedge 70 82 90 95 96 2,143 2,396 2,702
Bonds and other interest-bearing securities 63,725 63,563 53,057 59,175 64,125 63,947 65,575 72,049
Shares 46,546 37,655 41,870 48,345 48,595 41,929 38,698 35,488
Investments in associates 286 268 263 267 272 278 277 219
Assets where the customer bears the value change risk 94,763 90,569 88,879 83,246 80,930 77,496 73,199 71,552
Derivative instruments 116,124 94,379 78,068 68,435 69,961 74,627 90,141 101,865
Reinsurance assets 6 4 4 4 4 1 1 1
Intangible assets 8,132 8,001 7,968 7,890 7,835 7,716 7,747 7,162
Property and equipment 2,239 2,208 2,266 2,187 2,205 2,114 2,183 2,156
Current tax assets 115 1,316 692 360 405 785 387 365
Deferred tax assets 389 330 309 243 269 407 480 362
Net pension assets - - 2,385 2,134 1,733 1,907 1,043 1,964
Assets held for sale 1,196 1,238 1,166 1,294 1,247 1,159 1,084 985
Other assets 14,321 31,381 21,800 37,892 13,262 32,460 37,144 21,044
Prepaid expenses and accrued income 6,791 6,299 6,099 6,780 7,140 6,705 7,013 8,250
Total assets 2,816,676 2,700,811 2,680,291 2,575,840 2,484,721 2,511,967 2,385,323 2,385,335
Liabilities and equity
Due to credit institutions 200,074 201,737 205,649 173,675 171,624 169,761 197,223 213,004
Deposits and borrowing from the public 1,022,267 933,952 943,151 867,225 825,205 807,630 636,776 642,314
Liabilities where the customer bears the value change risk 94,864 90,611 88,942 83,294 80,977 77,559 73,228 71,572
Issued securities 1,212,613 1,183,993 1,174,512 1,173,702 1,150,641 1,180,015 1,209,644 1,158,140
Derivative instruments 62,878 61,171 52,253 61,555 61,529 71,564 73,086 92,369
Short positions 20,648 16,854 19,644 21,001 22,845 18,371 20,098 29,040
Insurance liabilities 663 656 646 1,304 622 632 672 679
Current tax liabilities 957 1,005 648 343 831 1,069 928 1,389
Deferred tax liabilities 9,209 8,822 8,903 7,999 7,413 7,568 7,363 8,027
Provisions 68 64 112 117 141 123 110 111
Net pension liabilities 1,480 595 - - - - - -
Liabilities related to assets held for sale 580 567 589 575 539 537 549 442
Other liabilities 14,578 28,262 18,710 29,977 13,189 31,303 24,139 24,725
Accrued expenses and deferred income 18,681 22,729 20,143 20,730 21,861 23,412 19,977 23,184
Subordinated liabilities 30,289 29,544 29,575 26,523 15,965 15,911 19,139 19,973
Total liabilities 2,689,849 2,580,562 2,563,477 2,468,020 2,373,382 2,405,455 2,282,932 2,284,969
Minority interest 3 3 3 2 2 2 2 2
Share capital 2,956 2,956 2,956 2,956 2,956 2,955 2,955 2,951
Share premium 3,203 3,203 3,444 2,847 2,843 2,813 2,798 2,659
Reserves 12,220 8,984 9,256 4,893 1,837 568 69 1,882
Retained earnings 93,262 93,262 93,213 93,213 89,406 89,406 89,406 89,406
Profit for the period, attributable to shareholders in Svenska Handelsbanken AB 15,183 11,841 7,942 3,909 14,295 10,768 7,161 3,466
Total equity 126,827 120,249 116,814 107,820 111,339 106,512 102,391 100,366
Total liabilities and equity 2,816,676 2,700,811 2,680,291 2,575,840 2,484,721 2,511,967 2,385,323 2,385,335
HANDELSBANKEN - FACT BOOK
22 Handelsbanken
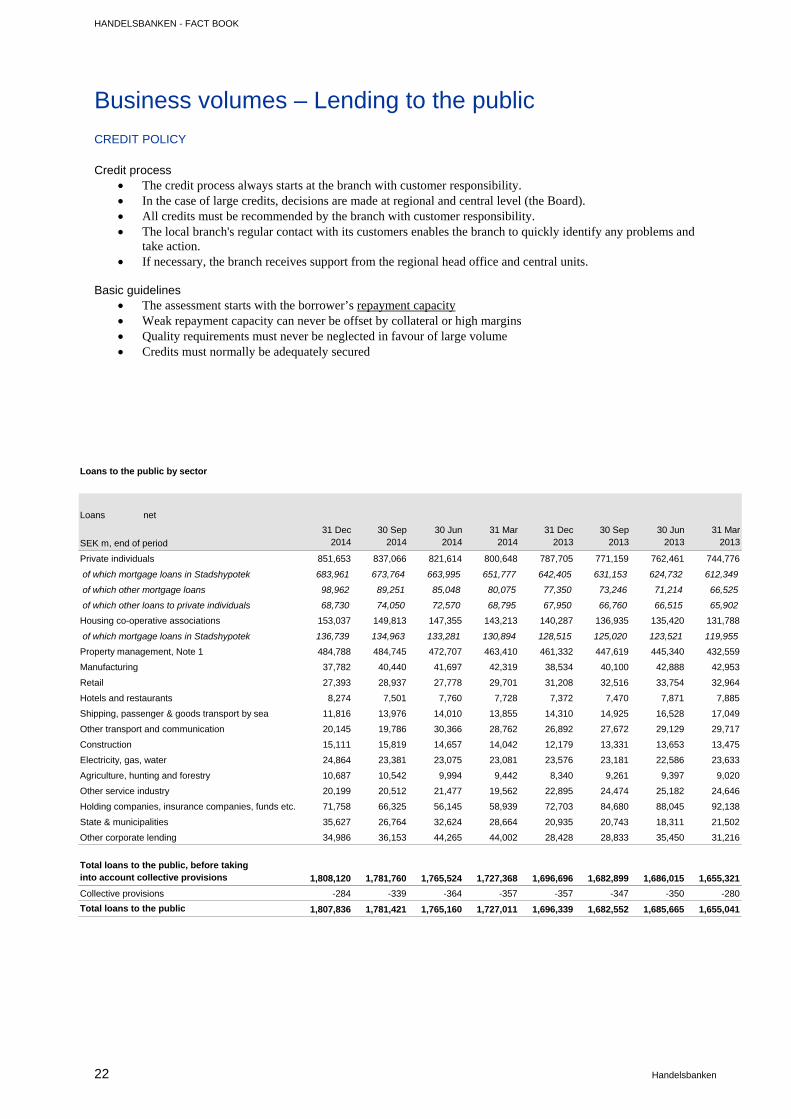
Business volumes – Lending to the public
CREDIT POLICY
Credit process
The credit process always starts at the branch with customer responsibility. In the case of large credits, decisions are made at regional and central level (the Board). All credits must be recommended by the branch with customer responsibility. The local branch's regular contact with its customers enables the branch to quickly identify any problems and
take action. If necessary, the branch receives support from the regional head office and central units.
Basic guidelines The assessment starts with the borrower’s repayment capacity Weak repayment capacity can never be offset by collateral or high margins Quality requirements must never be neglected in favour of large volume Credits must normally be adequately secured
Loans to the public by sector
Loans net
SEK m, end of period
31 Dec 2014
30 Sep 2014
30 Jun 2014
31 Mar 2014
31 Dec 2013
30 Sep 2013
30 Jun 2013
31 Mar 2013
Private individuals 851,653 837,066 821,614 800,648 787,705 771,159 762,461 744,776
of which mortgage loans in Stadshypotek 683,961 673,764 663,995 651,777 642,405 631,153 624,732 612,349
of which other mortgage loans 98,962 89,251 85,048 80,075 77,350 73,246 71,214 66,525
of which other loans to private individuals 68,730 74,050 72,570 68,795 67,950 66,760 66,515 65,902
Housing co-operative associations 153,037 149,813 147,355 143,213 140,287 136,935 135,420 131,788
of which mortgage loans in Stadshypotek 136,739 134,963 133,281 130,894 128,515 125,020 123,521 119,955
Property management, Note 1 484,788 484,745 472,707 463,410 461,332 447,619 445,340 432,559
Manufacturing 37,782 40,440 41,697 42,319 38,534 40,100 42,888 42,953
Retail 27,393 28,937 27,778 29,701 31,208 32,516 33,754 32,964
Hotels and restaurants 8,274 7,501 7,760 7,728 7,372 7,470 7,871 7,885
Shipping, passenger & goods transport by sea 11,816 13,976 14,010 13,855 14,310 14,925 16,528 17,049
Other transport and communication 20,145 19,786 30,366 28,762 26,892 27,672 29,129 29,717
Construction 15,111 15,819 14,657 14,042 12,179 13,331 13,653 13,475
Electricity, gas, water 24,864 23,381 23,075 23,081 23,576 23,181 22,586 23,633
Agriculture, hunting and forestry 10,687 10,542 9,994 9,442 8,340 9,261 9,397 9,020
Other service industry 20,199 20,512 21,477 19,562 22,895 24,474 25,182 24,646
Holding companies, insurance companies, funds etc. 71,758 66,325 56,145 58,939 72,703 84,680 88,045 92,138
State & municipalities 35,627 26,764 32,624 28,664 20,935 20,743 18,311 21,502
Other corporate lending 34,986 36,153 44,265 44,002 28,428 28,833 35,450 31,216
Total loans to the public, before taking into account collective provisions 1,808,120 1,781,760 1,765,524 1,727,368 1,696,696 1,682,899 1,686,015 1,655,321
Collective provisions -284 -339 -364 -357 -357 -347 -350 -280
Total loans to the public 1,807,836 1,781,421 1,765,160 1,727,011 1,696,339 1,682,552 1,685,665 1,655,041
HANDELSBANKEN – FACT BOOK
23 Handelsbanken
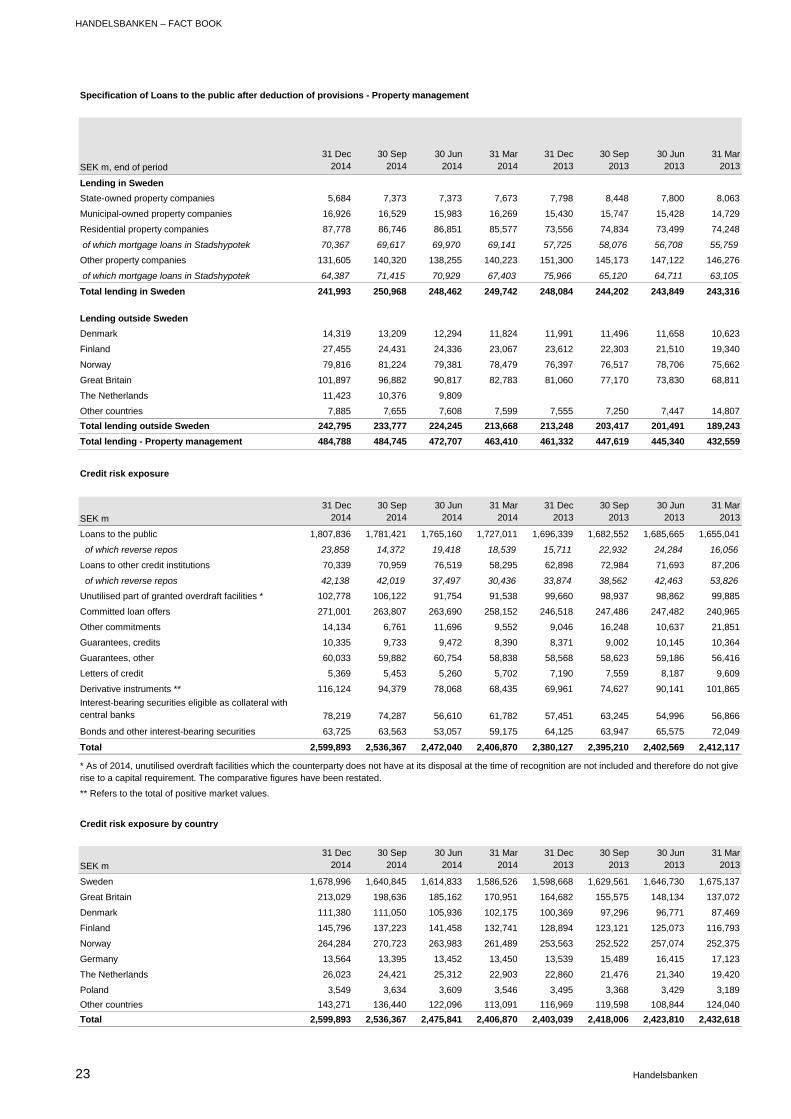
Specification of Loans to the public after deduction of provisions - Property management
SEK m, end of period
31 Dec 2014
30 Sep 2014
30 Jun 2014
31 Mar 2014
31 Dec 2013
30 Sep 2013
30 Jun 2013
31 Mar 2013
Lending in Sweden
State-owned property companies 5,684 7,373 7,373 7,673 7,798 8,448 7,800 8,063
Municipal-owned property companies 16,926 16,529 15,983 16,269 15,430 15,747 15,428 14,729
Residential property companies 87,778 86,746 86,851 85,577 73,556 74,834 73,499 74,248
of which mortgage loans in Stadshypotek 70,367 69,617 69,970 69,141 57,725 58,076 56,708 55,759
Other property companies 131,605 140,320 138,255 140,223 151,300 145,173 147,122 146,276
of which mortgage loans in Stadshypotek 64,387 71,415 70,929 67,403 75,966 65,120 64,711 63,105
Total lending in Sweden 241,993 250,968 248,462 249,742 248,084 244,202 243,849 243,316
Lending outside Sweden
Denmark 14,319 13,209 12,294 11,824 11,991 11,496 11,658 10,623
Finland 27,455 24,431 24,336 23,067 23,612 22,303 21,510 19,340
Norway 79,816 81,224 79,381 78,479 76,397 76,517 78,706 75,662
Great Britain 101,897 96,882 90,817 82,783 81,060 77,170 73,830 68,811
The Netherlands 11,423 10,376 9,809
Other countries 7,885 7,655 7,608 7,599 7,555 7,250 7,447 14,807
Total lending outside Sweden 242,795 233,777 224,245 213,668 213,248 203,417 201,491 189,243
Total lending - Property management 484,788 484,745 472,707 463,410 461,332 447,619 445,340 432,559
Credit risk exposure
SEK m
31 Dec 2014
30 Sep 2014
30 Jun 2014
31 Mar 2014
31 Dec 2013
30 Sep 2013
30 Jun 2013
31 Mar 2013
Loans to the public 1,807,836 1,781,421 1,765,160 1,727,011 1,696,339 1,682,552 1,685,665 1,655,041
of which reverse repos 23,858 14,372 19,418 18,539 15,711 22,932 24,284 16,056
Loans to other credit institutions 70,339 70,959 76,519 58,295 62,898 72,984 71,693 87,206
of which reverse repos 42,138 42,019 37,497 30,436 33,874 38,562 42,463 53,826
Unutilised part of granted overdraft facilities * 102,778 106,122 91,754 91,538 99,660 98,937 98,862 99,885
Committed loan offers 271,001 263,807 263,690 258,152 246,518 247,486 247,482 240,965
Other commitments 14,134 6,761 11,696 9,552 9,046 16,248 10,637 21,851
Guarantees, credits 10,335 9,733 9,472 8,390 8,371 9,002 10,145 10,364
Guarantees, other 60,033 59,882 60,754 58,838 58,568 58,623 59,186 56,416
Letters of credit 5,369 5,453 5,260 5,702 7,190 7,559 8,187 9,609
Derivative instruments ** 116,124 94,379 78,068 68,435 69,961 74,627 90,141 101,865
Interest-bearing securities eligible as collateral with central banks 78,219 74,287 56,610 61,782 57,451 63,245 54,996 56,866
Bonds and other interest-bearing securities 63,725 63,563 53,057 59,175 64,125 63,947 65,575 72,049
Total 2,599,893 2,536,367 2,472,040 2,406,870 2,380,127 2,395,210 2,402,569 2,412,117
** Refers to the total of positive market values.
* As of 2014, unutilised overdraft facilities which the counterparty does not have at its disposal at the time of recognition are not included and therefore do not give rise to a capital requirement. The comparative figures have been restated.
Credit risk exposure by country
SEK m
31 Dec 2014
30 Sep 2014
30 Jun 2014
31 Mar 2014
31 Dec 2013
30 Sep 2013
30 Jun 2013
31 Mar 2013
Sweden 1,678,996 1,640,845 1,614,833 1,586,526 1,598,668 1,629,561 1,646,730 1,675,137
Great Britain 213,029 198,636 185,162 170,951 164,682 155,575 148,134 137,072
Denmark 111,380 111,050 105,936 102,175 100,369 97,296 96,771 87,469
Finland 145,796 137,223 141,458 132,741 128,894 123,121 125,073 116,793
Norway 264,284 270,723 263,983 261,489 253,563 252,522 257,074 252,375
Germany 13,564 13,395 13,452 13,450 13,539 15,489 16,415 17,123
The Netherlands 26,023 24,421 25,312 22,903 22,860 21,476 21,340 19,420
Poland 3,549 3,634 3,609 3,546 3,495 3,368 3,429 3,189
Other countries 143,271 136,440 122,096 113,091 116,969 119,598 108,844 124,040
Total 2,599,893 2,536,367 2,475,841 2,406,870 2,403,039 2,418,006 2,423,810 2,432,618
HANDELSBANKEN - FACT BOOK
24 Handelsbanken
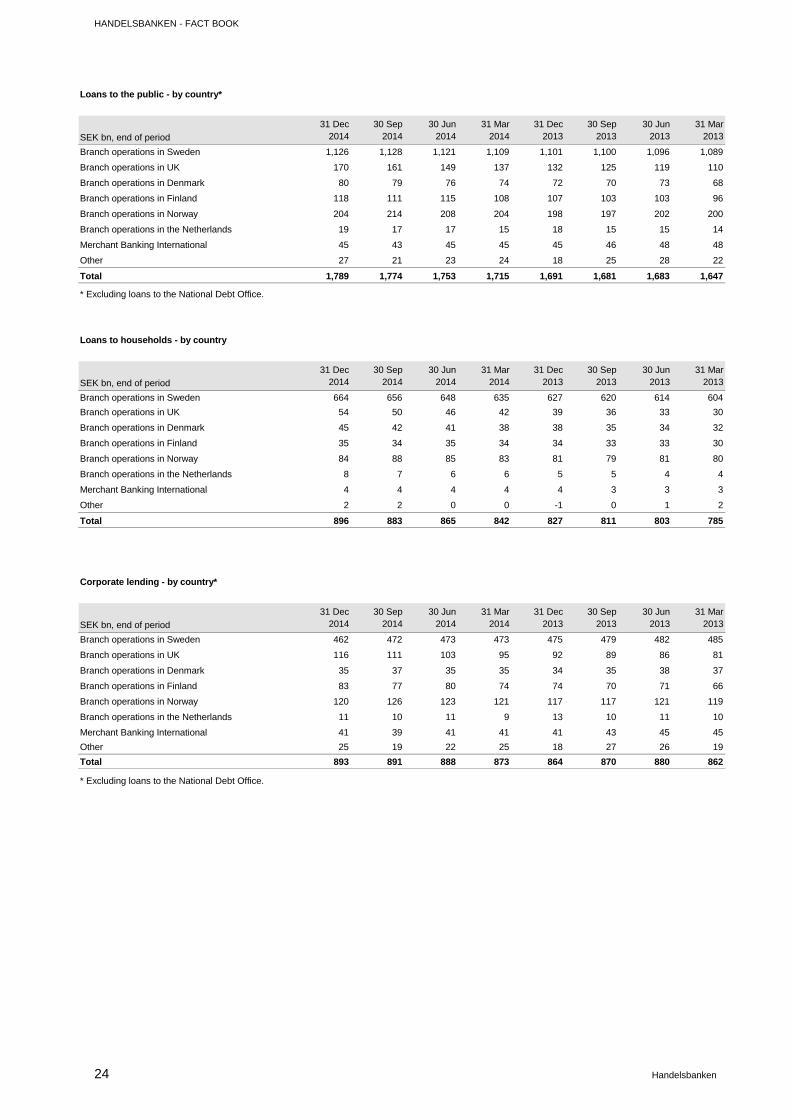
Loans to the public - by country*
SEK bn, end of period
31 Dec 2014
30 Sep 2014
30 Jun 2014
31 Mar 2014
31 Dec 2013
30 Sep 2013
30 Jun 2013
31 Mar 2013
Branch operations in Sweden 1,126 1,128 1,121 1,109 1,101 1,100 1,096 1,089
Branch operations in UK 170 161 149 137 132 125 119 110
Branch operations in Denmark 80 79 76 74 72 70 73 68
Branch operations in Finland 118 111 115 108 107 103 103 96
Branch operations in Norway 204 214 208 204 198 197 202 200
Branch operations in the Netherlands 19 17 17 15 18 15 15 14
Merchant Banking International 45 43 45 45 45 46 48 48
Other 27 21 23 24 18 25 28 22
Total 1,789 1,774 1,753 1,715 1,691 1,681 1,683 1,647
* Excluding loans to the National Debt Office.
Loans to households - by country
SEK bn, end of period
31 Dec 2014
30 Sep 2014
30 Jun 2014
31 Mar 2014
31 Dec 2013
30 Sep 2013
30 Jun 2013
31 Mar 2013
Branch operations in Sweden 664 656 648 635 627 620 614 604
Branch operations in UK 54 50 46 42 39 36 33 30
Branch operations in Denmark 45 42 41 38 38 35 34 32
Branch operations in Finland 35 34 35 34 34 33 33 30
Branch operations in Norway 84 88 85 83 81 79 81 80
Branch operations in the Netherlands 8 7 6 6 5 5 4 4
Merchant Banking International 4 4 4 4 4 3 3 3
Other 2 2 0 0 -1 0 1 2
Total 896 883 865 842 827 811 803 785
Corporate lending - by country*
SEK bn, end of period
31 Dec 2014
30 Sep 2014
30 Jun 2014
31 Mar 2014
31 Dec 2013
30 Sep 2013
30 Jun 2013
31 Mar 2013
Branch operations in Sweden 462 472 473 473 475 479 482 485
Branch operations in UK 116 111 103 95 92 89 86 81
Branch operations in Denmark 35 37 35 35 34 35 38 37
Branch operations in Finland 83 77 80 74 74 70 71 66
Branch operations in Norway 120 126 123 121 117 117 121 119
Branch operations in the Netherlands 11 10 11 9 13 10 11 10
Merchant Banking International 41 39 41 41 41 43 45 45
Other 25 19 22 25 18 27 26 19
Total 893 891 888 873 864 870 880 862
* Excluding loans to the National Debt Office.
HANDELSBANKEN – FACT BOOK
25 Handelsbanken
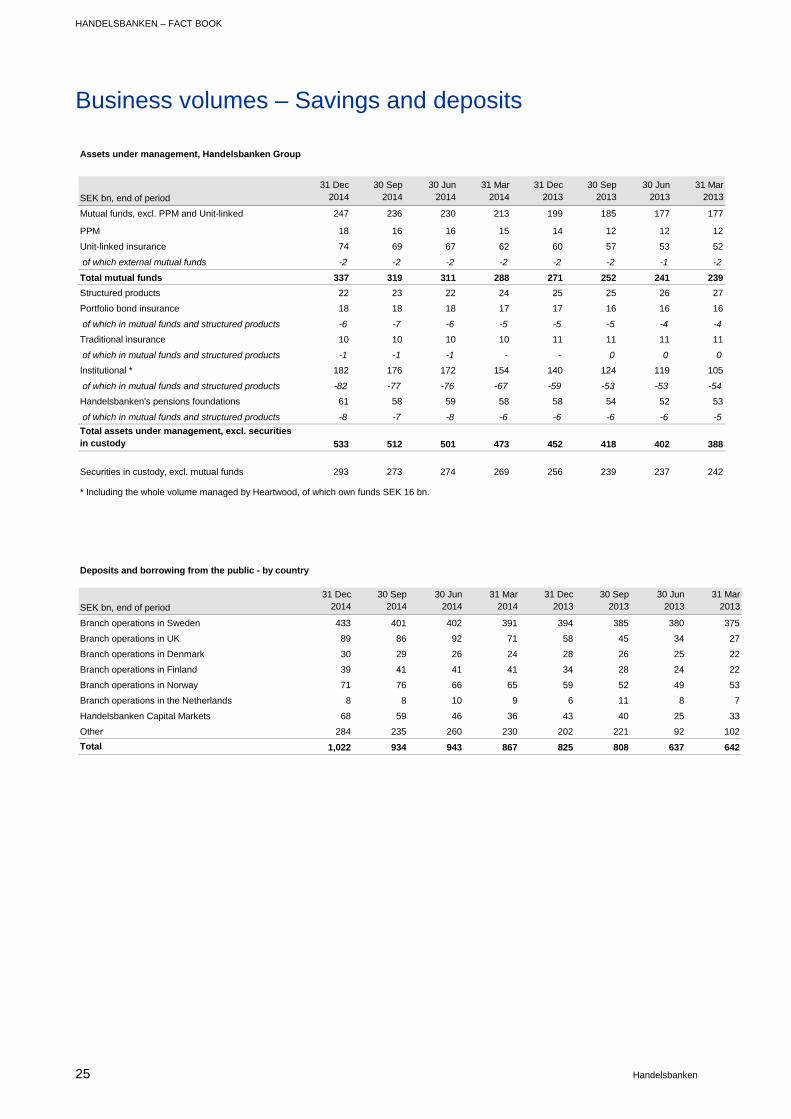
Business volumes – Savings and deposits
Assets under management, Handelsbanken Group
SEK bn, end of period
31 Dec 2014
30 Sep 2014
30 Jun 2014
31 Mar 2014
31 Dec 2013
30 Sep 2013
30 Jun 2013
31 Mar 2013
Mutual funds, excl. PPM and Unit-linked 247 236 230 213 199 185 177 177
PPM 18 16 16 15 14 12 12 12
Unit-linked insurance 74 69 67 62 60 57 53 52
of which external mutual funds -2 -2 -2 -2 -2 -2 -1 -2
Total mutual funds 337 319 311 288 271 252 241 239
Structured products 22 23 22 24 25 25 26 27
Portfolio bond insurance 18 18 18 17 17 16 16 16
of which in mutual funds and structured products -6 -7 -6 -5 -5 -5 -4 -4
Traditional insurance 10 10 10 10 11 11 11 11
of which in mutual funds and structured products -1 -1 -1 - - 0 0 0
Institutional * 182 176 172 154 140 124 119 105
of which in mutual funds and structured products -82 -77 -76 -67 -59 -53 -53 -54
Handelsbanken's pensions foundations 61 58 59 58 58 54 52 53
of which in mutual funds and structured products -8 -7 -8 -6 -6 -6 -6 -5
Total assets under management, excl. securities in custody 533 512 501 473 452 418 402 388
Securities in custody, excl. mutual funds 293 273 274 269 256 239 237 242
* Including the whole volume managed by Heartwood, of which own funds SEK 16 bn.
Deposits and borrowing from the public - by country
SEK bn, end of period
31 Dec 2014
30 Sep 2014
30 Jun 2014
31 Mar 2014
31 Dec 2013
30 Sep 2013
30 Jun 2013
31 Mar 2013
Branch operations in Sweden 433 401 402 391 394 385 380 375
Branch operations in UK 89 86 92 71 58 45 34 27
Branch operations in Denmark 30 29 26 24 28 26 25 22
Branch operations in Finland 39 41 41 41 34 28 24 22
Branch operations in Norway 71 76 66 65 59 52 49 53
Branch operations in the Netherlands 8 8 10 9 6 11 8 7
Handelsbanken Capital Markets 68 59 46 36 43 40 25 33
Other 284 235 260 230 202 221 92 102
Total 1,022 934 943 867 825 808 637 642
HANDELSBANKEN - FACT BOOK
26 Handelsbanken
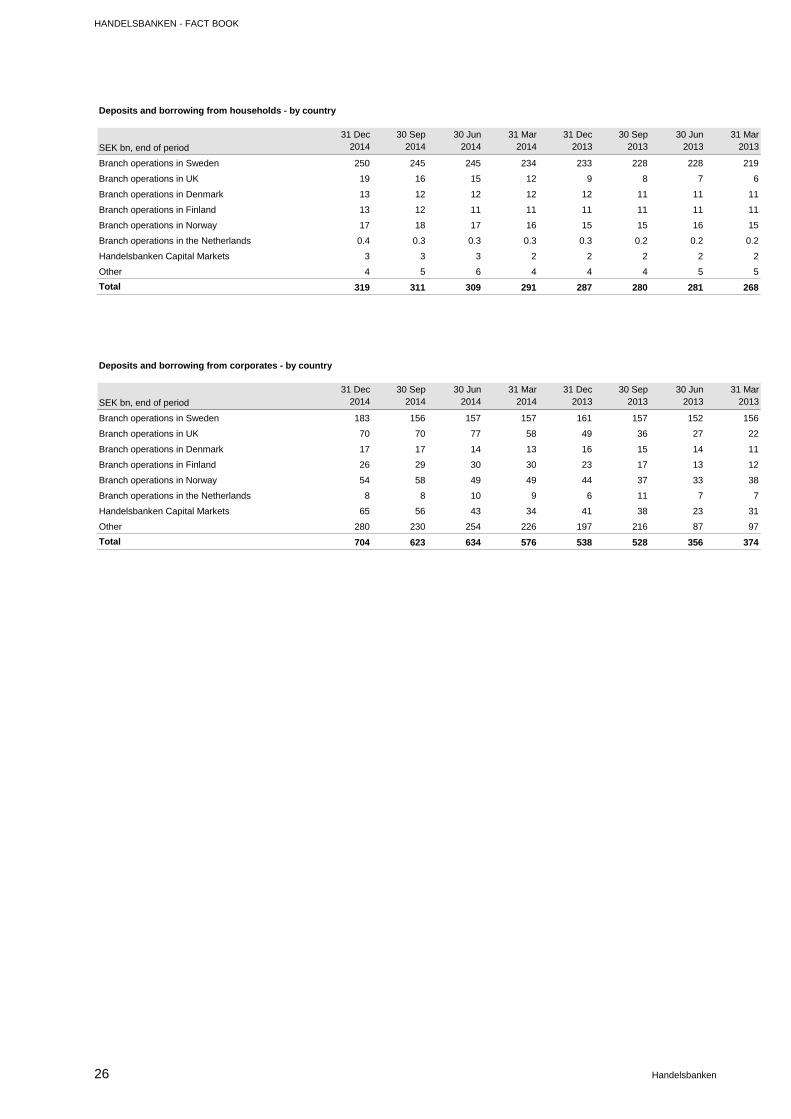
Deposits and borrowing from households - by country
SEK bn, end of period
31 Dec 2014
30 Sep 2014
30 Jun 2014
31 Mar 2014
31 Dec 2013
30 Sep 2013
30 Jun 2013
31 Mar 2013
Branch operations in Sweden 250 245 245 234 233 228 228 219
Branch operations in UK 19 16 15 12 9 8 7 6
Branch operations in Denmark 13 12 12 12 12 11 11 11
Branch operations in Finland 13 12 11 11 11 11 11 11
Branch operations in Norway 17 18 17 16 15 15 16 15
Branch operations in the Netherlands 0.4 0.3 0.3 0.3 0.3 0.2 0.2 0.2
Handelsbanken Capital Markets 3 3 3 2 2 2 2 2
Other 4 5 6 4 4 4 5 5
Total 319 311 309 291 287 280 281 268
Deposits and borrowing from corporates - by country
SEK bn, end of period
31 Dec 2014
30 Sep 2014
30 Jun 2014
31 Mar 2014
31 Dec 2013
30 Sep 2013
30 Jun 2013
31 Mar 2013
Branch operations in Sweden 183 156 157 157 161 157 152 156
Branch operations in UK 70 70 77 58 49 36 27 22
Branch operations in Denmark 17 17 14 13 16 15 14 11
Branch operations in Finland 26 29 30 30 23 17 13 12
Branch operations in Norway 54 58 49 49 44 37 33 38
Branch operations in the Netherlands 8 8 10 9 6 11 7 7
Handelsbanken Capital Markets 65 56 43 34 41 38 23 31
Other 280 230 254 226 197 216 87 97
Total 704 623 634 576 538 528 356 374
HANDELSBANKEN – FACT BOOK
27 Handelsbanken
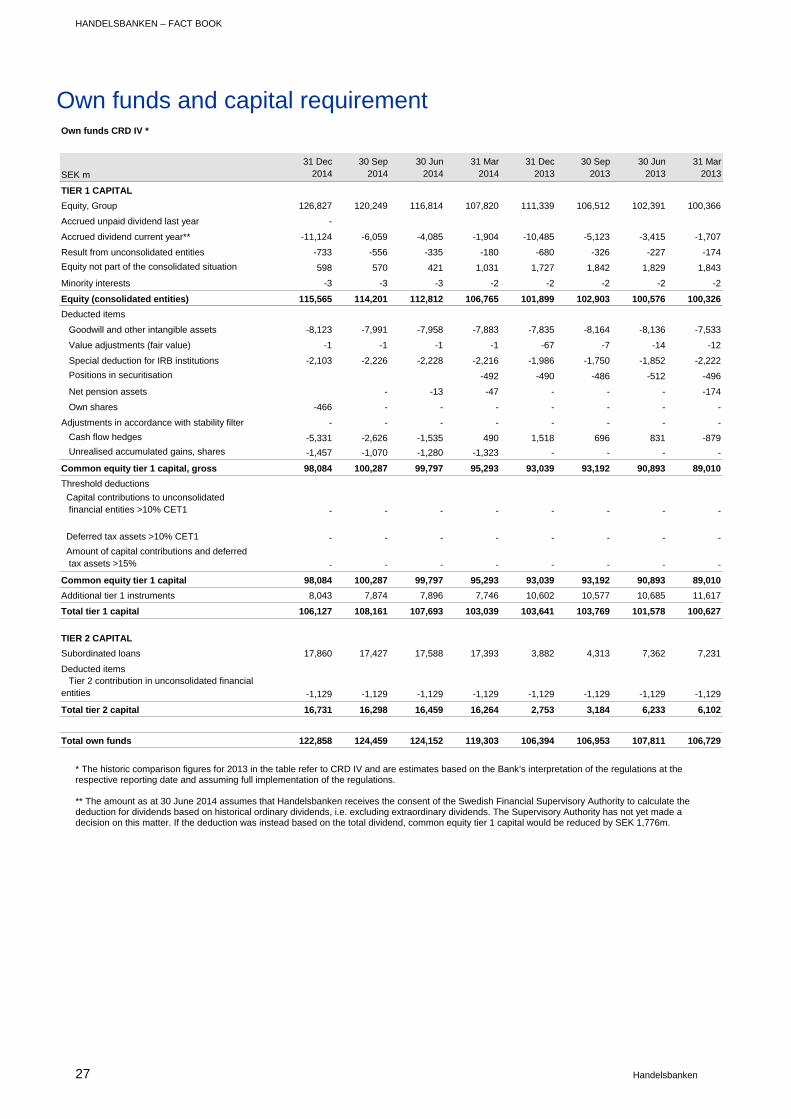
Own funds and capital requirement
* The historic comparison figures for 2013 in the table refer to CRD IV and are estimates based on the Bank’s interpretation of the regulations at the respective reporting date and assuming full implementation of the regulations. ** The amount as at 30 June 2014 assumes that Handelsbanken receives the consent of the Swedish Financial Supervisory Authority to calculate the deduction for dividends based on historical ordinary dividends, i.e. excluding extraordinary dividends. The Supervisory Authority has not yet made a decision on this matter. If the deduction was instead based on the total dividend, common equity tier 1 capital would be reduced by SEK 1,776m.
Own funds CRD IV *
SEK m
31 Dec 2014
30 Sep 2014
30 Jun 2014
31 Mar 2014
31 Dec 2013
30 Sep 2013
30 Jun 2013
31 Mar 2013
TIER 1 CAPITAL
Equity, Group 126,827 120,249 116,814 107,820 111,339 106,512 102,391 100,366
Accrued unpaid dividend last year -
Accrued dividend current year** -11,124 -6,059 -4,085 -1,904 -10,485 -5,123 -3,415 -1,707
Result from unconsolidated entities -733 -556 -335 -180 -680 -326 -227 -174
Equity not part of the consolidated situation 598 570 421 1,031 1,727 1,842 1,829 1,843
Minority interests -3 -3 -3 -2 -2 -2 -2 -2
Equity (consolidated entities) 115,565 114,201 112,812 106,765 101,899 102,903 100,576 100,326
Deducted items
Goodwill and other intangible assets -8,123 -7,991 -7,958 -7,883 -7,835 -8,164 -8,136 -7,533
Value adjustments (fair value) -1 -1 -1 -1 -67 -7 -14 -12
Special deduction for IRB institutions -2,103 -2,226 -2,228 -2,216 -1,986 -1,750 -1,852 -2,222
Positions in securitisation -492 -490 -486 -512 -496
Net pension assets - -13 -47 - - - -174
Own shares -466 - - - - - - -
Adjustments in accordance with stability filter - - - - - - - -
Cash flow hedges -5,331 -2,626 -1,535 490 1,518 696 831 -879
Unrealised accumulated gains, shares -1,457 -1,070 -1,280 -1,323 - - - -
Common equity tier 1 capital, gross 98,084 100,287 99,797 95,293 93,039 93,192 90,893 89,010
Threshold deductions
Capital contributions to unconsolidated financial entities >10% CET1 - - - - - - - -
Deferred tax assets >10% CET1 - - - - - - - -
Amount of capital contributions and deferred tax assets >15% - - - - - - - -
Common equity tier 1 capital 98,084 100,287 99,797 95,293 93,039 93,192 90,893 89,010
Additional tier 1 instruments 8,043 7,874 7,896 7,746 10,602 10,577 10,685 11,617
Total tier 1 capital 106,127 108,161 107,693 103,039 103,641 103,769 101,578 100,627
TIER 2 CAPITAL
Subordinated loans 17,860 17,427 17,588 17,393 3,882 4,313 7,362 7,231
Deducted items Tier 2 contribution in unconsolidated financial entities -1,129 -1,129 -1,129 -1,129 -1,129 -1,129 -1,129 -1,129
Total tier 2 capital 16,731 16,298 16,459 16,264 2,753 3,184 6,233 6,102
Total own funds 122,858 124,459 124,152 119,303 106,394 106,953 107,811 106,729
HANDELSBANKEN - FACT BOOK
28 Handelsbanken
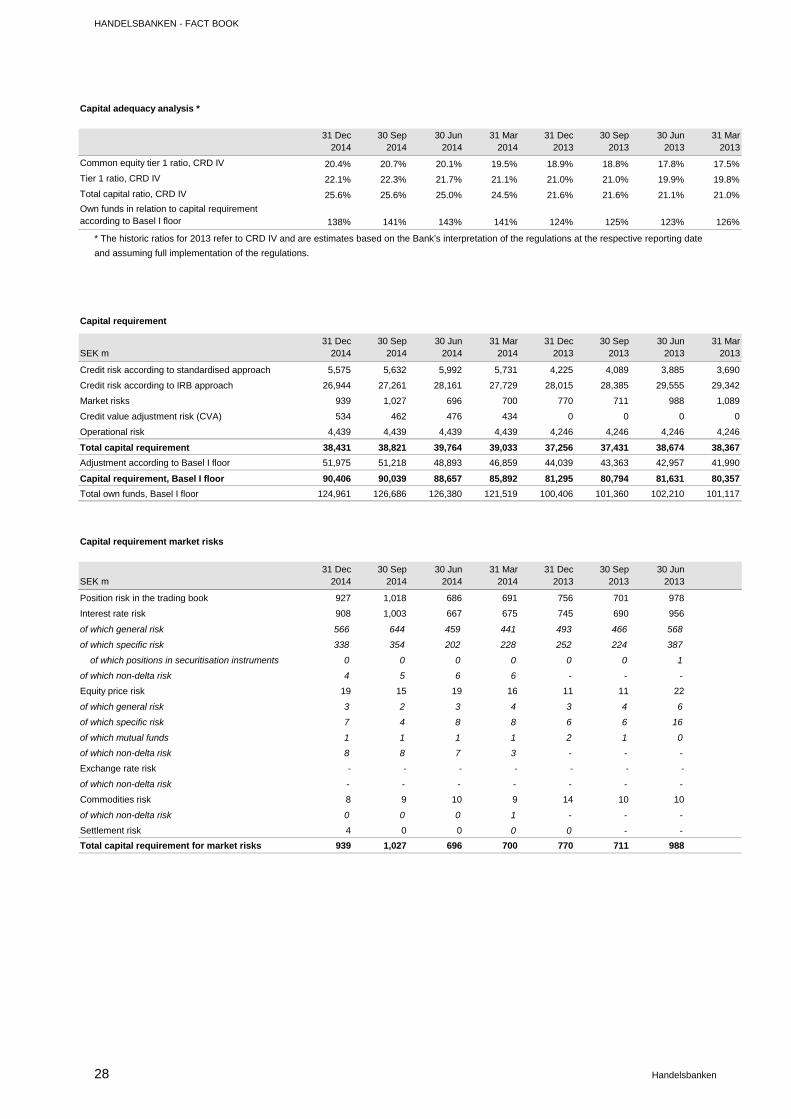
* The historic ratios for 2013 refer to CRD IV and are estimates based on the Bank’s interpretation of the regulations at the respective reporting date
and assuming full implementation of the regulations.
Capital adequacy analysis *
31 Dec 2014
30 Sep 2014
30 Jun 2014
31 Mar 2014
31 Dec 2013
30 Sep 2013
30 Jun 2013
31 Mar 2013
Common equity tier 1 ratio, CRD IV 20.4% 20.7% 20.1% 19.5% 18.9% 18.8% 17.8% 17.5%
Tier 1 ratio, CRD IV 22.1% 22.3% 21.7% 21.1% 21.0% 21.0% 19.9% 19.8%
Total capital ratio, CRD IV 25.6% 25.6% 25.0% 24.5% 21.6% 21.6% 21.1% 21.0%
Own funds in relation to capital requirement according to Basel I floor 138% 141% 143% 141% 124% 125% 123% 126%
SEK m31 Dec
201430 Sep
201430 Jun
201431 Mar
201431 Dec
201330 Sep
201330 Jun
201331 Mar
2013
Credit risk according to standardised approach 5,575 5,632 5,992 5,731 4,225 4,089 3,885 3,690
Credit risk according to IRB approach 26,944 27,261 28,161 27,729 28,015 28,385 29,555 29,342
Market risks 939 1,027 696 700 770 711 988 1,089
Credit value adjustment risk (CVA) 534 462 476 434 0 0 0 0
Operational risk 4,439 4,439 4,439 4,439 4,246 4,246 4,246 4,246
Total capital requirement 38,431 38,821 39,764 39,033 37,256 37,431 38,674 38,367
Adjustment according to Basel I floor 51,975 51,218 48,893 46,859 44,039 43,363 42,957 41,990
Capital requirement, Basel I floor 90,406 90,039 88,657 85,892 81,295 80,794 81,631 80,357
Total own funds, Basel I floor 124,961 126,686 126,380 121,519 100,406 101,360 102,210 101,117
Capital requirement
Capital requirement market risks
SEK m31 Dec
201430 Sep
201430 Jun
201431 Mar
201431 Dec
201330 Sep
201330 Jun
2013
Position risk in the trading book 927 1,018 686 691 756 701 978
Interest rate risk 908 1,003 667 675 745 690 956
of which general risk 566 644 459 441 493 466 568
of which specific risk 338 354 202 228 252 224 387
of which positions in securitisation instruments 0 0 0 0 0 0 1
of which non-delta risk 4 5 6 6 - - -
Equity price risk 19 15 19 16 11 11 22
of which general risk 3 2 3 4 3 4 6
of which specific risk 7 4 8 8 6 6 16
of which mutual funds 1 1 1 1 2 1 0
of which non-delta risk 8 8 7 3 - - -
Exchange rate risk - - - - - - -
of which non-delta risk - - - - - - -
Commodities risk 8 9 10 9 14 10 10
of which non-delta risk 0 0 0 1 - - -
Settlement risk 4 0 0 0 0 - -
Total capital requirement for market risks 939 1,027 696 700 770 711 988
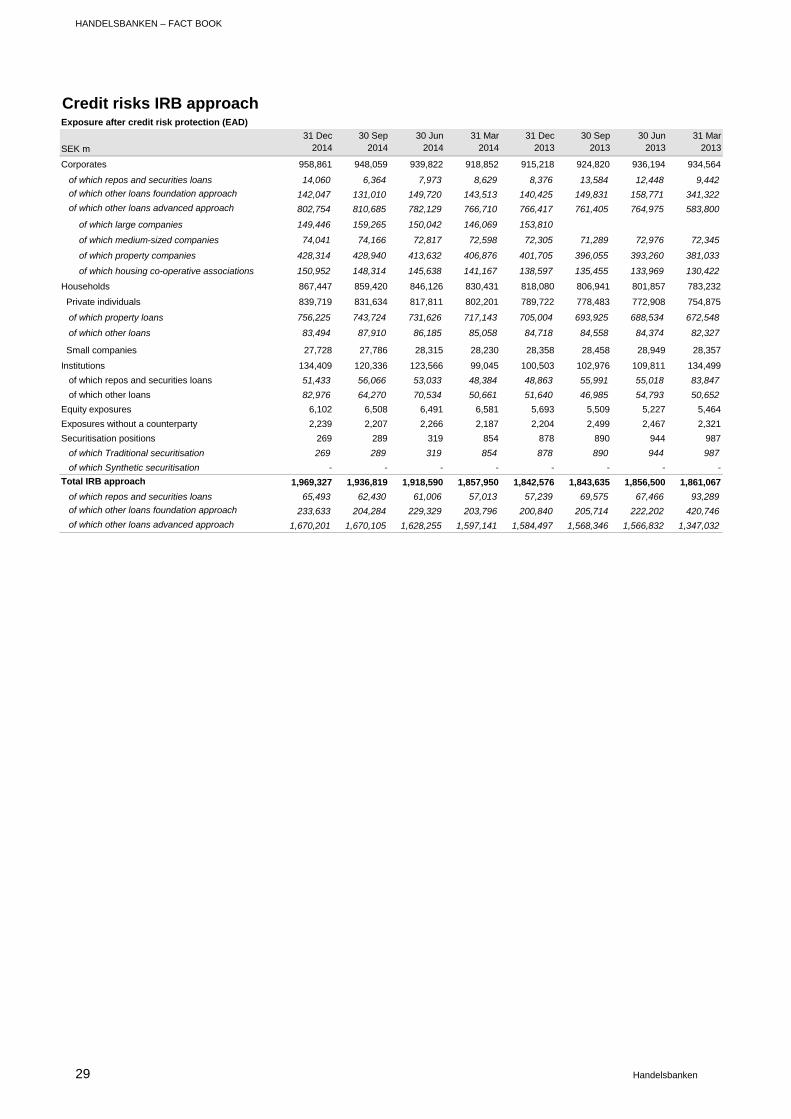
HANDELSBANKEN – FACT BOOK
29 Handelsbanken
Credit risks IRB approachExposure after credit risk protection (EAD)
SEK m
31 Dec 2014
30 Sep 2014
30 Jun 2014
31 Mar 2014
31 Dec 2013
30 Sep 2013
30 Jun 2013
31 Mar 2013
Corporates 958,861 948,059 939,822 918,852 915,218 924,820 936,194 934,564
of which repos and securities loans 14,060 6,364 7,973 8,629 8,376 13,584 12,448 9,442
of which other loans foundation approach 142,047 131,010 149,720 143,513 140,425 149,831 158,771 341,322
of which other loans advanced approach 802,754 810,685 782,129 766,710 766,417 761,405 764,975 583,800
of which large companies 149,446 159,265 150,042 146,069 153,810
of which medium-sized companies 74,041 74,166 72,817 72,598 72,305 71,289 72,976 72,345
of which property companies 428,314 428,940 413,632 406,876 401,705 396,055 393,260 381,033
of which housing co-operative associations 150,952 148,314 145,638 141,167 138,597 135,455 133,969 130,422
Households 867,447 859,420 846,126 830,431 818,080 806,941 801,857 783,232
Private individuals 839,719 831,634 817,811 802,201 789,722 778,483 772,908 754,875
of which property loans 756,225 743,724 731,626 717,143 705,004 693,925 688,534 672,548
of which other loans 83,494 87,910 86,185 85,058 84,718 84,558 84,374 82,327
Small companies 27,728 27,786 28,315 28,230 28,358 28,458 28,949 28,357
Institutions 134,409 120,336 123,566 99,045 100,503 102,976 109,811 134,499
of which repos and securities loans 51,433 56,066 53,033 48,384 48,863 55,991 55,018 83,847
of which other loans 82,976 64,270 70,534 50,661 51,640 46,985 54,793 50,652
Equity exposures 6,102 6,508 6,491 6,581 5,693 5,509 5,227 5,464
Exposures without a counterparty 2,239 2,207 2,266 2,187 2,204 2,499 2,467 2,321
Securitisation positions 269 289 319 854 878 890 944 987
of which Traditional securitisation 269 289 319 854 878 890 944 987
of which Synthetic securitisation - - - - - - - -
Total IRB approach 1,969,327 1,936,819 1,918,590 1,857,950 1,842,576 1,843,635 1,856,500 1,861,067
of which repos and securities loans 65,493 62,430 61,006 57,013 57,239 69,575 67,466 93,289
of which other loans foundation approach 233,633 204,284 229,329 203,796 200,840 205,714 222,202 420,746
of which other loans advanced approach 1,670,201 1,670,105 1,628,255 1,597,141 1,584,497 1,568,346 1,566,832 1,347,032
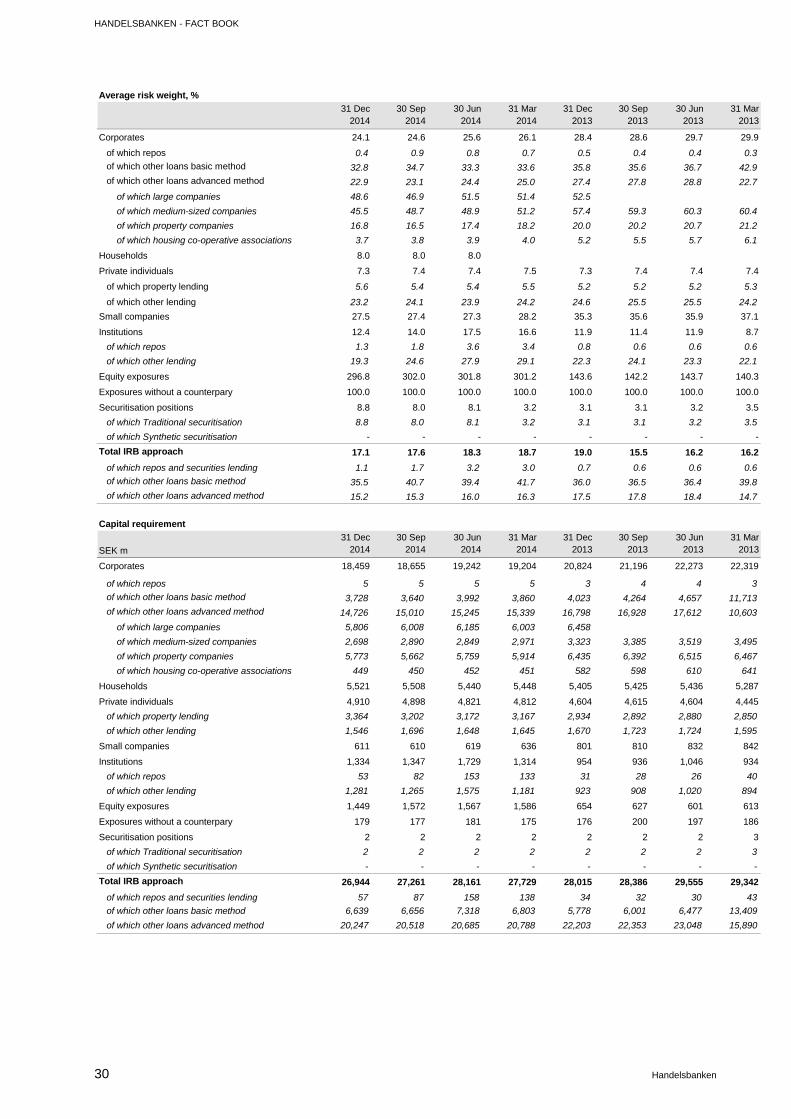
HANDELSBANKEN - FACT BOOK
30 Handelsbanken
Average risk weight, %
31 Dec 2014
30 Sep 2014
30 Jun 2014
31 Mar 2014
31 Dec 2013
30 Sep 2013
30 Jun 2013
31 Mar 2013
Corporates 24.1 24.6 25.6 26.1 28.4 28.6 29.7 29.9
of which repos 0.4 0.9 0.8 0.7 0.5 0.4 0.4 0.3
of which other loans basic method 32.8 34.7 33.3 33.6 35.8 35.6 36.7 42.9
of which other loans advanced method 22.9 23.1 24.4 25.0 27.4 27.8 28.8 22.7
of which large companies 48.6 46.9 51.5 51.4 52.5
of which medium-sized companies 45.5 48.7 48.9 51.2 57.4 59.3 60.3 60.4
of which property companies 16.8 16.5 17.4 18.2 20.0 20.2 20.7 21.2
of which housing co-operative associations 3.7 3.8 3.9 4.0 5.2 5.5 5.7 6.1
Households 8.0 8.0 8.0
Private individuals 7.3 7.4 7.4 7.5 7.3 7.4 7.4 7.4
of which property lending 5.6 5.4 5.4 5.5 5.2 5.2 5.2 5.3
of which other lending 23.2 24.1 23.9 24.2 24.6 25.5 25.5 24.2
Small companies 27.5 27.4 27.3 28.2 35.3 35.6 35.9 37.1
Institutions 12.4 14.0 17.5 16.6 11.9 11.4 11.9 8.7
of which repos 1.3 1.8 3.6 3.4 0.8 0.6 0.6 0.6
of which other lending 19.3 24.6 27.9 29.1 22.3 24.1 23.3 22.1
Equity exposures 296.8 302.0 301.8 301.2 143.6 142.2 143.7 140.3
Exposures without a counterpary 100.0 100.0 100.0 100.0 100.0 100.0 100.0 100.0
Securitisation positions 8.8 8.0 8.1 3.2 3.1 3.1 3.2 3.5
of which Traditional securitisation 8.8 8.0 8.1 3.2 3.1 3.1 3.2 3.5
of which Synthetic securitisation - - - - - - - -
Total IRB approach 17.1 17.6 18.3 18.7 19.0 15.5 16.2 16.2
of which repos and securities lending 1.1 1.7 3.2 3.0 0.7 0.6 0.6 0.6
of which other loans basic method 35.5 40.7 39.4 41.7 36.0 36.5 36.4 39.8
of which other loans advanced method 15.2 15.3 16.0 16.3 17.5 17.8 18.4 14.7
Capital requirement
SEK m
31 Dec 2014
30 Sep 2014
30 Jun 2014
31 Mar 2014
31 Dec 2013
30 Sep 2013
30 Jun 2013
31 Mar 2013
Corporates 18,459 18,655 19,242 19,204 20,824 21,196 22,273 22,319
of which repos 5 5 5 5 3 4 4 3
of which other loans basic method 3,728 3,640 3,992 3,860 4,023 4,264 4,657 11,713
of which other loans advanced method 14,726 15,010 15,245 15,339 16,798 16,928 17,612 10,603
of which large companies 5,806 6,008 6,185 6,003 6,458
of which medium-sized companies 2,698 2,890 2,849 2,971 3,323 3,385 3,519 3,495
of which property companies 5,773 5,662 5,759 5,914 6,435 6,392 6,515 6,467
of which housing co-operative associations 449 450 452 451 582 598 610 641
Households 5,521 5,508 5,440 5,448 5,405 5,425 5,436 5,287
Private individuals 4,910 4,898 4,821 4,812 4,604 4,615 4,604 4,445
of which property lending 3,364 3,202 3,172 3,167 2,934 2,892 2,880 2,850
of which other lending 1,546 1,696 1,648 1,645 1,670 1,723 1,724 1,595
Small companies 611 610 619 636 801 810 832 842
Institutions 1,334 1,347 1,729 1,314 954 936 1,046 934
of which repos 53 82 153 133 31 28 26 40
of which other lending 1,281 1,265 1,575 1,181 923 908 1,020 894
Equity exposures 1,449 1,572 1,567 1,586 654 627 601 613
Exposures without a counterpary 179 177 181 175 176 200 197 186
Securitisation positions 2 2 2 2 2 2 2 3
of which Traditional securitisation 2 2 2 2 2 2 2 3
of which Synthetic securitisation - - - - - - - -
Total IRB approach 26,944 27,261 28,161 27,729 28,015 28,386 29,555 29,342
of which repos and securities lending 57 87 158 138 34 32 30 43
of which other loans basic method 6,639 6,656 7,318 6,803 5,778 6,001 6,477 13,409
of which other loans advanced method 20,247 20,518 20,685 20,788 22,203 22,353 23,048 15,890
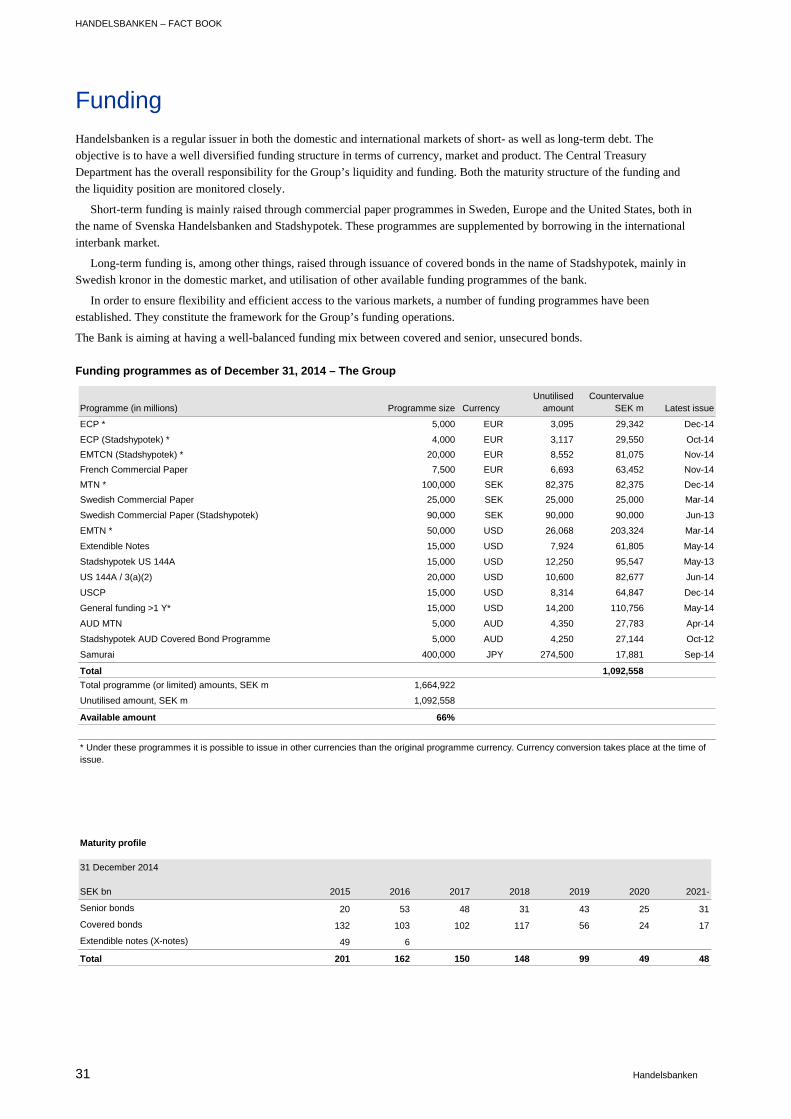
HANDELSBANKEN – FACT BOOK
31 Handelsbanken
Funding
Handelsbanken is a regular issuer in both the domestic and international markets of short- as well as long-term debt. The
objective is to have a well diversified funding structure in terms of currency, market and product. The Central Treasury
Department has the overall responsibility for the Group’s liquidity and funding. Both the maturity structure of the funding and
the liquidity position are monitored closely.
Short-term funding is mainly raised through commercial paper programmes in Sweden, Europe and the United States, both in
the name of Svenska Handelsbanken and Stadshypotek. These programmes are supplemented by borrowing in the international
interbank market.
Long-term funding is, among other things, raised through issuance of covered bonds in the name of Stadshypotek, mainly in
Swedish kronor in the domestic market, and utilisation of other available funding programmes of the bank.
In order to ensure flexibility and efficient access to the various markets, a number of funding programmes have been
established. They constitute the framework for the Group’s funding operations.
The Bank is aiming at having a well-balanced funding mix between covered and senior, unsecured bonds.
Funding programmes as of December 31, 2014 – The Group
Programme (in millions) Programme size CurrencyUnutilised
amountCountervalue
SEK m Latest issue
ECP * 5,000 EUR 3,095 29,342 Dec-14
ECP (Stadshypotek) * 4,000 EUR 3,117 29,550 Oct-14
EMTCN (Stadshypotek) * 20,000 EUR 8,552 81,075 Nov-14
French Commercial Paper 7,500 EUR 6,693 63,452 Nov-14
MTN * 100,000 SEK 82,375 82,375 Dec-14
Swedish Commercial Paper 25,000 SEK 25,000 25,000 Mar-14
Swedish Commercial Paper (Stadshypotek) 90,000 SEK 90,000 90,000 Jun-13
EMTN * 50,000 USD 26,068 203,324 Mar-14
Extendible Notes 15,000 USD 7,924 61,805 May-14
Stadshypotek US 144A 15,000 USD 12,250 95,547 May-13
US 144A / 3(a)(2) 20,000 USD 10,600 82,677 Jun-14
USCP 15,000 USD 8,314 64,847 Dec-14
General funding >1 Y* 15,000 USD 14,200 110,756 May-14
AUD MTN 5,000 AUD 4,350 27,783 Apr-14
Stadshypotek AUD Covered Bond Programme 5,000 AUD 4,250 27,144 Oct-12
Samurai 400,000 JPY 274,500 17,881 Sep-14
Total 1,092,558
Total programme (or limited) amounts, SEK m 1,664,922
Unutilised amount, SEK m 1,092,558
Available amount 66%
* Under these programmes it is possible to issue in other currencies than the original programme currency. Currency conversion takes place at the time of issue.
Maturity profile
31 December 2014
SEK bn 2015 2016 2017 2018 2019 2020 2021-
Senior bonds 20 53 48 31 43 25 31
Covered bonds 132 103 102 117 56 24 17
Extendible notes (X-notes) 49 6
Total 201 162 150 148 99 49 48
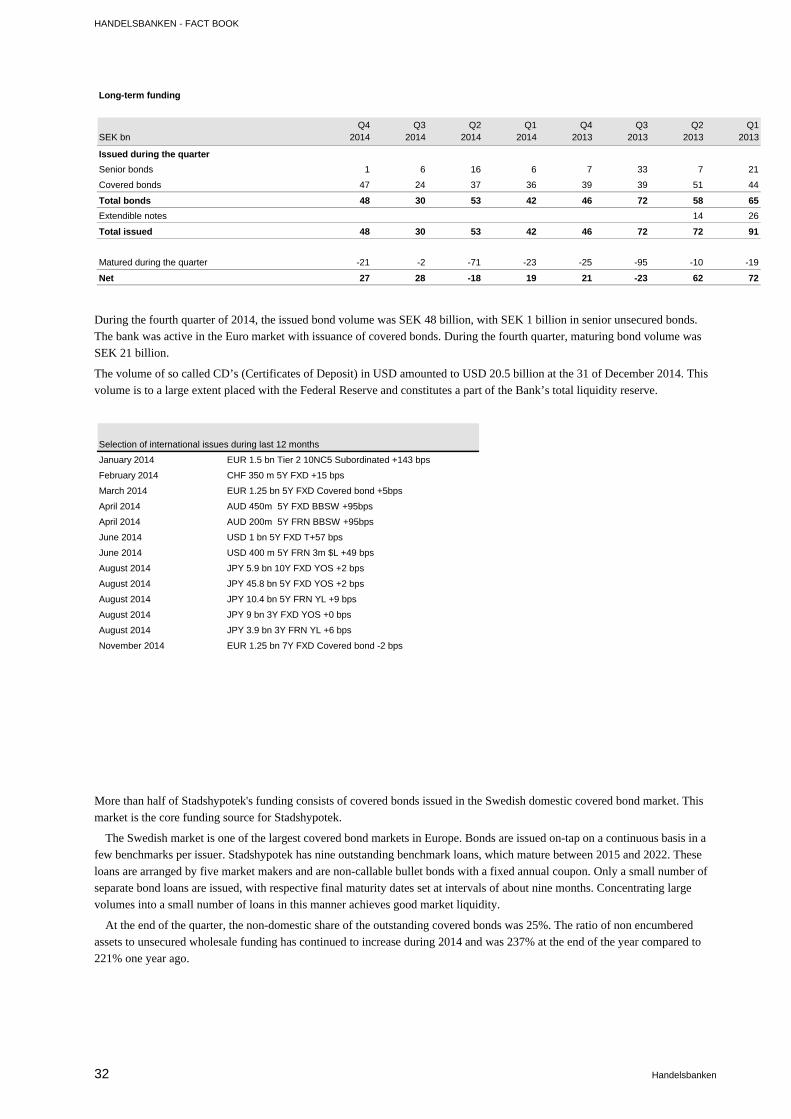
HANDELSBANKEN - FACT BOOK
32 Handelsbanken
During the fourth quarter of 2014, the issued bond volume was SEK 48 billion, with SEK 1 billion in senior unsecured bonds.
The bank was active in the Euro market with issuance of covered bonds. During the fourth quarter, maturing bond volume was
SEK 21 billion.
The volume of so called CD’s (Certificates of Deposit) in USD amounted to USD 20.5 billion at the 31 of December 2014. This
volume is to a large extent placed with the Federal Reserve and constitutes a part of the Bank’s total liquidity reserve.
More than half of Stadshypotek's funding consists of covered bonds issued in the Swedish domestic covered bond market. This
market is the core funding source for Stadshypotek.
The Swedish market is one of the largest covered bond markets in Europe. Bonds are issued on-tap on a continuous basis in a
few benchmarks per issuer. Stadshypotek has nine outstanding benchmark loans, which mature between 2015 and 2022. These
loans are arranged by five market makers and are non-callable bullet bonds with a fixed annual coupon. Only a small number of
separate bond loans are issued, with respective final maturity dates set at intervals of about nine months. Concentrating large
volumes into a small number of loans in this manner achieves good market liquidity.
At the end of the quarter, the non-domestic share of the outstanding covered bonds was 25%. The ratio of non encumbered
assets to unsecured wholesale funding has continued to increase during 2014 and was 237% at the end of the year compared to
221% one year ago.
SEK bn Q4
2014Q3
2014Q2
2014Q1
2014Q4
2013Q3
2013Q2
2013Q1
2013
Issued during the quarter
Senior bonds 1 6 16 6 7 33 7 21
Covered bonds 47 24 37 36 39 39 51 44
Total bonds 48 30 53 42 46 72 58 65
Extendible notes 14 26
Total issued 48 30 53 42 46 72 72 91
Matured during the quarter -21 -2 -71 -23 -25 -95 -10 -19
Net 27 28 -18 19 21 -23 62 72
Long-term funding
Selection of international issues during last 12 months
January 2014 EUR 1.5 bn Tier 2 10NC5 Subordinated +143 bps
February 2014 CHF 350 m 5Y FXD +15 bps
March 2014 EUR 1.25 bn 5Y FXD Covered bond +5bps
April 2014 AUD 450m 5Y FXD BBSW +95bps
April 2014 AUD 200m 5Y FRN BBSW +95bps
June 2014 USD 1 bn 5Y FXD T+57 bps
June 2014 USD 400 m 5Y FRN 3m $L +49 bps
August 2014 JPY 5.9 bn 10Y FXD YOS +2 bps
August 2014 JPY 45.8 bn 5Y FXD YOS +2 bps
August 2014 JPY 10.4 bn 5Y FRN YL +9 bps
August 2014 JPY 9 bn 3Y FXD YOS +0 bps
August 2014 JPY 3.9 bn 3Y FRN YL +6 bps
November 2014 EUR 1.25 bn 7Y FXD Covered bond -2 bps
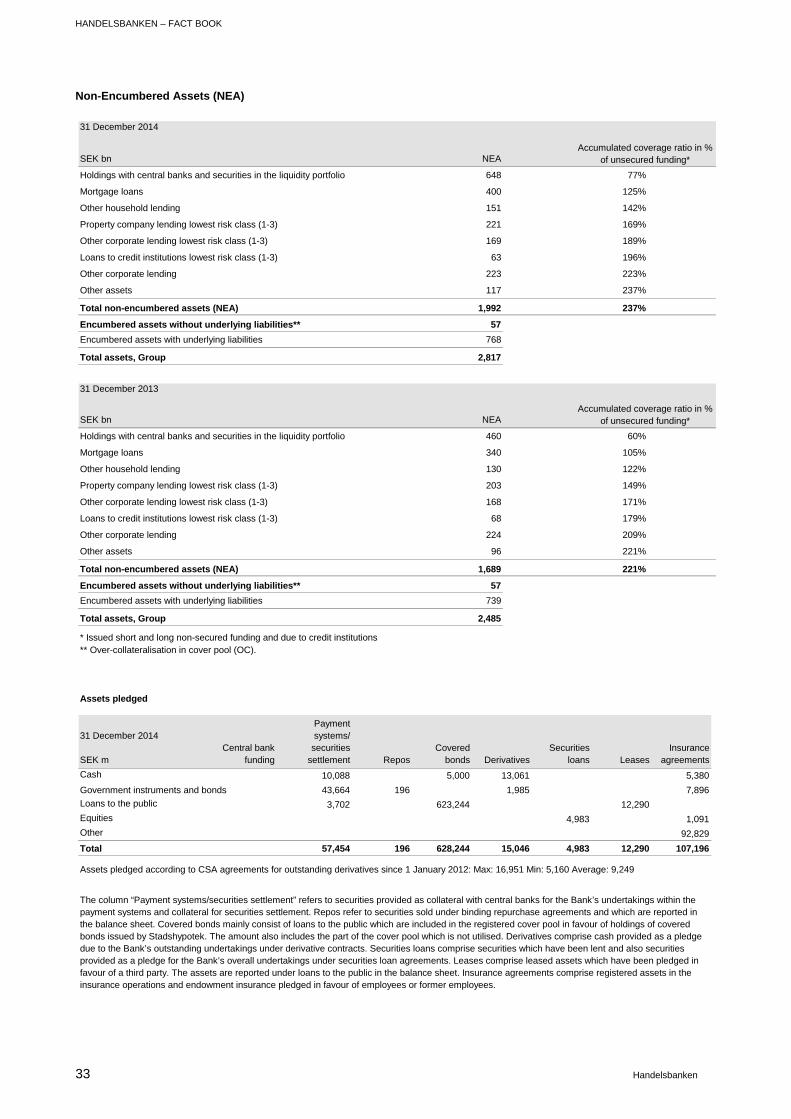
HANDELSBANKEN – FACT BOOK
33 Handelsbanken
Non-Encumbered Assets (NEA)
31 December 2014
SEK bn NEA
Holdings with central banks and securities in the liquidity portfolio 648 77%
Mortgage loans 400 125%
Other household lending 151 142%
Property company lending lowest risk class (1-3) 221 169%
Other corporate lending lowest risk class (1-3) 169 189%
Loans to credit institutions lowest risk class (1-3) 63 196%
Other corporate lending 223 223%
Other assets 117 237%
Total non-encumbered assets (NEA) 1,992 237%
Encumbered assets without underlying liabilities** 57
Encumbered assets with underlying liabilities 768
Total assets, Group 2,817
31 December 2013
SEK bn NEA
Holdings with central banks and securities in the liquidity portfolio 460 60%
Mortgage loans 340 105%
Other household lending 130 122%
Property company lending lowest risk class (1-3) 203 149%
Other corporate lending lowest risk class (1-3) 168 171%
Loans to credit institutions lowest risk class (1-3) 68 179%
Other corporate lending 224 209%
Other assets 96 221%
Total non-encumbered assets (NEA) 1,689 221%
Encumbered assets without underlying liabilities** 57
Encumbered assets with underlying liabilities 739
Total assets, Group 2,485
* Issued short and long non-secured funding and due to credit institutions** Over-collateralisation in cover pool (OC).
Accumulated coverage ratio in % of unsecured funding*
Accumulated coverage ratio in % of unsecured funding*
Assets pledged
31 December 2014
SEK mCentral bank
funding
Payment systems/
securities settlement Repos
Covered bonds Derivatives
Securities loans Leases
Insurance agreements
Cash 10,088 5,000 13,061 5,380
43,664 196 1,985 7,896
Loans to the public 3,702 623,244 12,290
Equities 4,983 1,091
Other 92,829
Total 57,454 196 628,244 15,046 4,983 12,290 107,196
The column “Payment systems/securities settlement” refers to securities provided as collateral with central banks for the Bank’s undertakings within the payment systems and collateral for securities settlement. Repos refer to securities sold under binding repurchase agreements and which are reported in the balance sheet. Covered bonds mainly consist of loans to the public which are included in the registered cover pool in favour of holdings of covered bonds issued by Stadshypotek. The amount also includes the part of the cover pool which is not utilised. Derivatives comprise cash provided as a pledge due to the Bank’s outstanding undertakings under derivative contracts. Securities loans comprise securities which have been lent and also securities provided as a pledge for the Bank’s overall undertakings under securities loan agreements. Leases comprise leased assets which have been pledged in favour of a third party. The assets are reported under loans to the public in the balance sheet. Insurance agreements comprise registered assets in the insurance operations and endowment insurance pledged in favour of employees or former employees.
Assets pledged according to CSA agreements for outstanding derivatives since 1 January 2012: Max: 16,951 Min: 5,160 Average: 9,249
Government instruments and bonds
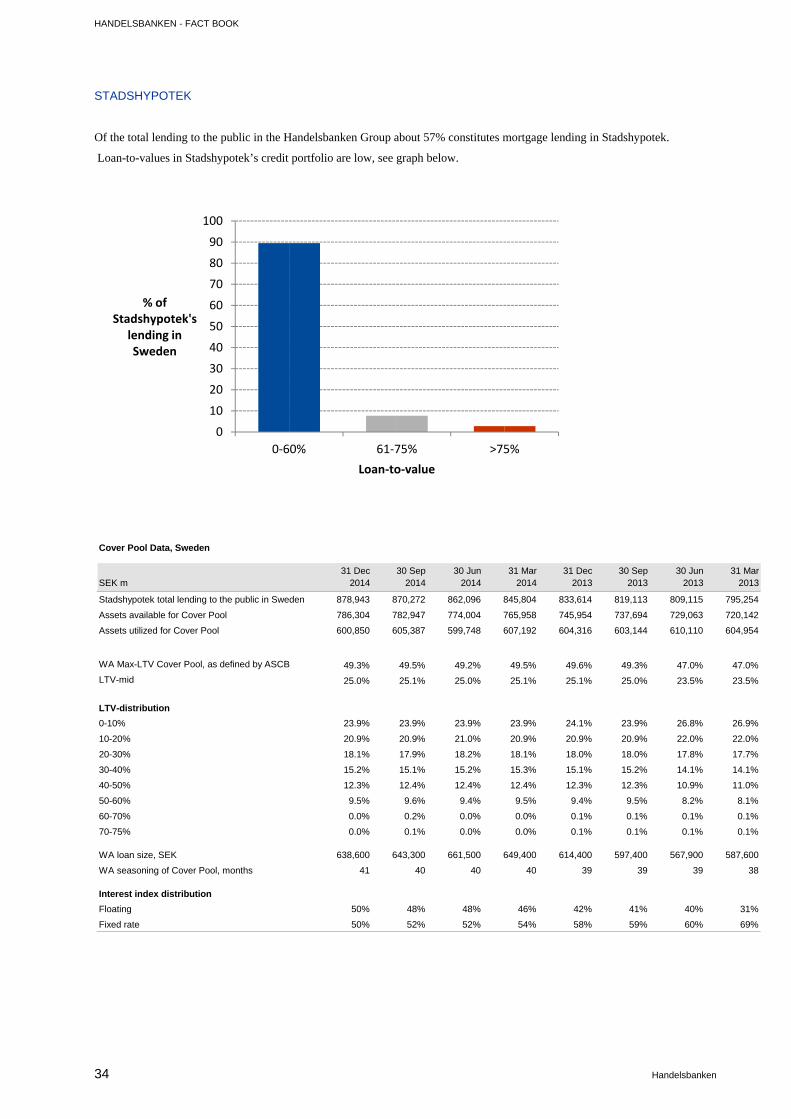
HANDELSBANKEN - FACT BOOK
34 Handelsbanken
STADSHYPOTEK
Of the total lending to the public in the Handelsbanken Group about 57% constitutes mortgage lending in Stadshypotek.
Loan-to-values in Stadshypotek’s credit portfolio are low, see graph below.
0
10
20
30
40
50
60
70
80
90
100
0‐60% 61‐75% >75%
% of Stadshypotek's
lending in Sweden
Loan‐to‐value
Cover Pool Data, Sweden
SEK m31 Dec
201430 Sep
201430 Jun
201431 Mar
201431 Dec
201330 Sep
201330 Jun
201331 Mar
2013
Stadshypotek total lending to the public in Sweden 878,943 870,272 862,096 845,804 833,614 819,113 809,115 795,254
Assets available for Cover Pool 786,304 782,947 774,004 765,958 745,954 737,694 729,063 720,142
Assets utilized for Cover Pool 600,850 605,387 599,748 607,192 604,316 603,144 610,110 604,954
WA Max-LTV Cover Pool, as defined by ASCB 49.3% 49.5% 49.2% 49.5% 49.6% 49.3% 47.0% 47.0%
LTV-mid 25.0% 25.1% 25.0% 25.1% 25.1% 25.0% 23.5% 23.5%
LTV-distribution
0-10% 23.9% 23.9% 23.9% 23.9% 24.1% 23.9% 26.8% 26.9%
10-20% 20.9% 20.9% 21.0% 20.9% 20.9% 20.9% 22.0% 22.0%
20-30% 18.1% 17.9% 18.2% 18.1% 18.0% 18.0% 17.8% 17.7%
30-40% 15.2% 15.1% 15.2% 15.3% 15.1% 15.2% 14.1% 14.1%
40-50% 12.3% 12.4% 12.4% 12.4% 12.3% 12.3% 10.9% 11.0%
50-60% 9.5% 9.6% 9.4% 9.5% 9.4% 9.5% 8.2% 8.1%
60-70% 0.0% 0.2% 0.0% 0.0% 0.1% 0.1% 0.1% 0.1%
70-75% 0.0% 0.1% 0.0% 0.0% 0.1% 0.1% 0.1% 0.1%
WA loan size, SEK 638,600 643,300 661,500 649,400 614,400 597,400 567,900 587,600
WA seasoning of Cover Pool, months 41 40 40 40 39 39 39 38
Interest index distribution
Floating 50% 48% 48% 46% 42% 41% 40% 31%
Fixed rate 50% 52% 52% 54% 58% 59% 60% 69%
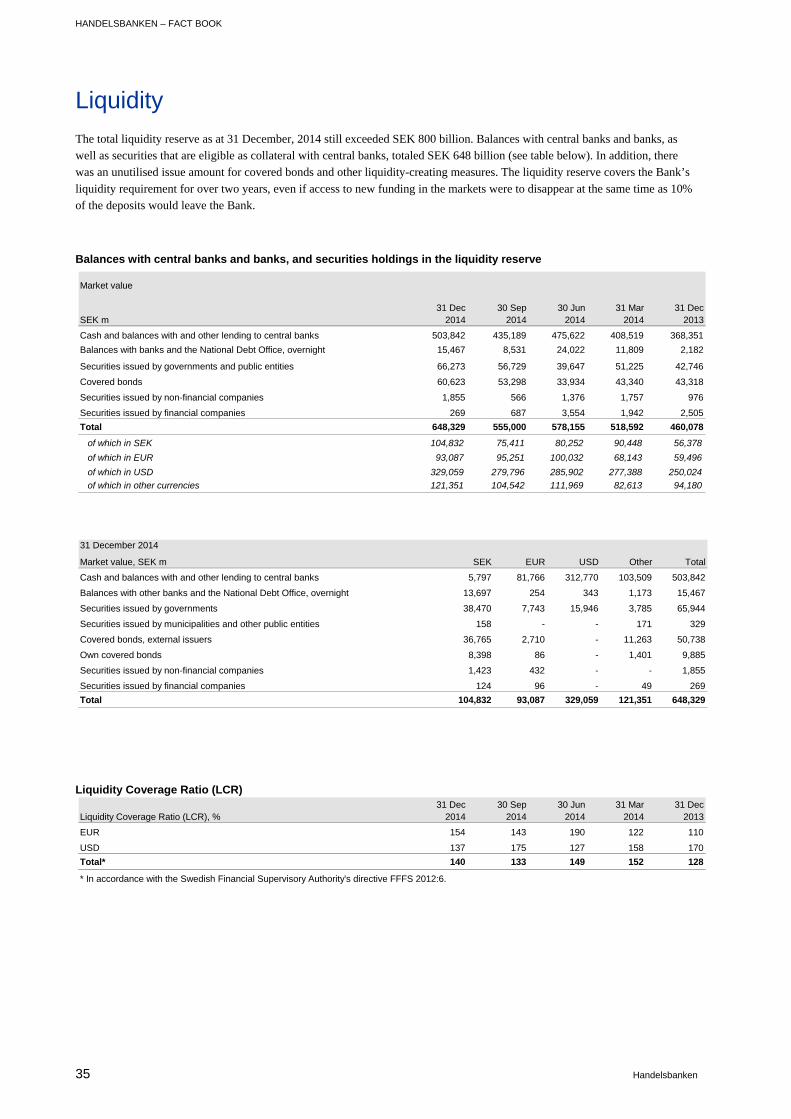
HANDELSBANKEN – FACT BOOK
35 Handelsbanken
Liquidity
The total liquidity reserve as at 31 December, 2014 still exceeded SEK 800 billion. Balances with central banks and banks, as
well as securities that are eligible as collateral with central banks, totaled SEK 648 billion (see table below). In addition, there
was an unutilised issue amount for covered bonds and other liquidity-creating measures. The liquidity reserve covers the Bank’s
liquidity requirement for over two years, even if access to new funding in the markets were to disappear at the same time as 10%
of the deposits would leave the Bank.
Balances with central banks and banks, and securities holdings in the liquidity reserve
Liquidity Coverage Ratio (LCR)
Market value
SEK m31 Dec
201430 Sep
201430 Jun
201431 Mar
201431 Dec
2013
Cash and balances with and other lending to central banks 503,842 435,189 475,622 408,519 368,351
Balances with banks and the National Debt Office, overnight 15,467 8,531 24,022 11,809 2,182
Securities issued by governments and public entities 66,273 56,729 39,647 51,225 42,746
Covered bonds 60,623 53,298 33,934 43,340 43,318
Securities issued by non-financial companies 1,855 566 1,376 1,757 976
Securities issued by financial companies 269 687 3,554 1,942 2,505
Total 648,329 555,000 578,155 518,592 460,078
of which in SEK 104,832 75,411 80,252 90,448 56,378
of which in EUR 93,087 95,251 100,032 68,143 59,496
of which in USD 329,059 279,796 285,902 277,388 250,024
of which in other currencies 121,351 104,542 111,969 82,613 94,180
31 December 2014
Market value, SEK m SEK EUR USD Other Total
Cash and balances with and other lending to central banks 5,797 81,766 312,770 103,509 503,842
Balances with other banks and the National Debt Office, overnight 13,697 254 343 1,173 15,467
Securities issued by governments 38,470 7,743 15,946 3,785 65,944
Securities issued by municipalities and other public entities 158 - - 171 329
Covered bonds, external issuers 36,765 2,710 - 11,263 50,738
Own covered bonds 8,398 86 - 1,401 9,885
Securities issued by non-financial companies 1,423 432 - - 1,855
Securities issued by financial companies 124 96 - 49 269
Total 104,832 93,087 329,059 121,351 648,329
Liquidity Coverage Ratio (LCR), %31 Dec
201430 Sep
201430 Jun
201431 Mar
201431 Dec
2013
EUR 154 143 190 122 110
USD 137 175 127 158 170
Total* 140 133 149 152 128
* In accordance with the Swedish Financial Supervisory Authority's directive FFFS 2012:6.
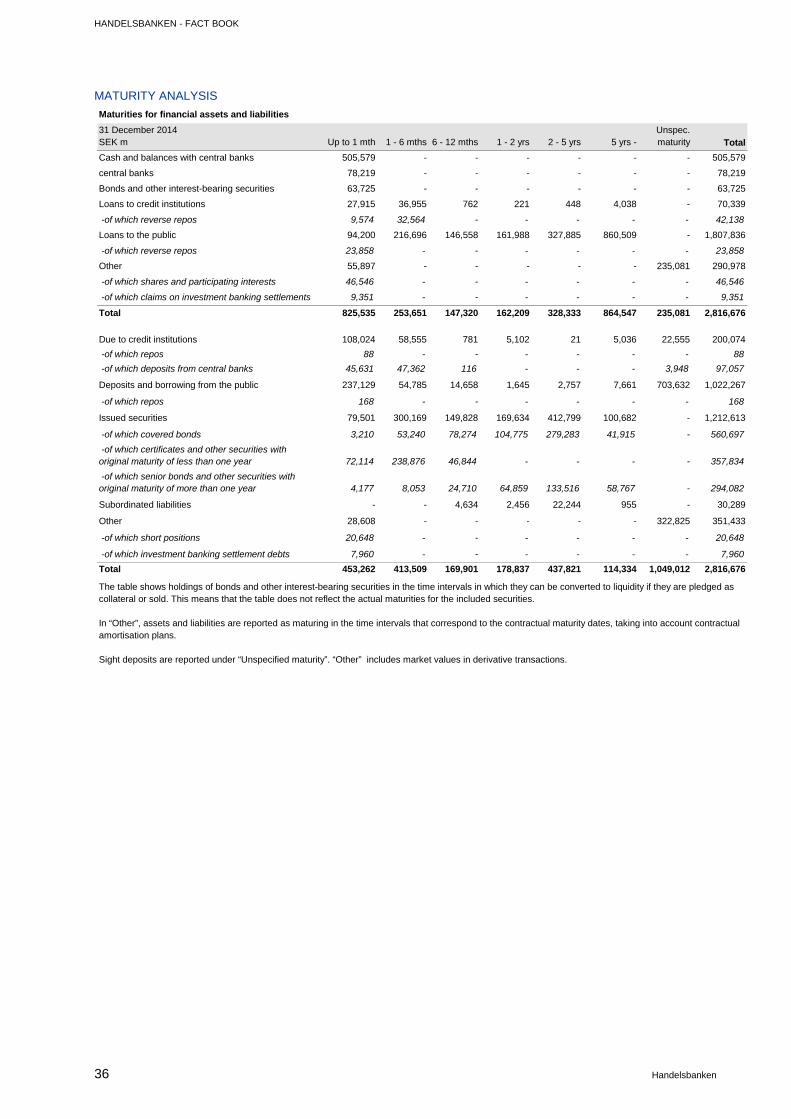
HANDELSBANKEN - FACT BOOK
36 Handelsbanken
MATURITY ANALYSIS
31 December 2014SEK m Up to 1 mth 1 - 6 mths 6 - 12 mths 1 - 2 yrs 2 - 5 yrs 5 yrs -
Unspec. maturity Total
Cash and balances with central banks 505,579 - - - - - - 505,579
central banks 78,219 - - - - - - 78,219
Bonds and other interest-bearing securities 63,725 - - - - - - 63,725
Loans to credit institutions 27,915 36,955 762 221 448 4,038 - 70,339
-of which reverse repos 9,574 32,564 - - - - - 42,138
Loans to the public 94,200 216,696 146,558 161,988 327,885 860,509 - 1,807,836
-of which reverse repos 23,858 - - - - - - 23,858
Other 55,897 - - - - - 235,081 290,978
-of which shares and participating interests 46,546 - - - - - - 46,546
-of which claims on investment banking settlements 9,351 - - - - - - 9,351
Total 825,535 253,651 147,320 162,209 328,333 864,547 235,081 2,816,676
Due to credit institutions 108,024 58,555 781 5,102 21 5,036 22,555 200,074
-of which repos 88 - - - - - - 88
-of which deposits from central banks 45,631 47,362 116 - - - 3,948 97,057
Deposits and borrowing from the public 237,129 54,785 14,658 1,645 2,757 7,661 703,632 1,022,267
-of which repos 168 - - - - - - 168
Issued securities 79,501 300,169 149,828 169,634 412,799 100,682 - 1,212,613
-of which covered bonds 3,210 53,240 78,274 104,775 279,283 41,915 - 560,697
-of which certificates and other securities with original maturity of less than one year 72,114 238,876 46,844 - - - - 357,834
-of which senior bonds and other securities with original maturity of more than one year 4,177 8,053 24,710 64,859 133,516 58,767 - 294,082
Subordinated liabilities - - 4,634 2,456 22,244 955 - 30,289
Other 28,608 - - - - - 322,825 351,433
-of which short positions 20,648 - - - - - - 20,648
-of which investment banking settlement debts 7,960 - - - - - - 7,960
Total 453,262 413,509 169,901 178,837 437,821 114,334 1,049,012 2,816,676
Maturities for financial assets and liabilities
The table shows holdings of bonds and other interest-bearing securities in the time intervals in which they can be converted to liquidity if they are pledged as collateral or sold. This means that the table does not reflect the actual maturities for the included securities.
In “Other”, assets and liabilities are reported as maturing in the time intervals that correspond to the contractual maturity dates, taking into account contractual amortisation plans.
Sight deposits are reported under “Unspecified maturity”. “Other” includes market values in derivative transactions.
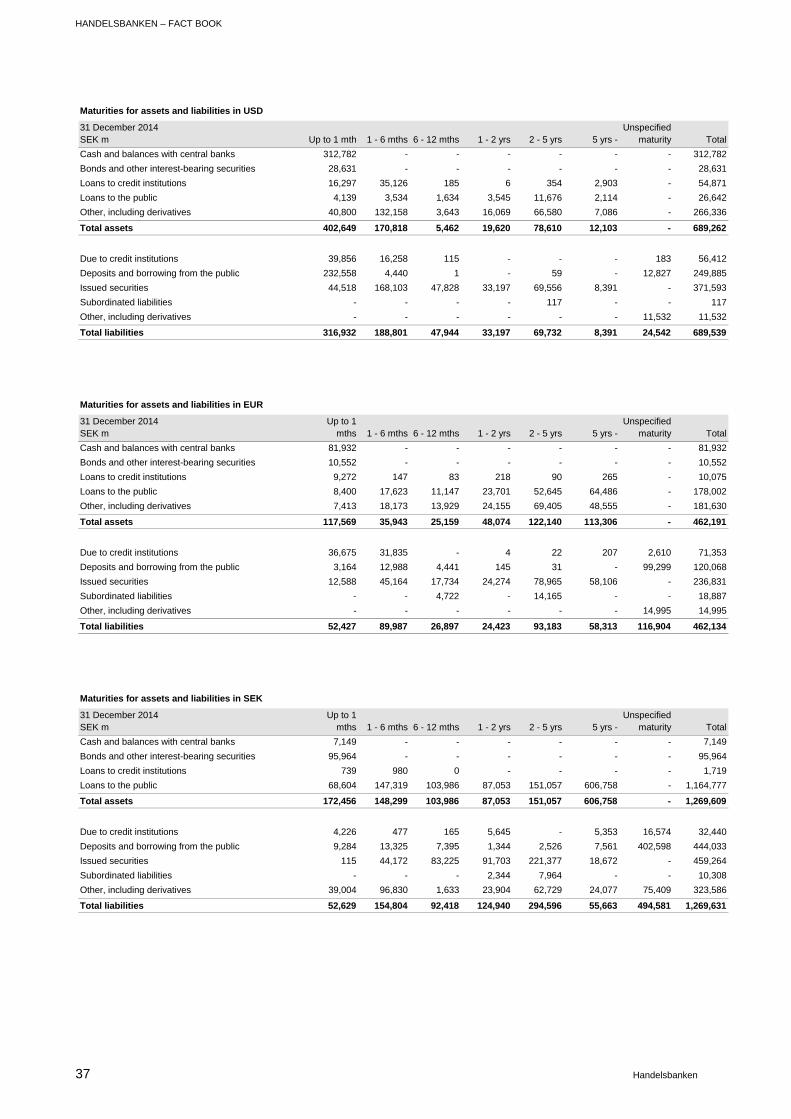
HANDELSBANKEN – FACT BOOK
37 Handelsbanken
31 December 2014SEK m Up to 1 mth 1 - 6 mths 6 - 12 mths 1 - 2 yrs 2 - 5 yrs 5 yrs -
Unspecified maturity Total
Cash and balances with central banks 312,782 - - - - - - 312,782
Bonds and other interest-bearing securities 28,631 - - - - - - 28,631
Loans to credit institutions 16,297 35,126 185 6 354 2,903 - 54,871
Loans to the public 4,139 3,534 1,634 3,545 11,676 2,114 - 26,642
Other, including derivatives 40,800 132,158 3,643 16,069 66,580 7,086 - 266,336
Total assets 402,649 170,818 5,462 19,620 78,610 12,103 - 689,262
Due to credit institutions 39,856 16,258 115 - - - 183 56,412
Deposits and borrowing from the public 232,558 4,440 1 - 59 - 12,827 249,885
Issued securities 44,518 168,103 47,828 33,197 69,556 8,391 - 371,593
Subordinated liabilities - - - - 117 - - 117
Other, including derivatives - - - - - - 11,532 11,532
Total liabilities 316,932 188,801 47,944 33,197 69,732 8,391 24,542 689,539
Maturities for assets and liabilities in USD
31 December 2014SEK m
Up to 1 mths 1 - 6 mths 6 - 12 mths 1 - 2 yrs 2 - 5 yrs 5 yrs -
Unspecified maturity Total
Cash and balances with central banks 81,932 - - - - - - 81,932
Bonds and other interest-bearing securities 10,552 - - - - - - 10,552
Loans to credit institutions 9,272 147 83 218 90 265 - 10,075
Loans to the public 8,400 17,623 11,147 23,701 52,645 64,486 - 178,002
Other, including derivatives 7,413 18,173 13,929 24,155 69,405 48,555 - 181,630
Total assets 117,569 35,943 25,159 48,074 122,140 113,306 - 462,191
Due to credit institutions 36,675 31,835 - 4 22 207 2,610 71,353
Deposits and borrowing from the public 3,164 12,988 4,441 145 31 - 99,299 120,068
Issued securities 12,588 45,164 17,734 24,274 78,965 58,106 - 236,831
Subordinated liabilities - - 4,722 - 14,165 - - 18,887
Other, including derivatives - - - - - - 14,995 14,995
Total liabilities 52,427 89,987 26,897 24,423 93,183 58,313 116,904 462,134
Maturities for assets and liabilities in EUR
31 December 2014SEK m
Up to 1 mths 1 - 6 mths 6 - 12 mths 1 - 2 yrs 2 - 5 yrs 5 yrs -
Unspecified maturity Total
Cash and balances with central banks 7,149 - - - - - - 7,149
Bonds and other interest-bearing securities 95,964 - - - - - - 95,964
Loans to credit institutions 739 980 0 - - - - 1,719
Loans to the public 68,604 147,319 103,986 87,053 151,057 606,758 - 1,164,777
Total assets 172,456 148,299 103,986 87,053 151,057 606,758 - 1,269,609
Due to credit institutions 4,226 477 165 5,645 - 5,353 16,574 32,440
Deposits and borrowing from the public 9,284 13,325 7,395 1,344 2,526 7,561 402,598 444,033
Issued securities 115 44,172 83,225 91,703 221,377 18,672 - 459,264
Subordinated liabilities - - - 2,344 7,964 - - 10,308
Other, including derivatives 39,004 96,830 1,633 23,904 62,729 24,077 75,409 323,586
Total liabilities 52,629 154,804 92,418 124,940 294,596 55,663 494,581 1,269,631
Maturities for assets and liabilities in SEK
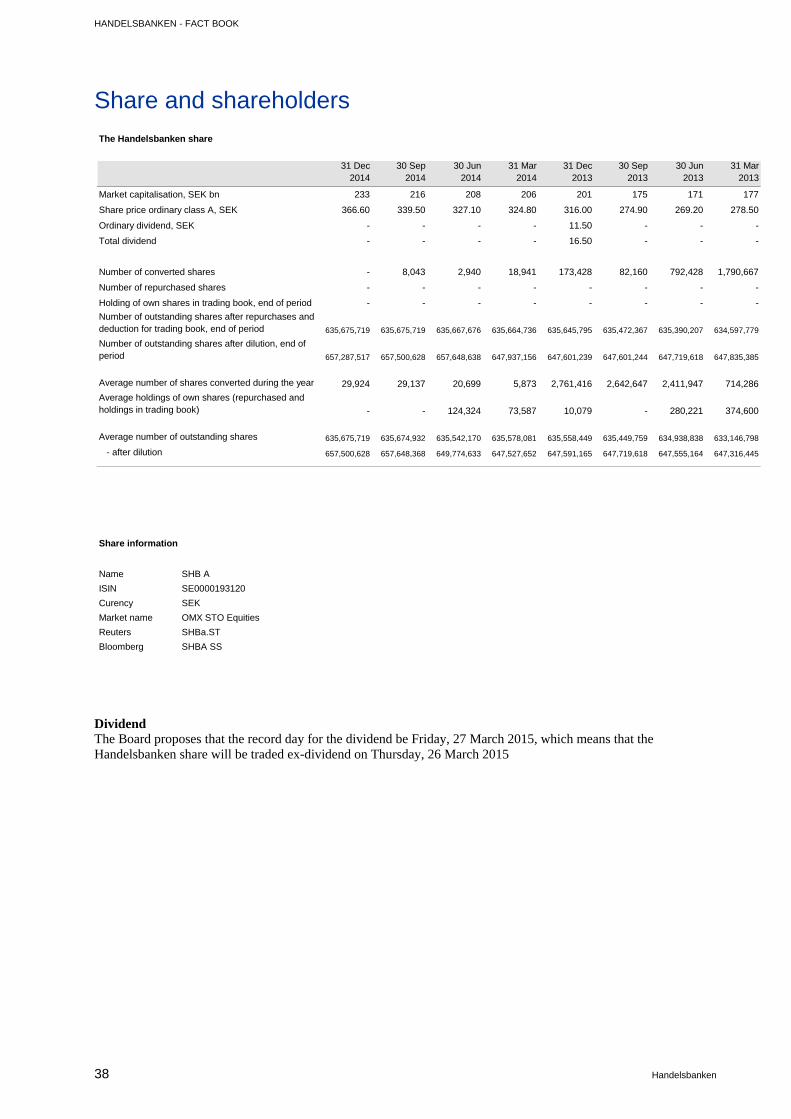
HANDELSBANKEN - FACT BOOK
38 Handelsbanken
Share and shareholders
Dividend The Board proposes that the record day for the dividend be Friday, 27 March 2015, which means that the Handelsbanken share will be traded ex-dividend on Thursday, 26 March 2015
The Handelsbanken share
31 Dec 2014
30 Sep 2014
30 Jun 2014
31 Mar 2014
31 Dec 2013
30 Sep 2013
30 Jun 2013
31 Mar 2013
Market capitalisation, SEK bn 233 216 208 206 201 175 171 177
Share price ordinary class A, SEK 366.60 339.50 327.10 324.80 316.00 274.90 269.20 278.50
Ordinary dividend, SEK - - - - 11.50 - - -
Total dividend - - - - 16.50 - - -
Number of converted shares - 8,043 2,940 18,941 173,428 82,160 792,428 1,790,667
Number of repurchased shares - - - - - - - -
Holding of own shares in trading book, end of period - - - - - - - -
Number of outstanding shares after repurchases and deduction for trading book, end of period 635,675,719 635,675,719 635,667,676 635,664,736 635,645,795 635,472,367 635,390,207 634,597,779
Number of outstanding shares after dilution, end of period 657,287,517 657,500,628 657,648,638 647,937,156 647,601,239 647,601,244 647,719,618 647,835,385
Average number of shares converted during the year 29,924 29,137 20,699 5,873 2,761,416 2,642,647 2,411,947 714,286
Average holdings of own shares (repurchased and holdings in trading book) - - 124,324 73,587 10,079 - 280,221 374,600
Average number of outstanding shares 635,675,719 635,674,932 635,542,170 635,578,081 635,558,449 635,449,759 634,938,838 633,146,798
- after dilution 657,500,628 657,648,368 649,774,633 647,527,652 647,591,165 647,719,618 647,555,164 647,316,445
Share information
Name SHB A
ISIN SE0000193120
Curency SEK
Market name OMX STO Equities
Reuters SHBa.ST
Bloomberg SHBA SS
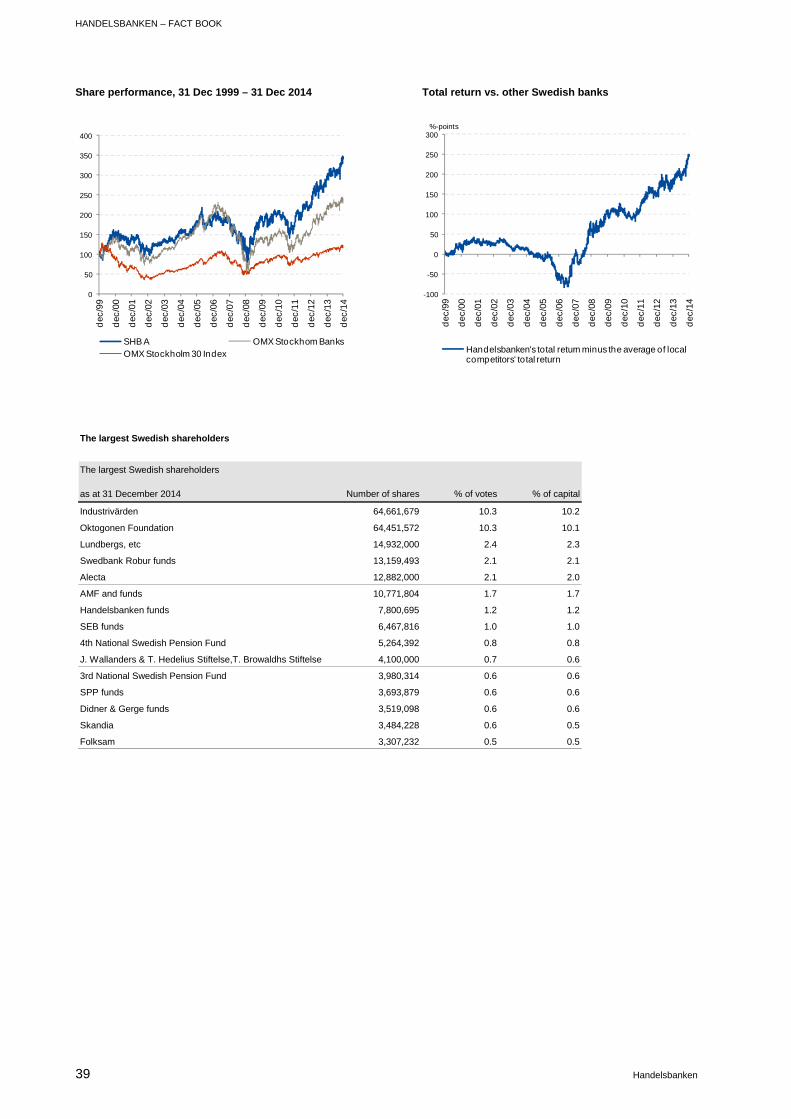
HANDELSBANKEN – FACT BOOK
39 Handelsbanken
Share performance, 31 Dec 1999 – 31 Dec 2014 Total return vs. other Swedish banks
0
50
100
150
200
250
300
350
400
dec
/99
dec
/00
dec
/01
dec
/02
dec
/03
dec
/04
dec
/05
dec
/06
dec
/07
dec
/08
dec
/09
dec
/10
dec
/11
dec
/12
dec
/13
dec
/14
SHB A OMX Stockhom BanksOMX Stockholm 30 Index
-100
-50
0
50
100
150
200
250
300
dec
/99
dec
/00
dec
/01
dec
/02
dec
/03
dec
/04
dec
/05
dec
/06
dec
/07
dec
/08
dec
/09
dec
/10
dec
/11
dec
/12
dec
/13
dec
/14
Handelsbanken's total return minus the average of local competitors' total return
%-points
The largest Swedish shareholders
The largest Swedish shareholders
as at 31 December 2014 Number of shares % of votes % of capital
Industrivärden 64,661,679 10.3 10.2
Oktogonen Foundation 64,451,572 10.3 10.1
Lundbergs, etc 14,932,000 2.4 2.3
Swedbank Robur funds 13,159,493 2.1 2.1
Alecta 12,882,000 2.1 2.0
AMF and funds 10,771,804 1.7 1.7
Handelsbanken funds 7,800,695 1.2 1.2
SEB funds 6,467,816 1.0 1.0
4th National Swedish Pension Fund 5,264,392 0.8 0.8
J. Wallanders & T. Hedelius Stiftelse,T. Browaldhs Stiftelse 4,100,000 0.7 0.6
3rd National Swedish Pension Fund 3,980,314 0.6 0.6
SPP funds 3,693,879 0.6 0.6
Didner & Gerge funds 3,519,098 0.6 0.6
Skandia 3,484,228 0.6 0.5
Folksam 3,307,232 0.5 0.5
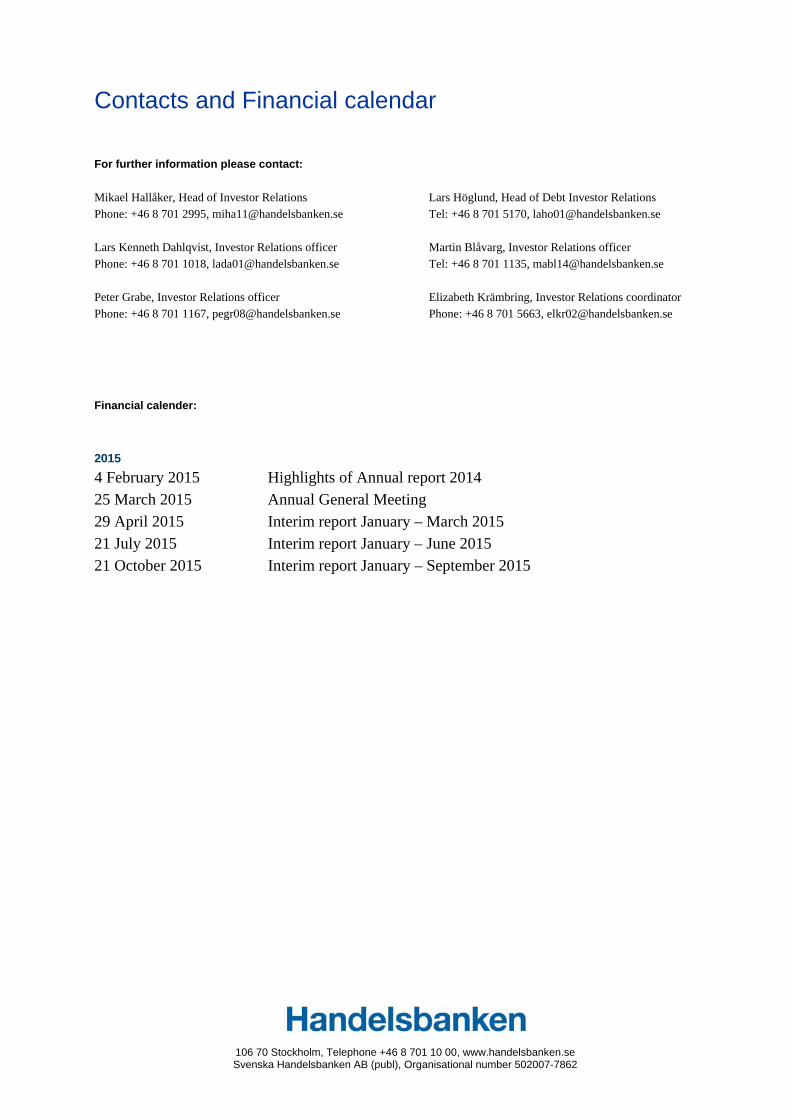
106 70 Stockholm, Telephone +46 8 701 10 00, www.handelsbanken.se Svenska Handelsbanken AB (publ), Organisational number 502007-7862
Contacts and Financial calendar
For further information please contact:
Mikael Hallåker, Head of Investor Relations
Phone: +46 8 701 2995, [email protected]
Lars Kenneth Dahlqvist, Investor Relations officer
Phone: +46 8 701 1018, [email protected]
Peter Grabe, Investor Relations officer
Phone: +46 8 701 1167, [email protected]
Lars Höglund, Head of Debt Investor Relations
Tel: +46 8 701 5170, [email protected]
Martin Blåvarg, Investor Relations officer
Tel: +46 8 701 1135, [email protected]
Elizabeth Krämbring, Investor Relations coordinator
Phone: +46 8 701 5663, [email protected]
Financial calender:
2015
4 February 2015 Highlights of Annual report 2014 25 March 2015 Annual General Meeting 29 April 2015 Interim report January – March 2015 21 July 2015 Interim report January – June 2015 21 October 2015 Interim report January – September 2015