Fact Book 2002 · in the P∏ock refinery Throughput and production yields in the Trzebinia...
27
Fact Book 2002
Transcript of Fact Book 2002 · in the P∏ock refinery Throughput and production yields in the Trzebinia...

Fact Book 2002

2000-2002 figures
Fact Book 2002

Contents
2
Throughput and production yieldsin the P∏ock refinery
Throughput and production yieldsin the Trzebinia refinery
Throughput and production yieldsin the Jedlicze refinery
Petrol stations in Poland
Refining in Poland
Market environment
Excise taxes and importduties in Poland
Quality standards
Market quotations
Differential Ural /Brent
Crude oil price – av. in quarter
Refinery margin
Macroeconomic data
Conversion table
Contacts
Legal disclaimer
Financial Calendar
26.
29.
31.
33.
34.
36.
37.
38.
39.
40.
40.
41.
42.
44.
46.
46.
47.
SWOT analysis
Financial highlightsin accordance with IFRS
Ratios
Summary of operating data
Shareholders as at 31.12.2002
Structure of PKN ORLEN Groupas at 31.12.2002
Financial data 2000-2002
Balance sheet
Income statement
Cash flow
CAPEX
Operating data 2000-2002
Fuel sales revenuesand other refinery products
Fuel sales volumes
Petrochemical product sales revenues
Petrochemical sales by volumePKN ORLEN Group companies
Technical specification of the P∏ock refinery
4.
6.
7.
8.
11.
12.
14.
15.
16.
17.
18.
19.
20.
21.
22.
23.
24.

Who we are
PKN ORLEN is one of the largest companiesin Central & Eastern Europe, with listingson the Warsaw and London Stock Exchanges.PKN ORLEN’s depositary receipts are also tradedon the OTC market in the USA.PKN ORLEN is Poland’s largest refiner and marketerof world-class petroleum and related products.It owns and operates a substantial wholesaleand retail distribution system which includesthe network of service stations in Polandand in Germany.
3

SWOT analysis
4
Strengths
• dominant position in the domestic
markets for refinery products and
petrochemicals
• association of the ORLEN brand name
with high quality products and services
• integrated, modern refining and
petrochemical complex, deriving full
benefits from economies of scale
• location advantage, ensuring
a competitive purchase price
for crude oil
• close location to crude oil and product
pipelines giving competitive logistical
advantages
• the biggest retail network in Poland,
and now also active in northern
Germany
• access to the world market
for petrochemical products through
Basell Orlen Polyolefins Sp. z o.o.
• low balance sheet gearing
in comparison to industry peers
Weaknesses
• lack of upstream operations
• complex capital group structure
• domestic character of company, and
still low volume of international activities
• high employment rate in some
organisational segments
5
Threats
• increase in grey market activity causes
decrease in legal sales
• increasing competition in the retail
market
• overcapacity of production units
in the region
• unstable sales of fuels in Poland
and unsatisfactory GDP growth
• restrictive fiscal policy which has
a negative influence on demand for
PKN ORLEN’s products
• unfavourable legal regulations
in the areas of obligatory reserves
and excise tax
Opportunities
• high potential of petrochemical market
which has a relatively low consuption
rate per capita in relation to EU
countries (polyolefin products
in particular)
• entry to the European retail fuel market
(acquisition of 494 petrol stations
in Germany)
• higher volume of the margin because
of fuel sales in Germany
• further cost optimisation and
development of the retail segment
• leading position in the consolidation
of R&M companies in Central Europe
• implementation of cost cutting
programme and EVA
• increase in product quality standards,
due to stricter ecological regulations,
favours companies with high
technology assets

Total assets
Shareholders’ equity
Net debt1
Revenues
EBITDA
EBITDA margin
EBIT
EBIT margin
Corporate tax
Net profit
Net cash provided by operating activities
CAPEX2
Number of employees in PKN ORLEN Group
Financial highlights2000 - 2002in accordance with IFRS
2001 2002
PLN million
14 087
7 596
2 542
18 602
2 335
12.6%
1 425
7.7%
-362
902
1 073
1 459
13 342
15 073
8 329
2 341
16 902
1 861
11.0%
731
4.3%
-285
421
1 292
967
17 818
14 383
7 958
2 549
17 038
1 706
10.0%
617
3.6%
-153
376
2 112
1 533
17 5823
PLN million PLN million
2000
1 Net debt = short and long-term interest-bearing debt – (cash and cash equivalents)2 Purchase of tangible and intangible assets3 Full consolidation of ZA Anwil SA from 2Q20016
Ratios
1 Planned2 Gearing = net debt / shareholders’ equity3 ROACE = EBIT (after actual tax rate) / average (shareholders’ equity + net debt)
EPS
EBIT per share
EBITDA per share
CF per share
Dividend per share
Total assets per share
Book value per share
Gearing2
ROACE3
2001 2002
PLN
2.15
3.39
5.56
2.55
0.05
33.53
18.08
33.5%
10.7%
1.00
1.74
4.43
3.07
0.091
35.87
19.82
28.1%
5.0%
0.89
1.47
4.06
5.03
0.12
34.23
18.94
32.0%
4.3%
PLN PLN
2000
7

Summaryof operating data
2001 2002
thousandtonnes
2000
1 P∏ock, Trzebinia and Jedlicze
The table below is a summaryof operating data with respectto the PKN ORLEN Group’s refining,marketing and petrochemicaloperations.
8
thousandtonnes
thousandtonnes
Refining and Petrochemicals – Total1
P∏ock refinery
Annual nameplate crude distillation capacity
Throughput of crude oil
Throughput of other feedstocks
Capacity utilisation
Production of refined products
Production of petrochemicals
Trzebinia refinery
Annual nameplate crude distillation capacity
Throughput of crude oil
Throughput of other feedstocks
Capacity utilisation
13 064
13 500
12 537
967
92.9%
10 327
983
400
400
330
100.0%
13 041
13 500
12 474
944
92.4%
9 761
1 165
500
437
126
87.4%
12 881
13 500
12 319
859
91.3%
9 995
899
500
446
182
89.2%
Summaryof operating data
Annual nameplate crude distillation capacity
Throughput of crude oil
Throughput of other feedstocks
Capacity utilisation
2001 2002
140
127
318
90.7%
135
130
140
95.9%
135
116
391
85.9%
2000
Jedlicze refinery
Sales volumes – gasoline
Retail
Wholesale
Sales volumes – diesel
Retail
Wholesale
2001 2002
1 343
1 879
783
2 467
1 259
1 863
843
2 285
1 274
1 857
753
2 270
2000
9
thousandtonnes
thousandtonnes
thousandtonnes
thousandtonnes
thousandtonnes
thousandtonnesPKN ORLEN Group

Number of retail stations1
PKN ORLEN Group owned, dealer operated2
Dealer owned and operated (franchised)
Employees1
PKN ORLEN Group employees
Parent company employees
Summaryof operating data
2001 2002
1 446
631
13 342
7 646
1 324
620
17 818
7 298
1 409
632
17 5823
7 333
2000
1 At the end of the period2 In this context, ”PKN ORLEN Group” means the company and its
consolidated subsidiaries but does not include associate companies3 Full consolidation of ZA Anwil SA from 2Q2001
2002
Groupcompanies
PKN ORLENPKN ORLEN
GroupEmployees by business segment
10
Wholesale and refining
Retail
Petrochemicals
Others
Total
2 062
1 137
1 199
2 900
7 298
4 440
1 178
2 762
9 438
17 818
2 378
41
1 563
6 538
10 520
Shareholdersas at 31.12.2002
1 According to current report no 56/2002 released on 20 June 2002, Kulczyk Holding SAand its affiliates are in possession of 23,911,206 bearer shares of PKN ORLEN (5.691%).
Numberof shares
11
% of issuedshares
Nafta Polska SA
Polish State Treasury
The Bank of New York as DR depositary
Others1
Total
Free float
74 076 299
43 633 897
56 932 910
245 534 031
420 177 137
302 466 941
17.63%
10.38%
13.55%
58.44%
100.00%
71.99%

Core business companies
Maintenance and support Transport companies
Gas companies
ORLEN KolTrans99.9%
ORLEN Transport Szczecin99.6%
ORLEN Transport Lublin98.5%
ORLEN Transport Kraków98.2%
ORLEN Transport P∏ock97.6%
ORLEN Transport Nowa Sól96.7%
ORLEN Transport Poznaƒ96.4%
ORLEN Transport S∏upsk96.2%
ORLEN Transport Warszawa94.5%
ORLEN Transport Olsztyn92.3%
ORLEN TransportK´dzierzyn-Koêle
88.8%
ORLEN WodKan82.3%
ORLEN Mechanika68.2%
ORLEN Automatyka52.4%
ORLEN Remont51.2%
ORLEN Eltech51.0%
ORLEN EnergoRem51.0%
ORLEN Wir51.0%
Sector companiesFuel companies
EinhundertzweiunddreissigsteVermoegensverwaltungs-
gesellschaft mbh100%
EinhundertdreiunddreissigsteVermoegensverwaltungs-
gesellschaft mbh100%
ORLEN PetroCentrum100%
ORLEN PetroTank90.0%
ORLEN PetroProfit85.0%
SHIP - SERVICE SA60.9%
ORLEN PetroZachód51.8%
Petromor51.3%
Petrolot51.0%
ORLEN Morena50.5%
ORLEN Gaz100.0%
ORLEN Petrogaz N. Brzeênica(in liquidation)
52.0%
Poliolefiny Polska1
100%
RafineriaTrzebinia SA
77.1%
Zak∏ady AzotoweAnwil SA76.3%
Rafineria NaftyJedlicze SA
75.0%
IKS SOLINO SA70.5%
Naftoport48.7%
Chemiepetrol20.0%
ORLEN OIL2
9.0%
1 Poliolefiny Polska is soon to be registered under its new nameof Basell Orlen Polyolefins Sp. z o.o.
2 ORLEN OIL Group – 92.3% (PKN ORLEN’s direct and indirect holding)
Structureof PKN ORLEN Groupas at 31.12.2002
Non-core business companies
Service companies Others Equity investments
ORLEN Powiernik100%
NOM35.0%
Polkomtel SA19.6%
Telewizja Familijna SA12.0%
Serwis Kraków83.2%
Serwis K´dzierzyn-Koêle80.0%
Serwis Szczecin78.1%
Serwis Zachód74.3%
Serwis Katowice55.0%
Serwis Poznaƒ51.0%
CPN Serwis Kielce100%
Serwis Gdaƒsk100%
ZUD99.9%
Serwis S∏upsk99.8%
Serwis Nowa WieÊ Wielka99.3%
Serwis ¸odê97.3%
Serwis Rzeszów97.3%
Serwis Podlasie89.7%
Serwis Mazowsze88.5%
Serwis Wroc∏aw83.3%
42 Companies
BHT Dromech SA(in liquidation)
81.2%
CPN Marine Service70.0%
Centrum Edukacji69.4%
ORLEN Projekt SA51.0%
Flexpol40.0%
Motell35.0%
ORLEN Budonaft100%
ZW Mazowsze100%
SAMRELAKS Màchocice100%
ORLEN Medica100%
ORLEN Ochrona100%
WIS¸A P∏ock SSA100%
ORLEN Polimer100%
ZAWITAJ ÂwinoujÊcie100%
DW Mazowsze98.7%
Petromot97.6%
Zak∏ad Budowy Aparatury SA96.6%
Petrotel88.8%
Other companies<20%

Financial data 2000-2002(IFRS basis) year ending 31 December
Balance sheet2001 2002
PLN millionPLN million PLN million
2000
15
Total non-current assets
Total current assets, of which
Inventories
Trade and other receivables
Cash and cash equivalents
Total assets
Shareholders’ equity
Minority interests
Non-current liabilities, of which
Interest bearing borrowings
Current liabilities, of which
Interest bearing borrowings
Total liabilities and shareholders’ equity
9 125
4 962
2 705
2 013
190
14 087
7 596
170
2 232
1 236
4 089
1 496
14 087
9 814
5 259
2 868
2 112
222
15 073
8 329
412
1 409
402
4 923
2 161
15 073
9 951
4 432
2 199
1 951
214
14 383
7 958
395
2 227
1 261
3 803
1 502
14 383

Incomestatement
2001 2002
PLN millionPLN million PLN million
2000
16
Revenue
Cost of sales
Gross profit
Distribution costs
Administrative expenses
Other operating expenses/revenues
Profit from operations
Financial income
Financial expenses
Income from investments accountedfor using equity method
Profit before income tax and minority interests
Income tax
Minority interests
Net profit
18 602
-15 042
3 560
-1 458
-619
-58
1 425
255
-441
48
1 287
-362
-23
902
16 902
-13 455
3 447
-1 787
-891
-38
731
211
-220
13
735
-285
-29
421
17 038
-14 166
2 872
-1 504
-829
78
617
264
-362
25
544
-153
-15
376
Cash flow2001 2002
PLN millionPLN million PLN million
2000
17
Cash flow from operations
Funds generated from operations
Net profit
Amortisation and depreciation
Interest and dividends, net
Others
Change in some position in working capital
Increase / (decrease) in receivables
Increase / (decrease) in inventories
Increase / (decrease) in accrued expenses and payables
Increase / (decrease) in provisions
Net cash flows used in investing activities
Net cash flows used in financing activities
Net increase / (decrease) in cash and cash equivalents
1 073
1 993
902
910
203
-22
-920
-520
-663
264
-1
-1 606
532
-1
1 292
1 720
421
1 130
128
41
-428
-171
-668
382
29
-908
-409
-25
2 112
1 739
376
1 089
209
65
373
209
651
-366
-121
-1 750
-335
27

CAPEX
PLN million
production and wholesale retail petrochemicals others
18
0
100
200
300
400
500
600
700
800
900
10001000
1100
1200
1300
1400
1500
2001 2002
803
421
152
294
175
133
183
211
Operating data 2000-2002

The table sets outthe PKN ORLEN Group’s salesrevenues calculated accordingto IFRS by fuel type and thepercentage contributionof each fuel type.
Fuel salesrevenues and otherrefinery products
% of totalproduct
salesPLN million
2001 2002
% of totalproduct
salesPLN million
20
Light product revenues1
Other refinery products revenues1
1 In accordance with IFRS
Gasoline
Diesel oil
Light heating oil
JET A-1 aviation fuel
Total light products
29.7
24.9
14.0
2.6
71.2
2.9
2.9
1.9
0.7
0.8
0.9
3.7
13.9
4 576
3 833
2 156
403
10 968
446
452
292
110
129
137
575
2 141
29.3
24.1
10.9
1.7
66.0
2.5
3.6
2.2
0.6
0.7
0.7
4.7
15.0
4 401
3 614
1 642
253
9 910
372
539
323
83
109
107
712
2 245
LPG
Heavy heating oil
Bitumen
Base oils
Motor oils
Industrial oils
Others
Total other refinery products
Fuel salesvolumes
% of totalsales
2001 2002
% of totalsales
21
thousandtonnes
thousandtonnesLight product volumes
Other refinery products volumes
The table sets out the fueland other refinery product salesvolumen of the PKN ORLEN Groupand the percentage contributionof each product.
Gasoline
Diesel oil
Light heating oil
JET A-1 aviation fuel
Total light products
24.7
23.9
16.1
2.5
67.2
2.9
8.2
3.7
0.7
0.3
0.4
4.3
20.4
3 131
3 023
2 039
322
8 515
366
1 038
471
84
35
47
543
2 584
24.3
24.4
12.3
2.1
63.1
2.4
8.1
4.3
0.6
0.2
0.3
5.2
21.1
3 122
3 128
1 585
268
8 103
302
1 044
551
73
29
33
673
2 705
LPG
Heavy heating oil
Bitumen
Base oils
Motor oils
Industrial oils
Others
Total other refinery products

The table sets outthe PKN ORLEN Group’s salesrevenues by principal petrochemicalproduct and the percentagecontribution to total sales revenuesof each.
Petrochemicalproductsales revenues
% of totalproduct
salesPLN million
2001 2002
% of totalproduct
salesPLN million
22Total sales revenues for PKN ORLEN Group were PLN m 17 038 in 2001 and PLN m 16 902 in 2002.1 Nitro-chalk with magnesium additive
1.5
2.5
2.0
1.0
1.0
0.7
0.7
0.6
0.6
0.3
0.3
0.5
3.2
15.0
100.0
238
379
307
154
153
103
107
99
98
48
47
76
496
2 305
15 414
3.2
2.7
2.3
1.2
1.2
0.9
0.8
0.8
0.6
0.4
0.3
0.1
4.5
19.0
100.0
476
410
349
179
178
132
123
118
92
60
50
17
670
2 854
15 009
PVC
Polyethylene
Polypropylene
Ammonium nitrate
Glycols
PVC granules
Propylene
CANWIL1
Phenol
Butadiene
Acetone
Ethylene
Others
Total petrochemical sales
Total sales products revenues
The table sets outthe principal petrochemicalproduct sales volumesof the PKN ORLEN Group and itsconsolidated subsidiariesand the percentage contributionof each product.
Petrochemical salesby volumePKN ORLEN Group
% of totalsales
2001 2002
% of totalsales
23
thousandtonnes
thousandtonnes
1 Nitro-chalk with magnesium additive
PVC
Polyethylene
Polypropylene
Ammonium nitrate
Glycols
PVC granules
Propylene
CANWIL1
Phenol
Butadiene
Acetone
Ethylene
Others
Total petrochemical sales
Total refinery and petrochemical products
1.0
1.1
0.9
2.6
0.7
0.3
0.5
1.8
0.4
0.3
0.2
0.3
2.3
12.4
100.0
120
137
120
328
90
37
68
228
51
36
31
32
286
1 566
12 665
1.6
1.2
1.1
3.0
0.9
0.4
0.6
2.2
0.4
0.4
0.2
0.1
3.6
15.8
100.0
205
159
141
389
115
47
82
283
50
51
31
10
465
2 028
12 836

Atmospheric and vacuum distillation units
Semi-regenerative reformers
CCR reformers
Jet kerosene hydrotreater
Gas oil hydrotreaters
FCC I, II
Alkylation unit
Furfural extraction
Lubricants dewaxing
Lube hydrofinisher
Bitumen
Hydrocracker
Isomerisation C5 – C6
Vacuum residue hydrotreater
LPG desulphurisation
Technical specificationof the P∏ock refinery
2001 2002
13 500
1 230
1 600
160
4 260
2 300
150
400
266
130
600
2 600
600
1 800
260
13 500
1 260
1 606
160
4 260
2 300
150
400
215
130
740
2 600
600
1 800
508
13 500
1 260
1 606
160
4 260
2 300
150
400
215
130
740
2 600
600
1 800
508
2000
The table sets out the nominalcapacity of the main unitsat the P∏ock refinery in the yearsending 31 December 2000,2001, 2002.
24
thousandtonnes
thousandtonnes
thousandtonnes
Technical specificationof the P∏ock refinery
Claus sulphur recovery (t H2S/h)
MTBE
Aromatic petrochemicals
Paraxylene
Olefins
Polyethylene
Polypropylene
Ethylene oxide
Glycol
Phenol
Acetone
Butadiene
Benzene (pyrotol)
Pyrolitic gasoline hydrogenation
2001 2002
35
100
480
32
360
155
110
100
105
45
29
55
115
288
39
120
480
32
360
150
116
105
106
45
29
55
115
270
39
120
480
32
360
150
116
105
106
45
29
55
115
270
2000
25
thousandtonnes
thousandtonnes
thousandtonnes

Throughput andproduction yieldsin the P∏ock refinery
The table below sets out the P∏ockrefinery’s throughput and productionyields and approximate capacityutilisation.
2002
Throughput %
20012000
%%
Production yield – Fuels
26
thousandtonnes
thousandtonnes
thousandtonnes
Crude oil
Other feedstocks, of which
Natural gas
Total
93.0
7.0
2.7
100.0
27.3
27.6
15.6
2.4
1.9
74.8
12 474
944
363
13 418
2 979
3 020
1 705
263
208
8 175
93.5
6.5
2.8
100.0
29.1
25.3
18.1
2.6
2.0
77.2
12 319
859
368
13 178
3 176
2 759
1 974
283
217
8 409
92.8
7.2
2.8
100.0
28.3
27.8
13.5
2.3
2.2
74.2
12 537
967
384
13 504
3 206
3 147
1 526
263
253
8 395
Gasoline
Diesel oil
Light heating oil
JET A-1 aviation fuel
LPG
Total fuels
Throughput andproduction yieldsin the P∏ock refinery
2002Production yield– Other products %
20012000
%%
27
thousandtonnes
thousandtonnes
thousandtonnes
Heavy heating oil
Bitumen
Base oils
Others
Total non-fuelrefinery products
8.7
4.5
1.1
0.2
14.5
950
487
122
27
1 586
8.6
3.9
1.2
0.9
14.6
939
425
126
97
1 587
10.4
4.5
1.4
0.8
17.1
1 180
508
159
85
1 931

Throughput andproduction yieldsin the P∏ock refinery
2002
Petrochemicals %
20012000
%%
28
thousandtonnes
thousandtonnes
thousandtonnes
Aromatics
Polyethylene
Polypropylene
Ethylene
Glycols
Propylene
Others
Total petrochemicals
Total production yield
Changes in stocks
Refinery fuel
Utilisation
1.8
1.4
1.3
1.1
1.1
0.7
3.2
10.7
100.0
92.4
197
158
143
116
116
82
354
1 165
10 926
91
2 073
1.0
1.3
1.1
0.8
0.8
0.6
2.5
8.3
100.0
91.2
112
138
122
92
91
70
273
899
10 895
-5
2 030
1.0
1.1
1.1
1.3
1.0
0.8
2.4
8.7
100.0
92.9
116
129
124
143
111
88
272
983
11 309
28
1 910
The table below sets out the Trzebiniarefinery’s throughput and productionyields and approximate utilisationpercentages.
Throughput andproduction yieldsin the Trzebinia refinery
2002
Throughput %
20012000
%%
Production yields – Fuels
29
thousandtonnes
thousandtonnes
thousandtonnes
Crude oil
Other feedstocks
Total throughput
77.6
22.4
100.0
–
5.9
–
5.9
437
126
563
–
33
–
33
71.0
29.0
100.0
0.5
17.8
8.7
27.0
446
182
628
3
111
54
168
54.8
45.2
100.0
4.4
31.8
11.4
47.6
400
330
730
32
232
83
347
Gasoline
Diesel oil
Light heating oil
Total fuels
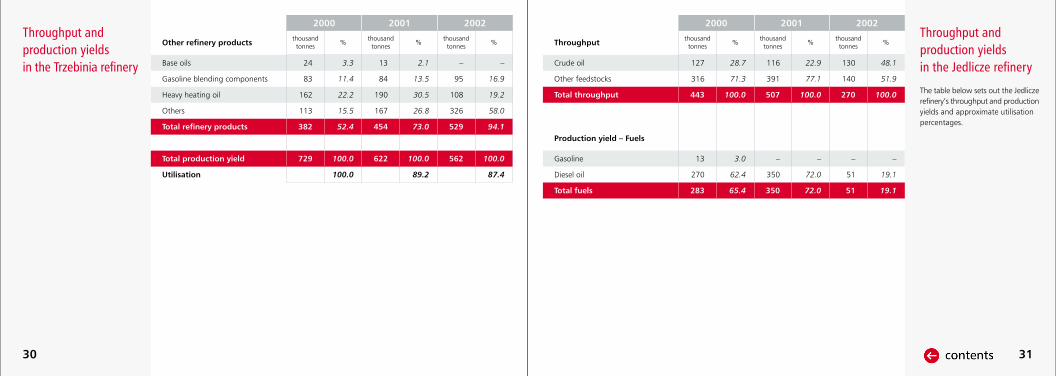
Throughput andproduction yieldsin the Trzebinia refinery
2002
Other refinery products %
20012000
%%
30
thousandtonnes
thousandtonnes
thousandtonnes
Base oils
Gasoline blending components
Heavy heating oil
Others
Total refinery products
Total production yield
Utilisation
–
16.9
19.2
58.0
94.1
100.0
87.4
–
95
108
326
529
562
2.1
13.5
30.5
26.8
73.0
100.0
89.2
13
84
190
167
454
622
3.3
11.4
22.2
15.5
52.4
100.0
100.0
24
83
162
113
382
729
The table below sets out the Jedliczerefinery’s throughput and productionyields and approximate utilisationpercentages.
Throughput andproduction yieldsin the Jedlicze refinery
2002
Throughput %
20012000
%%
Production yield – Fuels
31
thousandtonnes
thousandtonnes
thousandtonnes
Crude oil
Other feedstocks
Total throughput
48.1
51.9
100.0
–
19.1
19.1
130
140
270
–
51
51
22.9
77.1
100.0
–
72.0
72.0
116
391
507
–
350
350
28.7
71.3
100.0
3.0
62.4
65.4
127
316
443
13
270
283
Gasoline
Diesel oil
Total fuels

Throughput andproduction yieldsin the Jedlicze refinery
2002
Other refinery products %
20012000
%%
32
thousandtonnes
thousandtonnes
thousandtonnes
Base oils
Heavy heating oil
Others
Total refinery products
Total production yield
Utilisation
12.9
38.5
29.4
80.9
100.0
95.9
34
102
78
214
265
10.3
14.6
3.1
28.0
100.0
85.9
50
71
15
136
486
13.4
18.0
3.2
34.6
100.0
90.7
58
78
14
150
433
The table sets outthe development of the retailstation network of PKN ORLENand its consolidated subsidiariesand those of other marketparticipants as at the endof the year.
Retail stationsin Poland
1 EstimateSource: Nafta Polska SA, PKN ORLEN, Polska Izba Paliw (Polish Chamber of Fuels)
2001 20022000
33
PKN ORLEN Group, of which
PKN ORLEN – DODO
Gdaƒsk Refinery
Multinationals, of which
BP (+ARAL)
Statoil (+Preem)
Shell (+DEA)
Others1
Total
2 077
631
275
703
130
110
154
3 527
6 582
1 933
620
333
826
280
211
213
3 600
6 692
2 041
632
314
776
146
122
197
3 500
6 631

1 Assumes nameplate crude distillation as at the beginning of the yearSource: Nafta Polska SA, PKN ORLEN
Refiningin Poland 1
crude distillationcapacity
2000
Name of refinery
crudeprocessed
utilisation
thousand tonnes thousand tonnes %
34
The table below showsthe nameplate crude oildistillation capacityof Polish refineries.
P∏ock Refinery
Trzebinia Refinery
Jedlicze Refinery
Total PKN ORLEN Group
Gdaƒsk Refinery
Czechowice Refinery
Gorlice Refinery
Jas∏o Refinery
Total
12 537
400
127
13 064
4 245
648
131
95
18 183
13 500
400
140
14 040
4 500
680
170
150
19 540
92.9
100.0
90.7
93.0
94.3
95.3
77.1
63.3
93.1
2002
thousand tonnes thousand tonnes %
2001
thousand tonnes thousand tonnes %
35
crude distillationcapacity
crudeprocessed
utilisationcrude distillation
capacitycrude
processedutilisation
12 474
437
130
13 041
3 932
582
141
83
17 779
13 500
500
135
14 135
4 500
680
170
150
19 635
92.4
87.4
95.9
92.3
87.4
85.6
82.9
55.3
87.4
12 319
446
116
12 881
4 171
629
144
90
17 915
13 500
500
135
14 135
4 500
680
170
150
19 635
91.3
89.2
85.9
91.1
92.7
92.5
84.7
60.0
91.2

Market environmentExcise taxesand import dutiesin Poland
Gasoline
Diesel2
JET A-1aviation fuel
287
245
245
EUR/1000 lEUR/1000 lPLN/1000 lPLN/1000 lPLN/1000 lPLN/1000 lPLN/1000 l
1999 2000 2001 2002 2003 20031 EU min.
929
665
612
1 177
846
782
1 346
1 002
923
1 464
1 090
1 003
1 498
1 129
1 026
377
284
258
1 Exchange rate PLN/EUR as at 02.01.2003 – 3.97732 Sulphur content: 50-200 ppm3 Import tariffs were lifted in September 2000Source: Nafta Polska SA, europa.eu.int
Gasoline
Diesel
1996 1997 1998 1999 2000 2001 2002
15%
25%
13%
20%
10%
15%
5%
11%
3%
4%
–
–
–
–
37
Excise taxat the beginningof the year
Import duties3

1 10 ppm sulphur gasoline should be available in all regions2 Value of 21% concern unleaded fuel with 91 octane number(–) Verified data not available
Source: Nafta Polska SA, OECD, PKN ORLEN
Quality standards
Quality standards in Polandcompared to the EU and otherCentral European Countries(Czech Republic-CH, Hungary-H,Slovak Republic-SK and Ukraine-UA)and the EU in 2005.
Sulphur content
Aromatics content
Benzene content
Olefins content
PL
500-1000
–
–
–
50/101
35
1
18
150
42
1
18
2003
Gasoline standards
parameter
ppm, max.
% vol. max.
% vol. max.
% vol. max.
CH,H,SK UA EU EU
2003 2003 from 2000 from 2005
150
42
1
21/182
150
42
1
18
Sulphur content
Polyaromatic content
Cetane number
PL
2000
–
45
50/101
11
51
350
11
51
2003
Diesel standards
parameter
ppm, max.
% vol. max.
minimum
CH,H,SK UA EU EU
2003 2003 from 2000 from 2005
350
11
51
350
11
51
38
unit
unitMarketquotations
1 USD/barrel2 USD/t
PLN/USD – end of period
PLN/USD – period average
Brent crude – end of period1
Brent crude – period average1
Unleaded gasoline 952
Unleaded gasoline 982
Diesel2
JET A-1 aviation fuel2
Polyethylene2
Polypropylene2
Ethylene2
Propylene2
Differential Urals blend/Brent1
2001 2002
4.1432
4.3464
22.77
28.54
306.5
342.5
277.9
296.5
843.4
715.5
608
501
-1.427
3.8388
4.0795
30.40
25.04
249.6
285.1
222.8
233.2
810.2
778.0
486
429
-1.219
3.9863
4.0939
19.01
24.44
256.7
295.0
236.5
245.2
716.5
650.5
552
413
-1.333
2000
39

40
20
25
2000 2001 2002
I II III IV I II III IV I II III IV
I II III IV I II III IV I II III IV
2000 2001 2002
0.00
-0.50
-1.00
-1.50
-2.00
-2.50
-3.00
30
35
DifferentialUral /Brent
USD / barrel
Crude oilprice – av.in quarter
USD / barrel
41
2001 2002 2003
I II III IV II II III IV0
5
10
15
20
25
30
35
40
Refinerymargin
USD / tonne

20022001200019991998
4.8
158.5
4 098
6.4
11.8
10.4
2.9
8 541
22 803
3.9
1.3
9.4
4.1
155.2
4 014
4.8
7.3
13.1
2.6
8 541
22 749
3.2
1.2
8.7
4.0
157.6
4 078
2.8
10.1
15.1
3.3
7 853
20 862
3.0
2.1
7.8
1.1
177.7
4 560
-1.7
5.5
17.4
1.6
7 894
20 918
1.4
2.3
7.3
1.3
188.6
4 885
0.8
1.9
18.1
1.4
9 260
24 467
1.3
2.3
7.6
43
20022001200019991998
Macroeconomicdata
1 Change on preceding yearSource: GUS, NBP, Eurostat, OECD, ECB, estimates(GUS – The Polish Central Statistic Office, NBP – National Bank of Poland)
Poland
GDP growth
Nominal GDP (USD bn)
GDP per capita (USD)
Domestic demand1
Inflation (%)
Unemployment (as at end year)
EU-15
GDP growth
Nominal GDP (USD bn)
GDP per capita (USD)
Domestic demand1
Inflation (%)
Unemployment
19971996
6.0
143.9
3 727
9.7
19.9
13.2
1.6
8 776
23 549
1.4
2.4
10.2
6.8
144.0
3 725
9.2
14.9
10.3
2.5
8 220
21 995
2.3
1.7
10.0
42
19971996

Conversiontable
The Company maintainsand publishes statistical informationrelating to its business in metricunits (tonnes) rather thanunits (barrels). Metric unitamounts may be convertedinto barrel equivalents usingthe conversion factorsgiven below.
Crude oil and products
1 tonne of crude oil
1 barrel of crude oil per day
1 tonne of LPG
1 tonne of gasoline
1 tonne of jet fuel
1 tonne of diesel or heating oil
1 tonne of fuel oil
1 tonne of lubricants
1 tonne of bitumen
1 tonne of aromatics
1 tonne of refined petroleum products
7.4
50
11.6
8.4
7.9
7.4
6.4
7.1
6.2
7.2
7.9
barrels of crude oil (assuminga specific gravity of 34º AmericanPetroleum Institute – API)
metric tonnes of crude oil per year
barrels
barrels
barrels
barrels
barrels
barrels
barrels
barrels
barrels (av.)
=
=
=
=
=
=
=
=
=
=
=
Basic data
1 barrel
1 m3
0.1590
6.2898
cubic metre
barrels
=
=
44
1.84
1.34
1.26
1.18
1.02
1.13
0.99
1.14
1.26
m3
m3
m3
m3
m3
m3
m3
m3
m3
=
=
=
=
=
=
=
=
=
159.0
35.31
litres
cubic feet
=
=
45

Polski Koncern Naftowy ORLEN SA
ul. Chemików 7, 09-411 P∏ock, Poland
tel. +48 24/365 00 00
fax +48 24/365 40 40
www.orlen.pl
Warsaw Office
ul. Pankiewicza 4
00-950 Warszawa, Poland
tel. +48 22/695 35 50
fax +48 22/628 77 28
Investor Relations Department
tel. +48 24/365 33 90
fax +48 24/365 56 88
e-mail: [email protected]
Contacts
This document does not constitute an investment advertisement. It is not a recommendationand does not purport to give any advice whatsoever and should not be construed as such.No warranties or representations of any nature are given or made in any respect of the Companyto which the information in this document relates or its business or financial affairs.The recipient will need to make her/his own enquiries before taking any action (if any).
© Polski Koncern Naftowy ORLEN SA 2003
Press Office
tel. +48 22/695 34 25
fax +48 22/695 35 27
tel. +48 24/365 41 50, 365 59 29
fax +48 24/365 50 15, 365 59 49
e-mail: [email protected]
e-mail: [email protected]
ORLEN Deutschland GmbH
Ramskamp 71-75
25337 Elmshorn
tel. +49 41/21 47 11
fax +49 41/21 47 12 71
www.orlen-deutschland.de
Legaldisclaimer
46
FinancialCalendar
47
Quarterly consolidated results
2Q 2003
3Q 2003
Half-year 2003 results
Consolidated results of PKN ORLEN Group
13.08.2003
13.11.2003
25.09.2003

www.orlen.pl