
FACILITY ASSOCIATION RESIDUAL ARKET · 1.6 Ontario FARM Bodily Injury Case Reserve summary ... 2016...
118
Page 1 of 118 FACILITY ASSOCIATION RESIDUAL MARKET OCTOBER 2016 PARTICIPATION REPORT ACTUARIAL HIGHLIGHTS Related Bulletin: F16-096 FARM October 2016 Participation Report Related Operating Results: Summary of Operations – Calendar Year Results For your convenience, bookmarks have been added to this document. To view them, please click on the BOOKMARK tab at the left. Should you require any further information, please call Norm Seeney, Vice President, Finance & Member Services at (416) 644-4914.
Transcript of FACILITY ASSOCIATION RESIDUAL ARKET · 1.6 Ontario FARM Bodily Injury Case Reserve summary ... 2016...
Page 1 of 118
FACILITY ASSOCIATION RESIDUAL MARKET
OCTOBER 2016 PARTICIPATION REPORT
ACTUARIAL HIGHLIGHTS
Related Bulletin: F16-096 FARM October 2016 Participation Report
Related Operating Results: Summary of Operations – Calendar Year Results
For your convenience, bookmarks have been added to this document. To view them, please click on
the BOOKMARK tab at the left.
Should you require any further information, please call Norm Seeney, Vice President, Finance &
Member Services at (416) 644-4914.
Page 2 of 118
ACTUARIAL HIGHLIGHTS
RESIDUAL MARKET
PARTICIPATION REPORT
OCTOBER 2016
TABLE OF CONTENTS
1 Summary ........................................................................................................................................ 3
1.1 Valuation Schedule (Fiscal Year 2016) ................................................................................. 3
1.2 APV Adjustments in Policy Liabilities related to Claims Fees and Allowed Claims
Expenses ................................................................................................................................ 3 1.3 New Valuation ....................................................................................................................... 6
1.3.a Valuation Results ....................................................................................................................8 1.3.b Valuation Implementation ......................................................................................................9
1.4 Appointed Actuary and Hybrid Actuarial Services Model .................................................. 13
1.5 Consideration of Recent Legal Decisions Changes in Legislation / Regulation ................. 13 1.6 Ontario FARM Bodily Injury Case Reserve summary ........................................................ 15 1.7 Current Provision Summary ................................................................................................ 17
2 Activity During the Month of October 2016............................................................................. 18
2.1 Recorded Premium and Claims Activity ............................................................................. 18
2.1.a Actual vs. Projected (AvsP): Earned Premium ....................................................................19 2.1.b AvsP: Recorded Indemnity ..................................................................................................21 2.1.c AvsP: Paid Indemnity ..........................................................................................................22
2.2 Actuarial Provisions ............................................................................................................. 24
3 Ultimate Loss Ratio Matching Method ..................................................................................... 26
4 Calendar Year-to-Date Results .................................................................................................. 27
5 Current Participation Report – Additional Exhibits ............................................................... 27
6 EXHIBITS ................................................................................................................................... 28

Actuarial Highlights – Residual Market
Participation Report October 2016
Page 3 of 118
1 Summary
1.1 Valuation Schedule (Fiscal Year 2016)
The October 2016 Participation Report incorporates the results of an updated valuation (as at
September 30, 2016) – the impact of the implementation of the valuation is discussed in section 1.3.
The table immediately below summarizes the implemented valuations for fiscal year 2016.
FARM
FISCAL YEAR 2016 – SCHEDULE OF VALUATIONS
Valuation
Date
Discount
Rate
(per annum)
Participation
Report Description of Changes
Sep. 30, 2015
(completed)
0.87%
mfad: 25 bp
Oct. 2015 updated valuation (roll forward): all
jurisdictions; cash flow projections updated;
discount rate updated; no changes to selected
margins for adverse deviations (interest rate or
claims development).
Dec. 31, 2015
(completed)
0.81%
mfad: 25 bp
Mar. 2016 updated valuation: all jurisdictions; cash flow
projections updated; discount rate updated; no
changes to selected margins for adverse
deviations (interest rate or claims
development).
Mar. 31, 2016
(completed)
0.75%
mfad: 25 bp
May 2016 updated valuation (roll forward): all
jurisdictions; cash flow projections updated;
discount rate updated; no changes to selected
margins for adverse deviations (interest rate or
claims development).
Jun. 30, 2016
(completed)
0.69%
mfad: 25 bp
Aug. 2016 updated valuation: all jurisdictions; cash flow
projections updated; discount rate updated;
selected margins for adverse claims
development at coverage / half year level
updated; claims expense (“excess legal”)
assumptions updated
Sep. 30, 2016
(completed)
0.62%
mfad: 25 bp
Oct. 2016 update valuation (roll forward): all
jurisdictions; cash flow projections updated;
discount rate updated; no changes to selected
margins for adverse deviations (interest rate or
claims development).
Under the proposed schedule for fiscal year 2016, the “off-half” valuation quarters ending
March 31, 2016 and September 30, 2016 would not reflect a full valuation update of assumptions,
but would rather “roll-forward” key assumptions from the previous valuation. As well, all valuations
are proposed to include all jurisdictions and business segments (private passenger and non-private
passenger).
1.2 APV Adjustments in Policy Liabilities related to Claims Fees and Allowed Claims
Expenses
Accepted Actuarial Practice requires all policy liabilities recognize both the time value of money and
Actuarial Highlights – Residual Market
Participation Report October 2016
Page 4 of 118
provisions for adverse deviations. For member statement and financial statement reporting purposes,
we have historically applied actuarial present value adjustments only to the indemnity portion of the
policy liabilities, and explicitly NOT to provisions for certain specific reimbursed loss adjustment
expenses (“claims fees and allowed claims expenses”1 or “retro provisions”) as allowed under
IFRS 4, after having assessed and deemed actuarial present value adjustments related to the claims
fee and allowed claims expenses as being not material.
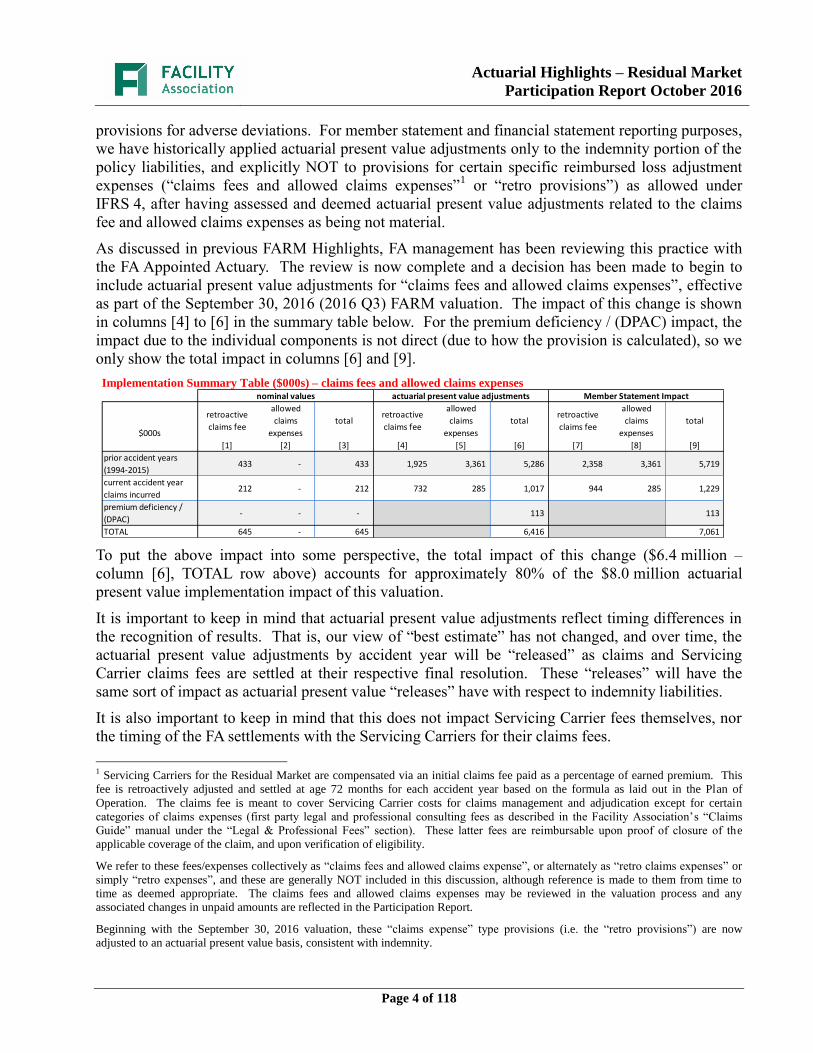
As discussed in previous FARM Highlights, FA management has been reviewing this practice with
the FA Appointed Actuary. The review is now complete and a decision has been made to begin to
include actuarial present value adjustments for “claims fees and allowed claims expenses”, effective
as part of the September 30, 2016 (2016 Q3) FARM valuation. The impact of this change is shown
in columns [4] to [6] in the summary table below. For the premium deficiency / (DPAC) impact, the
impact due to the individual components is not direct (due to how the provision is calculated), so we
only show the total impact in columns [6] and [9].
Implementation Summary Table ($000s) – claims fees and allowed claims expenses
To put the above impact into some perspective, the total impact of this change ($6.4 million –
column [6], TOTAL row above) accounts for approximately 80% of the $8.0 million actuarial
present value implementation impact of this valuation.
It is important to keep in mind that actuarial present value adjustments reflect timing differences in
the recognition of results. That is, our view of “best estimate” has not changed, and over time, the
actuarial present value adjustments by accident year will be “released” as claims and Servicing
Carrier claims fees are settled at their respective final resolution. These “releases” will have the
same sort of impact as actuarial present value “releases” have with respect to indemnity liabilities.
It is also important to keep in mind that this does not impact Servicing Carrier fees themselves, nor
the timing of the FA settlements with the Servicing Carriers for their claims fees.
1 Servicing Carriers for the Residual Market are compensated via an initial claims fee paid as a percentage of earned premium. This
fee is retroactively adjusted and settled at age 72 months for each accident year based on the formula as laid out in the Plan of
Operation. The claims fee is meant to cover Servicing Carrier costs for claims management and adjudication except for certain
categories of claims expenses (first party legal and professional consulting fees as described in the Facility Association’s “Claims
Guide” manual under the “Legal & Professional Fees” section). These latter fees are reimbursable upon proof of closure of the
applicable coverage of the claim, and upon verification of eligibility.
We refer to these fees/expenses collectively as “claims fees and allowed claims expense”, or alternately as “retro claims expenses” or
simply “retro expenses”, and these are generally NOT included in this discussion, although reference is made to them from time to
time as deemed appropriate. The claims fees and allowed claims expenses may be reviewed in the valuation process and any
associated changes in unpaid amounts are reflected in the Participation Report.
Beginning with the September 30, 2016 valuation, these “claims expense” type provisions (i.e. the “retro provisions”) are now
adjusted to an actuarial present value basis, consistent with indemnity.
nominal values actuarial present value adjustments Member Statement Impact
$000s
retroactive
claims fee
allowed
claims
expenses
totalretroactive
claims fee
allowed
claims
expenses
totalretroactive
claims fee
allowed
claims
expenses
total
[1] [2] [3] [4] [5] [6] [7] [8] [9]
prior accident years
(1994-2015)433 - 433 1,925 3,361 5,286 2,358 3,361 5,719
current accident year
claims incurred212 - 212 732 285 1,017 944 285 1,229
premium deficiency /
(DPAC)- - - 113 113
TOTAL 645 - 645 6,416 7,061
Actuarial Highlights – Residual Market
Participation Report October 2016
Page 5 of 118
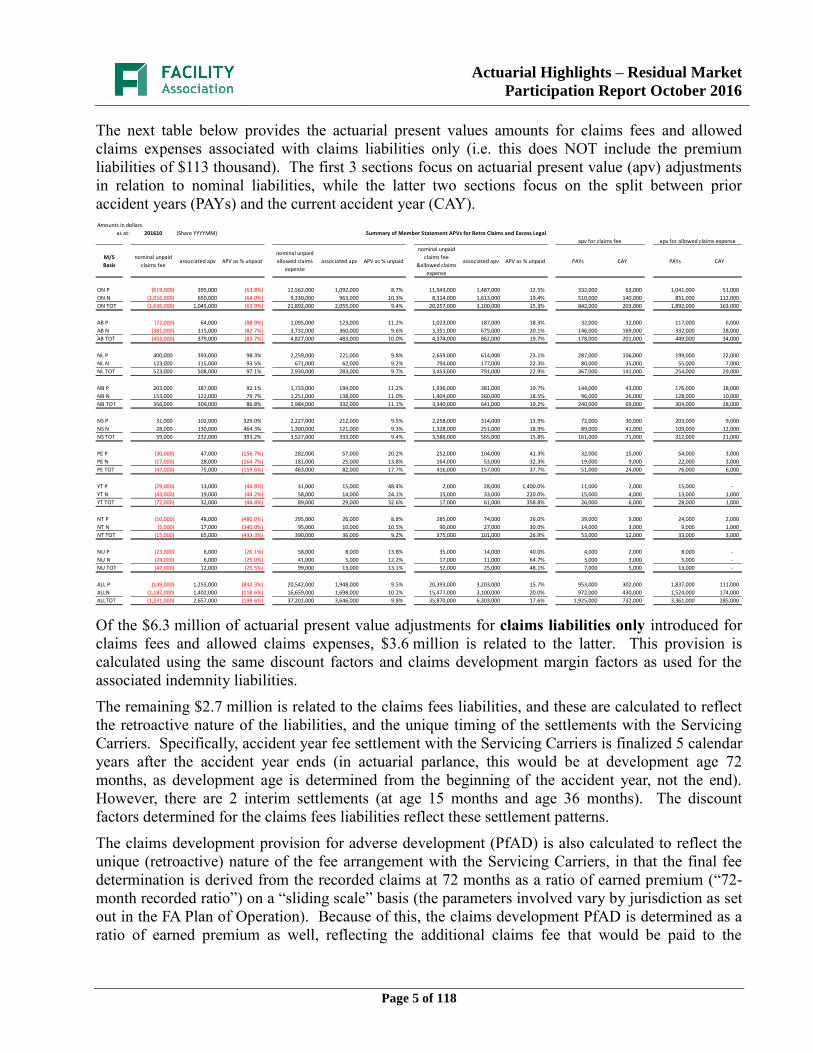
The next table below provides the actuarial present values amounts for claims fees and allowed
claims expenses associated with claims liabilities only (i.e. this does NOT include the premium
liabilities of $113 thousand). The first 3 sections focus on actuarial present value (apv) adjustments
in relation to nominal liabilities, while the latter two sections focus on the split between prior
accident years (PAYs) and the current accident year (CAY).
Of the $6.3 million of actuarial present value adjustments for claims liabilities only introduced for
claims fees and allowed claims expenses, $3.6 million is related to the latter. This provision is
calculated using the same discount factors and claims development margin factors as used for the
associated indemnity liabilities.
The remaining $2.7 million is related to the claims fees liabilities, and these are calculated to reflect
the retroactive nature of the liabilities, and the unique timing of the settlements with the Servicing
Carriers. Specifically, accident year fee settlement with the Servicing Carriers is finalized 5 calendar
years after the accident year ends (in actuarial parlance, this would be at development age 72
months, as development age is determined from the beginning of the accident year, not the end).
However, there are 2 interim settlements (at age 15 months and age 36 months). The discount
factors determined for the claims fees liabilities reflect these settlement patterns.
The claims development provision for adverse development (PfAD) is also calculated to reflect the
unique (retroactive) nature of the fee arrangement with the Servicing Carriers, in that the final fee
determination is derived from the recorded claims at 72 months as a ratio of earned premium (“72-
month recorded ratio”) on a “sliding scale” basis (the parameters involved vary by jurisdiction as set
out in the FA Plan of Operation). Because of this, the claims development PfAD is determined as a
ratio of earned premium as well, reflecting the additional claims fee that would be paid to the
Amounts in dollars
as at: 201610 (Share YYYYMM) Summary of Member Statement APVs for Retro Claims and Excess Legal
apv for claims fee apv for allowed claims expense
M/S
Basis
nominal unpaid
claims feeassociated apv APV as % unpaid
nominal unpaid
allowed claims
expense
associated apv APV as % unpaid
nominal unpaid
claims fee
&allowed claims
expense
associated apv APV as % unpaid PAYs CAY PAYs CAY
ON P (619,000) 395,000 (63.8%) 12,562,000 1,092,000 8.7% 11,943,000 1,487,000 12.5% 332,000 63,000 1,041,000 51,000
ON N (1,016,000) 650,000 (64.0%) 9,330,000 963,000 10.3% 8,314,000 1,613,000 19.4% 510,000 140,000 851,000 112,000
ON TOT (1,635,000) 1,045,000 (63.9%) 21,892,000 2,055,000 9.4% 20,257,000 3,100,000 15.3% 842,000 203,000 1,892,000 163,000
AB P (72,000) 64,000 (88.9%) 1,095,000 123,000 11.2% 1,023,000 187,000 18.3% 32,000 32,000 117,000 6,000
AB N (381,000) 315,000 (82.7%) 3,732,000 360,000 9.6% 3,351,000 675,000 20.1% 146,000 169,000 332,000 28,000
AB TOT (453,000) 379,000 (83.7%) 4,827,000 483,000 10.0% 4,374,000 862,000 19.7% 178,000 201,000 449,000 34,000
NL P 400,000 393,000 98.3% 2,259,000 221,000 9.8% 2,659,000 614,000 23.1% 287,000 106,000 199,000 22,000
NL N 123,000 115,000 93.5% 671,000 62,000 9.2% 794,000 177,000 22.3% 80,000 35,000 55,000 7,000
NL TOT 523,000 508,000 97.1% 2,930,000 283,000 9.7% 3,453,000 791,000 22.9% 367,000 141,000 254,000 29,000
NB P 203,000 187,000 92.1% 1,733,000 194,000 11.2% 1,936,000 381,000 19.7% 144,000 43,000 176,000 18,000
NB N 153,000 122,000 79.7% 1,251,000 138,000 11.0% 1,404,000 260,000 18.5% 96,000 26,000 128,000 10,000
NB TOT 356,000 309,000 86.8% 2,984,000 332,000 11.1% 3,340,000 641,000 19.2% 240,000 69,000 304,000 28,000
NS P 31,000 102,000 329.0% 2,227,000 212,000 9.5% 2,258,000 314,000 13.9% 72,000 30,000 203,000 9,000
NS N 28,000 130,000 464.3% 1,300,000 121,000 9.3% 1,328,000 251,000 18.9% 89,000 41,000 109,000 12,000
NS TOT 59,000 232,000 393.2% 3,527,000 333,000 9.4% 3,586,000 565,000 15.8% 161,000 71,000 312,000 21,000
PE P (30,000) 47,000 (156.7%) 282,000 57,000 20.2% 252,000 104,000 41.3% 32,000 15,000 54,000 3,000
PE N (17,000) 28,000 (164.7%) 181,000 25,000 13.8% 164,000 53,000 32.3% 19,000 9,000 22,000 3,000
PE TOT (47,000) 75,000 (159.6%) 463,000 82,000 17.7% 416,000 157,000 37.7% 51,000 24,000 76,000 6,000
YT P (29,000) 13,000 (44.8%) 31,000 15,000 48.4% 2,000 28,000 1,400.0% 11,000 2,000 15,000 -
YT N (43,000) 19,000 (44.2%) 58,000 14,000 24.1% 15,000 33,000 220.0% 15,000 4,000 13,000 1,000
YT TOT (72,000) 32,000 (44.4%) 89,000 29,000 32.6% 17,000 61,000 358.8% 26,000 6,000 28,000 1,000
NT P (10,000) 48,000 (480.0%) 295,000 26,000 8.8% 285,000 74,000 26.0% 39,000 9,000 24,000 2,000
NT N (5,000) 17,000 (340.0%) 95,000 10,000 10.5% 90,000 27,000 30.0% 14,000 3,000 9,000 1,000
NT TOT (15,000) 65,000 (433.3%) 390,000 36,000 9.2% 375,000 101,000 26.9% 53,000 12,000 33,000 3,000
NU P (23,000) 6,000 (26.1%) 58,000 8,000 13.8% 35,000 14,000 40.0% 4,000 2,000 8,000 -
NU N (24,000) 6,000 (25.0%) 41,000 5,000 12.2% 17,000 11,000 64.7% 3,000 3,000 5,000 -
NU TOT (47,000) 12,000 (25.5%) 99,000 13,000 13.1% 52,000 25,000 48.1% 7,000 5,000 13,000 -
ALL P (149,000) 1,255,000 (842.3%) 20,542,000 1,948,000 9.5% 20,393,000 3,203,000 15.7% 953,000 302,000 1,837,000 111,000
ALLN (1,182,000) 1,402,000 (118.6%) 16,659,000 1,698,000 10.2% 15,477,000 3,100,000 20.0% 972,000 430,000 1,524,000 174,000
ALLTOT (1,331,000) 2,657,000 (199.6%) 37,201,000 3,646,000 9.8% 35,870,000 6,303,000 17.6% 1,925,000 732,000 3,361,000 285,000

Actuarial Highlights – Residual Market
Participation Report October 2016
Page 6 of 118
Servicing Carriers if the 72-month recorded loss ratio was at a higher level (where the higher level is
determined based on the associated indemnity claims development PfAD).
As an example, the Ontario accident year 2016 recorded loss ratio at 72 months is current estimated
to be 49.4%, and on this basis, the retroactive claims fee provision factor is -1.6% of earned
premium, resulting in a provision of -$541 thousand. Of the 49.4% projected loss ratio, 9.3 points
have already been paid, leaving an unpaid ratio of 40.1%. The claims development margin is 14.4%
(weighted average basis), which would move the unpaid ratio to 45.9% at the adverse position
(40.1% x 1.144) so that the projected recorded 72 month loss ratio would be 55.2% (9.3% + 45.9%)
at that adverse position. At this latter ratio (55.2%), the retroactive claims fee provision factor would
be -1.0%, or an increase of 0.6 points from the original factor of -1.6%. We would use this 0.6% of
earned premium to determine the PfAD for adverse development for the retroactive claims fee. This
approach ensures that it is consistent with the indemnity provision for adverse claims development
deviation.
The calculation of the claims fee PfAD ratio (i.e. the factor that is applied to earned premium) is in a
spreadsheet format that FA can easily share with interested members to understand the calculation in
more detail. To obtain a copy, please contact Shawn Doherty at [email protected].
To provide detail on the combined provision for claims fees and allowed claims expenses on both a
Member Statement basis (that is, including actuarial present value adjustments) and on a nominal
basis (that is, excluding actuarial present value adjustments), the former Exhibit C “Retro Claims
Expense Provision ($s) for Member Statements (actuarial present value adjustments = 0)” has now
been split into 2 exhibits:
Exhibit C-1: Retro Claims Expense Provision ($s) for Member Statements (includes
Actuarial Present Value Adjustments)
Exhibit C-2: Retro Claims Expense Provision ($s) Nominal (excludes Actuarial Present
Value Adjustments)
1.3 New Valuation
A valuation of the Facility Association Residual Market (“FARM”) as at September 30, 2016 has
been completed for Private Passenger and non-Private Passenger business segments and all
jurisdictions since last month’s Participation Report. The valuation was completed by the Facility
Association’s internal actuarial group in conjunction with, and approved by, the Appointed Actuary,
under the hybrid model for actuarial services. Additional detail will be provided in an “Actuarial
Highlights – Quarterly Valuation” report to be posted to the FA website at the same time as this
report.
The valuation implementation impact is summarized in the two tables that follow.

Actuarial Highlights – Residual Market
Participation Report October 2016
Page 7 of 118
Summary of Impact ($000s) of Implementing Result of Valuation as at September 30, 20162
As indicated in the table above, the incorporation of the new valuation had an estimated
$16.6 million unfavourable impact on the month’s net result from operations, adding an estimated
11.1 points (see table immediately below) to the year-to-date Combined Operating Ratio to end at
99.1%.
Summary of Impact (% YTD EP) of Implementing Result of Valuation as at September 30, 2016
The impact of the nominal changes is shown in the first 3 columns of the two preceding summary
tables. The change in the selected nominal ultimates was unfavourable by $8.6 million overall. This
reflects the impact attributable to the change in the selected ultimate loss ratio (i.e. for each accident
year, it is the product of life-to-date earned premium for the accident year and the change in the
selected ultimate loss ratio). The reduction in the discount rate to 0.62% had a $0.9 million
unfavourable impact. As the selected margins for interest rate and for claims development were left
unchanged, there were no associated impacts.
As discussed in section 1.2, actuarial present value adjustments were not previously determined for
policy liabilities associated with claims fees and allowed claims expenses, having assessed and
deemed as being not material (this is allowed under IFRS 4). However, this practice was reviewed
by FA management and the FA Appointed Actuary and it was decided to begin to include actuarial
present value adjustments for claims fees and allowed claims expenses as part of this latest valuation
(September 30, 2016) onward. This change accounts for $6.3 million of the $7.2 million actuarial
present value adjustment impact change in the second column of the two preceding tables (that is,
2In these tables, “PAYs” refers to prior accident years, “CAY” refers to the current accident year, and “Prem Def” refers to the
provision for premium deficiency or the deferred policy acquisition asset (as applicable). “Nominal” refers to changes excluding any
actuarial present value adjustments, whereas “apv adj.” refers to actuarial present value adjustments.
The columns under the heading “ults & payout patterns” reflect the impact of changes in the valuation selected ultimates and claims
payment patterns (i.e. based on unchanged selection of discount rates and margins for adverse deviation). The column “dsct rate”
reflects the impact of the change in the selected discount rate and the column “margins” reflects the impact of any changes in selected
margins for adverse deviations.
Grand Total unfav / (fav)
IMPACT in $000s from changes in:IMPACT
unfav / ultimates & payout patterns dsct rate margins ultimates
nominal apv adj. sub-tot apv adj. apv adj. TOTAL
PAYs 5,954 5,725 11,679 716 - 12,395
CAY 2,575 1,193 3,768 138 - 3,906
Prem Def 60 238 298 11 - 309
TOTAL 8,589 7,156 15,745 865 - 16,610
Grand Total ytd EP 149,540 (actual)unfav /
(fav) IMPACT unfav / (fav) as % ytd EP from changes in:
IMPACT in
$000s ultimates & payout patterns dsct rate margins ultimates
nominal apv adj. sub-tot apv adj. apv adj. TOTAL
PAYs 4.0% 3.8% 7.8% 0.5% - 8.3%
CAY 1.7% 0.8% 2.5% 0.1% - 2.6%
Prem Def - 0.2% 0.2% - - 0.2%
TOTAL 5.7% 4.8% 10.5% 0.6% - 11.1%
Actuarial Highlights – Residual Market
Participation Report October 2016
Page 8 of 118
prior to the update of the discount rate).
The valuation results and associated implementation impacts are discussed in more detail below.
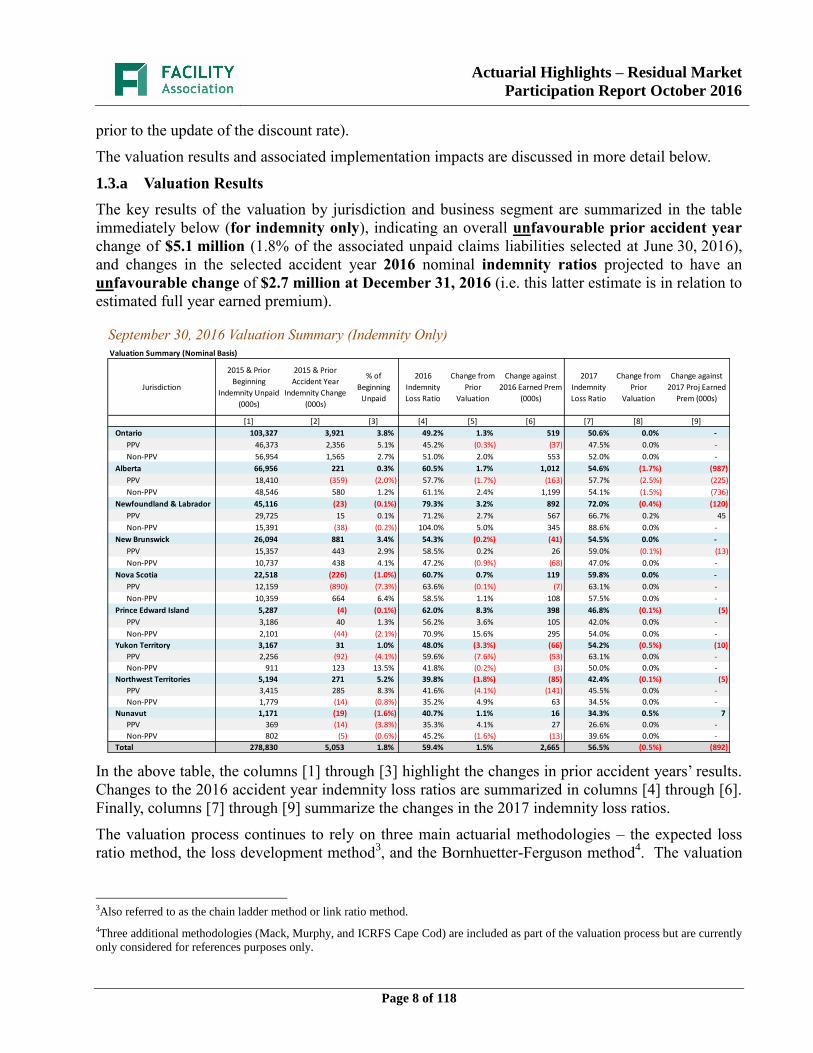
1.3.a Valuation Results
The key results of the valuation by jurisdiction and business segment are summarized in the table
immediately below (for indemnity only), indicating an overall unfavourable prior accident year
change of $5.1 million (1.8% of the associated unpaid claims liabilities selected at June 30, 2016),
and changes in the selected accident year 2016 nominal indemnity ratios projected to have an
unfavourable change of $2.7 million at December 31, 2016 (i.e. this latter estimate is in relation to
estimated full year earned premium).
September 30, 2016 Valuation Summary (Indemnity Only)
In the above table, the columns [1] through [3] highlight the changes in prior accident years’ results.
Changes to the 2016 accident year indemnity loss ratios are summarized in columns [4] through [6].
Finally, columns [7] through [9] summarize the changes in the 2017 indemnity loss ratios.
The valuation process continues to rely on three main actuarial methodologies – the expected loss
ratio method, the loss development method3, and the Bornhuetter-Ferguson method
4. The valuation
3Also referred to as the chain ladder method or link ratio method.
4Three additional methodologies (Mack, Murphy, and ICRFS Cape Cod) are included as part of the valuation process but are currently
only considered for references purposes only.
Valuation Summary (Nominal Basis)
Jurisdiction
2015 & Prior
Beginning
Indemnity Unpaid
(000s)
2015 & Prior
Accident Year
Indemnity Change
(000s)
% of
Beginning
Unpaid
2016
Indemnity
Loss Ratio
Change from
Prior
Valuation
Change against
2016 Earned Prem
(000s)
2017
Indemnity
Loss Ratio
Change from
Prior
Valuation
Change against
2017 Proj Earned
Prem (000s)
[1] [2] [3] [4] [5] [6] [7] [8] [9]
Ontario 103,327 3,921 3.8% 49.2% 1.3% 519 50.6% 0.0% -
PPV 46,373 2,356 5.1% 45.2% (0.3%) (37) 47.5% 0.0% -
Non-PPV 56,954 1,565 2.7% 51.0% 2.0% 553 52.0% 0.0% -
Alberta 66,956 221 0.3% 60.5% 1.7% 1,012 54.6% (1.7%) (987)
PPV 18,410 (359) (2.0%) 57.7% (1.7%) (163) 57.7% (2.5%) (225)
Non-PPV 48,546 580 1.2% 61.1% 2.4% 1,199 54.1% (1.5%) (736)
Newfoundland & Labrador 45,116 (23) (0.1%) 79.3% 3.2% 892 72.0% (0.4%) (120)
PPV 29,725 15 0.1% 71.2% 2.7% 567 66.7% 0.2% 45
Non-PPV 15,391 (38) (0.2%) 104.0% 5.0% 345 88.6% 0.0% -
New Brunswick 26,094 881 3.4% 54.3% (0.2%) (41) 54.5% 0.0% -
PPV 15,357 443 2.9% 58.5% 0.2% 26 59.0% (0.1%) (13)
Non-PPV 10,737 438 4.1% 47.2% (0.9%) (68) 47.0% 0.0% -
Nova Scotia 22,518 (226) (1.0%) 60.7% 0.7% 119 59.8% 0.0% -
PPV 12,159 (890) (7.3%) 63.6% (0.1%) (7) 63.1% 0.0% -
Non-PPV 10,359 664 6.4% 58.5% 1.1% 108 57.5% 0.0% -
Prince Edward Island 5,287 (4) (0.1%) 62.0% 8.3% 398 46.8% (0.1%) (5)
PPV 3,186 40 1.3% 56.2% 3.6% 105 42.0% 0.0% -
Non-PPV 2,101 (44) (2.1%) 70.9% 15.6% 295 54.0% 0.0% -
Yukon Territory 3,167 31 1.0% 48.0% (3.3%) (66) 54.2% (0.5%) (10)
PPV 2,256 (92) (4.1%) 59.6% (7.6%) (53) 63.1% 0.0% -
Non-PPV 911 123 13.5% 41.8% (0.2%) (3) 50.0% 0.0% -
Northwest Territories 5,194 271 5.2% 39.8% (1.8%) (85) 42.4% (0.1%) (5)
PPV 3,415 285 8.3% 41.6% (4.1%) (141) 45.5% 0.0% -
Non-PPV 1,779 (14) (0.8%) 35.2% 4.9% 63 34.5% 0.0% -
Nunavut 1,171 (19) (1.6%) 40.7% 1.1% 16 34.3% 0.5% 7
PPV 369 (14) (3.8%) 35.3% 4.1% 27 26.6% 0.0% -
Non-PPV 802 (5) (0.6%) 45.2% (1.6%) (13) 39.6% 0.0% -
Total 278,830 5,053 1.8% 59.4% 1.5% 2,665 56.5% (0.5%) (892)
Actuarial Highlights – Residual Market
Participation Report October 2016
Page 9 of 118
triangles are split by business segment (i.e. private passenger5 and non-private passenger), following
Member Sharing as per the Plan of Operation. The valuation triangles are directly reconcilable to
accident year / calendar year results for the FARM.
In general, the valuation data triangles are used directly in striking development factor selections by
coverage for each jurisdiction and each business segment. However, where the data is not deemed
credible or is deemed too volatile or for other considerations, development factors may be struck
using data from another jurisdiction (for example, using Alberta factors for the northern territories),
or from industry data (via the loss development triangle data available from the General Insurance
Statistical Agency (“GISA”) through the Insurance Bureau of Canada (“IBC”)).
Final selection of IBNR was made at the coverage/accident-half year level, after consideration of the
results of the three methods identified above. This is consistent with the process followed for the
prior FARM valuation.
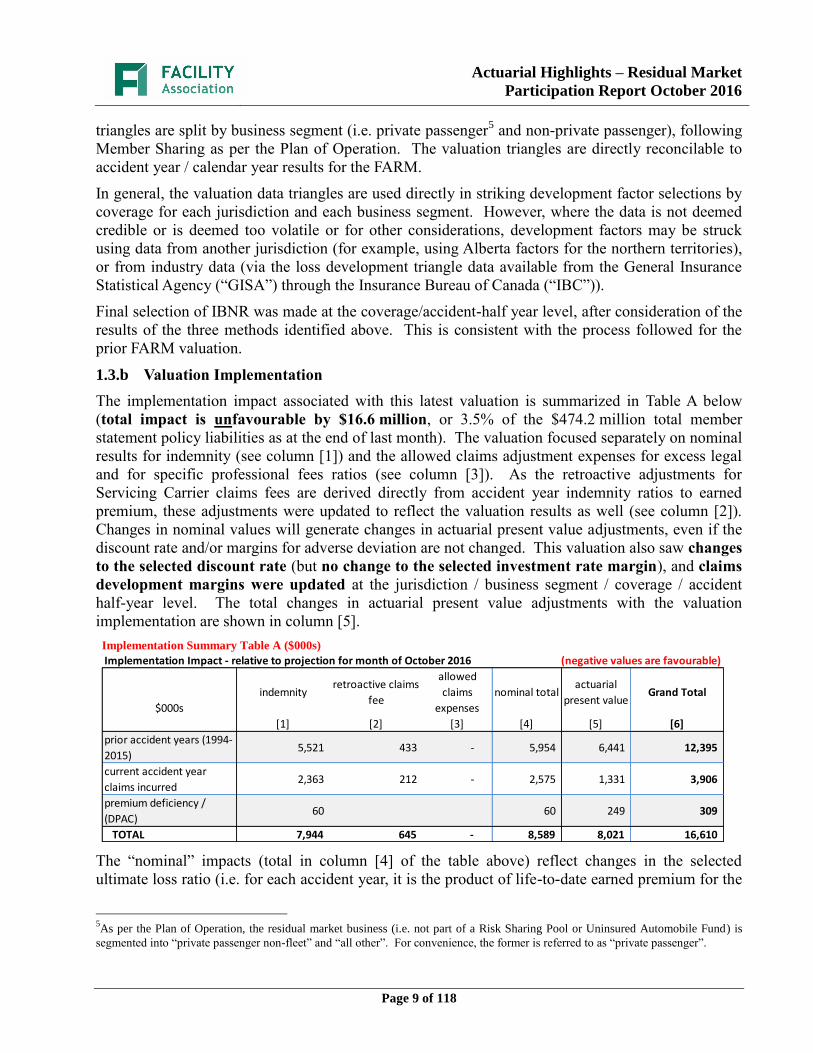
1.3.b Valuation Implementation
The implementation impact associated with this latest valuation is summarized in Table A below
(total impact is unfavourable by $16.6 million, or 3.5% of the $474.2 million total member
statement policy liabilities as at the end of last month). The valuation focused separately on nominal
results for indemnity (see column [1]) and the allowed claims adjustment expenses for excess legal
and for specific professional fees ratios (see column [3]). As the retroactive adjustments for
Servicing Carrier claims fees are derived directly from accident year indemnity ratios to earned
premium, these adjustments were updated to reflect the valuation results as well (see column [2]).
Changes in nominal values will generate changes in actuarial present value adjustments, even if the
discount rate and/or margins for adverse deviation are not changed. This valuation also saw changes
to the selected discount rate (but no change to the selected investment rate margin), and claims
development margins were updated at the jurisdiction / business segment / coverage / accident
half-year level. The total changes in actuarial present value adjustments with the valuation
implementation are shown in column [5].
Implementation Summary Table A ($000s)
The “nominal” impacts (total in column [4] of the table above) reflect changes in the selected
ultimate loss ratio (i.e. for each accident year, it is the product of life-to-date earned premium for the
5As per the Plan of Operation, the residual market business (i.e. not part of a Risk Sharing Pool or Uninsured Automobile Fund) is
segmented into “private passenger non-fleet” and “all other”. For convenience, the former is referred to as “private passenger”.
Implementation Impact - relative to projection for month of October 2016 (negative values are favourable)
$000s
indemnityretroactive claims
fee
allowed
claims
expenses
nominal totalactuarial
present valueGrand Total
[1] [2] [3] [4] [5] [6]
prior accident years (1994-
2015)5,521 433 - 5,954 6,441 12,395
current accident year
claims incurred2,363 212 - 2,575 1,331 3,906
premium deficiency /
(DPAC)60 60 249 309
TOTAL 7,944 645 - 8,589 8,021 16,610

Actuarial Highlights – Residual Market
Participation Report October 2016
Page 10 of 118
accident year and the change in the selected ultimate loss ratio for indemnity and for the allowed
claims expenses for the claims liabilities; ultimate loss ratios are also taken into account in
determining the premium liabilities). Changes in selected nominal ultimate indemnity for the most
recent five prior accident years will generate changes to the retroactive claims fees adjustments to
Servicing Carriers (see column [2] of the table at the bottom of the previous page). As well, the
selected ultimate ratio levels for allowed claims expenses (“excess legal”) are reviewed annually
with the June 30 valuation and were hence updated with this valuation, with the impact shown in
column [3] of Table A on the previous page.
In addition to the changes in the actuarial present value adjustments directly related to the changes in
selected nominal values, indemnity payment emergence patterns were updated and cash flows were
reviewed against the selected risk-free yield curve. The selected risk-free yield curve was derived
from Government of Canada benchmark bond yields monthly series using values for
September 2016 (the selected yield curve is anchored with the valuation date).
Finally, as discussed in Section 1.2, the actuarial present value implementation impacts include those
related to the first time introduction of actuarial present value adjustments for claims fees and
allowed claims expenses. The associated table of impacts from that section is reproduced below,
with the impact total for actuarial present value adjustments alone shown in columns [4] to [6].
Implementation Summary Table ($000s) – claims fees and allowed claims expenses
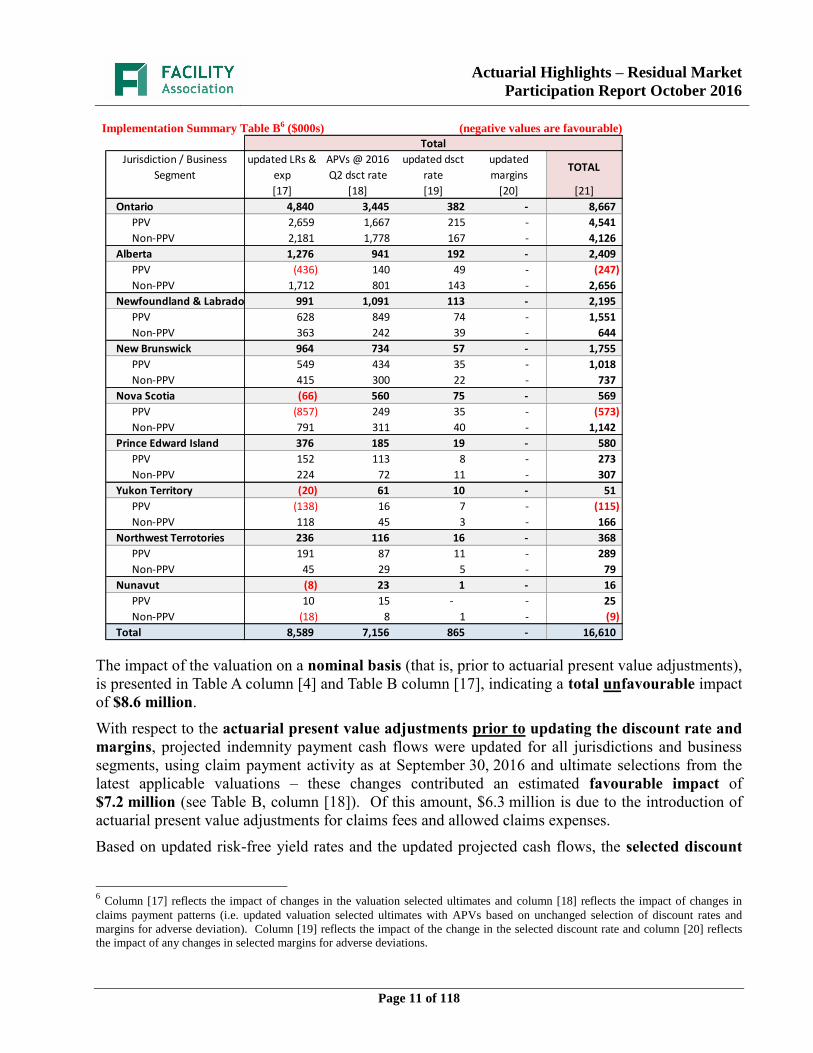
“Implementation Summary Table B” (top of next page) summarizes, by jurisdiction, the information
shown in Table A (previous page). In relating the two tables, the total for Table A column [4]
matches the total for Table B column [17], the total for Table A column [5] matches the sum of the
total for Table B columns [18] and [19] and [20], and the total for Table A column [6] matches the
total for Table B column [21].
nominal values actuarial present value adjustments Member Statement Impact
$000s
retroactive
claims fee
allowed
claims
expenses
totalretroactive
claims fee
allowed
claims
expenses
totalretroactive
claims fee
allowed
claims
expenses
total
[1] [2] [3] [4] [5] [6] [7] [8] [9]
prior accident years
(1994-2015)433 - 433 1,925 3,361 5,286 2,358 3,361 5,719
current accident year
claims incurred212 - 212 732 285 1,017 944 285 1,229
premium deficiency /
(DPAC)- - - 113 113
TOTAL 645 - 645 6,416 7,061
Actuarial Highlights – Residual Market
Participation Report October 2016
Page 11 of 118
Implementation Summary Table B6 ($000s) (negative values are favourable)
The impact of the valuation on a nominal basis (that is, prior to actuarial present value adjustments),
is presented in Table A column [4] and Table B column [17], indicating a total unfavourable impact
of $8.6 million.
With respect to the actuarial present value adjustments prior to updating the discount rate and
margins, projected indemnity payment cash flows were updated for all jurisdictions and business
segments, using claim payment activity as at September 30, 2016 and ultimate selections from the
latest applicable valuations – these changes contributed an estimated favourable impact of
$7.2 million (see Table B, column [18]). Of this amount, $6.3 million is due to the introduction of
actuarial present value adjustments for claims fees and allowed claims expenses.
Based on updated risk-free yield rates and the updated projected cash flows, the selected discount
6 Column [17] reflects the impact of changes in the valuation selected ultimates and column [18] reflects the impact of changes in
claims payment patterns (i.e. updated valuation selected ultimates with APVs based on unchanged selection of discount rates and
margins for adverse deviation). Column [19] reflects the impact of the change in the selected discount rate and column [20] reflects
the impact of any changes in selected margins for adverse deviations.
Total
Jurisdiction / Business
Segment
updated LRs &
exp
APVs @ 2016
Q2 dsct rate
updated dsct
rate
updated
marginsTOTAL
[17] [18] [19] [20] [21]
Ontario 4,840 3,445 382 - 8,667
PPV 2,659 1,667 215 - 4,541
Non-PPV 2,181 1,778 167 - 4,126
Alberta 1,276 941 192 - 2,409
PPV (436) 140 49 - (247)
Non-PPV 1,712 801 143 - 2,656
Newfoundland & Labrador 991 1,091 113 - 2,195
PPV 628 849 74 - 1,551
Non-PPV 363 242 39 - 644
New Brunswick 964 734 57 - 1,755
PPV 549 434 35 - 1,018
Non-PPV 415 300 22 - 737
Nova Scotia (66) 560 75 - 569
PPV (857) 249 35 - (573)
Non-PPV 791 311 40 - 1,142
Prince Edward Island 376 185 19 - 580
PPV 152 113 8 - 273
Non-PPV 224 72 11 - 307
Yukon Territory (20) 61 10 - 51
PPV (138) 16 7 - (115)
Non-PPV 118 45 3 - 166
Northwest Terrotories 236 116 16 - 368
PPV 191 87 11 - 289
Non-PPV 45 29 5 - 79
Nunavut (8) 23 1 - 16
PPV 10 15 - - 25
Non-PPV (18) 8 1 - (9)
Total 8,589 7,156 865 - 16,610
Actuarial Highlights – Residual Market
Participation Report October 2016
Page 12 of 118
rate was decreased by 7 basis points from 0.69% to 0.62%7, resulting in an estimated
unfavourable impact of $865 thousand (see Table B, column [19]). Of this amount, $115 thousand
is related to claims fees and allowed claims expenses, leaving $750 thousand related to indemnity
only. The indemnity only impact is in line with the $712 thousand change one would estimate
through interpolation using last month’s sensitivity table (see section 6, Exhibit “F” for examples of
sensitivity to discount rate selection). Finally, the selected margin for investment return was left
unchanged at 25 basis points, and the margins selected for claims development at the coverage /
accident half-year level were also left unchanged with this valuation, therefore generating no impact
(see Table B, column [20]).
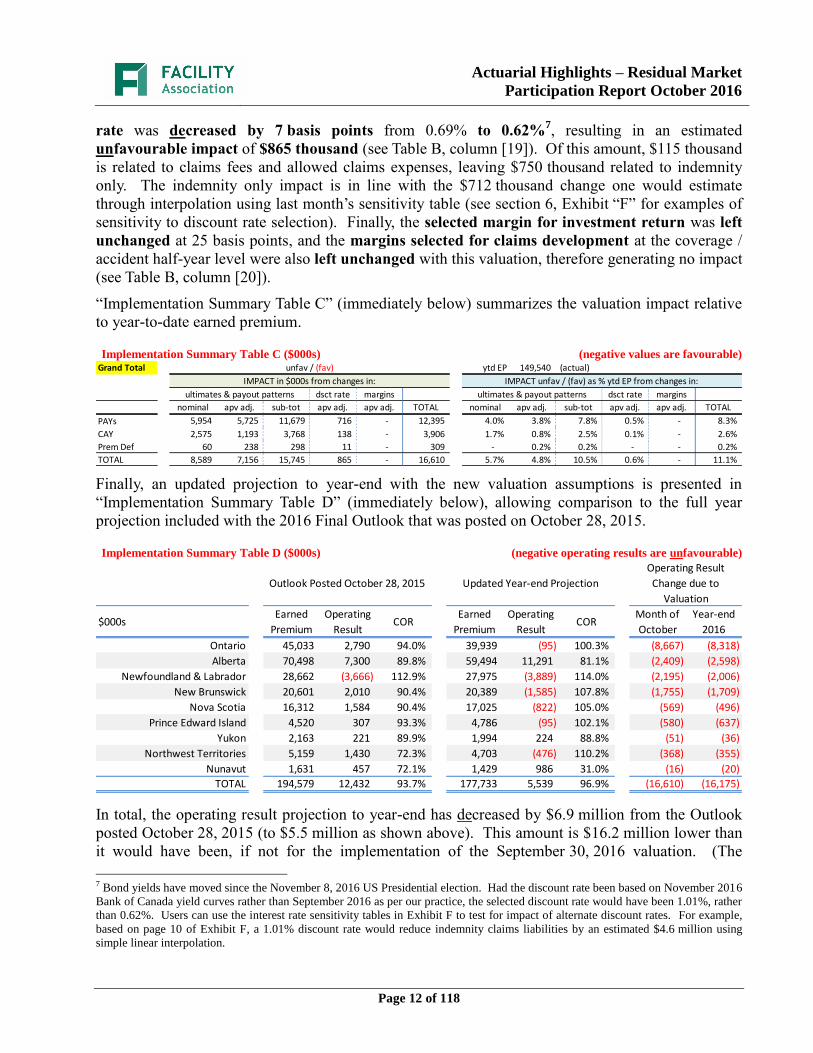
“Implementation Summary Table C” (immediately below) summarizes the valuation impact relative
to year-to-date earned premium.
Implementation Summary Table C ($000s) (negative values are favourable)
Finally, an updated projection to year-end with the new valuation assumptions is presented in
“Implementation Summary Table D” (immediately below), allowing comparison to the full year
projection included with the 2016 Final Outlook that was posted on October 28, 2015.
Implementation Summary Table D ($000s) (negative operating results are unfavourable)
In total, the operating result projection to year-end has decreased by $6.9 million from the Outlook
posted October 28, 2015 (to $5.5 million as shown above). This amount is $16.2 million lower than
it would have been, if not for the implementation of the September 30, 2016 valuation. (The
7 Bond yields have moved since the November 8, 2016 US Presidential election. Had the discount rate been based on November 2016
Bank of Canada yield curves rather than September 2016 as per our practice, the selected discount rate would have been 1.01%, rather
than 0.62%. Users can use the interest rate sensitivity tables in Exhibit F to test for impact of alternate discount rates. For example,
based on page 10 of Exhibit F, a 1.01% discount rate would reduce indemnity claims liabilities by an estimated $4.6 million using
simple linear interpolation.
Grand Total unfav / (fav) ytd EP 149,540 (actual)unfav /
(fav) IMPACT in $000s from changes in: IMPACT unfav / (fav) as % ytd EP from changes in:
IMPACT in
$000s ultimates & payout patterns dsct rate margins ultimates & payout patterns dsct rate margins ultimates
nominal apv adj. sub-tot apv adj. apv adj. TOTAL nominal apv adj. sub-tot apv adj. apv adj. TOTAL
PAYs 5,954 5,725 11,679 716 - 12,395 4.0% 3.8% 7.8% 0.5% - 8.3%
CAY 2,575 1,193 3,768 138 - 3,906 1.7% 0.8% 2.5% 0.1% - 2.6%
Prem Def 60 238 298 11 - 309 - 0.2% 0.2% - - 0.2%
TOTAL 8,589 7,156 15,745 865 - 16,610 5.7% 4.8% 10.5% 0.6% - 11.1%
Outlook Posted October 28, 2015 Updated Year-end Projection
Operating Result
Change due to
Valuation
$000sEarned
Premium
Operating
ResultCOR
Earned
Premium
Operating
ResultCOR
Month of
October
Year-end
2016
Ontario 45,033 2,790 94.0% 39,939 (95) 100.3% (8,667) (8,318)
Alberta 70,498 7,300 89.8% 59,494 11,291 81.1% (2,409) (2,598)
Newfoundland & Labrador 28,662 (3,666) 112.9% 27,975 (3,889) 114.0% (2,195) (2,006)
New Brunswick 20,601 2,010 90.4% 20,389 (1,585) 107.8% (1,755) (1,709)
Nova Scotia 16,312 1,584 90.4% 17,025 (822) 105.0% (569) (496)
Prince Edward Island 4,520 307 93.3% 4,786 (95) 102.1% (580) (637)
Yukon 2,163 221 89.9% 1,994 224 88.8% (51) (36)
Northwest Territories 5,159 1,430 72.3% 4,703 (476) 110.2% (368) (355)
Nunavut 1,631 457 72.1% 1,429 986 31.0% (16) (20)
TOTAL 194,579 12,432 93.7% 177,733 5,539 96.9% (16,610) (16,175)
Actuarial Highlights – Residual Market
Participation Report October 2016
Page 13 of 118
changes before the impact of the September 30, 2016 valuation are attributable to mix of business
and other projection assumptions outside of the valuation process, as well as the previous valuations
(2015 Q3, 2015 Q4, 2016 Q1, and 2016 Q2) implemented since the 2015 Q2 valuation used as the
basis for the 2016 Final Outlook.) As discussed, the 2016 Q3 valuation implementation included a
$6.4 million unfavourable impact related to the introduction of actuarial present value adjustments
for claims fees and allowed claims expenses. Without this latter change, the result projected to year-
end would have been close to what was originally projected for calendar year 2016.
One important change relative to the 2016 Final Outlook has been the reduction in the discount rate.
Had the 2016 Final Outlook discount rate of 1.07% still been applicable, the operating result would
have been higher by $4.6 million (using the current interest rate sensitivity table). That is, the
projected Operating Result would have been approximately $10.1 million (COR of 94.3%) had the
discount rate remained at the 2016 final Outlook level.
1.4 Appointed Actuary and Hybrid Actuarial Services Model
Liam McFarlane of Ernst & Young LLP is Facility Association’s Appointed Actuary (effective as of
June 1, 2013).
Facility Association operates under a “hybrid” model in relation to the management and provision of
actuarial services. Under this model, actuarial services are performed by both Facility Association’s
internal staff and its external actuarial consulting firm. The hybrid model approach maximizes the
efficiency of resource allocation while providing access to additional expertise and capacity as
needed.
1.5 Consideration of Recent Legal Decisions Changes in Legislation / Regulation8
Consideration and assessment of potential impacts of legal decisions and changes in legislation /
regulation constitutes a regular part of the valuation process. Descriptions of some of the more
recent changes are provided below.
Ontario Bill 15 (Fighting Fraud and Reducing Automobile Insurance Rates Act, 2014) was
introduced into the Legislature by the Minister of Finance on July 15, 2014 and received Royal
Assent on November 20, 2014. Bill 15 includes various amendments and provisions such as moving
the Ontario Automobile Dispute Resolution System (DRS) for statutory accident benefits from the
Financial Services Commission of Ontario to the Ministry of the Attorney General (Licence Appeal
Tribunal), regulation of the Tow and Storage Industry (amendments to the Consumer Protection Act
and Repair and Storage Liens Act), regulations related to licensing of insurance agents and adjusters,
changes to the applicable interest rate applied to overdue payments in the Statutory Accident
Benefits Schedule (SABS), and changes to the prejudgment interest rate on general damages for
non-pecuniary loss from the rate as set out in the Courts of Justice Act to rates linked to market
conditions. With the current valuation, reform adjustments (originally introduced with the June 30,
2015 valuation) specifically related to changes in the non-pecuniary prejudgment interest provision
calculation impacting the bodily injury coverage and the applicable interest rate applied to overdue
payments in the SABS impacting the accident benefits coverage, were included with the updated
8How bills become laws in Ontario is described in detail in the publication: http://www.ontla.on.ca/lao/en/media/laointernet/pdf/bills-
and-lawmaking-background-documents/how-bills-become-law-en.pdf.
Actuarial Highlights – Residual Market
Participation Report October 2016
Page 14 of 118
industry trend analysis (completed using industry data as at December 31, 2015), impacting the
selection of ultimates.
Ontario Bill 91 (Building Ontario Up Act (Budget Measures), 2015) was introduced into the
Legislature by the Minister of Finance on April 23, 2015, and received Royal Assent on June 4,
2015. Bill 91 announced a number of amendments to regulations made under the Insurance Act,
including updating the Catastrophic Impairment Definition and changes to the standard benefit level
under the Statutory Accident Benefits Schedule (SABS); restrictions on insurance premium increases
and lowering of the maximum interest rate charged on monthly auto insurance premium payments;
and adjustments to the monetary threshold beyond which the tort deductible does not apply to reflect
inflation (adjustments to reflect inflation in the associated tort deductible were undertaken via an
update to regulation 461/96). On August 26, 2015, the Ontario government filed Ontario regulations
250/15 and 251/15 implementing reforms set out in Bill 91. With the current valuation, reform
adjustments (originally introduced with the September 30, 2015 valuation) specifically related to
changes in the tort threshold and deductibles impacting the bodily injury coverage and changes to
the SABS impacting the bodily injury and accident benefits coverages, were included with the
updated industry trend analysis (completed using industry data as at December 31, 2015) and
nominal valuation estimates, impacting the selection of ultimates.
Alberta Bill 39 (Enhancing Consumer Protection in Auto Insurance Act) was introduced into the
Legislature by the Minister of Finance on November 6, 2013, and received Royal Assent on
December 11, 2013. Bill 39 includes various amendments and provisions such as allowing for both
mandatory and optional auto insurance premiums to be regulated by the independent Automobile
Insurance Rate Board (AIRB), the introduction of an Insurer file and approve system for premium
adjustments instead of an annual industry-wide rate adjustment, improved access to health care after
a collision, and strengthened Insurance Company solvency requirements. No specific adjustments
have been made to the current valuation assumptions based on Bill 39.
New Brunswick Regulation 2013-37 was filed on May 7, 2013, amending Regulation 2003-20
(Injury Regulation), made under the Insurance Act. The Regulation introduced a new Part 2 that
applies to all injuries arising from motor vehicle accidents occurring on or after July 1, 2013. The
new Part 2 re-defines “minor personal injury”, raises the maximum non-pecuniary damages
recoverable by those suffering a “minor personal injury”, and sets out a process for annually
indexing the monetary cap for inflation. With the current valuation, reform adjustments (originally
introduced with the June 30, 2014 valuation) were explicitly taken into account with the updated
industry trend analysis (completed using industry data as at December 31, 2015), impacting the
selection of ultimates.
Nova Scotia Bill 86, known as the “Fair Auto Insurance Reforms” (FAIR) was introduced on
November 9, 2011. FAIR was implemented in two phases. Regulations related to FAIR Phase I
(effective April 1, 2012) were published in the Royal Gazette Part 11, on January 13, 2012. These
include provisions for enhanced mandatory benefits under Section B (these include medical,
rehabilitation, funeral, death and loss of income benefits), prohibiting premium increases if no claim
is made, assistance for volunteer Fire Departments, and periodic review of Auto Insurance Law.
FAIR Phase II (effective April 1, 2013) includes provisions for: diagnostic and treatment protocols
for minor injuries, introduction of direct compensation for property damage, and limited liability and
new priority of pay rules for rental companies. With the current valuation, reform adjustments
Actuarial Highlights – Residual Market
Participation Report October 2016
Page 15 of 118
(originally introduced with the June 30, 2014 valuation) were explicitly taken into account with the
updated industry trend analysis (completed using industry data as at December 31, 2015), impacting
the selection of ultimates.
Prince Edward Island Bill 46 (Minor Injury Definition, Pain and Suffering Damages Cap,
Schedule B and DCPD) was introduced into the Legislative Assembly on April 25, 2014 and
received Royal Assent on May 14, 2014. Bill 46 amends the Insurance Act, introducing enhanced
mandatory benefits under Schedule B (these include medical, rehabilitation, funeral, death and loss
of income benefits) and a new section 254.2 that applies to all injuries arising from motor vehicle
accidents occurring on or after October 1, 2014. The new section 254.2 re-defines “minor personal
injury”, raises the maximum non-pecuniary damages recoverable by those suffering a “minor
personal injury”, and sets out a process for annually indexing the monetary cap for inflation. In
addition, Bill 46 includes a new section 254.3 which implements Direct Compensation provisions
for Property Damage and has been proclaimed into force effective October 1, 2015. With the current
valuation, reform adjustments (originally introduced with the June 30, 2014 valuation) were
explicitly taken into account with the updated industry trend analysis (completed using industry data
as at December 31, 2015), impacting the selection of ultimates.
1.6 Ontario FARM Bodily Injury Case Reserve summary
As indicated in section 1.5, reform adjustments, specifically related to changes in the non-pecuniary
prejudgment interest provisions in Ontario Bill 15 and the changes in the tort threshold and
deductibles in Ontario Bill 91 impacting the third party liability - bodily injury coverage for
accident years 2015 and subsequent, was included with the updated Ontario Private Passenger
Vehicle and Commercial Vehicle industry trend analyses (completed using industry data as at
December 31, 2015).
There have been two conflicting Ontario Superior Court decisions in relation to the application of
prejudgment interest provisions: Carillo v. Rizzo (April 15, 2015) and El-Khodr v. Lackie et al (July
28, 2015). In the first, the judge ruled that the change to prejudgment interest for non-pecuniary
losses9 from a set level of 5% to the level that applies to pecuniary losses applies retroactively (i.e.
applies to all open claims), whereas in the second, the judge ruled that the change applies only to
claims where notification was provided to the insurer on or after January 1, 2015. FA’s current view
is that the second judgment supersedes the first, and no adjustments have been made to the
provisions for accident years 2014 and prior as a result.
In addition to the above, there have also been multiple conflicting Ontario Superior Court decisions
in relation to the application of the changes in the tort threshold and deductibles: Cobb v. Long
Estates (November 13, 2015), Vickers v. Palacious (December 8, 2015) and Corbett v. Odorico
(March 22, 2016). In the first, the judge ruled that the changes to the tort threshold and deductibles
were substantive in nature such that the defendant was not entitled to apply the higher deductible,
whereas in the second and third, the judges concluded the deductible change is procedural on the 9Pecuniary awards are defined on the Ontario Attorney General’s website as “Damages that can be measured in money (i.e., special
damages)” with special damages further defined as “Damages intended to compensate a plaintiff for a quantifiable monetary loss.
Examples of such losses include: lost earnings, medical bills, and repair costs.” In contrast, non-pecuniary awards defined as
“Damages that cannot be measured in money, but nevertheless are compensated for with money (i.e., general damages)” with general
damages further defined as “Damages for non-monetary losses suffered by a plaintiff. These damages are not capable of exact
quantification. Examples of such losses suffered include pain, suffering, and disfigurement.”
Actuarial Highlights – Residual Market
Participation Report October 2016
Page 16 of 118
grounds that the cap on damages and the statutory deductible were implemented to achieve particular
policy objectives and therefore applied retroactively (i.e. applies to all open claims). FA’s current
view, consistent with the latter two judgments, is that the changes to the applicable tort threshold and
deductibles are applied on a settlement date basis. We’ve included a -0.75%10
retroactive adjustment
to Ontario third party liability - bodily injury unpaid amounts (outstanding case and selected IBNR)
using negative IBNR, impacting AY2014/2 and prior. We have applied a 50% tempering factor to
the AY2015/1 selected adjustment factor as these are settlements that are negotiated globally and
hence there may be erosion of the deductible.
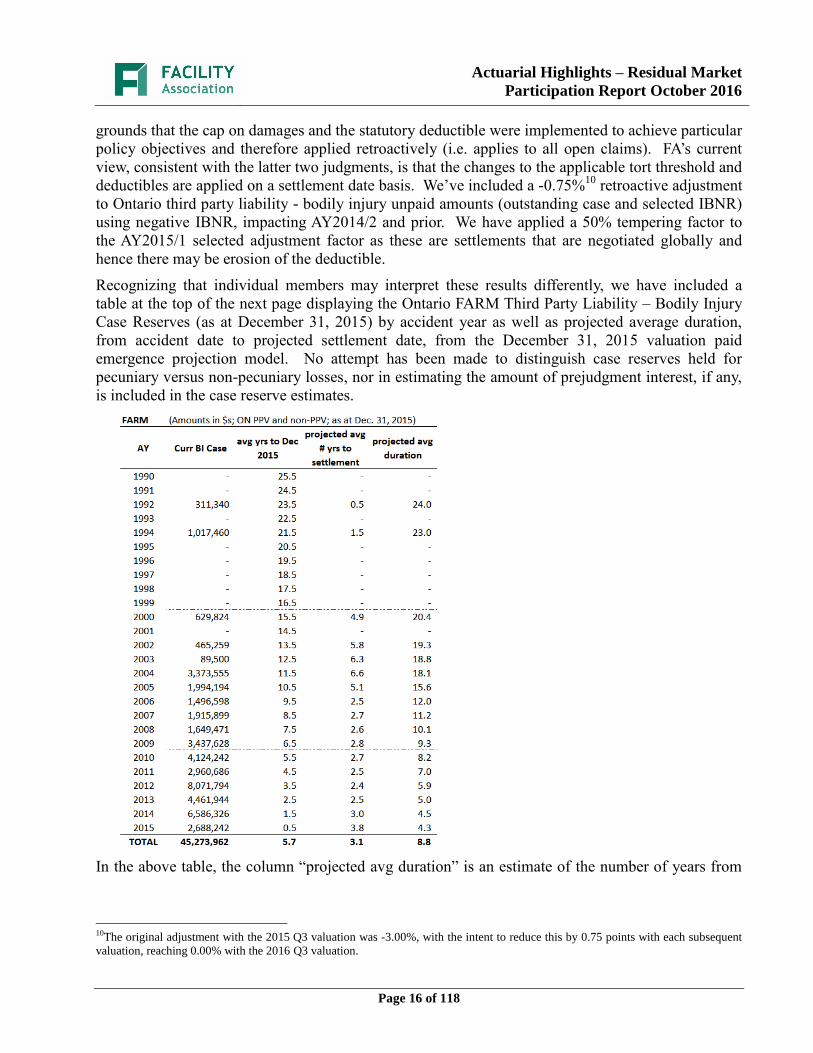
Recognizing that individual members may interpret these results differently, we have included a
table at the top of the next page displaying the Ontario FARM Third Party Liability – Bodily Injury
Case Reserves (as at December 31, 2015) by accident year as well as projected average duration,
from accident date to projected settlement date, from the December 31, 2015 valuation paid
emergence projection model. No attempt has been made to distinguish case reserves held for
pecuniary versus non-pecuniary losses, nor in estimating the amount of prejudgment interest, if any,
is included in the case reserve estimates.
In the above table, the column “projected avg duration” is an estimate of the number of years from
10The original adjustment with the 2015 Q3 valuation was -3.00%, with the intent to reduce this by 0.75 points with each subsequent
valuation, reaching 0.00% with the 2016 Q3 valuation.

Actuarial Highlights – Residual Market
Participation Report October 2016
Page 17 of 118
claim occurrence11
to claim settlement, via summing the average number of years from claim
occurrence to December 31, 2015 (3rd
column) and from December 31, 2015 to settlement (4th
column).
1.7 Current Provision Summary
The charts immediately below show the current levels of indemnity only12
claims amounts booked
by accident year13
. The left chart displays life-to-date indemnity payments, case reserves, IBNR and
the total including actuarial present value adjustments against accident year earned premium. The
right chart shows the associated dollar amounts for the components of the unpaid claims liabilities
and the current projected amount of 2016 full year earned premium (the red hash-mark line) to
provide some perspective.
“M/S” refers to “Member Statement” values – that is, actuarial present value adjustments at the selected discount rate.
The current actuarial present value adjustments balance associated with indemnity ($32.6 million –
see table at the top of the next page) represents 18% of the earned premium projected for the full
year 2016 (see the upper right corner of the right chart above). If our current estimates of the
nominal claim liabilities amounts prove to match actual claims payments, the actuarial present value
adjustments will be released into the net operating result over future periods as the associated claims
are settled.
11
Prejudgment interest in Ontario applies to the period from the date the claim is reported, not from the time of occurrence. We have
provided the latter to allow actuarial judgment to be applied in estimating the lag between occurrence and reporting.
12Servicing Carriers for the Residual Market are compensated via an initial claims fee paid as a percentage of earned premium. This
fee is retroactively adjusted and settled at age 72 months for each accident year based on the formula as laid out in the Plan of
Operation. The claims fee is meant to cover Servicing Carrier costs for claims management and adjudication except for certain
categories of claims expenses (first party legal and professional consulting fees as described in the Facility Association’s “Claims
Guide” manual under the “Legal & Professional Fees” section). These latter fees are reimbursable upon proof of closure of the
applicable coverage of the claim, and upon verification of eligibility.
We refer to these fees/expenses collectively as “claims fees and allowed claims expenses” and these are generally NOT included in
this discussion, although reference is made to them from time to time as deemed appropriate. The claims fees and allowed claims
expenses may be reviewed in the valuation process and any associated changes in unpaid amounts are reflected in the Participation
Report. The collective provision for the claims fees and allowed claims expenses is referred to as the “Retro Claims” provision and is
presented in Table 02b in section 2.2.
At the current time, these “claims expense” type provisions are not adjusted to an actuarial present value basis, as per the practice that
has been in place. This position is being reviewed by management and the Appointed Actuary.
13The loss ratio chart has been limited to show the most recent 20 accident years; the unpaid provision chart has been limited to show
the most recent 20 accident years, and show all accident years older than 20 years collectively as “PRIOR”.
-
10.0%
20.0%
30.0%
40.0%
50.0%
60.0%
70.0%
80.0%
90.0%
1997 1998 1999 2000 2001 2002 2003 2004 2005 2006 2007 2008 2009 2010 2011 2012 2013 2014 2015 2016
All Jurisdictions Private Passenger & Non-Private Passenger Accident Year Loss Ratios @ Oct. 31, 2016
Paid Indemnity as % EP Case Reserves as % EP IBNR for Indemnity (nominal) as % EP Ultimate Indemnity (M/S) as % EP
(20)
-
20
40
60
80
100
120
140
160
180
200
PRIOR 1997 1998 1999 2000 2001 2002 2003 2004 2005 2006 2007 2008 2009 2010 2011 2012 2013 2014 2015 2016
All Jurisdictions Private Passenger & Non-Private Passenger Accident Year Unpaid Claim Amounts @ Oct. 31, 2016
Case Reserves IBNR for Indemnity (nominal) APV Adjustment for Indemnity (M/s) proj. 2016 EP
$ millions
% proj. 2016 EP
apv adj: 18%
nominal unpaid: 185%
Actuarial Highlights – Residual Market
Participation Report October 2016
Page 18 of 118
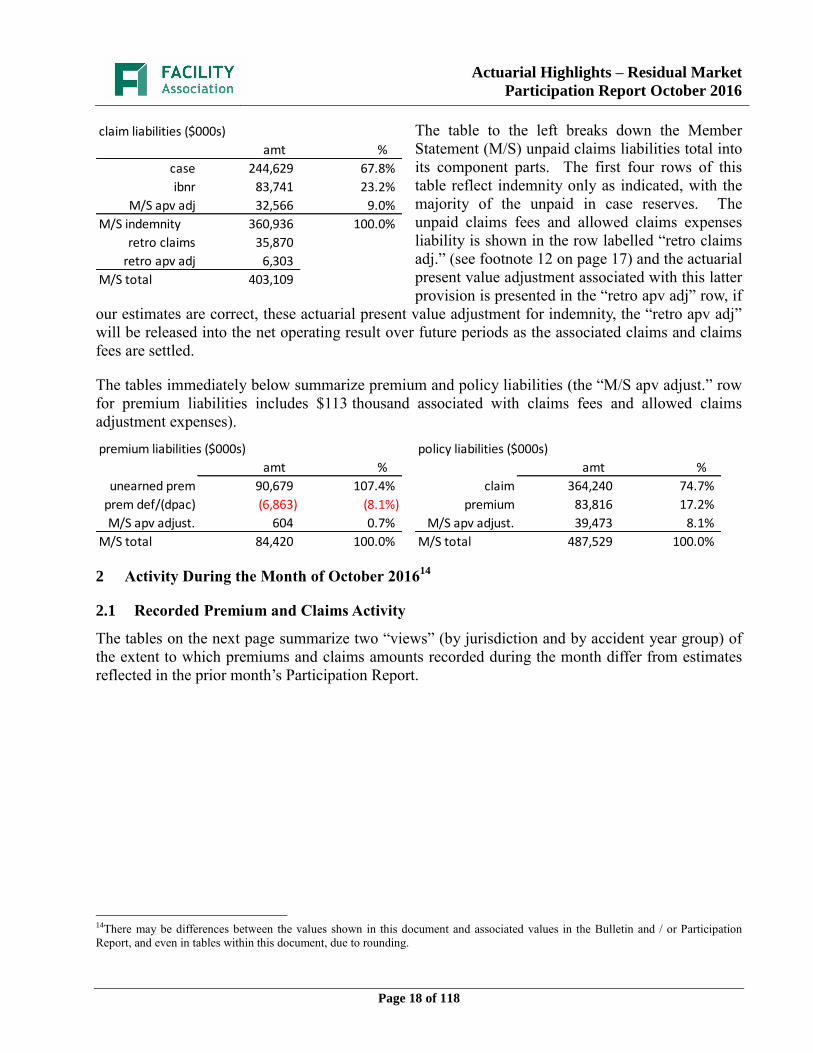
The table to the left breaks down the Member
Statement (M/S) unpaid claims liabilities total into
its component parts. The first four rows of this
table reflect indemnity only as indicated, with the
majority of the unpaid in case reserves. The
unpaid claims fees and allowed claims expenses
liability is shown in the row labelled “retro claims
adj.” (see footnote 12 on page 17) and the actuarial
present value adjustment associated with this latter
provision is presented in the “retro apv adj” row, if
our estimates are correct, these actuarial present value adjustment for indemnity, the “retro apv adj”
will be released into the net operating result over future periods as the associated claims and claims
fees are settled.
The tables immediately below summarize premium and policy liabilities (the “M/S apv adjust.” row
for premium liabilities includes $113 thousand associated with claims fees and allowed claims
adjustment expenses).
2 Activity During the Month of October 201614
2.1 Recorded Premium and Claims Activity
The tables on the next page summarize two “views” (by jurisdiction and by accident year group) of
the extent to which premiums and claims amounts recorded during the month differ from estimates
reflected in the prior month’s Participation Report.
14There may be differences between the values shown in this document and associated values in the Bulletin and / or Participation
Report, and even in tables within this document, due to rounding.
premium liabilities ($000s)
amt %
unearned prem 90,679 107.4%
prem def/(dpac) (6,863) (8.1%)
M/S apv adjust. 604 0.7%
M/S total 84,420 100.0%
policy liabilities ($000s)
amt %
claim 364,240 74.7%
premium 83,816 17.2%
M/S apv adjust. 39,473 8.1%
M/S total 487,529 100.0%
claim liabilities ($000s)
amt %
case 244,629 67.8%
ibnr 83,741 23.2%
M/S apv adj 32,566 9.0%
M/S indemnity 360,936 100.0%
retro claims 35,870
retro apv adj 6,303
M/S total 403,109
Actuarial Highlights – Residual Market
Participation Report October 2016
Page 19 of 118
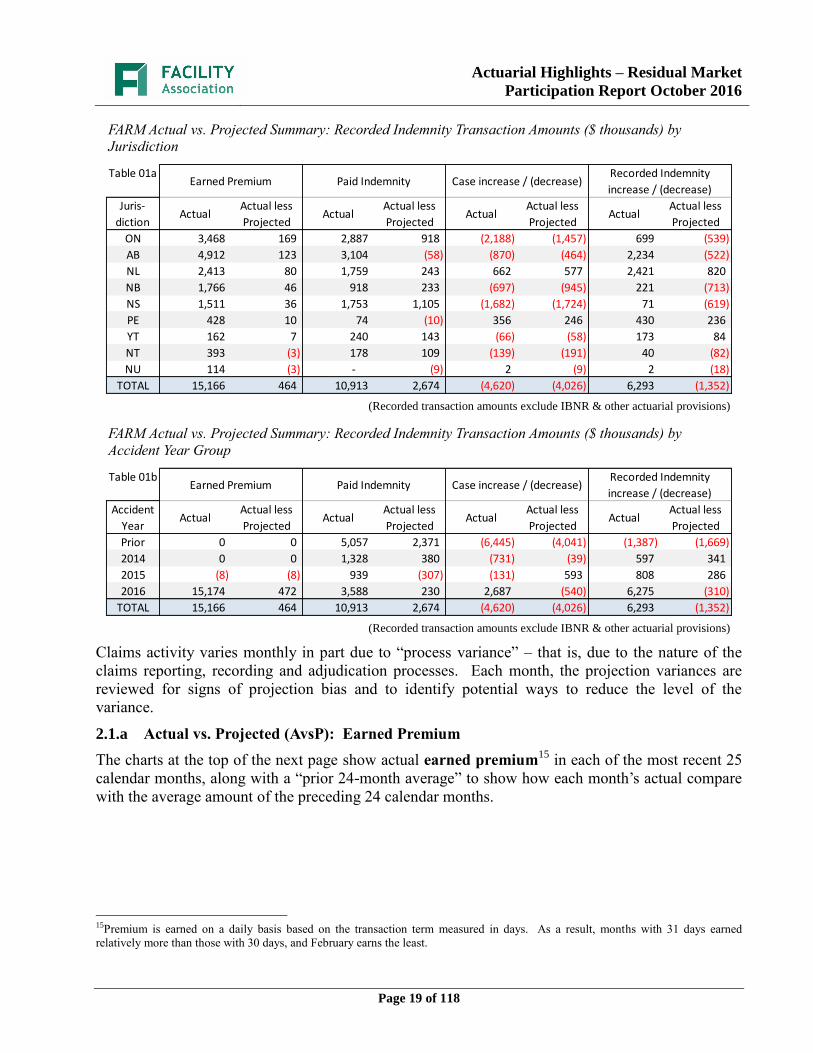
FARM Actual vs. Projected Summary: Recorded Indemnity Transaction Amounts ($ thousands) by
Jurisdiction
(Recorded transaction amounts exclude IBNR & other actuarial provisions)
FARM Actual vs. Projected Summary: Recorded Indemnity Transaction Amounts ($ thousands) by
Accident Year Group
(Recorded transaction amounts exclude IBNR & other actuarial provisions)
Claims activity varies monthly in part due to “process variance” – that is, due to the nature of the
claims reporting, recording and adjudication processes. Each month, the projection variances are
reviewed for signs of projection bias and to identify potential ways to reduce the level of the
variance.
2.1.a Actual vs. Projected (AvsP): Earned Premium
The charts at the top of the next page show actual earned premium15
in each of the most recent 25
calendar months, along with a “prior 24-month average” to show how each month’s actual compare
with the average amount of the preceding 24 calendar months.
15Premium is earned on a daily basis based on the transaction term measured in days. As a result, months with 31 days earned
relatively more than those with 30 days, and February earns the least.
Table 01aEarned Premium Paid Indemnity Case increase / (decrease)
Recorded Indemnity
increase / (decrease)
Juris-
dictionActual
Actual less
ProjectedActual
Actual less
ProjectedActual
Actual less
ProjectedActual
Actual less
Projected
ON 3,468 169 2,887 918 (2,188) (1,457) 699 (539)
AB 4,912 123 3,104 (58) (870) (464) 2,234 (522)
NL 2,413 80 1,759 243 662 577 2,421 820
NB 1,766 46 918 233 (697) (945) 221 (713)
NS 1,511 36 1,753 1,105 (1,682) (1,724) 71 (619)
PE 428 10 74 (10) 356 246 430 236
YT 162 7 240 143 (66) (58) 173 84
NT 393 (3) 178 109 (139) (191) 40 (82)
NU 114 (3) - (9) 2 (9) 2 (18)
TOTAL 15,166 464 10,913 2,674 (4,620) (4,026) 6,293 (1,352)
Table 01bEarned Premium Paid Indemnity Case increase / (decrease)
Recorded Indemnity
increase / (decrease)
Accident
YearActual
Actual less
ProjectedActual
Actual less
ProjectedActual
Actual less
ProjectedActual
Actual less
Projected
Prior 0 0 5,057 2,371 (6,445) (4,041) (1,387) (1,669)
2014 0 0 1,328 380 (731) (39) 597 341
2015 (8) (8) 939 (307) (131) 593 808 286
2016 15,174 472 3,588 230 2,687 (540) 6,275 (310)
TOTAL 15,166 464 10,913 2,674 (4,620) (4,026) 6,293 (1,352)
Actuarial Highlights – Residual Market
Participation Report October 2016
Page 20 of 118
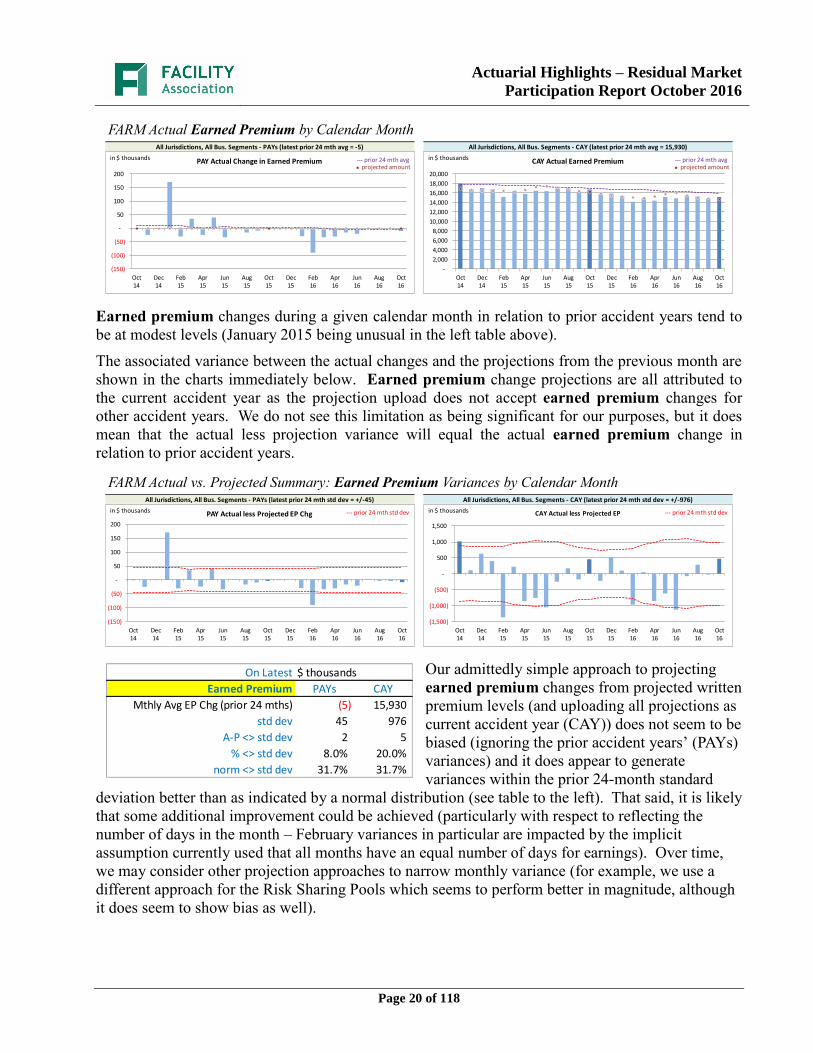
FARM Actual Earned Premium by Calendar Month
Earned premium changes during a given calendar month in relation to prior accident years tend to
be at modest levels (January 2015 being unusual in the left table above).
The associated variance between the actual changes and the projections from the previous month are
shown in the charts immediately below. Earned premium change projections are all attributed to
the current accident year as the projection upload does not accept earned premium changes for
other accident years. We do not see this limitation as being significant for our purposes, but it does
mean that the actual less projection variance will equal the actual earned premium change in
relation to prior accident years.
FARM Actual vs. Projected Summary: Earned Premium Variances by Calendar Month
Our admittedly simple approach to projecting
earned premium changes from projected written
premium levels (and uploading all projections as
current accident year (CAY)) does not seem to be
biased (ignoring the prior accident years’ (PAYs)
variances) and it does appear to generate
variances within the prior 24-month standard
deviation better than as indicated by a normal distribution (see table to the left). That said, it is likely
that some additional improvement could be achieved (particularly with respect to reflecting the
number of days in the month – February variances in particular are impacted by the implicit
assumption currently used that all months have an equal number of days for earnings). Over time,
we may consider other projection approaches to narrow monthly variance (for example, we use a
different approach for the Risk Sharing Pools which seems to perform better in magnitude, although
it does seem to show bias as well).
All Jurisdictions, All Bus. Segments - PAYs (latest prior 24 mth avg = -5) All Jurisdictions, All Bus. Segments - CAY (latest prior 24 mth avg = 15,930)
(150)
(100)
(50)
-
50
100
150
200
Oct14
Dec14
Feb15
Apr15
Jun15
Aug15
Oct15
Dec15
Feb16
Apr16
Jun16
Aug16
Oct16
PAY Actual Change in Earned Premiumin $ thousands --- prior 24 mth avg
-
2,000
4,000
6,000
8,000
10,000
12,000
14,000
16,000
18,000
20,000
Oct14
Dec14
Feb15
Apr15
Jun15
Aug15
Oct15
Dec15
Feb16
Apr16
Jun16
Aug16
Oct16
CAY Actual Earned Premiumin $ thousands --- prior 24 mth avgprojected amount projected amount
All Jurisdictions, All Bus. Segments - PAYs (latest prior 24 mth std dev = +/-45) All Jurisdictions, All Bus. Segments - CAY (latest prior 24 mth std dev = +/-976)
(150)
(100)
(50)
-
50
100
150
200
Oct14
Dec14
Feb15
Apr15
Jun15
Aug15
Oct15
Dec15
Feb16
Apr16
Jun16
Aug16
Oct16
PAY Actual less Projected EP Chgin $ thousands --- prior 24 mth std dev
(1,500)
(1,000)
(500)
-
500
1,000
1,500
Oct14
Dec14
Feb15
Apr15
Jun15
Aug15
Oct15
Dec15
Feb16
Apr16
Jun16
Aug16
Oct16
CAY Actual less Projected EPin $ thousands --- prior 24 mth std dev
On Latest $ thousands
Earned Premium PAYs CAY
Mthly Avg EP Chg (prior 24 mths) (5) 15,930
std dev 45 976
A-P <> std dev 2 5
% <> std dev 8.0% 20.0%
norm <> std dev 31.7% 31.7%

Actuarial Highlights – Residual Market
Participation Report October 2016
Page 21 of 118
2.1.b AvsP: Recorded Indemnity
The charts immediately below show actual recorded indemnity activity (paid indemnity plus case
changes) in each of the most recent 25 calendar months, along with a “prior 24-month average” to
show how each month’s actual compares with the average amount of the preceding 24 calendar
months.
FARM Actual Recorded Indemnity by Calendar Month
Recorded indemnity activity variances from the previous month’s projections are shown in the
charts immediately below, including the “prior 24-month standard deviation” levels.
FARM Actual vs. Projected Summary: Recorded Indemnity Variances by Calendar Month
The prior accident years (PAYs) recorded
indemnity variances (see left chart above) have
fallen outside of the period’s standard deviation
36% of the time (see left table), suggesting the
projection process performs worse than simply
projecting based on the previous 24-month
average. In addition, there was evidence of bias
through 2014 to the end of 2015 (where actuals tended to be lower than our projections), although
we were unable to identify any particular source of bias to-date (we project at a more granular level
i.e. jurisdiction, business segment and accident year), more recent results do not seem to show this
bias continuing. We continue to review to look for ways to improve the projections.
The current accident year (CAY) recorded indemnity variances (right chart above) over the period
has not indicated a systemic bias overall and with monthly variances falling outside of the period
standard deviation 12% of the time, the projection process appears to perform better than simply
projecting based on the previous 24-month average.
All Jurisdictions, All Bus. Segments - PAYs (latest prior 24 mth avg = 2,647) All Jurisdictions, All Bus. Segments - CAY (latest prior 24 mth avg = 6,363)
(4,000)
(2,000)
-
2,000
4,000
6,000
8,000
10,000
Oct14
Dec14
Feb15
Apr15
Jun15
Aug15
Oct15
Dec15
Feb16
Apr16
Jun16
Aug16
Oct16
PAY Actual Recordedin $ thousands --- prior 24 mth avg
-
2,000
4,000
6,000
8,000
10,000
12,000
Oct14
Dec14
Feb15
Apr15
Jun15
Aug15
Oct15
Dec15
Feb16
Apr16
Jun16
Aug16
Oct16
CAY Actual Recordedin $ thousands --- prior 24 mth avgprojected amount projected amount
All Jurisdictions, All Bus. Segments - PAYs (latest prior 24 mth std dev = +/-2,777) All Jurisdictions, All Bus. Segments - CAY (latest prior 24 mth std dev = +/-1,743)
(6,000)
(4,000)
(2,000)
-
2,000
4,000
6,000
Oct14
Dec14
Feb15
Apr15
Jun15
Aug15
Oct15
Dec15
Feb16
Apr16
Jun16
Aug16
Oct16
PAY Actual less Projected Recordedin $ thousands --- prior 24 mth std dev
(2,500)
(2,000)
(1,500)
(1,000)
(500)
-
500
1,000
1,500
2,000
2,500
3,000
Oct14
Dec14
Feb15
Apr15
Jun15
Aug15
Oct15
Dec15
Feb16
Apr16
Jun16
Aug16
Oct16
CAY Actual less Projected Recordedin $ thousands --- prior 24 mth std dev
On Latest $ thousands
Recorded PAYs CAY
Mthly Avg Recorded (prior 24 mths) 2,647 6,363
std dev 2,777 1,743
A-P <> std dev 9 3
% <> std dev 36.0% 12.0%
norm <> std dev 31.7% 31.7%
Actuarial Highlights – Residual Market
Participation Report October 2016
Page 22 of 118
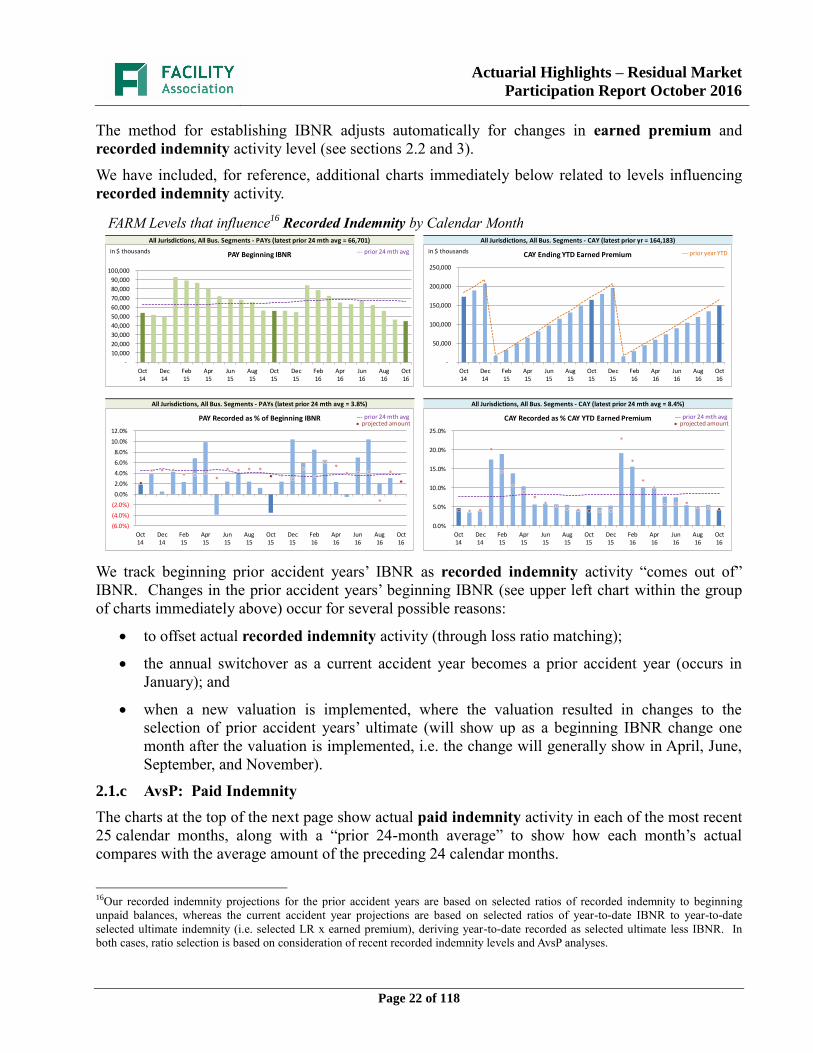
The method for establishing IBNR adjusts automatically for changes in earned premium and
recorded indemnity activity level (see sections 2.2 and 3).
We have included, for reference, additional charts immediately below related to levels influencing
recorded indemnity activity.
FARM Levels that influence16
Recorded Indemnity by Calendar Month
We track beginning prior accident years’ IBNR as recorded indemnity activity “comes out of”
IBNR. Changes in the prior accident years’ beginning IBNR (see upper left chart within the group
of charts immediately above) occur for several possible reasons:
to offset actual recorded indemnity activity (through loss ratio matching);
the annual switchover as a current accident year becomes a prior accident year (occurs in
January); and
when a new valuation is implemented, where the valuation resulted in changes to the
selection of prior accident years’ ultimate (will show up as a beginning IBNR change one
month after the valuation is implemented, i.e. the change will generally show in April, June,
September, and November).
2.1.c AvsP: Paid Indemnity
The charts at the top of the next page show actual paid indemnity activity in each of the most recent
25 calendar months, along with a “prior 24-month average” to show how each month’s actual
compares with the average amount of the preceding 24 calendar months.
16Our recorded indemnity projections for the prior accident years are based on selected ratios of recorded indemnity to beginning
unpaid balances, whereas the current accident year projections are based on selected ratios of year-to-date IBNR to year-to-date
selected ultimate indemnity (i.e. selected LR x earned premium), deriving year-to-date recorded as selected ultimate less IBNR. In
both cases, ratio selection is based on consideration of recent recorded indemnity levels and AvsP analyses.
All Jurisdictions, All Bus. Segments - PAYs (latest prior 24 mth avg = 66,701) All Jurisdictions, All Bus. Segments - CAY (latest prior yr = 164,183)
-
10,000
20,000
30,000
40,000
50,000
60,000
70,000
80,000
90,000
100,000
Oct14
Dec14
Feb15
Apr15
Jun15
Aug15
Oct15
Dec15
Feb16
Apr16
Jun16
Aug16
Oct16
PAY Beginning IBNRin $ thousands --- prior 24 mth avg
-
50,000
100,000
150,000
200,000
250,000
Oct14
Dec14
Feb15
Apr15
Jun15
Aug15
Oct15
Dec15
Feb16
Apr16
Jun16
Aug16
Oct16
CAY Ending YTD Earned Premiumin $ thousands --- prior year YTD
All Jurisdictions, All Bus. Segments - PAYs (latest prior 24 mth avg = 3.8%) All Jurisdictions, All Bus. Segments - CAY (latest prior 24 mth avg = 8.4%)
Mthly Avg Rec'd to Beg'n IBNR (prior 24 mths)
Actual Rec'd to Beginning IBNR Ratio
(6.0%)
(4.0%)
(2.0%)
0.0%
2.0%
4.0%
6.0%
8.0%
10.0%
12.0%
Oct14
Dec14
Feb15
Apr15
Jun15
Aug15
Oct15
Dec15
Feb16
Apr16
Jun16
Aug16
Oct16
PAY Recorded as % of Beginning IBNR --- prior 24 mth avg
0.0%
5.0%
10.0%
15.0%
20.0%
25.0%
Oct14
Dec14
Feb15
Apr15
Jun15
Aug15
Oct15
Dec15
Feb16
Apr16
Jun16
Aug16
Oct16
CAY Recorded as % CAY YTD Earned Premium --- prior 24 mth avgprojected amount projected amount

Actuarial Highlights – Residual Market
Participation Report October 2016
Page 23 of 118
FARM Actual Paid Indemnity by Calendar Month
The charts immediately below show actual less projected paid indemnity activity for the last 25
calendar months, along with bands for the “prior 24-month standard deviations” to show how the
variances from projection compare with historical standard deviations.
FARM Actual vs. Projected Summary: Paid Indemnity Variances by Calendar Month
The prior accident years (PAYs) paid indemnity
variances (left chart above) over the entire period
shown do not seem to indicate evidence of bias.
The variances have fallen outside of the period’s
standard deviation 20% of the time (see table on
left) and as this is fewer than indicated by the
normal distribution, it suggests the projection
process performs better than simply projecting based on the previous 24-month average.
The current accident year (CAY) paid indemnity variances have fallen outside of one standard
deviation of the preceding 24-month period approximately 16% of the time, suggesting that the
projection process performs better than simply projecting based on the prior 24-month average. As
well, there does not seem to be evidence of bias.
We have included, for reference, additional charts at the top of the next page related to levels
influencing paid indemnity activity.
All Jurisdictions, All Bus. Segments - PAYs (latest prior 24 mth avg = 7,082) All Jurisdictions, All Bus. Segments - CAY (latest prior 24 mth avg = 2,882)
-
2,000
4,000
6,000
8,000
10,000
12,000
14,000
16,000
18,000
Oct14
Dec14
Feb15
Apr15
Jun15
Aug15
Oct15
Dec15
Feb16
Apr16
Jun16
Aug16
Oct16
PAY Actual Paidin $ thousands --- prior 24 mth avg
-
1,000
2,000
3,000
4,000
5,000
6,000
Oct14
Dec14
Feb15
Apr15
Jun15
Aug15
Oct15
Dec15
Feb16
Apr16
Jun16
Aug16
Oct16
CAY Actual Paidin $ thousands --- prior 24 mth avgprojected amount projected amount
All Jurisdictions, All Bus. Segments - PAYs (latest prior 24 mth std dev = +/-3,188) All Jurisdictions, All Bus. Segments - CAY (latest prior 24 mth std dev = +/-1,181)
(6,000)
(4,000)
(2,000)
-
2,000
4,000
6,000
8,000
10,000
Oct14
Dec14
Feb15
Apr15
Jun15
Aug15
Oct15
Dec15
Feb16
Apr16
Jun16
Aug16
Oct16
PAY Actual less Projected Paidin $ thousands --- prior 24 mth std dev
(1,500)
(1,000)
(500)
-
500
1,000
1,500
2,000
Oct14
Dec14
Feb15
Apr15
Jun15
Aug15
Oct15
Dec15
Feb16
Apr16
Jun16
Aug16
Oct16
CAY Actual less Projected Paidin $ thousands --- prior 24 mth std dev
On Latest $ thousands
Paid PAYs CAY
Mthly Avg Paid (prior 24 mths) 7,082 2,882
std dev 3,188 1,181
A-P <> std dev 5 4
% <> std dev 20.0% 16.0%
norm <> std dev 31.7% 31.7%

Actuarial Highlights – Residual Market
Participation Report October 2016
Page 24 of 118
FARM Levels that influence17
Paid Indemnity by Calendar Month
We track beginning prior accident years’ unpaid balance (case and IBNR) as paid indemnity activity
“comes out of” the unpaid balance. Changes in the prior accident years’ beginning unpaid balance
(see upper left chart within the group of charts immediately above) occur for several possible
reasons:
to offset actual paid indemnity activity (may reduce case or IBNR or both);
the annual switchover as a current accident year becomes a prior accident year (occurs in
January); and
when a new valuation is implemented, where the valuation resulted in changes to the
selection of prior accident years’ ultimate (will show up as a beginning unpaid balance
change one month after the valuation is implemented, i.e. the change will generally show in
April, June, September, and November).
2.2 Actuarial Provisions
An “ultimate loss ratio matching method” (described in section 3) is used to determine the month’s
IBNR18
for accident years 1994 and later (IBNR is kept at $0 for accident years 1993 and earlier).
Factors are applied to the nominal unpaid claims liability (case plus IBNR – for indemnity only) to
determine the discount amount (shown as a negative value to indicate its impact of reducing the
liability) and the Provisions for Adverse Deviations.
17Our projections for the prior accident years are based on selected ratios of paid indemnity to beginning unpaid balances, whereas the
current accident year projections are based on selected ratios of year-to-date paid indemnity to year-to-date selected ultimate
indemnity (i.e. selected LR x earned premium). In both cases, ratio selection is based on consideration of recent paid indemnity levels
and AvsP analyses.
18For ease of discussion, “IBNR” is used in place of “provisions for incurred but not recorded (IBNR) and development”.
All Jurisdictions, All Bus. Segments - PAYs (latest prior 24 mth avg = 300,500) All Jurisdictions, All Bus. Segments - CAY (latest prior yr = 164,183)
-
50,000
100,000
150,000
200,000
250,000
300,000
350,000
400,000
Oct14
Dec14
Feb15
Apr15
Jun15
Aug15
Oct15
Dec15
Feb16
Apr16
Jun16
Aug16
Oct16
PAY Beginning Unpaidin $ thousands --- prior 24 mth avg
n IBNRn case
-
50,000
100,000
150,000
200,000
250,000
Oct14
Dec14
Feb15
Apr15
Jun15
Aug15
Oct15
Dec15
Feb16
Apr16
Jun16
Aug16
Oct16
CAY Ending YTD Earned Premiumin $ thousands --- prior year YTD
All Jurisdictions, All Bus. Segments - PAYs (latest prior 24 mth avg = 2.3%) All Jurisdictions, All Bus. Segments - CAY (latest prior 24 mth avg = 3.2%)
0.0%
1.0%
2.0%
3.0%
4.0%
5.0%
6.0%
7.0%
Oct14
Dec14
Feb15
Apr15
Jun15
Aug15
Oct15
Dec15
Feb16
Apr16
Jun16
Aug16
Oct16
PAY Paid as % Beginning Unpaid --- prior 24 mth avg
0.0%
1.0%
2.0%
3.0%
4.0%
5.0%
6.0%
7.0%
Oct14
Dec14
Feb15
Apr15
Jun15
Aug15
Oct15
Dec15
Feb16
Apr16
Jun16
Aug16
Oct16
CAY Paid as % CAY YTD Earned Premium --- prior 24 mth avgprojected amount projected amount
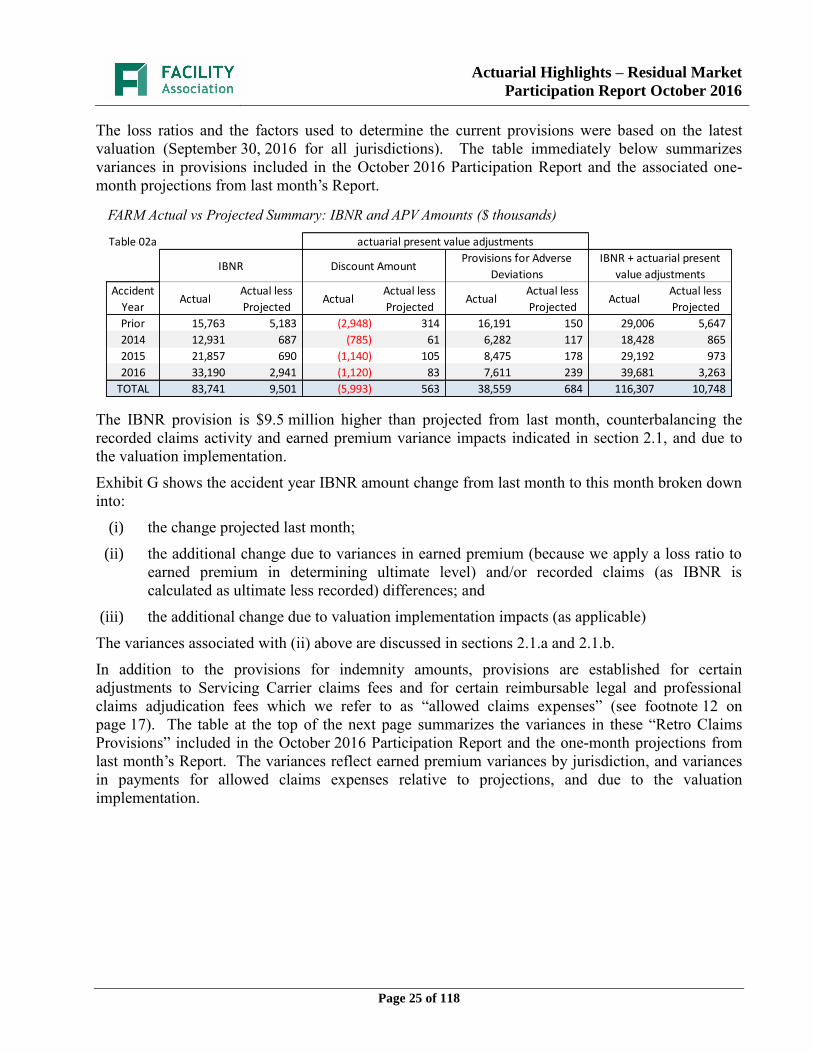
Actuarial Highlights – Residual Market
Participation Report October 2016
Page 25 of 118
The loss ratios and the factors used to determine the current provisions were based on the latest
valuation (September 30, 2016 for all jurisdictions). The table immediately below summarizes
variances in provisions included in the October 2016 Participation Report and the associated one-
month projections from last month’s Report.
FARM Actual vs Projected Summary: IBNR and APV Amounts ($ thousands)
The IBNR provision is $9.5 million higher than projected from last month, counterbalancing the
recorded claims activity and earned premium variance impacts indicated in section 2.1, and due to
the valuation implementation.
Exhibit G shows the accident year IBNR amount change from last month to this month broken down
into:
(i) the change projected last month;
(ii) the additional change due to variances in earned premium (because we apply a loss ratio to
earned premium in determining ultimate level) and/or recorded claims (as IBNR is
calculated as ultimate less recorded) differences; and
(iii) the additional change due to valuation implementation impacts (as applicable)
The variances associated with (ii) above are discussed in sections 2.1.a and 2.1.b.
In addition to the provisions for indemnity amounts, provisions are established for certain
adjustments to Servicing Carrier claims fees and for certain reimbursable legal and professional
claims adjudication fees which we refer to as “allowed claims expenses” (see footnote 12 on
page 17). The table at the top of the next page summarizes the variances in these “Retro Claims
Provisions” included in the October 2016 Participation Report and the one-month projections from
last month’s Report. The variances reflect earned premium variances by jurisdiction, and variances
in payments for allowed claims expenses relative to projections, and due to the valuation
implementation.
Table 02a actuarial present value adjustments
IBNR Discount AmountProvisions for Adverse
Deviations
IBNR + actuarial present
value adjustments
Accident
YearActual
Actual less
ProjectedActual
Actual less
ProjectedActual
Actual less
ProjectedActual
Actual less
Projected
Prior 15,763 5,183 (2,948) 314 16,191 150 29,006 5,647
2014 12,931 687 (785) 61 6,282 117 18,428 865
2015 21,857 690 (1,140) 105 8,475 178 29,192 973
2016 33,190 2,941 (1,120) 83 7,611 239 39,681 3,263
TOTAL 83,741 9,501 (5,993) 563 38,559 684 116,307 10,748
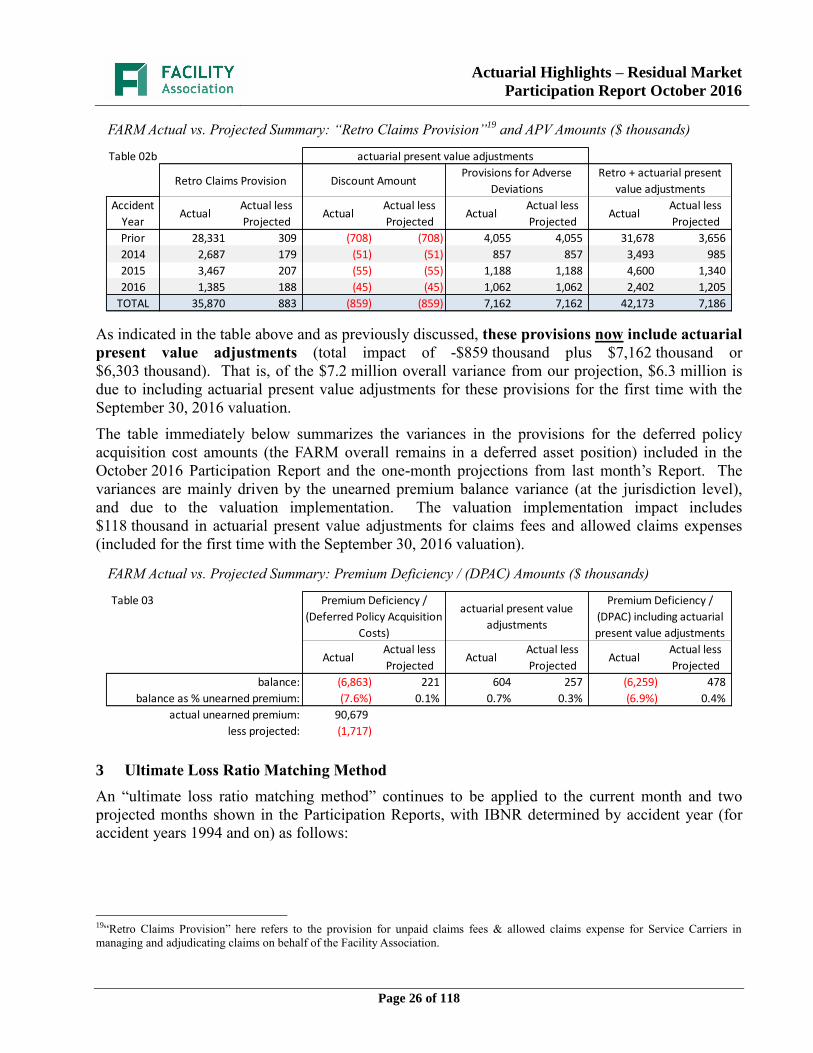
Actuarial Highlights – Residual Market
Participation Report October 2016
Page 26 of 118
FARM Actual vs. Projected Summary: “Retro Claims Provision”19
and APV Amounts ($ thousands)
As indicated in the table above and as previously discussed, these provisions now include actuarial
present value adjustments (total impact of -$859 thousand plus $7,162 thousand or
$6,303 thousand). That is, of the $7.2 million overall variance from our projection, $6.3 million is
due to including actuarial present value adjustments for these provisions for the first time with the
September 30, 2016 valuation.
The table immediately below summarizes the variances in the provisions for the deferred policy
acquisition cost amounts (the FARM overall remains in a deferred asset position) included in the
October 2016 Participation Report and the one-month projections from last month’s Report. The
variances are mainly driven by the unearned premium balance variance (at the jurisdiction level),
and due to the valuation implementation. The valuation implementation impact includes
$118 thousand in actuarial present value adjustments for claims fees and allowed claims expenses
(included for the first time with the September 30, 2016 valuation).
FARM Actual vs. Projected Summary: Premium Deficiency / (DPAC) Amounts ($ thousands)
3 Ultimate Loss Ratio Matching Method
An “ultimate loss ratio matching method” continues to be applied to the current month and two
projected months shown in the Participation Reports, with IBNR determined by accident year (for
accident years 1994 and on) as follows:
19“Retro Claims Provision” here refers to the provision for unpaid claims fees & allowed claims expense for Service Carriers in
managing and adjudicating claims on behalf of the Facility Association.
Table 02b actuarial present value adjustments
Retro Claims Provision Discount AmountProvisions for Adverse
Deviations
Retro + actuarial present
value adjustments
Accident
YearActual
Actual less
ProjectedActual
Actual less
ProjectedActual
Actual less
ProjectedActual
Actual less
Projected
Prior 28,331 309 (708) (708) 4,055 4,055 31,678 3,656
2014 2,687 179 (51) (51) 857 857 3,493 985
2015 3,467 207 (55) (55) 1,188 1,188 4,600 1,340
2016 1,385 188 (45) (45) 1,062 1,062 2,402 1,205
TOTAL 35,870 883 (859) (859) 7,162 7,162 42,173 7,186
Table 03 Premium Deficiency /
(Deferred Policy Acquisition
Costs)
actuarial present value
adjustments
Premium Deficiency /
(DPAC) including actuarial
present value adjustments
ActualActual less
ProjectedActual
Actual less
ProjectedActual
Actual less
Projected
balance: (6,863) 221 604 257 (6,259) 478
balance as % unearned premium: (7.6%) 0.1% 0.7% 0.3% (6.9%) 0.4%
actual unearned premium: 90,679
less projected: (1,717)

Actuarial Highlights – Residual Market
Participation Report October 2016
Page 27 of 118
(a) Earned premium to date
(b) Ultimate loss20
ratio per latest valuation
(c) Estimated ultimate incurred = (a) x (b)
(d) Recorded indemnity to date
(e) IBNR = (c) – (d)
IBNR for accident years 1993 and earlier is kept at $0. For the two projected months, IBNR was
determined in a similar way, incorporating the two-month projections of earned premiums and
recorded indemnity. Prior to actuarial present value adjustments, any expected emergence of
recorded claims amounts pertaining to “prior accident years”21
during the two-month projection
period is assumed to be offset by changes in IBNR. Furthermore, the implied ultimate loss ratios
pertaining to each accident year (including the current accident year) are the same in the current
month as in the two projected months.
A similar approach is used in determining the part of the “Retro Claims Provisions” in relation to the
allowed claims expenses. That is, an ultimate “ratio” is determined akin to the “loss ratio”, and the
provision is set following a process as outlined above.
4 Calendar Year-to-Date Results
The table immediately below summarizes the calendar year-to-date results for indemnity as well as
Servicing Carrier claims fees & allowed claims expenses. In determining the ratios to earned
premium, the calendar year-to-date earned premium has been used, which includes earned premium
associated with the current accident year but also earned premium adjustments related to prior
accident years.
FARM Calendar Year-to-Date Indemnity, Claims Fees & Allowed Claims Expense Summary ($ thousands)
(“% EP” based on 2016 calendar year-to-date earned premium; ratios may not total due to rounding)
The loss ratio change year-to-date in Table 04 reflects not only changes in the prior accident year
levels, but also the increase in the calendar year-to-date earned premium with an additional month’s
earned premium, and due to the valuation implementation.
For the current accident year, changes in the year-to-date total reflect the additional month’s
exposure and regular changes to actuarial present value adjustments as the year ages.
5 Current Participation Report – Additional Exhibits
Section 6 provides exhibits pertaining to the actuarial provisions reflected in the current month’s
Participation Report.
20“Loss” here refers to indemnity only unless otherwise noted.
21“Prior accident years” and the “current accident year” are defined relative to the calendar year associated with the projection period.
Table 04YTD Nominal Values
YTD actuarial present value
adjustmentYTD Total Change from Prior Month YTD
Amount % EP Amount % EP Amount % EP Amount LR pts
PAYs (7,747) (5.8%) (5,144) (3.8%) (12,891) (9.6%) (341) 0.9%
CAY 93,726 69.8% 5,647 4.2% 99,373 74.0% 10,801 (0.1%)
TOTAL 85,978 64.0% 503 0.4% 86,481 64.4% 10,460 0.8%

Actuarial Highlights – Residual Market
Participation Report October 2016
Page 28 of 118
IBNR (including actuarial present value adjustments) presented in section 6, Exhibit A, were derived
on a discounted basis, and therefore reflect the time value of money and includes explicit provisions
for adverse deviations in accordance with accepted actuarial practice in Canada.
IBNR presented in section 6, Exhibit B, does NOT include any actuarial present value adjustments.
The “Total IBNR” from this exhibit is shown in the Participation Report as “Undiscounted IBNR”.
As discussed in section 3, IBNR in the current month’s Participation Report was derived as the
difference between the estimated ultimate for the claims amount (i.e. earned premium x ultimate loss
ratio) and the associated current recorded amounts (life-to-date payments plus current case reserves).
6 EXHIBITS
The exhibits listed below are provided on the pages that follow22
:
EXHIBIT A IBNR for Member Sharing – includes Actuarial Present Value Adjustments
EXHIBIT B IBNR
EXHIBIT C Retro Provisions
C-1 for Member Sharing – includes Actuarial Present Value Adjustments
C-1 Nominal Basis – i.e. excludes Actuarial Present Value Adjustments
EXHIBIT D Future Expected Cost Ratios
EXHIBIT E Discount Rate & Margins for Adverse Deviations
EXHIBIT F Interest Rate Sensitivity
EXHIBIT G Components of IBNR Change During Month:
G-1 IBNR for Member Sharing – includes Actuarial Present Value
Adjustments
G-2 IBNR
EXHIBIT H Projected Year-end Policy Liabilities
22 Note that the former Exhibit C has been now split into 2 sections to reflect the introduction of actuarial present value adjustments
for the provisions for Servicing Carrier claims fees and allowed claims expenses (collectively referred to as “retro provisions”).

Actuarial Highlights – Residual Market
Participation Report October 2016
Page 29 of 118
EXHIBIT A
IBNR ($s) for Member Sharing – includes Actuarial Present Value Adjustments
page 1 of 10
Please see Exhibit G-1, page 1 for Components of Change during Current Month
Jurisdiction Desc Newfoundland &
Labrador discount rate: 0.62%
AccountCode Desc IBNR Provision interest rate margin: 25 basis pts
AccountCode (All)
AccidentYear (All)
Prior Month Current Month 1st Projected 2nd Projected
Sum of Amount ShareYYMM
BusinessSegment Desc Acc Year 201609 201610 201611 201612
Private Passenger prior 21,000 26,000 26,000 25,000
2007 17,000 18,000 17,000 17,000
2008 23,000 23,000 22,000 22,000
2009 110,000 39,000 38,000 37,000
2010 69,000 15,000 14,000 14,000
2011 187,000 182,000 178,000 175,000
2012 201,000 248,000 244,000 240,000
2013 564,000 612,000 589,000 577,000
2014 1,696,000 1,447,000 1,350,000 1,347,000
2015 2,184,000 1,863,000 1,722,000 1,723,000
2016 3,030,000 3,582,000 3,655,000 3,850,000
Private Passenger Total 8,102,000 8,055,000 7,855,000 8,027,000
Non Private Passenger prior 4,000 4,000 4,000 4,000
2007 67,000 73,000 70,000 69,000
2008 - - -
2009 3,000 3,000 3,000 3,000
2010 17,000 18,000 18,000 18,000
2011 229,000 146,000 143,000 141,000
2012 395,000 321,000 315,000 308,000
2013 358,000 355,000 347,000 341,000
2014 1,273,000 1,184,000 1,103,000 1,080,000
2015 1,105,000 1,190,000 1,102,000 1,056,000
2016 2,206,000 2,778,000 2,809,000 2,943,000
Non Private Passenger Total 5,657,000 6,072,000 5,914,000 5,963,000
Grand Total 13,759,000 14,127,000 13,769,000 13,990,000
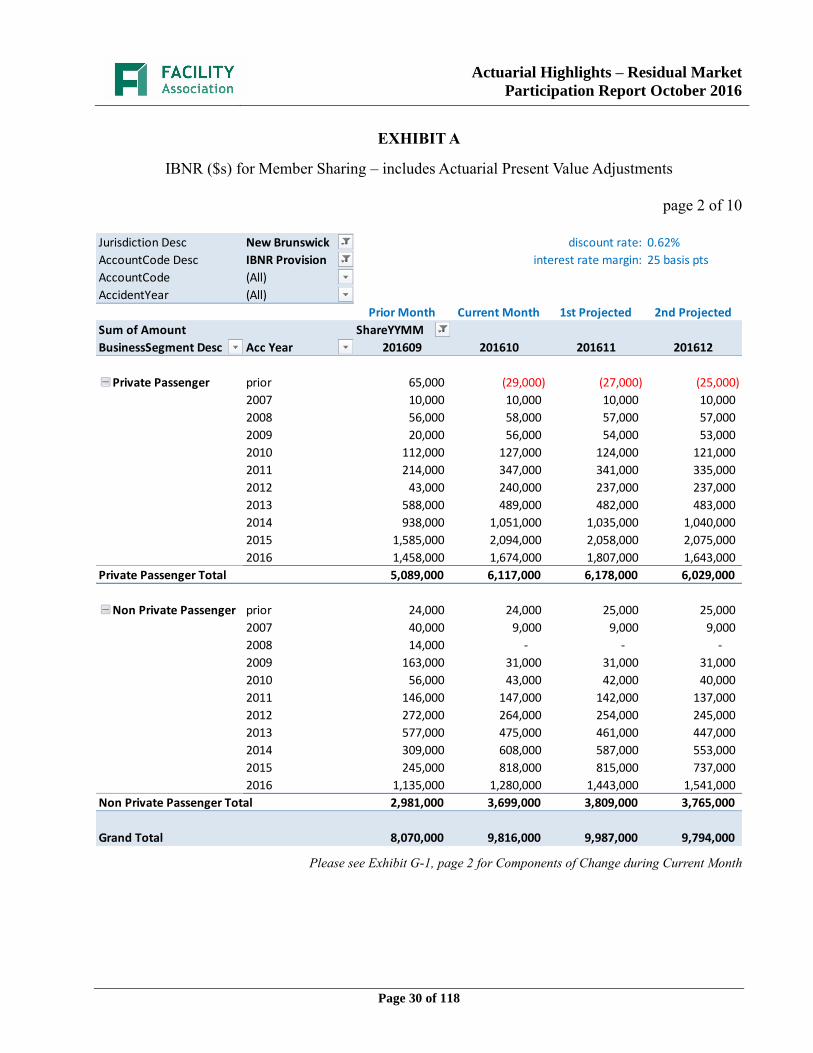
Actuarial Highlights – Residual Market
Participation Report October 2016
Page 30 of 118
EXHIBIT A
IBNR ($s) for Member Sharing – includes Actuarial Present Value Adjustments
page 2 of 10
Please see Exhibit G-1, page 2 for Components of Change during Current Month
Jurisdiction Desc New Brunswick discount rate: 0.62%
AccountCode Desc IBNR Provision interest rate margin: 25 basis pts
AccountCode (All)
AccidentYear (All)
Prior Month Current Month 1st Projected 2nd Projected
Sum of Amount ShareYYMM
BusinessSegment Desc Acc Year 201609 201610 201611 201612
Private Passenger prior 65,000 (29,000) (27,000) (25,000)
2007 10,000 10,000 10,000 10,000
2008 56,000 58,000 57,000 57,000
2009 20,000 56,000 54,000 53,000
2010 112,000 127,000 124,000 121,000
2011 214,000 347,000 341,000 335,000
2012 43,000 240,000 237,000 237,000
2013 588,000 489,000 482,000 483,000
2014 938,000 1,051,000 1,035,000 1,040,000
2015 1,585,000 2,094,000 2,058,000 2,075,000
2016 1,458,000 1,674,000 1,807,000 1,643,000
Private Passenger Total 5,089,000 6,117,000 6,178,000 6,029,000
Non Private Passenger prior 24,000 24,000 25,000 25,000
2007 40,000 9,000 9,000 9,000
2008 14,000 - - -
2009 163,000 31,000 31,000 31,000
2010 56,000 43,000 42,000 40,000
2011 146,000 147,000 142,000 137,000
2012 272,000 264,000 254,000 245,000
2013 577,000 475,000 461,000 447,000
2014 309,000 608,000 587,000 553,000
2015 245,000 818,000 815,000 737,000
2016 1,135,000 1,280,000 1,443,000 1,541,000
Non Private Passenger Total 2,981,000 3,699,000 3,809,000 3,765,000
Grand Total 8,070,000 9,816,000 9,987,000 9,794,000

Actuarial Highlights – Residual Market
Participation Report October 2016
Page 31 of 118
EXHIBIT A
IBNR ($s) for Member Sharing – includes Actuarial Present Value Adjustments
page 3 of 10
Please see Exhibit G-1, page 3 for Components of Change during Current Month
Jurisdiction Desc Nova Scotia discount rate: 0.62%
AccountCode Desc IBNR Provision interest rate margin: 25 basis pts
AccountCode (All)
AccidentYear (All)
Prior Month Current Month 1st Projected 2nd Projected
Sum of Amount ShareYYMM
BusinessSegment Desc Acc Year 201609 201610 201611 201612
Private Passenger prior 585,000 365,000 358,000 351,000
2007 192,000 145,000 142,000 141,000
2008 3,000 271,000 264,000 259,000
2009 141,000 59,000 58,000 56,000
2010 (3,000) (71,000) (69,000) (67,000)
2011 20,000 22,000 22,000 21,000
2012 377,000 113,000 113,000 111,000
2013 161,000 160,000 158,000 143,000
2014 645,000 569,000 588,000 547,000
2015 1,016,000 887,000 918,000 817,000
2016 1,368,000 1,534,000 1,702,000 1,727,000
Private Passenger Total 4,505,000 4,054,000 4,254,000 4,106,000
Non Private Passenger prior 6,000 19,000 19,000 19,000
2007 (5,000) (5,000) (5,000) (5,000)
2008 17,000 19,000 18,000 18,000
2009 (5,000) (5,000) (5,000) (5,000)
2010 25,000 27,000 26,000 25,000
2011 95,000 140,000 138,000 135,000
2012 104,000 94,000 92,000 91,000
2013 (279,000) 312,000 304,000 299,000
2014 276,000 439,000 432,000 422,000
2015 1,760,000 1,765,000 1,614,000 1,464,000
2016 1,911,000 2,278,000 2,502,000 2,601,000
Non Private Passenger Total 3,905,000 5,083,000 5,135,000 5,064,000
Grand Total 8,410,000 9,137,000 9,389,000 9,170,000
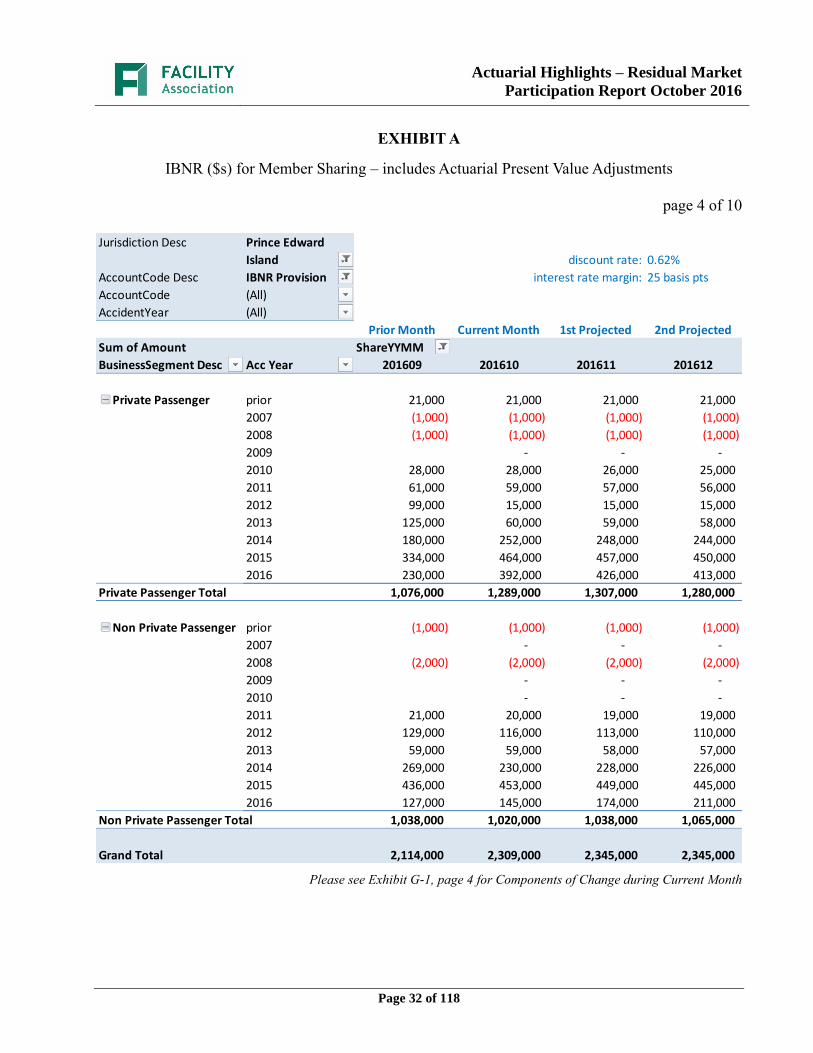
Actuarial Highlights – Residual Market
Participation Report October 2016
Page 32 of 118
EXHIBIT A
IBNR ($s) for Member Sharing – includes Actuarial Present Value Adjustments
page 4 of 10
Please see Exhibit G-1, page 4 for Components of Change during Current Month
Jurisdiction Desc Prince Edward
Island discount rate: 0.62%
AccountCode Desc IBNR Provision interest rate margin: 25 basis pts
AccountCode (All)
AccidentYear (All)
Prior Month Current Month 1st Projected 2nd Projected
Sum of Amount ShareYYMM
BusinessSegment Desc Acc Year 201609 201610 201611 201612
Private Passenger prior 21,000 21,000 21,000 21,000
2007 (1,000) (1,000) (1,000) (1,000)
2008 (1,000) (1,000) (1,000) (1,000)
2009 - - -
2010 28,000 28,000 26,000 25,000
2011 61,000 59,000 57,000 56,000
2012 99,000 15,000 15,000 15,000
2013 125,000 60,000 59,000 58,000
2014 180,000 252,000 248,000 244,000
2015 334,000 464,000 457,000 450,000
2016 230,000 392,000 426,000 413,000
Private Passenger Total 1,076,000 1,289,000 1,307,000 1,280,000
Non Private Passenger prior (1,000) (1,000) (1,000) (1,000)
2007 - - -
2008 (2,000) (2,000) (2,000) (2,000)
2009 - - -
2010 - - -
2011 21,000 20,000 19,000 19,000
2012 129,000 116,000 113,000 110,000
2013 59,000 59,000 58,000 57,000
2014 269,000 230,000 228,000 226,000
2015 436,000 453,000 449,000 445,000
2016 127,000 145,000 174,000 211,000
Non Private Passenger Total 1,038,000 1,020,000 1,038,000 1,065,000
Grand Total 2,114,000 2,309,000 2,345,000 2,345,000
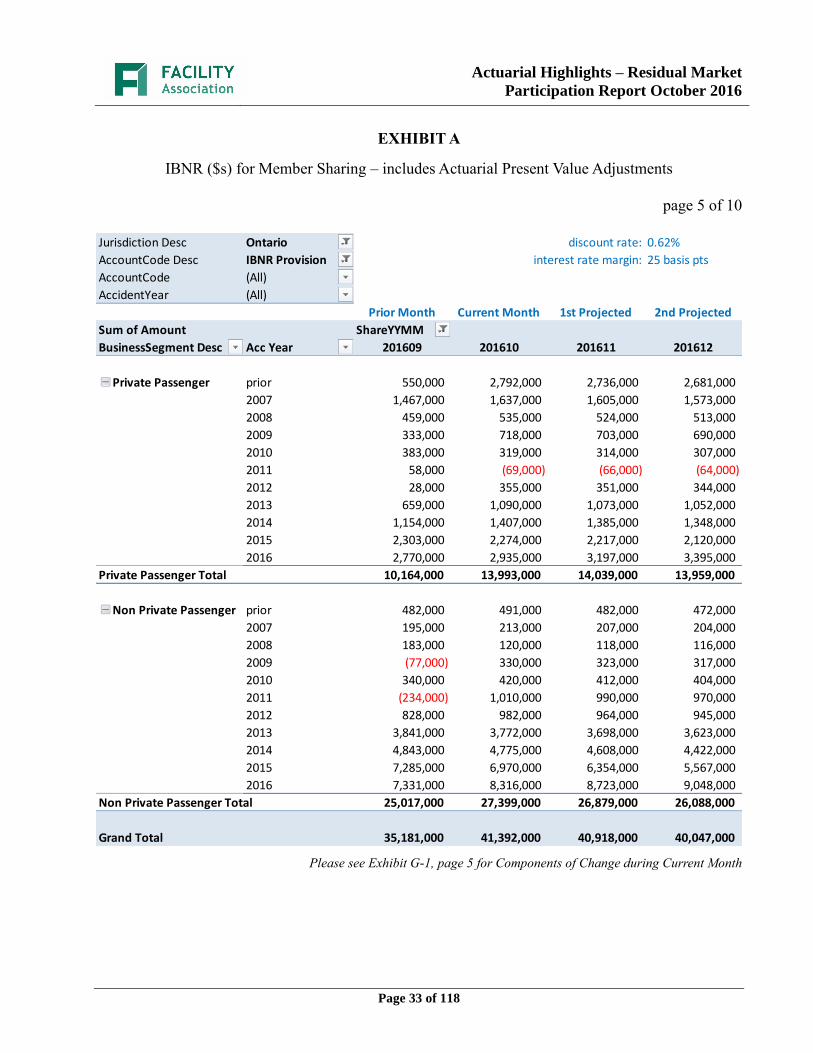
Actuarial Highlights – Residual Market
Participation Report October 2016
Page 33 of 118
EXHIBIT A
IBNR ($s) for Member Sharing – includes Actuarial Present Value Adjustments
page 5 of 10
Please see Exhibit G-1, page 5 for Components of Change during Current Month
Jurisdiction Desc Ontario discount rate: 0.62%
AccountCode Desc IBNR Provision interest rate margin: 25 basis pts
AccountCode (All)
AccidentYear (All)
Prior Month Current Month 1st Projected 2nd Projected
Sum of Amount ShareYYMM
BusinessSegment Desc Acc Year 201609 201610 201611 201612
Private Passenger prior 550,000 2,792,000 2,736,000 2,681,000
2007 1,467,000 1,637,000 1,605,000 1,573,000
2008 459,000 535,000 524,000 513,000
2009 333,000 718,000 703,000 690,000
2010 383,000 319,000 314,000 307,000
2011 58,000 (69,000) (66,000) (64,000)
2012 28,000 355,000 351,000 344,000
2013 659,000 1,090,000 1,073,000 1,052,000
2014 1,154,000 1,407,000 1,385,000 1,348,000
2015 2,303,000 2,274,000 2,217,000 2,120,000
2016 2,770,000 2,935,000 3,197,000 3,395,000
Private Passenger Total 10,164,000 13,993,000 14,039,000 13,959,000
Non Private Passenger prior 482,000 491,000 482,000 472,000
2007 195,000 213,000 207,000 204,000
2008 183,000 120,000 118,000 116,000
2009 (77,000) 330,000 323,000 317,000
2010 340,000 420,000 412,000 404,000
2011 (234,000) 1,010,000 990,000 970,000
2012 828,000 982,000 964,000 945,000
2013 3,841,000 3,772,000 3,698,000 3,623,000
2014 4,843,000 4,775,000 4,608,000 4,422,000
2015 7,285,000 6,970,000 6,354,000 5,567,000
2016 7,331,000 8,316,000 8,723,000 9,048,000
Non Private Passenger Total 25,017,000 27,399,000 26,879,000 26,088,000
Grand Total 35,181,000 41,392,000 40,918,000 40,047,000

Actuarial Highlights – Residual Market
Participation Report October 2016
Page 34 of 118
EXHIBIT A
IBNR ($s) for Member Sharing – includes Actuarial Present Value Adjustments
page 6 of 10
Please see Exhibit G-1, page 6 for Components of Change during Current Month
Jurisdiction Desc Alberta discount rate: 0.62%
AccountCode Desc IBNR Provision interest rate margin: 25 basis pts
AccountCode (All)
AccidentYear (All)
Prior Month Current Month 1st Projected 2nd Projected
Sum of Amount ShareYYMM
BusinessSegment Desc Acc Year 201609 201610 201611 201612
Private Passenger prior (115,000) (27,000) (25,000) (24,000)
2007 47,000 (4,000) (4,000) (4,000)
2008 58,000 58,000 58,000 58,000
2009 52,000 52,000 52,000 52,000
2010 375,000 296,000 292,000 289,000
2011 542,000 473,000 469,000 464,000
2012 803,000 594,000 591,000 584,000
2013 1,267,000 1,076,000 1,070,000 1,061,000
2014 2,059,000 1,957,000 1,946,000 1,928,000
2015 2,702,000 2,714,000 2,698,000 2,669,000
2016 2,637,000 2,709,000 2,905,000 2,859,000
Private Passenger Total 10,427,000 9,898,000 10,052,000 9,936,000
Non Private Passenger prior (60,000) 43,000 43,000 44,000
2007 92,000 94,000 93,000 89,000
2008 42,000 126,000 125,000 122,000
2009 144,000 144,000 141,000 139,000
2010 428,000 294,000 288,000 283,000
2011 896,000 612,000 600,000 589,000
2012 810,000 1,019,000 998,000 978,000
2013 1,618,000 2,223,000 2,179,000 2,135,000
2014 3,444,000 3,529,000 3,463,000 3,394,000
2015 6,253,000 5,998,000 5,937,000 5,818,000
2016 8,103,000 10,350,000 10,621,000 10,754,000
Non Private Passenger Total 21,770,000 24,432,000 24,488,000 24,345,000
Grand Total 32,197,000 34,330,000 34,540,000 34,281,000
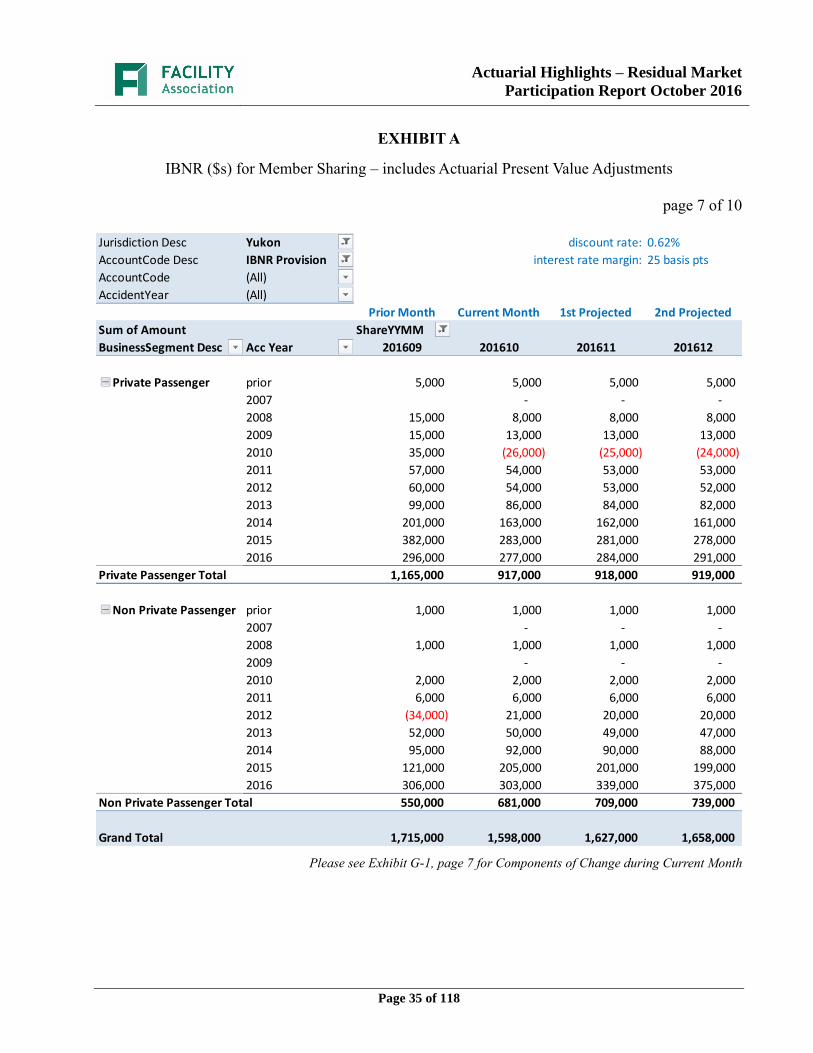
Actuarial Highlights – Residual Market
Participation Report October 2016
Page 35 of 118
EXHIBIT A
IBNR ($s) for Member Sharing – includes Actuarial Present Value Adjustments
page 7 of 10
Please see Exhibit G-1, page 7 for Components of Change during Current Month
Jurisdiction Desc Yukon discount rate: 0.62%
AccountCode Desc IBNR Provision interest rate margin: 25 basis pts
AccountCode (All)
AccidentYear (All)
Prior Month Current Month 1st Projected 2nd Projected
Sum of Amount ShareYYMM
BusinessSegment Desc Acc Year 201609 201610 201611 201612
Private Passenger prior 5,000 5,000 5,000 5,000
2007 - - -
2008 15,000 8,000 8,000 8,000
2009 15,000 13,000 13,000 13,000
2010 35,000 (26,000) (25,000) (24,000)
2011 57,000 54,000 53,000 53,000
2012 60,000 54,000 53,000 52,000
2013 99,000 86,000 84,000 82,000
2014 201,000 163,000 162,000 161,000
2015 382,000 283,000 281,000 278,000
2016 296,000 277,000 284,000 291,000
Private Passenger Total 1,165,000 917,000 918,000 919,000
Non Private Passenger prior 1,000 1,000 1,000 1,000
2007 - - -
2008 1,000 1,000 1,000 1,000
2009 - - -
2010 2,000 2,000 2,000 2,000
2011 6,000 6,000 6,000 6,000
2012 (34,000) 21,000 20,000 20,000
2013 52,000 50,000 49,000 47,000
2014 95,000 92,000 90,000 88,000
2015 121,000 205,000 201,000 199,000
2016 306,000 303,000 339,000 375,000
Non Private Passenger Total 550,000 681,000 709,000 739,000
Grand Total 1,715,000 1,598,000 1,627,000 1,658,000

Actuarial Highlights – Residual Market
Participation Report October 2016
Page 36 of 118
EXHIBIT A
IBNR ($s) for Member Sharing – includes Actuarial Present Value Adjustments
page 8 of 10
Please see Exhibit G-1, page 8 for Components of Change during Current Month
Jurisdiction Desc Northwest
Territories discount rate: 0.62%
AccountCode Desc IBNR Provision interest rate margin: 25 basis pts
AccountCode (All)
AccidentYear (All)
Prior Month Current Month 1st Projected 2nd Projected
Sum of Amount ShareYYMM
BusinessSegment Desc Acc Year 201609 201610 201611 201612
Private Passenger prior (2,000) (2,000) (2,000) (2,000)
2007 3,000 3,000 3,000 3,000
2008 23,000 17,000 17,000 17,000
2009 (6,000) 24,000 24,000 24,000
2010 4,000 4,000 4,000 4,000
2011 50,000 46,000 45,000 44,000
2012 107,000 97,000 95,000 92,000
2013 48,000 159,000 156,000 152,000
2014 192,000 395,000 392,000 389,000
2015 566,000 602,000 598,000 594,000
2016 606,000 489,000 537,000 583,000
Private Passenger Total 1,591,000 1,834,000 1,869,000 1,900,000
Non Private Passenger prior 2,000 2,000 2,000 2,000
2007 - - -
2008 - - -
2009 - - -
2010 1,000 1,000 1,000 1,000
2011 - - -
2012 9,000 8,000 8,000 8,000
2013 76,000 73,000 71,000 71,000
2014 196,000 188,000 187,000 186,000
2015 219,000 231,000 229,000 227,000
2016 208,000 332,000 361,000 377,000
Non Private Passenger Total 711,000 835,000 859,000 872,000
Grand Total 2,302,000 2,669,000 2,728,000 2,772,000
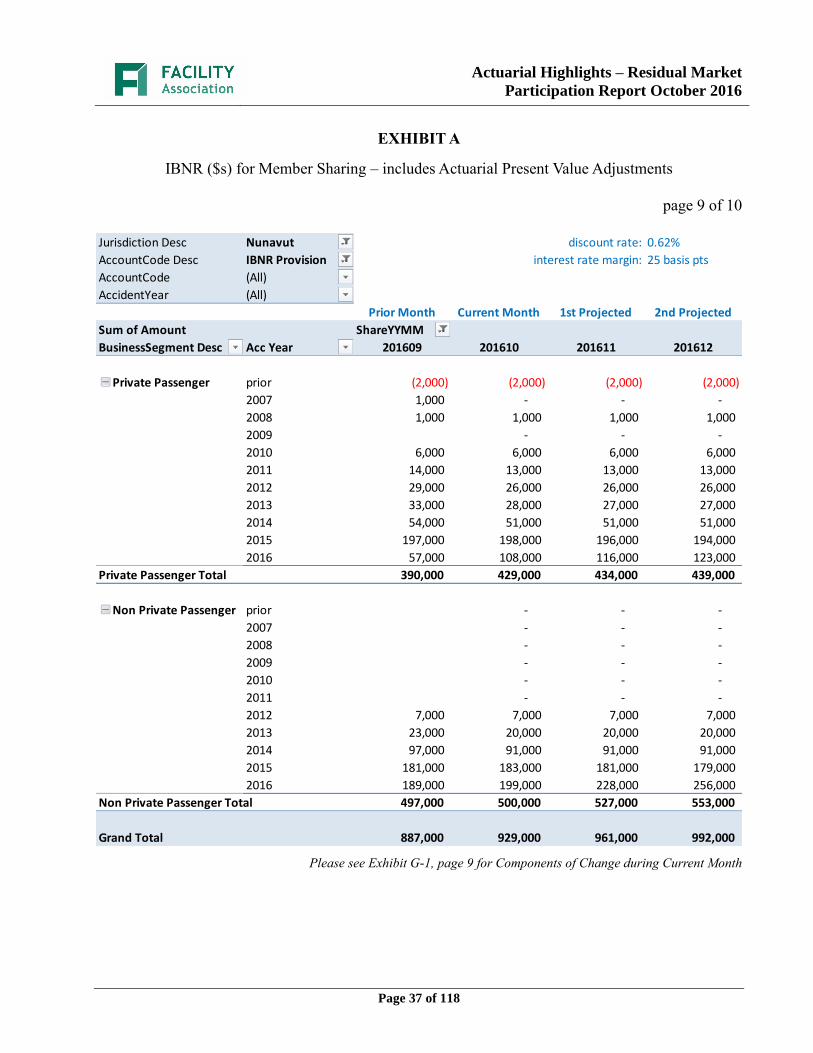
Actuarial Highlights – Residual Market
Participation Report October 2016
Page 37 of 118
EXHIBIT A
IBNR ($s) for Member Sharing – includes Actuarial Present Value Adjustments
page 9 of 10
Please see Exhibit G-1, page 9 for Components of Change during Current Month
Jurisdiction Desc Nunavut discount rate: 0.62%
AccountCode Desc IBNR Provision interest rate margin: 25 basis pts
AccountCode (All)
AccidentYear (All)
Prior Month Current Month 1st Projected 2nd Projected
Sum of Amount ShareYYMM
BusinessSegment Desc Acc Year 201609 201610 201611 201612
Private Passenger prior (2,000) (2,000) (2,000) (2,000)
2007 1,000 - - -
2008 1,000 1,000 1,000 1,000
2009 - - -
2010 6,000 6,000 6,000 6,000
2011 14,000 13,000 13,000 13,000
2012 29,000 26,000 26,000 26,000
2013 33,000 28,000 27,000 27,000
2014 54,000 51,000 51,000 51,000
2015 197,000 198,000 196,000 194,000
2016 57,000 108,000 116,000 123,000
Private Passenger Total 390,000 429,000 434,000 439,000
Non Private Passenger prior - - -
2007 - - -
2008 - - -
2009 - - -
2010 - - -
2011 - - -
2012 7,000 7,000 7,000 7,000
2013 23,000 20,000 20,000 20,000
2014 97,000 91,000 91,000 91,000
2015 181,000 183,000 181,000 179,000
2016 189,000 199,000 228,000 256,000
Non Private Passenger Total 497,000 500,000 527,000 553,000
Grand Total 887,000 929,000 961,000 992,000

Actuarial Highlights – Residual Market
Participation Report October 2016
Page 38 of 118
EXHIBIT A
IBNR ($s) for Member Sharing – includes Actuarial Present Value Adjustments
page 10 of 10
Please see Exhibit G-1, page 10 for Components of Change during Current Month
Jurisdiction Desc (All) discount rate: 0.62%
AccountCode Desc IBNR Provision interest rate margin: 25 basis pts
AccountCode (All)
AccidentYear (All)
Prior Month Current Month 1st Projected 2nd Projected
Sum of Amount ShareYYMM
BusinessSegment Desc Acc Year 201609 201610 201611 201612
Private Passenger prior 1,128,000 3,149,000 3,090,000 3,030,000
2007 1,736,000 1,808,000 1,772,000 1,739,000
2008 637,000 970,000 950,000 934,000
2009 665,000 961,000 942,000 925,000
2010 1,009,000 698,000 686,000 675,000
2011 1,203,000 1,127,000 1,112,000 1,097,000
2012 1,747,000 1,742,000 1,725,000 1,701,000
2013 3,544,000 3,760,000 3,698,000 3,635,000
2014 7,119,000 7,292,000 7,157,000 7,055,000
2015 11,269,000 11,379,000 11,145,000 10,920,000
2016 12,452,000 13,700,000 14,629,000 14,884,000
Private Passenger Total 42,509,000 46,586,000 46,906,000 46,595,000
Non Private Passenger prior 458,000 583,000 575,000 566,000
2007 389,000 384,000 374,000 366,000
2008 255,000 264,000 260,000 255,000
2009 228,000 503,000 493,000 485,000
2010 869,000 805,000 789,000 773,000
2011 1,159,000 2,081,000 2,038,000 1,997,000
2012 2,520,000 2,832,000 2,771,000 2,712,000
2013 6,325,000 7,339,000 7,187,000 7,040,000
2014 10,802,000 11,136,000 10,789,000 10,462,000
2015 17,605,000 17,813,000 16,882,000 15,692,000
2016 21,516,000 25,981,000 27,200,000 28,106,000
Non Private Passenger Total 62,126,000 69,721,000 69,358,000 68,454,000
Grand Total 104,635,000 116,307,000 116,264,000 115,049,000

Actuarial Highlights – Residual Market
Participation Report October 2016
Page 39 of 118
EXHIBIT B
IBNR ($s) (does not include actuarial present value adjustments)
page 1 of 10
Please see Exhibit G-2, page 1 for Components of Change during Current Month
Jurisdiction Desc Newfoundland &
Labrador discount rate: 0.00%
AccountCode Desc Undiscounted
IBNR Provision interest rate margin: 0 basis pts
AccountCode (All)
AccidentYear (All)
Prior Month Current Month 1st Projected 2nd Projected
Sum of Amount ShareYYMM
BusinessSegment Desc Acc Year 201608 201609 201610 201611
Private Passenger prior (14,000) (14,000) (14,000) (14,000)
2007 (3,000) (3,000) (3,000) (3,000)
2008 2,000 2,000 2,000 2,000
2009 72,000 73,000 6,000 6,000
2010 45,000 45,000 (5,000) (5,000)
2011 5,000 5,000 (2,000) (2,000)
2012 (62,000) (61,000) (25,000) (24,000)
2013 207,000 146,000 185,000 170,000
2014 982,000 978,000 755,000 679,000
2015 1,340,000 1,399,000 1,091,000 982,000
2016 2,828,000 2,355,000 2,796,000 2,801,000
Private Passenger Total 5,402,000 4,925,000 4,786,000 4,592,000
Non Private Passenger prior 4,000 4,000 4,000 4,000
2007 (2,000) (2,000) (2,000) (2,000)
2008 - -
2009 3,000 3,000 3,000 3,000
2010 - -
2011 131,000 131,000 55,000 54,000
2012 145,000 164,000 101,000 99,000
2013 245,000 230,000 228,000 223,000
2014 1,049,000 970,000 886,000 815,000
2015 528,000 627,000 688,000 619,000
2016 1,528,000 1,827,000 2,328,000 2,319,000
Non Private Passenger Total 3,631,000 3,954,000 4,291,000 4,134,000
Grand Total 9,033,000 8,879,000 9,077,000 8,726,000
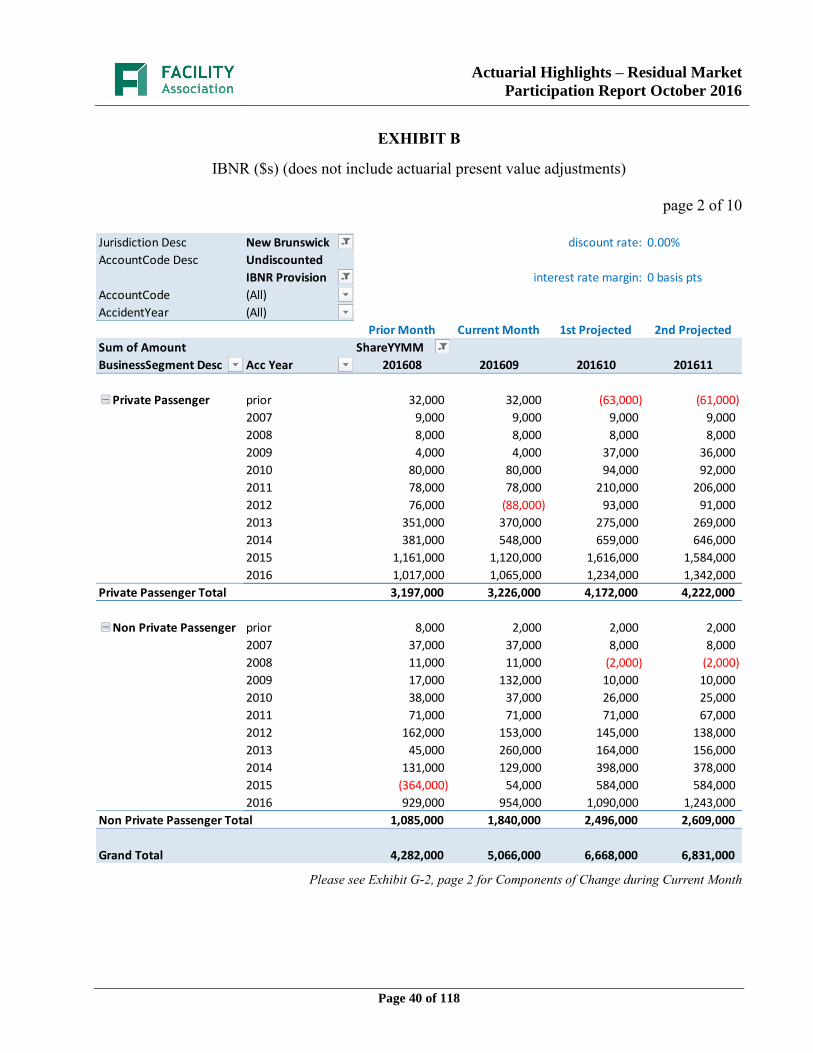
Actuarial Highlights – Residual Market
Participation Report October 2016
Page 40 of 118
EXHIBIT B
IBNR ($s) (does not include actuarial present value adjustments)
page 2 of 10
Please see Exhibit G-2, page 2 for Components of Change during Current Month
Jurisdiction Desc New Brunswick discount rate: 0.00%
AccountCode Desc Undiscounted
IBNR Provision interest rate margin: 0 basis pts
AccountCode (All)
AccidentYear (All)
Prior Month Current Month 1st Projected 2nd Projected
Sum of Amount ShareYYMM
BusinessSegment Desc Acc Year 201608 201609 201610 201611
Private Passenger prior 32,000 32,000 (63,000) (61,000)
2007 9,000 9,000 9,000 9,000
2008 8,000 8,000 8,000 8,000
2009 4,000 4,000 37,000 36,000
2010 80,000 80,000 94,000 92,000
2011 78,000 78,000 210,000 206,000
2012 76,000 (88,000) 93,000 91,000
2013 351,000 370,000 275,000 269,000
2014 381,000 548,000 659,000 646,000
2015 1,161,000 1,120,000 1,616,000 1,584,000
2016 1,017,000 1,065,000 1,234,000 1,342,000
Private Passenger Total 3,197,000 3,226,000 4,172,000 4,222,000
Non Private Passenger prior 8,000 2,000 2,000 2,000
2007 37,000 37,000 8,000 8,000
2008 11,000 11,000 (2,000) (2,000)
2009 17,000 132,000 10,000 10,000
2010 38,000 37,000 26,000 25,000
2011 71,000 71,000 71,000 67,000
2012 162,000 153,000 145,000 138,000
2013 45,000 260,000 164,000 156,000
2014 131,000 129,000 398,000 378,000
2015 (364,000) 54,000 584,000 584,000
2016 929,000 954,000 1,090,000 1,243,000
Non Private Passenger Total 1,085,000 1,840,000 2,496,000 2,609,000
Grand Total 4,282,000 5,066,000 6,668,000 6,831,000
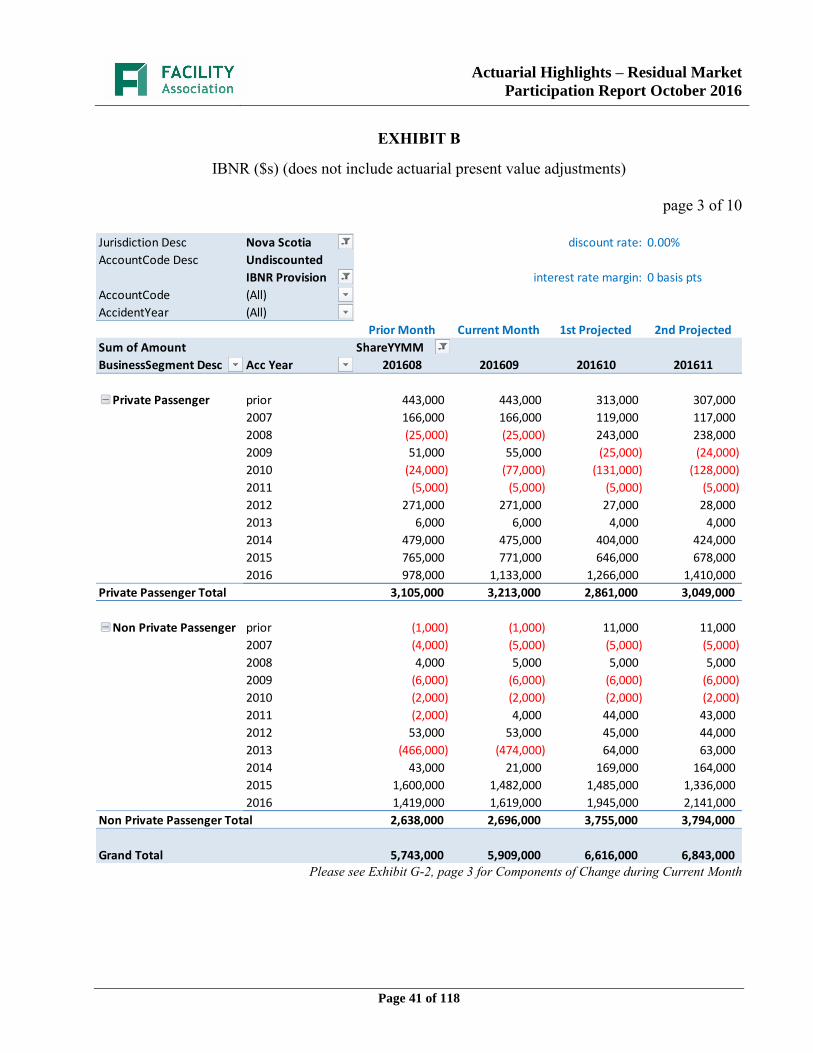
Actuarial Highlights – Residual Market
Participation Report October 2016
Page 41 of 118
EXHIBIT B
IBNR ($s) (does not include actuarial present value adjustments)
page 3 of 10
Please see Exhibit G-2, page 3 for Components of Change during Current Month
Jurisdiction Desc Nova Scotia discount rate: 0.00%
AccountCode Desc Undiscounted
IBNR Provision interest rate margin: 0 basis pts
AccountCode (All)
AccidentYear (All)
Prior Month Current Month 1st Projected 2nd Projected
Sum of Amount ShareYYMM
BusinessSegment Desc Acc Year 201608 201609 201610 201611
Private Passenger prior 443,000 443,000 313,000 307,000
2007 166,000 166,000 119,000 117,000
2008 (25,000) (25,000) 243,000 238,000
2009 51,000 55,000 (25,000) (24,000)
2010 (24,000) (77,000) (131,000) (128,000)
2011 (5,000) (5,000) (5,000) (5,000)
2012 271,000 271,000 27,000 28,000
2013 6,000 6,000 4,000 4,000
2014 479,000 475,000 404,000 424,000
2015 765,000 771,000 646,000 678,000
2016 978,000 1,133,000 1,266,000 1,410,000
Private Passenger Total 3,105,000 3,213,000 2,861,000 3,049,000
Non Private Passenger prior (1,000) (1,000) 11,000 11,000
2007 (4,000) (5,000) (5,000) (5,000)
2008 4,000 5,000 5,000 5,000
2009 (6,000) (6,000) (6,000) (6,000)
2010 (2,000) (2,000) (2,000) (2,000)
2011 (2,000) 4,000 44,000 43,000
2012 53,000 53,000 45,000 44,000
2013 (466,000) (474,000) 64,000 63,000
2014 43,000 21,000 169,000 164,000
2015 1,600,000 1,482,000 1,485,000 1,336,000
2016 1,419,000 1,619,000 1,945,000 2,141,000
Non Private Passenger Total 2,638,000 2,696,000 3,755,000 3,794,000
Grand Total 5,743,000 5,909,000 6,616,000 6,843,000
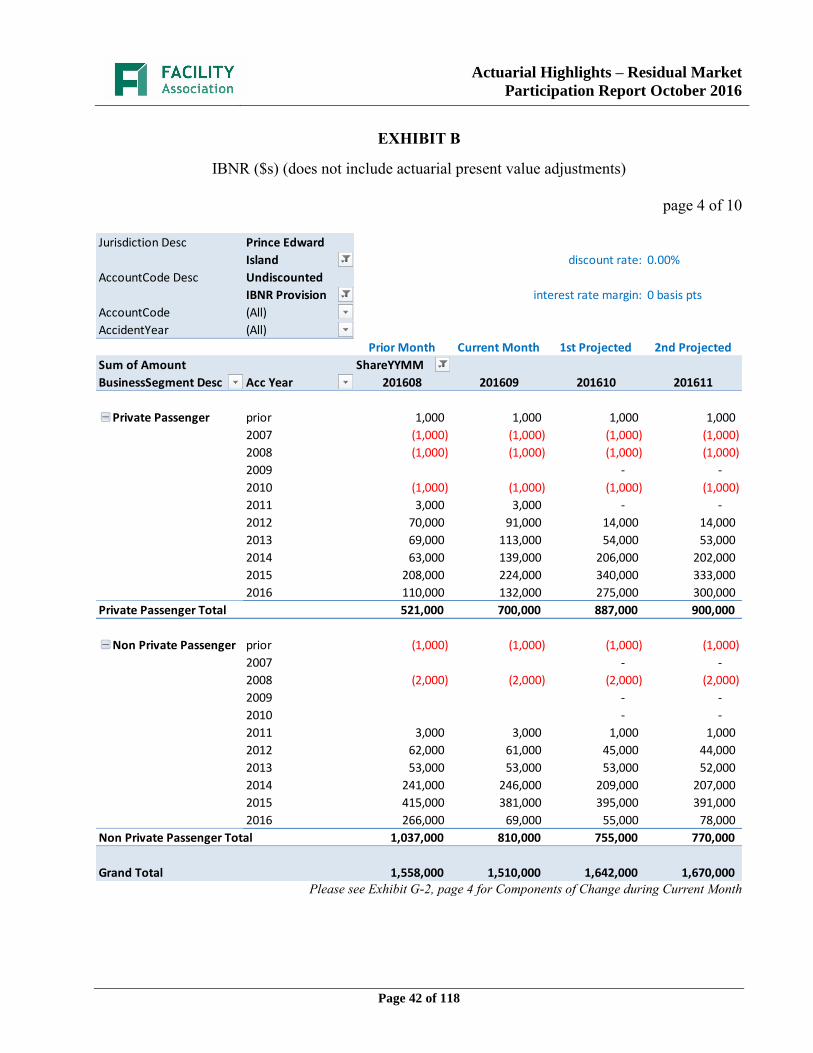
Actuarial Highlights – Residual Market
Participation Report October 2016
Page 42 of 118
EXHIBIT B
IBNR ($s) (does not include actuarial present value adjustments)
page 4 of 10
Please see Exhibit G-2, page 4 for Components of Change during Current Month
Jurisdiction Desc Prince Edward
Island discount rate: 0.00%
AccountCode Desc Undiscounted
IBNR Provision interest rate margin: 0 basis pts
AccountCode (All)
AccidentYear (All)
Prior Month Current Month 1st Projected 2nd Projected
Sum of Amount ShareYYMM
BusinessSegment Desc Acc Year 201608 201609 201610 201611
Private Passenger prior 1,000 1,000 1,000 1,000
2007 (1,000) (1,000) (1,000) (1,000)
2008 (1,000) (1,000) (1,000) (1,000)
2009 - -
2010 (1,000) (1,000) (1,000) (1,000)
2011 3,000 3,000 - -
2012 70,000 91,000 14,000 14,000
2013 69,000 113,000 54,000 53,000
2014 63,000 139,000 206,000 202,000
2015 208,000 224,000 340,000 333,000
2016 110,000 132,000 275,000 300,000
Private Passenger Total 521,000 700,000 887,000 900,000
Non Private Passenger prior (1,000) (1,000) (1,000) (1,000)
2007 - -
2008 (2,000) (2,000) (2,000) (2,000)
2009 - -
2010 - -
2011 3,000 3,000 1,000 1,000
2012 62,000 61,000 45,000 44,000
2013 53,000 53,000 53,000 52,000
2014 241,000 246,000 209,000 207,000
2015 415,000 381,000 395,000 391,000
2016 266,000 69,000 55,000 78,000
Non Private Passenger Total 1,037,000 810,000 755,000 770,000
Grand Total 1,558,000 1,510,000 1,642,000 1,670,000
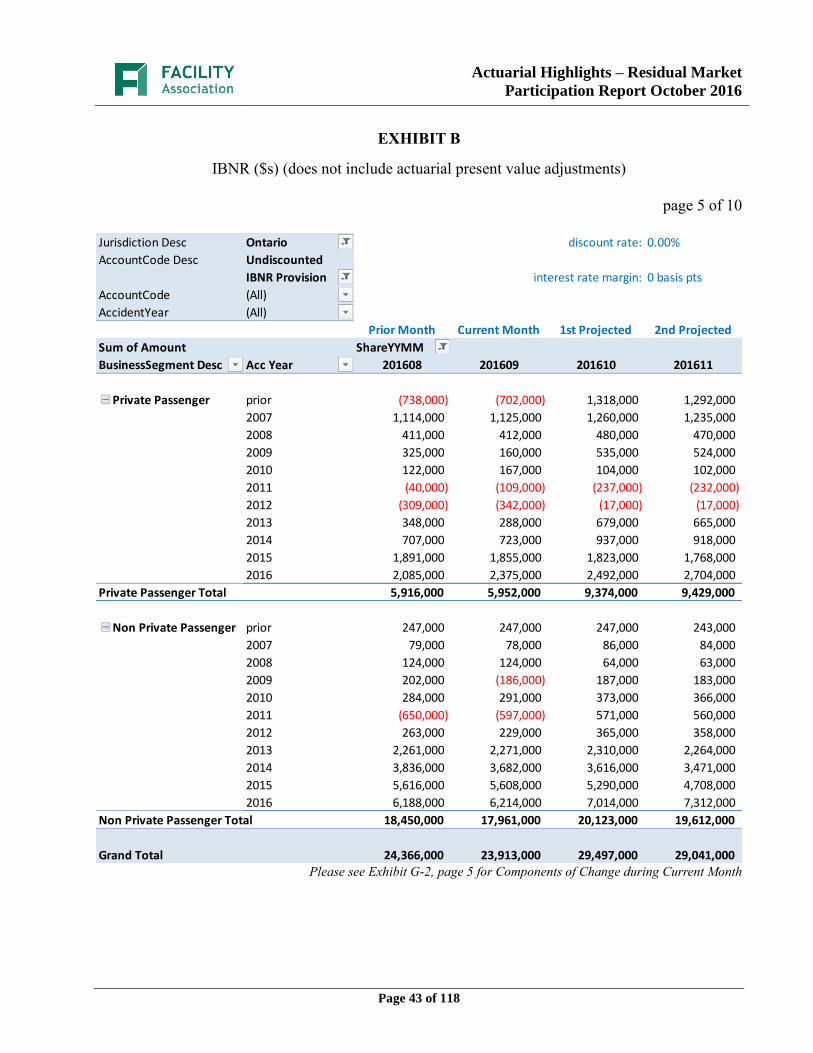
Actuarial Highlights – Residual Market
Participation Report October 2016
Page 43 of 118
EXHIBIT B
IBNR ($s) (does not include actuarial present value adjustments)
page 5 of 10
Please see Exhibit G-2, page 5 for Components of Change during Current Month
Jurisdiction Desc Ontario discount rate: 0.00%
AccountCode Desc Undiscounted
IBNR Provision interest rate margin: 0 basis pts
AccountCode (All)
AccidentYear (All)
Prior Month Current Month 1st Projected 2nd Projected
Sum of Amount ShareYYMM
BusinessSegment Desc Acc Year 201608 201609 201610 201611
Private Passenger prior (738,000) (702,000) 1,318,000 1,292,000
2007 1,114,000 1,125,000 1,260,000 1,235,000
2008 411,000 412,000 480,000 470,000
2009 325,000 160,000 535,000 524,000
2010 122,000 167,000 104,000 102,000
2011 (40,000) (109,000) (237,000) (232,000)
2012 (309,000) (342,000) (17,000) (17,000)
2013 348,000 288,000 679,000 665,000
2014 707,000 723,000 937,000 918,000
2015 1,891,000 1,855,000 1,823,000 1,768,000
2016 2,085,000 2,375,000 2,492,000 2,704,000
Private Passenger Total 5,916,000 5,952,000 9,374,000 9,429,000
Non Private Passenger prior 247,000 247,000 247,000 243,000
2007 79,000 78,000 86,000 84,000
2008 124,000 124,000 64,000 63,000
2009 202,000 (186,000) 187,000 183,000
2010 284,000 291,000 373,000 366,000
2011 (650,000) (597,000) 571,000 560,000
2012 263,000 229,000 365,000 358,000
2013 2,261,000 2,271,000 2,310,000 2,264,000
2014 3,836,000 3,682,000 3,616,000 3,471,000
2015 5,616,000 5,608,000 5,290,000 4,708,000
2016 6,188,000 6,214,000 7,014,000 7,312,000
Non Private Passenger Total 18,450,000 17,961,000 20,123,000 19,612,000
Grand Total 24,366,000 23,913,000 29,497,000 29,041,000
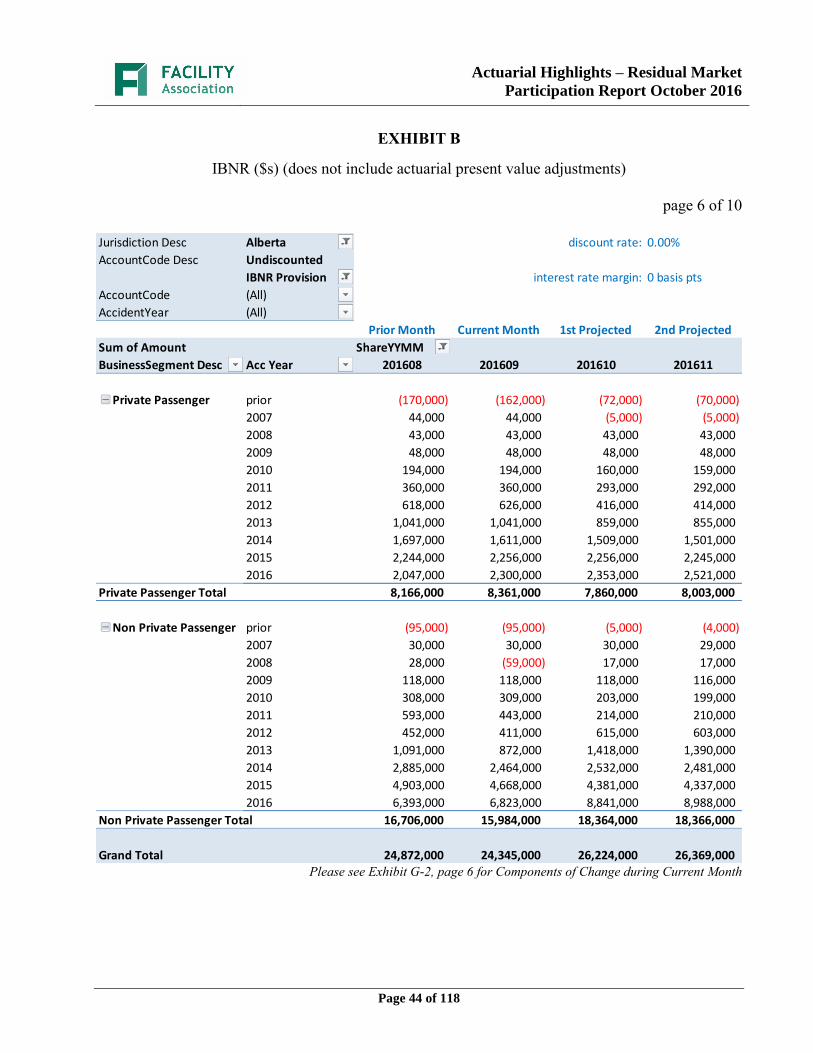
Actuarial Highlights – Residual Market
Participation Report October 2016
Page 44 of 118
EXHIBIT B
IBNR ($s) (does not include actuarial present value adjustments)
page 6 of 10
Please see Exhibit G-2, page 6 for Components of Change during Current Month
Jurisdiction Desc Alberta discount rate: 0.00%
AccountCode Desc Undiscounted
IBNR Provision interest rate margin: 0 basis pts
AccountCode (All)
AccidentYear (All)
Prior Month Current Month 1st Projected 2nd Projected
Sum of Amount ShareYYMM
BusinessSegment Desc Acc Year 201608 201609 201610 201611
Private Passenger prior (170,000) (162,000) (72,000) (70,000)
2007 44,000 44,000 (5,000) (5,000)
2008 43,000 43,000 43,000 43,000
2009 48,000 48,000 48,000 48,000
2010 194,000 194,000 160,000 159,000
2011 360,000 360,000 293,000 292,000
2012 618,000 626,000 416,000 414,000
2013 1,041,000 1,041,000 859,000 855,000
2014 1,697,000 1,611,000 1,509,000 1,501,000
2015 2,244,000 2,256,000 2,256,000 2,245,000
2016 2,047,000 2,300,000 2,353,000 2,521,000
Private Passenger Total 8,166,000 8,361,000 7,860,000 8,003,000
Non Private Passenger prior (95,000) (95,000) (5,000) (4,000)
2007 30,000 30,000 30,000 29,000
2008 28,000 (59,000) 17,000 17,000
2009 118,000 118,000 118,000 116,000
2010 308,000 309,000 203,000 199,000
2011 593,000 443,000 214,000 210,000
2012 452,000 411,000 615,000 603,000
2013 1,091,000 872,000 1,418,000 1,390,000
2014 2,885,000 2,464,000 2,532,000 2,481,000
2015 4,903,000 4,668,000 4,381,000 4,337,000
2016 6,393,000 6,823,000 8,841,000 8,988,000
Non Private Passenger Total 16,706,000 15,984,000 18,364,000 18,366,000
Grand Total 24,872,000 24,345,000 26,224,000 26,369,000
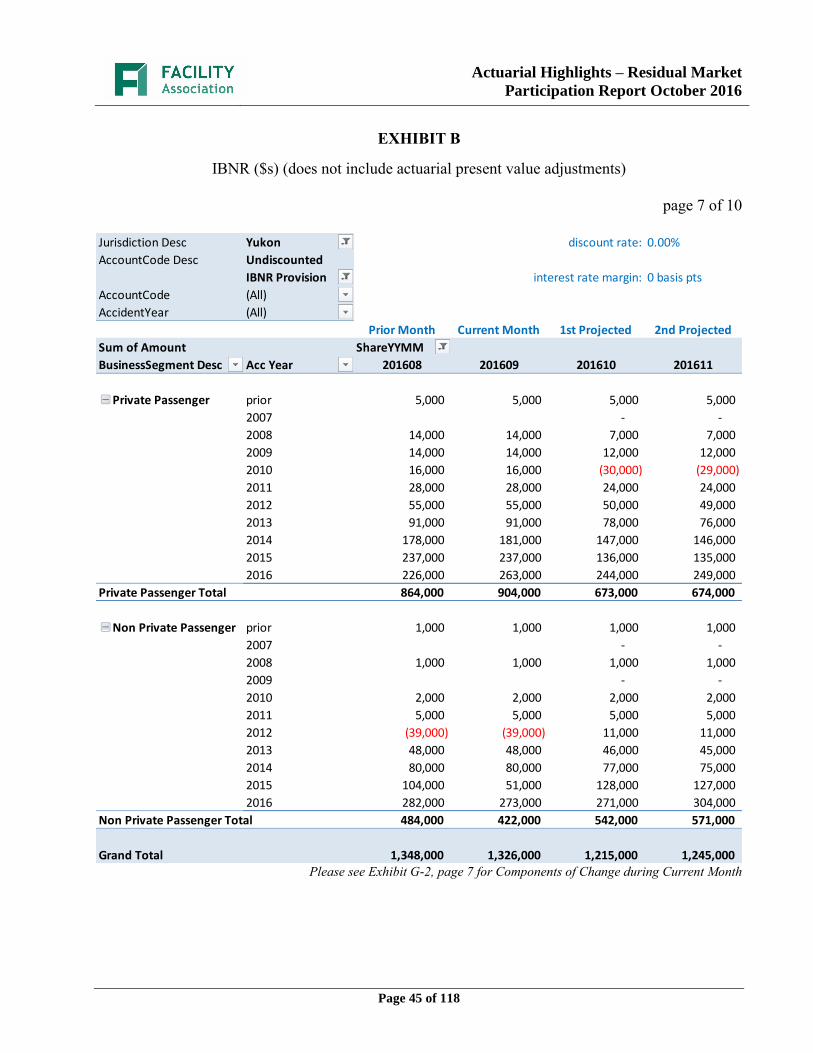
Actuarial Highlights – Residual Market
Participation Report October 2016
Page 45 of 118
EXHIBIT B
IBNR ($s) (does not include actuarial present value adjustments)
page 7 of 10
Please see Exhibit G-2, page 7 for Components of Change during Current Month
Jurisdiction Desc Yukon discount rate: 0.00%
AccountCode Desc Undiscounted
IBNR Provision interest rate margin: 0 basis pts
AccountCode (All)
AccidentYear (All)
Prior Month Current Month 1st Projected 2nd Projected
Sum of Amount ShareYYMM
BusinessSegment Desc Acc Year 201608 201609 201610 201611
Private Passenger prior 5,000 5,000 5,000 5,000
2007 - -
2008 14,000 14,000 7,000 7,000
2009 14,000 14,000 12,000 12,000
2010 16,000 16,000 (30,000) (29,000)
2011 28,000 28,000 24,000 24,000
2012 55,000 55,000 50,000 49,000
2013 91,000 91,000 78,000 76,000
2014 178,000 181,000 147,000 146,000
2015 237,000 237,000 136,000 135,000
2016 226,000 263,000 244,000 249,000
Private Passenger Total 864,000 904,000 673,000 674,000
Non Private Passenger prior 1,000 1,000 1,000 1,000
2007 - -
2008 1,000 1,000 1,000 1,000
2009 - -
2010 2,000 2,000 2,000 2,000
2011 5,000 5,000 5,000 5,000
2012 (39,000) (39,000) 11,000 11,000
2013 48,000 48,000 46,000 45,000
2014 80,000 80,000 77,000 75,000
2015 104,000 51,000 128,000 127,000
2016 282,000 273,000 271,000 304,000
Non Private Passenger Total 484,000 422,000 542,000 571,000
Grand Total 1,348,000 1,326,000 1,215,000 1,245,000
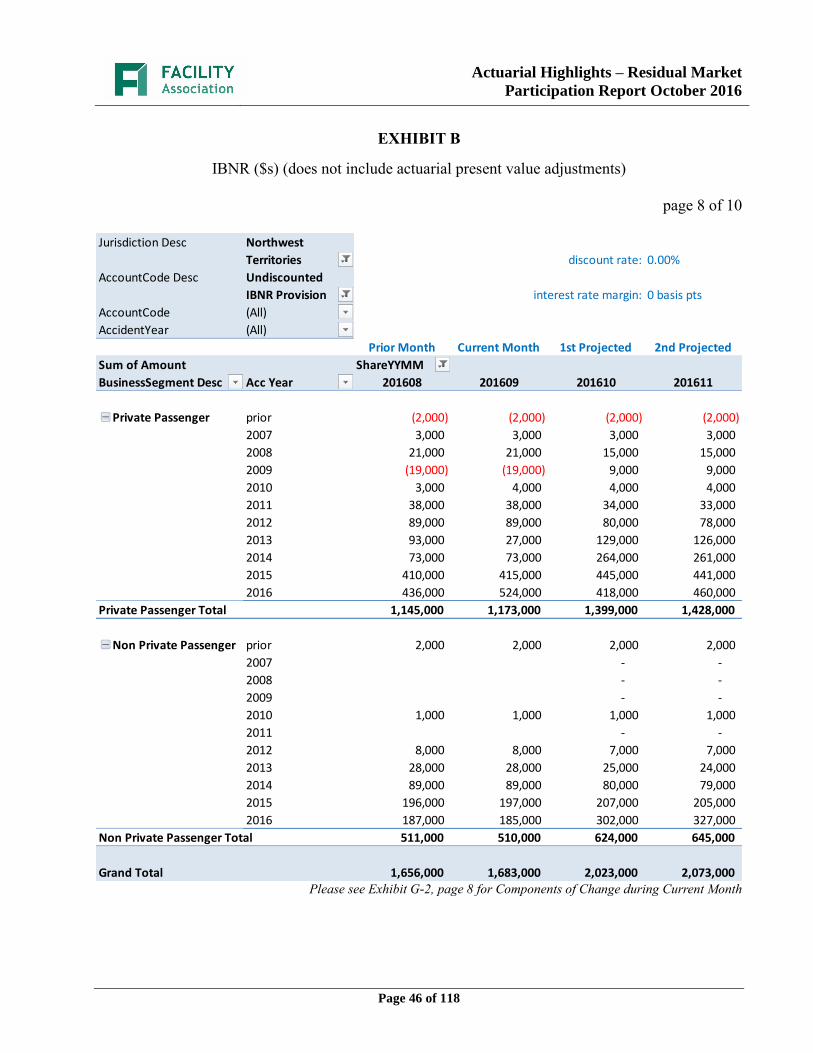
Actuarial Highlights – Residual Market
Participation Report October 2016
Page 46 of 118
EXHIBIT B
IBNR ($s) (does not include actuarial present value adjustments)
page 8 of 10
Please see Exhibit G-2, page 8 for Components of Change during Current Month
Jurisdiction Desc Northwest
Territories discount rate: 0.00%
AccountCode Desc Undiscounted
IBNR Provision interest rate margin: 0 basis pts
AccountCode (All)
AccidentYear (All)
Prior Month Current Month 1st Projected 2nd Projected
Sum of Amount ShareYYMM
BusinessSegment Desc Acc Year 201608 201609 201610 201611
Private Passenger prior (2,000) (2,000) (2,000) (2,000)
2007 3,000 3,000 3,000 3,000
2008 21,000 21,000 15,000 15,000
2009 (19,000) (19,000) 9,000 9,000
2010 3,000 4,000 4,000 4,000
2011 38,000 38,000 34,000 33,000
2012 89,000 89,000 80,000 78,000
2013 93,000 27,000 129,000 126,000
2014 73,000 73,000 264,000 261,000
2015 410,000 415,000 445,000 441,000
2016 436,000 524,000 418,000 460,000
Private Passenger Total 1,145,000 1,173,000 1,399,000 1,428,000
Non Private Passenger prior 2,000 2,000 2,000 2,000
2007 - -
2008 - -
2009 - -
2010 1,000 1,000 1,000 1,000
2011 - -
2012 8,000 8,000 7,000 7,000
2013 28,000 28,000 25,000 24,000
2014 89,000 89,000 80,000 79,000
2015 196,000 197,000 207,000 205,000
2016 187,000 185,000 302,000 327,000
Non Private Passenger Total 511,000 510,000 624,000 645,000
Grand Total 1,656,000 1,683,000 2,023,000 2,073,000
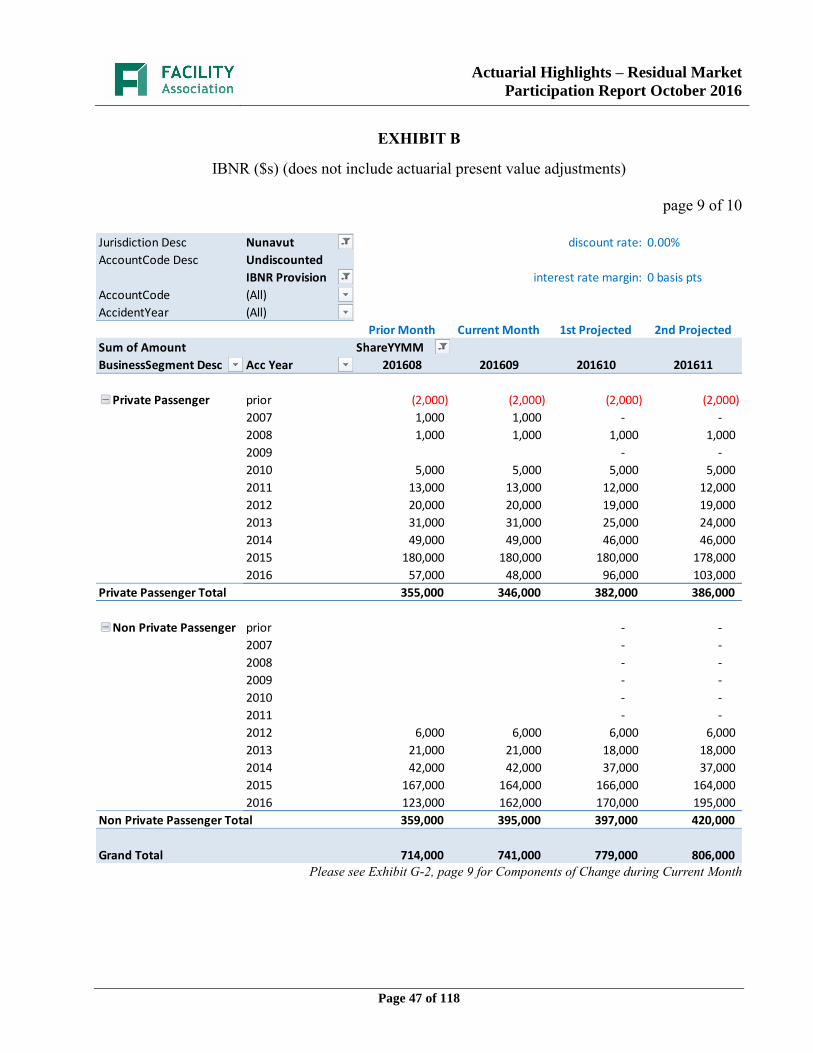
Actuarial Highlights – Residual Market
Participation Report October 2016
Page 47 of 118
EXHIBIT B
IBNR ($s) (does not include actuarial present value adjustments)
page 9 of 10
Please see Exhibit G-2, page 9 for Components of Change during Current Month
Jurisdiction Desc Nunavut discount rate: 0.00%
AccountCode Desc Undiscounted
IBNR Provision interest rate margin: 0 basis pts
AccountCode (All)
AccidentYear (All)
Prior Month Current Month 1st Projected 2nd Projected
Sum of Amount ShareYYMM
BusinessSegment Desc Acc Year 201608 201609 201610 201611
Private Passenger prior (2,000) (2,000) (2,000) (2,000)
2007 1,000 1,000 - -
2008 1,000 1,000 1,000 1,000
2009 - -
2010 5,000 5,000 5,000 5,000
2011 13,000 13,000 12,000 12,000
2012 20,000 20,000 19,000 19,000
2013 31,000 31,000 25,000 24,000
2014 49,000 49,000 46,000 46,000
2015 180,000 180,000 180,000 178,000
2016 57,000 48,000 96,000 103,000
Private Passenger Total 355,000 346,000 382,000 386,000
Non Private Passenger prior - -
2007 - -
2008 - -
2009 - -
2010 - -
2011 - -
2012 6,000 6,000 6,000 6,000
2013 21,000 21,000 18,000 18,000
2014 42,000 42,000 37,000 37,000
2015 167,000 164,000 166,000 164,000
2016 123,000 162,000 170,000 195,000
Non Private Passenger Total 359,000 395,000 397,000 420,000
Grand Total 714,000 741,000 779,000 806,000
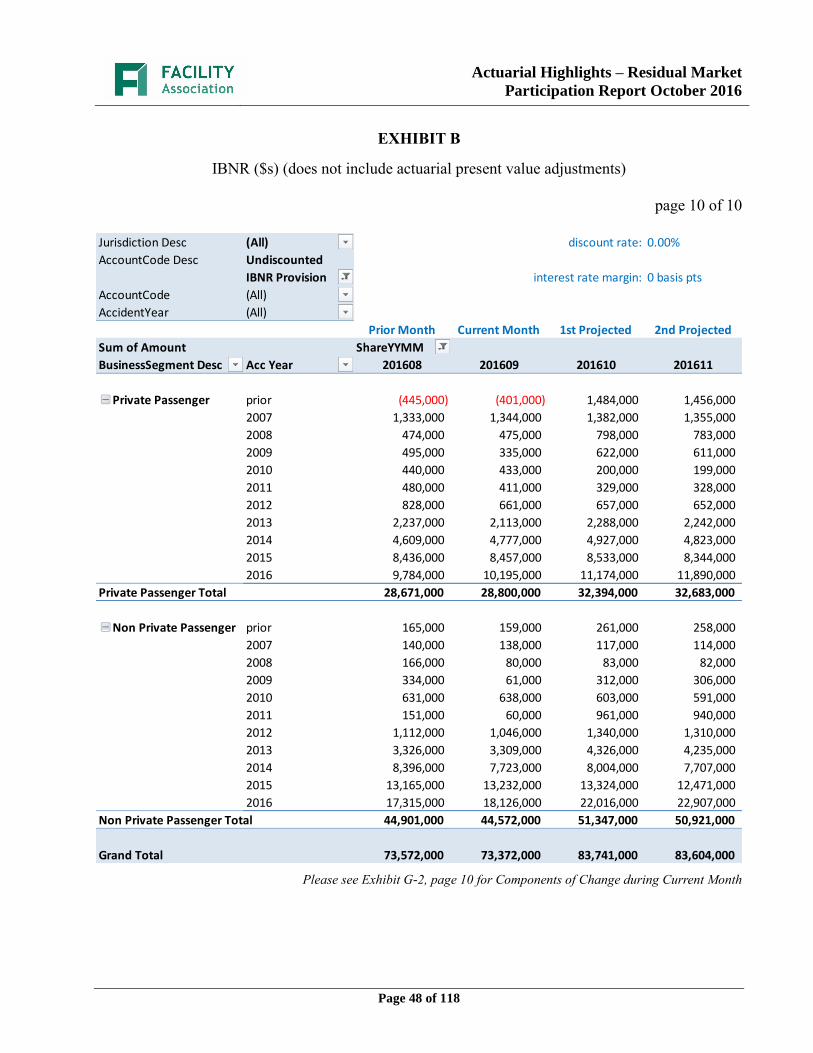
Actuarial Highlights – Residual Market
Participation Report October 2016
Page 48 of 118
EXHIBIT B
IBNR ($s) (does not include actuarial present value adjustments)
page 10 of 10
Please see Exhibit G-2, page 10 for Components of Change during Current Month
Jurisdiction Desc (All) discount rate: 0.00%
AccountCode Desc Undiscounted
IBNR Provision interest rate margin: 0 basis pts
AccountCode (All)
AccidentYear (All)
Prior Month Current Month 1st Projected 2nd Projected
Sum of Amount ShareYYMM
BusinessSegment Desc Acc Year 201608 201609 201610 201611
Private Passenger prior (445,000) (401,000) 1,484,000 1,456,000
2007 1,333,000 1,344,000 1,382,000 1,355,000
2008 474,000 475,000 798,000 783,000
2009 495,000 335,000 622,000 611,000
2010 440,000 433,000 200,000 199,000
2011 480,000 411,000 329,000 328,000
2012 828,000 661,000 657,000 652,000
2013 2,237,000 2,113,000 2,288,000 2,242,000
2014 4,609,000 4,777,000 4,927,000 4,823,000
2015 8,436,000 8,457,000 8,533,000 8,344,000
2016 9,784,000 10,195,000 11,174,000 11,890,000
Private Passenger Total 28,671,000 28,800,000 32,394,000 32,683,000
Non Private Passenger prior 165,000 159,000 261,000 258,000
2007 140,000 138,000 117,000 114,000
2008 166,000 80,000 83,000 82,000
2009 334,000 61,000 312,000 306,000
2010 631,000 638,000 603,000 591,000
2011 151,000 60,000 961,000 940,000
2012 1,112,000 1,046,000 1,340,000 1,310,000
2013 3,326,000 3,309,000 4,326,000 4,235,000
2014 8,396,000 7,723,000 8,004,000 7,707,000
2015 13,165,000 13,232,000 13,324,000 12,471,000
2016 17,315,000 18,126,000 22,016,000 22,907,000
Non Private Passenger Total 44,901,000 44,572,000 51,347,000 50,921,000
Grand Total 73,572,000 73,372,000 83,741,000 83,604,000
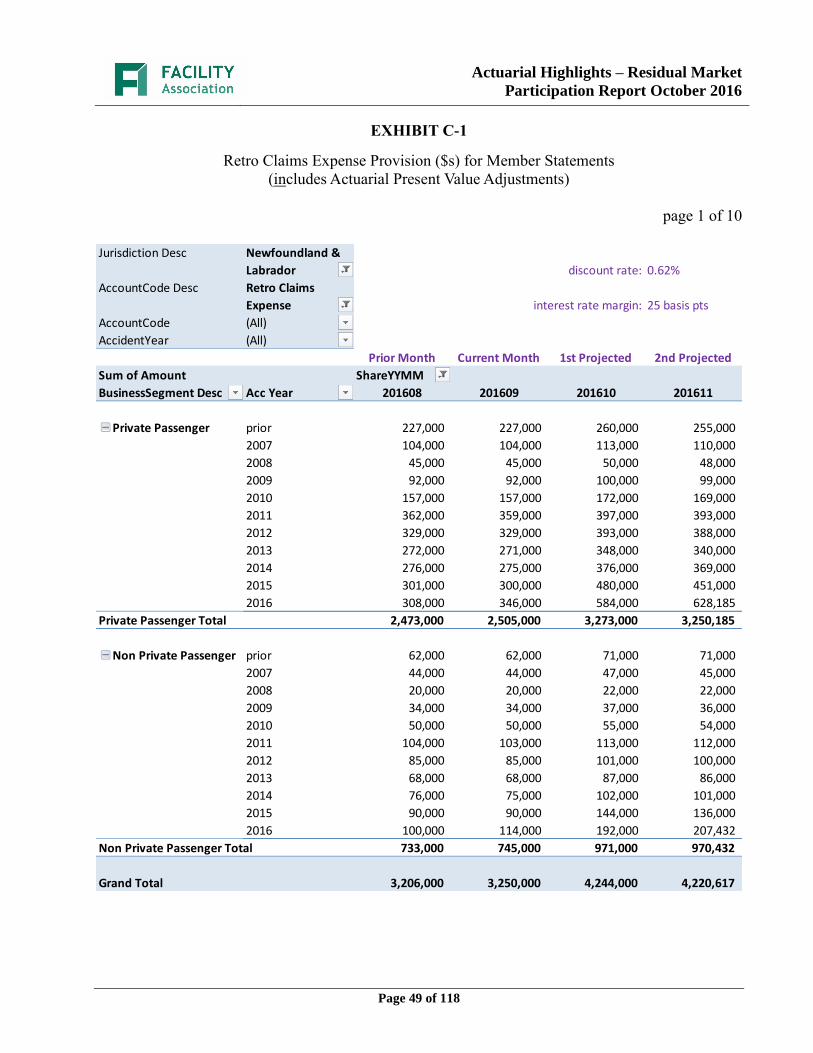
Actuarial Highlights – Residual Market
Participation Report October 2016
Page 49 of 118
EXHIBIT C-1
Retro Claims Expense Provision ($s) for Member Statements
(includes Actuarial Present Value Adjustments)
page 1 of 10
Jurisdiction Desc Newfoundland &
Labrador discount rate: 0.62%
AccountCode Desc Retro Claims
Expense interest rate margin: 25 basis pts
AccountCode (All)
AccidentYear (All)
Prior Month Current Month 1st Projected 2nd Projected
Sum of Amount ShareYYMM
BusinessSegment Desc Acc Year 201608 201609 201610 201611
Private Passenger prior 227,000 227,000 260,000 255,000
2007 104,000 104,000 113,000 110,000
2008 45,000 45,000 50,000 48,000
2009 92,000 92,000 100,000 99,000
2010 157,000 157,000 172,000 169,000
2011 362,000 359,000 397,000 393,000
2012 329,000 329,000 393,000 388,000
2013 272,000 271,000 348,000 340,000
2014 276,000 275,000 376,000 369,000
2015 301,000 300,000 480,000 451,000
2016 308,000 346,000 584,000 628,185
Private Passenger Total 2,473,000 2,505,000 3,273,000 3,250,185
Non Private Passenger prior 62,000 62,000 71,000 71,000
2007 44,000 44,000 47,000 45,000
2008 20,000 20,000 22,000 22,000
2009 34,000 34,000 37,000 36,000
2010 50,000 50,000 55,000 54,000
2011 104,000 103,000 113,000 112,000
2012 85,000 85,000 101,000 100,000
2013 68,000 68,000 87,000 86,000
2014 76,000 75,000 102,000 101,000
2015 90,000 90,000 144,000 136,000
2016 100,000 114,000 192,000 207,432
Non Private Passenger Total 733,000 745,000 971,000 970,432
Grand Total 3,206,000 3,250,000 4,244,000 4,220,617

Actuarial Highlights – Residual Market
Participation Report October 2016
Page 50 of 118
EXHIBIT C-1
Retro Claims Expense Provision ($s) for Member Statements
(includes Actuarial Present Value Adjustments)
page 2 of 10
Jurisdiction Desc New Brunswick discount rate: 0.62%
AccountCode Desc Retro Claims
Expense interest rate margin: 25 basis pts
AccountCode (All)
AccidentYear (All)
Prior Month Current Month 1st Projected 2nd Projected
Sum of Amount ShareYYMM
BusinessSegment Desc Acc Year 201608 201609 201610 201611
Private Passenger prior 17,000 17,000 44,000 44,000
2007 130,000 130,000 142,000 137,000
2008 141,000 141,000 153,000 148,000
2009 157,000 157,000 171,000 163,000
2010 121,000 121,000 131,000 127,000
2011 244,000 244,000 275,000 267,000
2012 296,000 296,000 329,000 321,000
2013 238,000 238,000 285,000 278,000
2014 242,000 242,000 329,000 321,000
2015 224,000 224,000 334,000 326,000
2016 51,000 57,000 124,000 135,354
Private Passenger Total 1,861,000 1,867,000 2,317,000 2,267,354
Non Private Passenger prior 4,000 4,000 21,000 21,000
2007 108,000 108,000 119,000 117,000
2008 117,000 117,000 127,000 124,000
2009 131,000 131,000 143,000 139,000
2010 102,000 102,000 110,000 108,000
2011 183,000 183,000 208,000 204,000
2012 218,000 218,000 243,000 238,000
2013 168,000 168,000 201,000 197,000
2014 157,000 157,000 213,000 209,000
2015 138,000 138,000 205,000 202,000
2016 29,000 34,000 74,000 80,014
Non Private Passenger Total 1,355,000 1,360,000 1,664,000 1,639,014
Grand Total 3,216,000 3,227,000 3,981,000 3,906,368
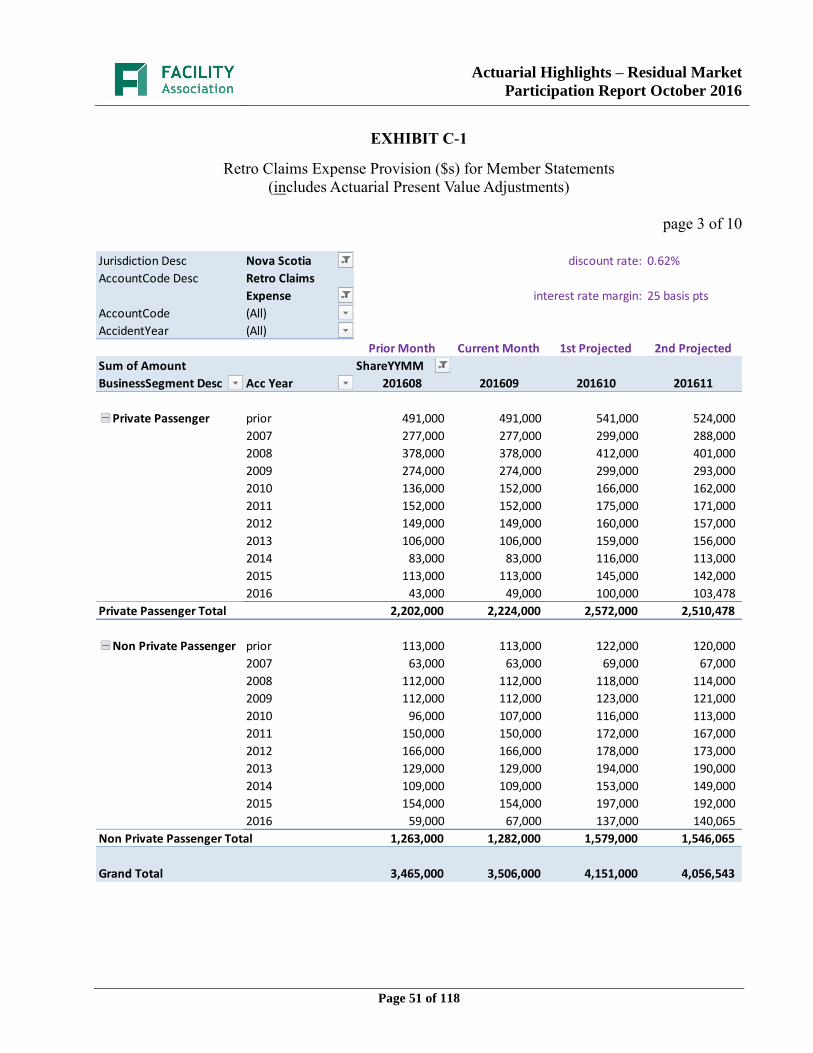
Actuarial Highlights – Residual Market
Participation Report October 2016
Page 51 of 118
EXHIBIT C-1
Retro Claims Expense Provision ($s) for Member Statements
(includes Actuarial Present Value Adjustments)
page 3 of 10
Jurisdiction Desc Nova Scotia discount rate: 0.62%
AccountCode Desc Retro Claims
Expense interest rate margin: 25 basis pts
AccountCode (All)
AccidentYear (All)
Prior Month Current Month 1st Projected 2nd Projected
Sum of Amount ShareYYMM
BusinessSegment Desc Acc Year 201608 201609 201610 201611
Private Passenger prior 491,000 491,000 541,000 524,000
2007 277,000 277,000 299,000 288,000
2008 378,000 378,000 412,000 401,000
2009 274,000 274,000 299,000 293,000
2010 136,000 152,000 166,000 162,000
2011 152,000 152,000 175,000 171,000
2012 149,000 149,000 160,000 157,000
2013 106,000 106,000 159,000 156,000
2014 83,000 83,000 116,000 113,000
2015 113,000 113,000 145,000 142,000
2016 43,000 49,000 100,000 103,478
Private Passenger Total 2,202,000 2,224,000 2,572,000 2,510,478
Non Private Passenger prior 113,000 113,000 122,000 120,000
2007 63,000 63,000 69,000 67,000
2008 112,000 112,000 118,000 114,000
2009 112,000 112,000 123,000 121,000
2010 96,000 107,000 116,000 113,000
2011 150,000 150,000 172,000 167,000
2012 166,000 166,000 178,000 173,000
2013 129,000 129,000 194,000 190,000
2014 109,000 109,000 153,000 149,000
2015 154,000 154,000 197,000 192,000
2016 59,000 67,000 137,000 140,065
Non Private Passenger Total 1,263,000 1,282,000 1,579,000 1,546,065
Grand Total 3,465,000 3,506,000 4,151,000 4,056,543
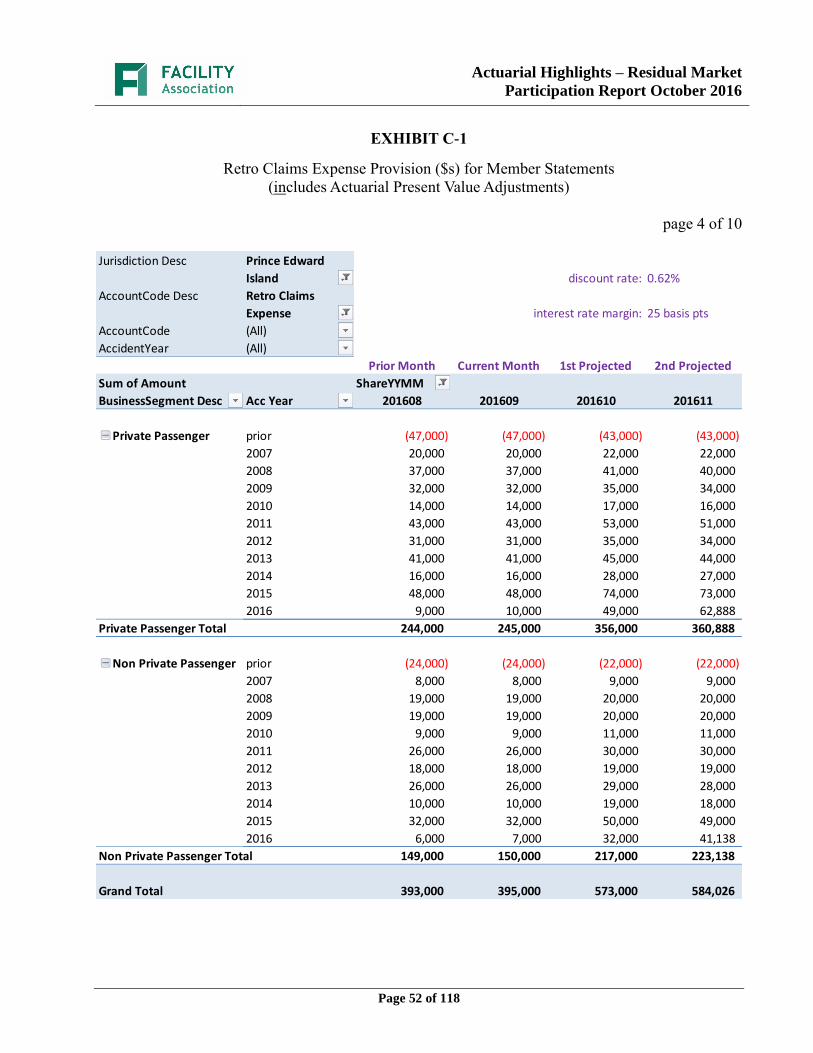
Actuarial Highlights – Residual Market
Participation Report October 2016
Page 52 of 118
EXHIBIT C-1
Retro Claims Expense Provision ($s) for Member Statements
(includes Actuarial Present Value Adjustments)
page 4 of 10
Jurisdiction Desc Prince Edward
Island discount rate: 0.62%
AccountCode Desc Retro Claims
Expense interest rate margin: 25 basis pts
AccountCode (All)
AccidentYear (All)
Prior Month Current Month 1st Projected 2nd Projected
Sum of Amount ShareYYMM
BusinessSegment Desc Acc Year 201608 201609 201610 201611
Private Passenger prior (47,000) (47,000) (43,000) (43,000)
2007 20,000 20,000 22,000 22,000
2008 37,000 37,000 41,000 40,000
2009 32,000 32,000 35,000 34,000
2010 14,000 14,000 17,000 16,000
2011 43,000 43,000 53,000 51,000
2012 31,000 31,000 35,000 34,000
2013 41,000 41,000 45,000 44,000
2014 16,000 16,000 28,000 27,000
2015 48,000 48,000 74,000 73,000
2016 9,000 10,000 49,000 62,888
Private Passenger Total 244,000 245,000 356,000 360,888
Non Private Passenger prior (24,000) (24,000) (22,000) (22,000)
2007 8,000 8,000 9,000 9,000
2008 19,000 19,000 20,000 20,000
2009 19,000 19,000 20,000 20,000
2010 9,000 9,000 11,000 11,000
2011 26,000 26,000 30,000 30,000
2012 18,000 18,000 19,000 19,000
2013 26,000 26,000 29,000 28,000
2014 10,000 10,000 19,000 18,000
2015 32,000 32,000 50,000 49,000
2016 6,000 7,000 32,000 41,138
Non Private Passenger Total 149,000 150,000 217,000 223,138
Grand Total 393,000 395,000 573,000 584,026
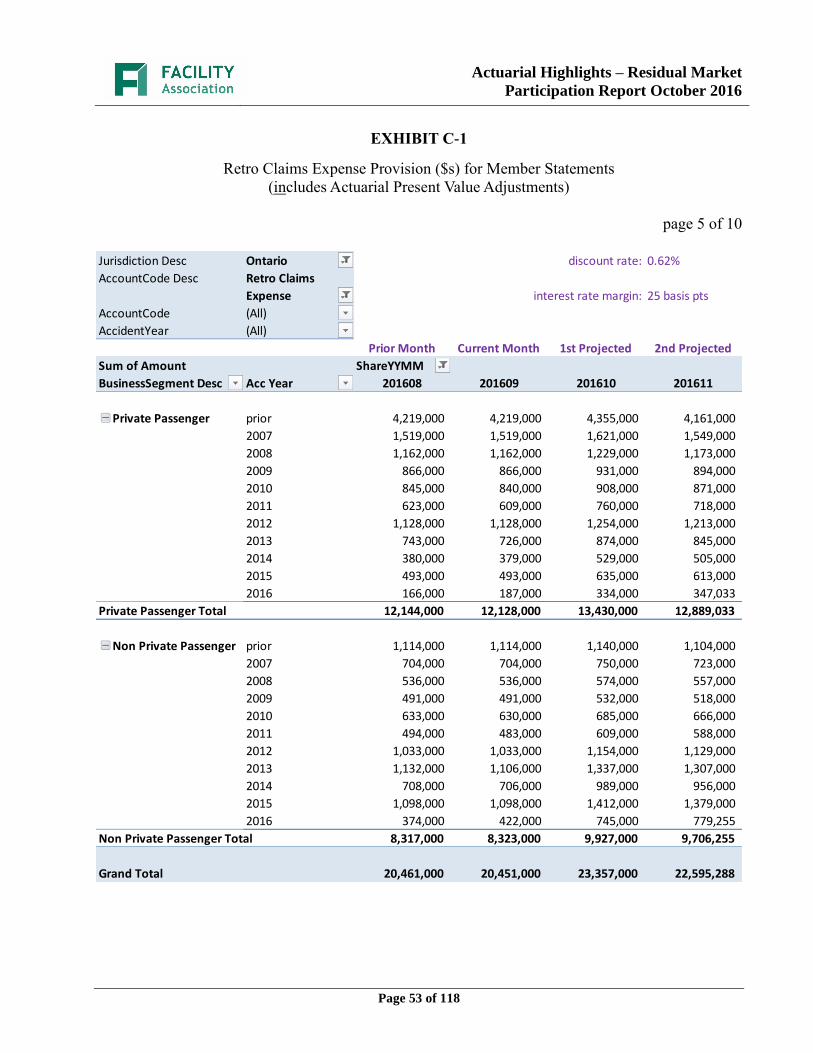
Actuarial Highlights – Residual Market
Participation Report October 2016
Page 53 of 118
EXHIBIT C-1
Retro Claims Expense Provision ($s) for Member Statements
(includes Actuarial Present Value Adjustments)
page 5 of 10
Jurisdiction Desc Ontario discount rate: 0.62%
AccountCode Desc Retro Claims
Expense interest rate margin: 25 basis pts
AccountCode (All)
AccidentYear (All)
Prior Month Current Month 1st Projected 2nd Projected
Sum of Amount ShareYYMM
BusinessSegment Desc Acc Year 201608 201609 201610 201611
Private Passenger prior 4,219,000 4,219,000 4,355,000 4,161,000
2007 1,519,000 1,519,000 1,621,000 1,549,000
2008 1,162,000 1,162,000 1,229,000 1,173,000
2009 866,000 866,000 931,000 894,000
2010 845,000 840,000 908,000 871,000
2011 623,000 609,000 760,000 718,000
2012 1,128,000 1,128,000 1,254,000 1,213,000
2013 743,000 726,000 874,000 845,000
2014 380,000 379,000 529,000 505,000
2015 493,000 493,000 635,000 613,000
2016 166,000 187,000 334,000 347,033
Private Passenger Total 12,144,000 12,128,000 13,430,000 12,889,033
Non Private Passenger prior 1,114,000 1,114,000 1,140,000 1,104,000
2007 704,000 704,000 750,000 723,000
2008 536,000 536,000 574,000 557,000
2009 491,000 491,000 532,000 518,000
2010 633,000 630,000 685,000 666,000
2011 494,000 483,000 609,000 588,000
2012 1,033,000 1,033,000 1,154,000 1,129,000
2013 1,132,000 1,106,000 1,337,000 1,307,000
2014 708,000 706,000 989,000 956,000
2015 1,098,000 1,098,000 1,412,000 1,379,000
2016 374,000 422,000 745,000 779,255
Non Private Passenger Total 8,317,000 8,323,000 9,927,000 9,706,255
Grand Total 20,461,000 20,451,000 23,357,000 22,595,288
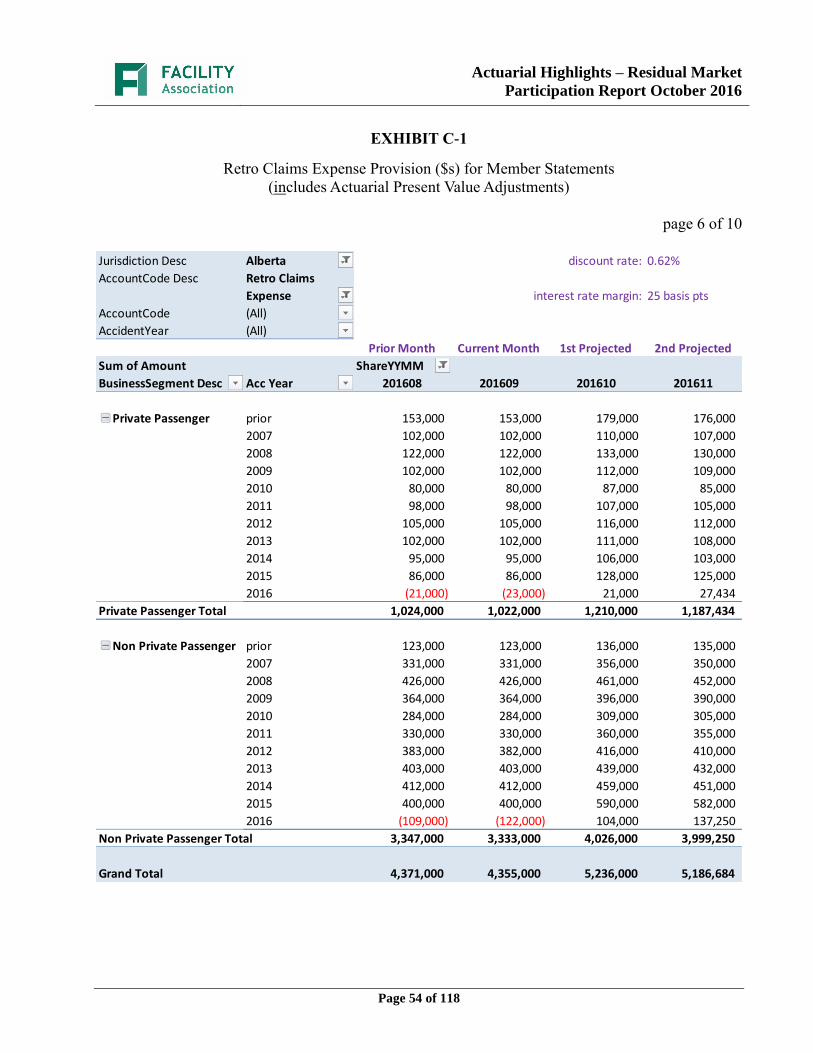
Actuarial Highlights – Residual Market
Participation Report October 2016
Page 54 of 118
EXHIBIT C-1
Retro Claims Expense Provision ($s) for Member Statements
(includes Actuarial Present Value Adjustments)
page 6 of 10
Jurisdiction Desc Alberta discount rate: 0.62%
AccountCode Desc Retro Claims
Expense interest rate margin: 25 basis pts
AccountCode (All)
AccidentYear (All)
Prior Month Current Month 1st Projected 2nd Projected
Sum of Amount ShareYYMM
BusinessSegment Desc Acc Year 201608 201609 201610 201611
Private Passenger prior 153,000 153,000 179,000 176,000
2007 102,000 102,000 110,000 107,000
2008 122,000 122,000 133,000 130,000
2009 102,000 102,000 112,000 109,000
2010 80,000 80,000 87,000 85,000
2011 98,000 98,000 107,000 105,000
2012 105,000 105,000 116,000 112,000
2013 102,000 102,000 111,000 108,000
2014 95,000 95,000 106,000 103,000
2015 86,000 86,000 128,000 125,000
2016 (21,000) (23,000) 21,000 27,434
Private Passenger Total 1,024,000 1,022,000 1,210,000 1,187,434
Non Private Passenger prior 123,000 123,000 136,000 135,000
2007 331,000 331,000 356,000 350,000
2008 426,000 426,000 461,000 452,000
2009 364,000 364,000 396,000 390,000
2010 284,000 284,000 309,000 305,000
2011 330,000 330,000 360,000 355,000
2012 383,000 382,000 416,000 410,000
2013 403,000 403,000 439,000 432,000
2014 412,000 412,000 459,000 451,000
2015 400,000 400,000 590,000 582,000
2016 (109,000) (122,000) 104,000 137,250
Non Private Passenger Total 3,347,000 3,333,000 4,026,000 3,999,250
Grand Total 4,371,000 4,355,000 5,236,000 5,186,684
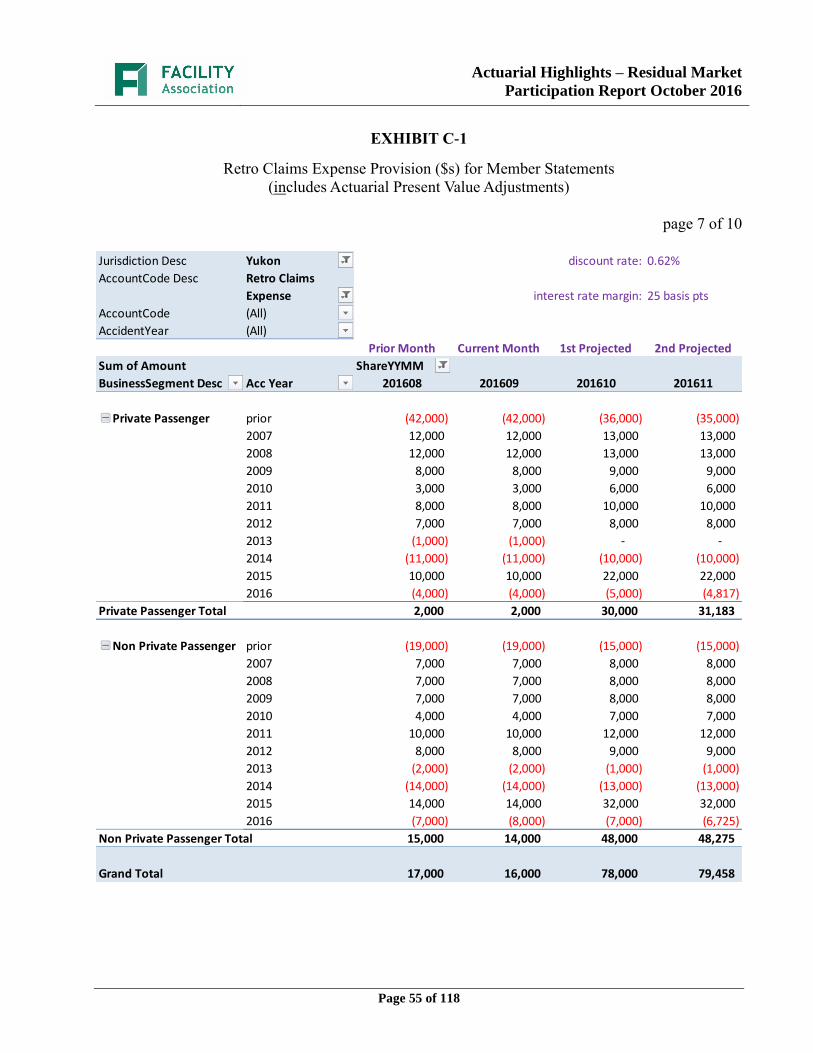
Actuarial Highlights – Residual Market
Participation Report October 2016
Page 55 of 118
EXHIBIT C-1
Retro Claims Expense Provision ($s) for Member Statements
(includes Actuarial Present Value Adjustments)
page 7 of 10
Jurisdiction Desc Yukon discount rate: 0.62%
AccountCode Desc Retro Claims
Expense interest rate margin: 25 basis pts
AccountCode (All)
AccidentYear (All)
Prior Month Current Month 1st Projected 2nd Projected
Sum of Amount ShareYYMM
BusinessSegment Desc Acc Year 201608 201609 201610 201611
Private Passenger prior (42,000) (42,000) (36,000) (35,000)
2007 12,000 12,000 13,000 13,000
2008 12,000 12,000 13,000 13,000
2009 8,000 8,000 9,000 9,000
2010 3,000 3,000 6,000 6,000
2011 8,000 8,000 10,000 10,000
2012 7,000 7,000 8,000 8,000
2013 (1,000) (1,000) - -
2014 (11,000) (11,000) (10,000) (10,000)
2015 10,000 10,000 22,000 22,000
2016 (4,000) (4,000) (5,000) (4,817)
Private Passenger Total 2,000 2,000 30,000 31,183
Non Private Passenger prior (19,000) (19,000) (15,000) (15,000)
2007 7,000 7,000 8,000 8,000
2008 7,000 7,000 8,000 8,000
2009 7,000 7,000 8,000 8,000
2010 4,000 4,000 7,000 7,000
2011 10,000 10,000 12,000 12,000
2012 8,000 8,000 9,000 9,000
2013 (2,000) (2,000) (1,000) (1,000)
2014 (14,000) (14,000) (13,000) (13,000)
2015 14,000 14,000 32,000 32,000
2016 (7,000) (8,000) (7,000) (6,725)
Non Private Passenger Total 15,000 14,000 48,000 48,275
Grand Total 17,000 16,000 78,000 79,458

Actuarial Highlights – Residual Market
Participation Report October 2016
Page 56 of 118
EXHIBIT C-1
Retro Claims Expense Provision ($s) for Member Statements
(includes Actuarial Present Value Adjustments)
page 8 of 10
Jurisdiction Desc Northwest
Territories discount rate: 0.62%
AccountCode Desc Retro Claims
Expense interest rate margin: 25 basis pts
AccountCode (All)
AccidentYear (All)
Prior Month Current Month 1st Projected 2nd Projected
Sum of Amount ShareYYMM
BusinessSegment Desc Acc Year 201608 201609 201610 201611
Private Passenger prior 28,000 28,000 31,000 31,000
2007 24,000 24,000 25,000 25,000
2008 34,000 34,000 36,000 36,000
2009 31,000 31,000 34,000 34,000
2010 24,000 24,000 26,000 26,000
2011 27,000 27,000 30,000 30,000
2012 28,000 28,000 31,000 31,000
2013 27,000 27,000 42,000 42,000
2014 11,000 11,000 45,000 45,000
2015 87,000 87,000 104,000 104,000
2016 (40,000) (45,000) (45,000) (59,590)
Private Passenger Total 281,000 276,000 359,000 344,410
Non Private Passenger prior 8,000 8,000 8,000 8,000
2007 7,000 7,000 8,000 8,000
2008 10,000 10,000 11,000 11,000
2009 9,000 9,000 10,000 10,000
2010 8,000 8,000 9,000 9,000
2011 9,000 9,000 10,000 10,000
2012 10,000 10,000 11,000 11,000
2013 10,000 10,000 16,000 16,000
2014 4,000 4,000 16,000 16,000
2015 28,000 28,000 35,000 35,000
2016 (14,000) (17,000) (17,000) (21,517)
Non Private Passenger Total 89,000 86,000 117,000 112,483
Grand Total 370,000 362,000 476,000 456,893
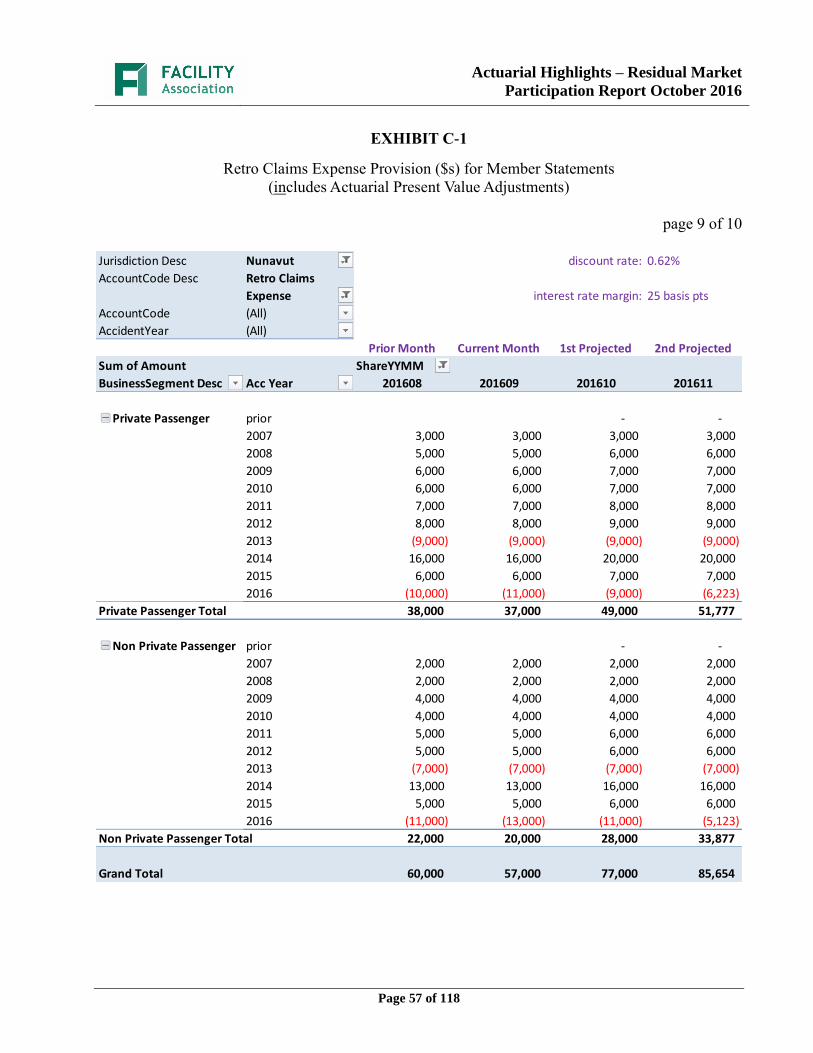
Actuarial Highlights – Residual Market
Participation Report October 2016
Page 57 of 118
EXHIBIT C-1
Retro Claims Expense Provision ($s) for Member Statements
(includes Actuarial Present Value Adjustments)
page 9 of 10
Jurisdiction Desc Nunavut discount rate: 0.62%
AccountCode Desc Retro Claims
Expense interest rate margin: 25 basis pts
AccountCode (All)
AccidentYear (All)
Prior Month Current Month 1st Projected 2nd Projected
Sum of Amount ShareYYMM
BusinessSegment Desc Acc Year 201608 201609 201610 201611
Private Passenger prior - -
2007 3,000 3,000 3,000 3,000
2008 5,000 5,000 6,000 6,000
2009 6,000 6,000 7,000 7,000
2010 6,000 6,000 7,000 7,000
2011 7,000 7,000 8,000 8,000
2012 8,000 8,000 9,000 9,000
2013 (9,000) (9,000) (9,000) (9,000)
2014 16,000 16,000 20,000 20,000
2015 6,000 6,000 7,000 7,000
2016 (10,000) (11,000) (9,000) (6,223)
Private Passenger Total 38,000 37,000 49,000 51,777
Non Private Passenger prior - -
2007 2,000 2,000 2,000 2,000
2008 2,000 2,000 2,000 2,000
2009 4,000 4,000 4,000 4,000
2010 4,000 4,000 4,000 4,000
2011 5,000 5,000 6,000 6,000
2012 5,000 5,000 6,000 6,000
2013 (7,000) (7,000) (7,000) (7,000)
2014 13,000 13,000 16,000 16,000
2015 5,000 5,000 6,000 6,000
2016 (11,000) (13,000) (11,000) (5,123)
Non Private Passenger Total 22,000 20,000 28,000 33,877
Grand Total 60,000 57,000 77,000 85,654

Actuarial Highlights – Residual Market
Participation Report October 2016
Page 58 of 118
EXHIBIT C-1
Retro Claims Expense Provision ($s) for Member Statements
(includes Actuarial Present Value Adjustments)
page 10 of 10
Jurisdiction Desc (All) discount rate: 0.62%
AccountCode Desc Retro Claims
Expense interest rate margin: 25 basis pts
AccountCode (All)
AccidentYear (All)
Prior Month Current Month 1st Projected 2nd Projected
Sum of Amount ShareYYMM
BusinessSegment Desc Acc Year 201608 201609 201610 201611
Private Passenger prior 5,046,000 5,046,000 5,331,000 5,113,000
2007 2,191,000 2,191,000 2,348,000 2,254,000
2008 1,936,000 1,936,000 2,073,000 1,995,000
2009 1,568,000 1,568,000 1,698,000 1,642,000
2010 1,386,000 1,397,000 1,520,000 1,469,000
2011 1,564,000 1,547,000 1,815,000 1,753,000
2012 2,081,000 2,081,000 2,335,000 2,273,000
2013 1,519,000 1,501,000 1,855,000 1,804,000
2014 1,108,000 1,106,000 1,539,000 1,493,000
2015 1,368,000 1,367,000 1,929,000 1,863,000
2016 502,000 566,000 1,153,000 1,233,742
Private Passenger Total 20,269,000 20,306,000 23,596,000 22,892,742
Non Private Passenger prior 1,381,000 1,381,000 1,461,000 1,422,000
2007 1,274,000 1,274,000 1,368,000 1,329,000
2008 1,249,000 1,249,000 1,343,000 1,310,000
2009 1,171,000 1,171,000 1,273,000 1,246,000
2010 1,190,000 1,198,000 1,306,000 1,277,000
2011 1,311,000 1,299,000 1,520,000 1,484,000
2012 1,926,000 1,925,000 2,137,000 2,095,000
2013 1,927,000 1,901,000 2,295,000 2,248,000
2014 1,475,000 1,472,000 1,954,000 1,903,000
2015 1,959,000 1,959,000 2,671,000 2,613,000
2016 427,000 484,000 1,249,000 1,351,789
Non Private Passenger Total 15,290,000 15,313,000 18,577,000 18,278,789
Grand Total 35,559,000 35,619,000 42,173,000 41,171,531
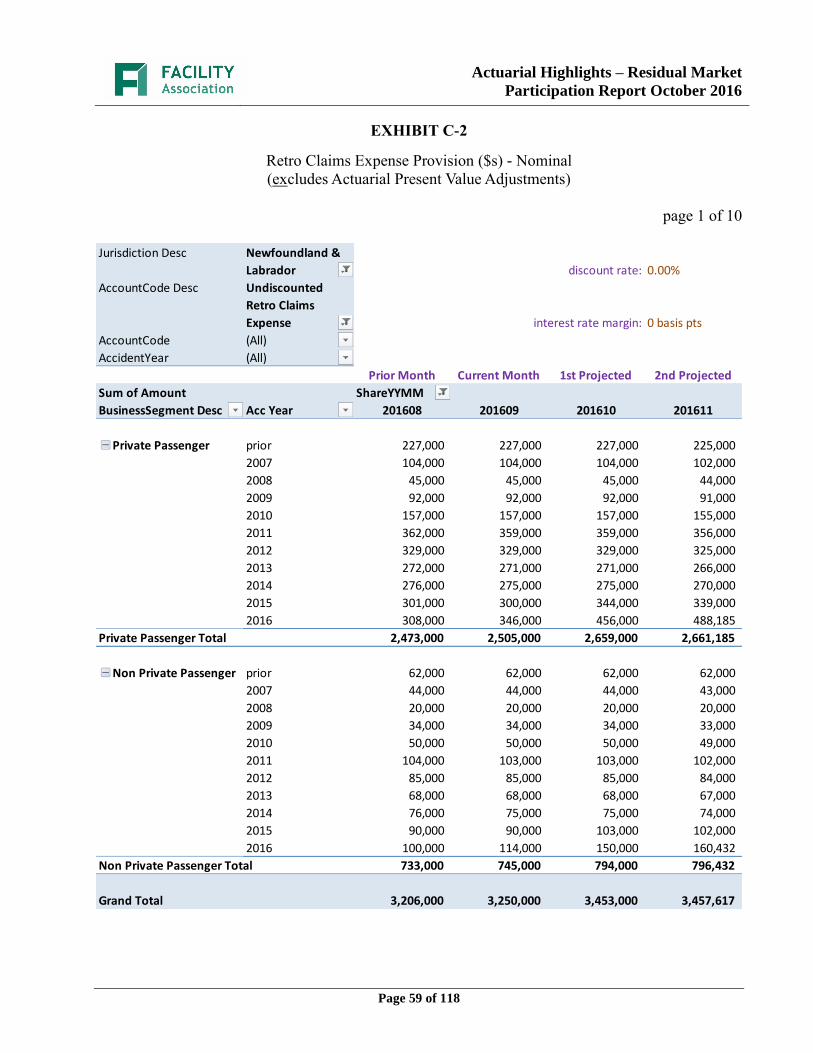
Actuarial Highlights – Residual Market
Participation Report October 2016
Page 59 of 118
EXHIBIT C-2
Retro Claims Expense Provision ($s) - Nominal
(excludes Actuarial Present Value Adjustments)
page 1 of 10
Jurisdiction Desc Newfoundland &
Labrador discount rate: 0.00%
AccountCode Desc Undiscounted
Retro Claims
Expense interest rate margin: 0 basis pts
AccountCode (All)
AccidentYear (All)
Prior Month Current Month 1st Projected 2nd Projected
Sum of Amount ShareYYMM
BusinessSegment Desc Acc Year 201608 201609 201610 201611
Private Passenger prior 227,000 227,000 227,000 225,000
2007 104,000 104,000 104,000 102,000
2008 45,000 45,000 45,000 44,000
2009 92,000 92,000 92,000 91,000
2010 157,000 157,000 157,000 155,000
2011 362,000 359,000 359,000 356,000
2012 329,000 329,000 329,000 325,000
2013 272,000 271,000 271,000 266,000
2014 276,000 275,000 275,000 270,000
2015 301,000 300,000 344,000 339,000
2016 308,000 346,000 456,000 488,185
Private Passenger Total 2,473,000 2,505,000 2,659,000 2,661,185
Non Private Passenger prior 62,000 62,000 62,000 62,000
2007 44,000 44,000 44,000 43,000
2008 20,000 20,000 20,000 20,000
2009 34,000 34,000 34,000 33,000
2010 50,000 50,000 50,000 49,000
2011 104,000 103,000 103,000 102,000
2012 85,000 85,000 85,000 84,000
2013 68,000 68,000 68,000 67,000
2014 76,000 75,000 75,000 74,000
2015 90,000 90,000 103,000 102,000
2016 100,000 114,000 150,000 160,432
Non Private Passenger Total 733,000 745,000 794,000 796,432
Grand Total 3,206,000 3,250,000 3,453,000 3,457,617
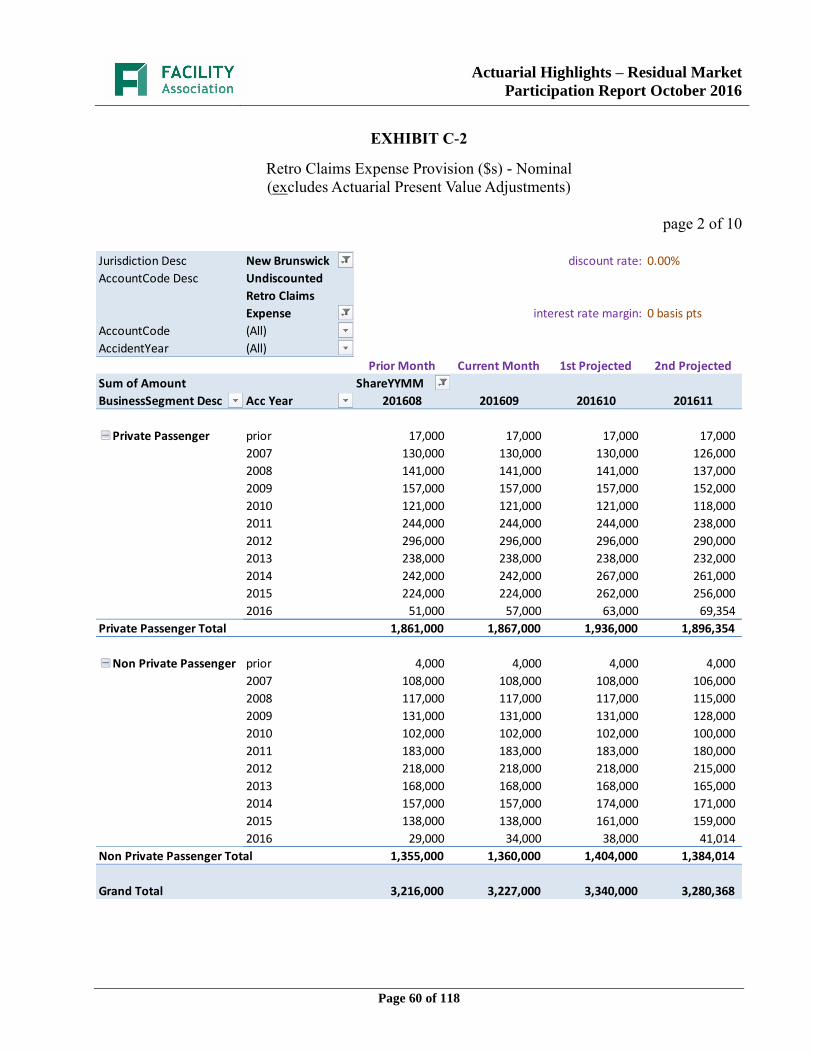
Actuarial Highlights – Residual Market
Participation Report October 2016
Page 60 of 118
EXHIBIT C-2
Retro Claims Expense Provision ($s) - Nominal
(excludes Actuarial Present Value Adjustments)
page 2 of 10
Jurisdiction Desc New Brunswick discount rate: 0.00%
AccountCode Desc Undiscounted
Retro Claims
Expense interest rate margin: 0 basis pts
AccountCode (All)
AccidentYear (All)
Prior Month Current Month 1st Projected 2nd Projected
Sum of Amount ShareYYMM
BusinessSegment Desc Acc Year 201608 201609 201610 201611
Private Passenger prior 17,000 17,000 17,000 17,000
2007 130,000 130,000 130,000 126,000
2008 141,000 141,000 141,000 137,000
2009 157,000 157,000 157,000 152,000
2010 121,000 121,000 121,000 118,000
2011 244,000 244,000 244,000 238,000
2012 296,000 296,000 296,000 290,000
2013 238,000 238,000 238,000 232,000
2014 242,000 242,000 267,000 261,000
2015 224,000 224,000 262,000 256,000
2016 51,000 57,000 63,000 69,354
Private Passenger Total 1,861,000 1,867,000 1,936,000 1,896,354
Non Private Passenger prior 4,000 4,000 4,000 4,000
2007 108,000 108,000 108,000 106,000
2008 117,000 117,000 117,000 115,000
2009 131,000 131,000 131,000 128,000
2010 102,000 102,000 102,000 100,000
2011 183,000 183,000 183,000 180,000
2012 218,000 218,000 218,000 215,000
2013 168,000 168,000 168,000 165,000
2014 157,000 157,000 174,000 171,000
2015 138,000 138,000 161,000 159,000
2016 29,000 34,000 38,000 41,014
Non Private Passenger Total 1,355,000 1,360,000 1,404,000 1,384,014
Grand Total 3,216,000 3,227,000 3,340,000 3,280,368

Actuarial Highlights – Residual Market
Participation Report October 2016
Page 61 of 118
EXHIBIT C-2
Retro Claims Expense Provision ($s) - Nominal
(excludes Actuarial Present Value Adjustments)
page 3 of 10
Jurisdiction Desc Nova Scotia discount rate: 0.00%
AccountCode Desc Undiscounted
Retro Claims
Expense interest rate margin: 0 basis pts
AccountCode (All)
AccidentYear (All)
Prior Month Current Month 1st Projected 2nd Projected
Sum of Amount ShareYYMM
BusinessSegment Desc Acc Year 201608 201609 201610 201611
Private Passenger prior 491,000 491,000 491,000 482,000
2007 277,000 277,000 277,000 271,000
2008 378,000 378,000 378,000 370,000
2009 274,000 274,000 274,000 269,000
2010 136,000 152,000 152,000 149,000
2011 152,000 152,000 152,000 149,000
2012 149,000 149,000 140,000 138,000
2013 106,000 106,000 130,000 128,000
2014 83,000 83,000 90,000 88,000
2015 113,000 113,000 113,000 111,000
2016 43,000 49,000 61,000 67,478
Private Passenger Total 2,202,000 2,224,000 2,258,000 2,222,478
Non Private Passenger prior 113,000 113,000 113,000 112,000
2007 63,000 63,000 63,000 62,000
2008 112,000 112,000 112,000 110,000
2009 112,000 112,000 112,000 110,000
2010 96,000 107,000 107,000 105,000
2011 150,000 150,000 150,000 147,000
2012 166,000 166,000 156,000 153,000
2013 129,000 129,000 159,000 156,000
2014 109,000 109,000 118,000 115,000
2015 154,000 154,000 154,000 151,000
2016 59,000 67,000 84,000 91,065
Non Private Passenger Total 1,263,000 1,282,000 1,328,000 1,312,065
Grand Total 3,465,000 3,506,000 3,586,000 3,534,543
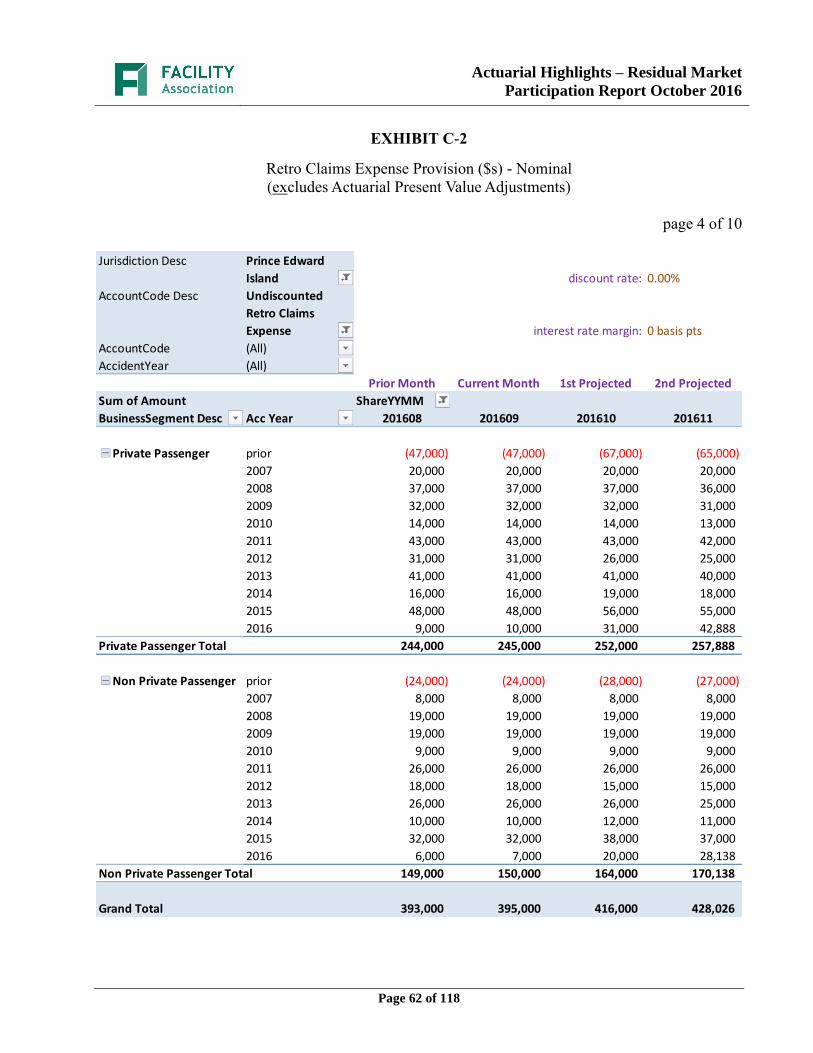
Actuarial Highlights – Residual Market
Participation Report October 2016
Page 62 of 118
EXHIBIT C-2
Retro Claims Expense Provision ($s) - Nominal
(excludes Actuarial Present Value Adjustments)
page 4 of 10
Jurisdiction Desc Prince Edward
Island discount rate: 0.00%
AccountCode Desc Undiscounted
Retro Claims
Expense interest rate margin: 0 basis pts
AccountCode (All)
AccidentYear (All)
Prior Month Current Month 1st Projected 2nd Projected
Sum of Amount ShareYYMM
BusinessSegment Desc Acc Year 201608 201609 201610 201611
Private Passenger prior (47,000) (47,000) (67,000) (65,000)
2007 20,000 20,000 20,000 20,000
2008 37,000 37,000 37,000 36,000
2009 32,000 32,000 32,000 31,000
2010 14,000 14,000 14,000 13,000
2011 43,000 43,000 43,000 42,000
2012 31,000 31,000 26,000 25,000
2013 41,000 41,000 41,000 40,000
2014 16,000 16,000 19,000 18,000
2015 48,000 48,000 56,000 55,000
2016 9,000 10,000 31,000 42,888
Private Passenger Total 244,000 245,000 252,000 257,888
Non Private Passenger prior (24,000) (24,000) (28,000) (27,000)
2007 8,000 8,000 8,000 8,000
2008 19,000 19,000 19,000 19,000
2009 19,000 19,000 19,000 19,000
2010 9,000 9,000 9,000 9,000
2011 26,000 26,000 26,000 26,000
2012 18,000 18,000 15,000 15,000
2013 26,000 26,000 26,000 25,000
2014 10,000 10,000 12,000 11,000
2015 32,000 32,000 38,000 37,000
2016 6,000 7,000 20,000 28,138
Non Private Passenger Total 149,000 150,000 164,000 170,138
Grand Total 393,000 395,000 416,000 428,026
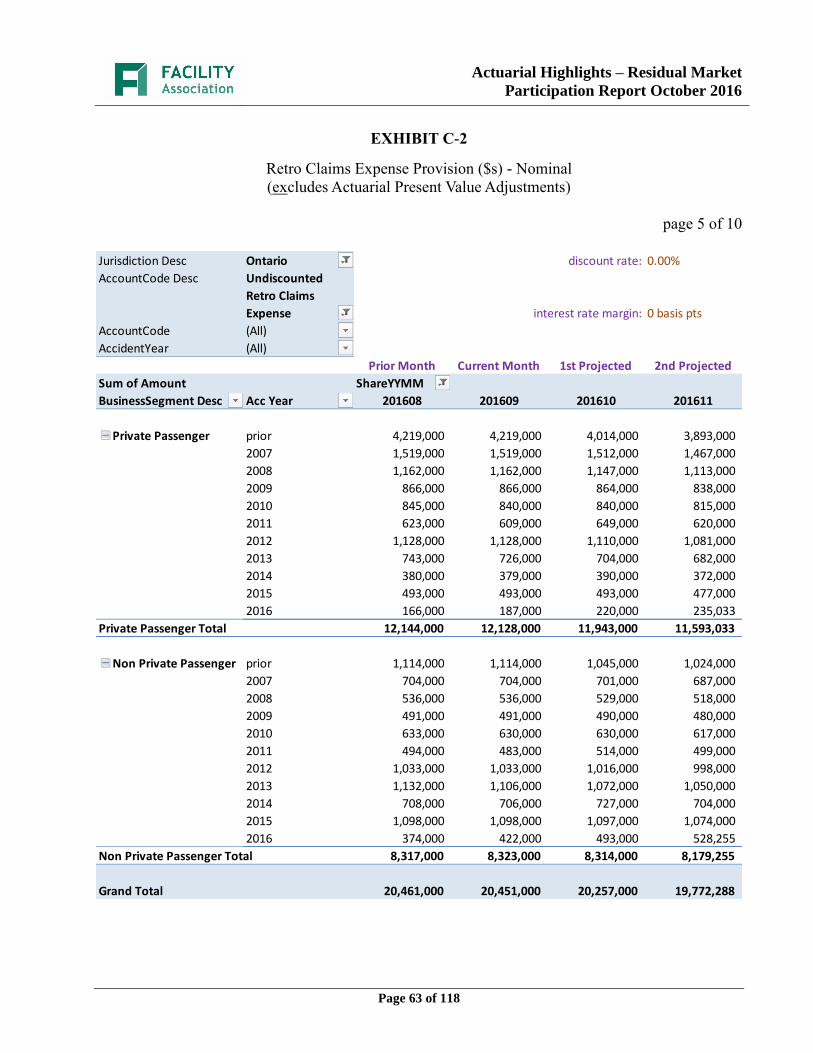
Actuarial Highlights – Residual Market
Participation Report October 2016
Page 63 of 118
EXHIBIT C-2
Retro Claims Expense Provision ($s) - Nominal
(excludes Actuarial Present Value Adjustments)
page 5 of 10
Jurisdiction Desc Ontario discount rate: 0.00%
AccountCode Desc Undiscounted
Retro Claims
Expense interest rate margin: 0 basis pts
AccountCode (All)
AccidentYear (All)
Prior Month Current Month 1st Projected 2nd Projected
Sum of Amount ShareYYMM
BusinessSegment Desc Acc Year 201608 201609 201610 201611
Private Passenger prior 4,219,000 4,219,000 4,014,000 3,893,000
2007 1,519,000 1,519,000 1,512,000 1,467,000
2008 1,162,000 1,162,000 1,147,000 1,113,000
2009 866,000 866,000 864,000 838,000
2010 845,000 840,000 840,000 815,000
2011 623,000 609,000 649,000 620,000
2012 1,128,000 1,128,000 1,110,000 1,081,000
2013 743,000 726,000 704,000 682,000
2014 380,000 379,000 390,000 372,000
2015 493,000 493,000 493,000 477,000
2016 166,000 187,000 220,000 235,033
Private Passenger Total 12,144,000 12,128,000 11,943,000 11,593,033
Non Private Passenger prior 1,114,000 1,114,000 1,045,000 1,024,000
2007 704,000 704,000 701,000 687,000
2008 536,000 536,000 529,000 518,000
2009 491,000 491,000 490,000 480,000
2010 633,000 630,000 630,000 617,000
2011 494,000 483,000 514,000 499,000
2012 1,033,000 1,033,000 1,016,000 998,000
2013 1,132,000 1,106,000 1,072,000 1,050,000
2014 708,000 706,000 727,000 704,000
2015 1,098,000 1,098,000 1,097,000 1,074,000
2016 374,000 422,000 493,000 528,255
Non Private Passenger Total 8,317,000 8,323,000 8,314,000 8,179,255
Grand Total 20,461,000 20,451,000 20,257,000 19,772,288
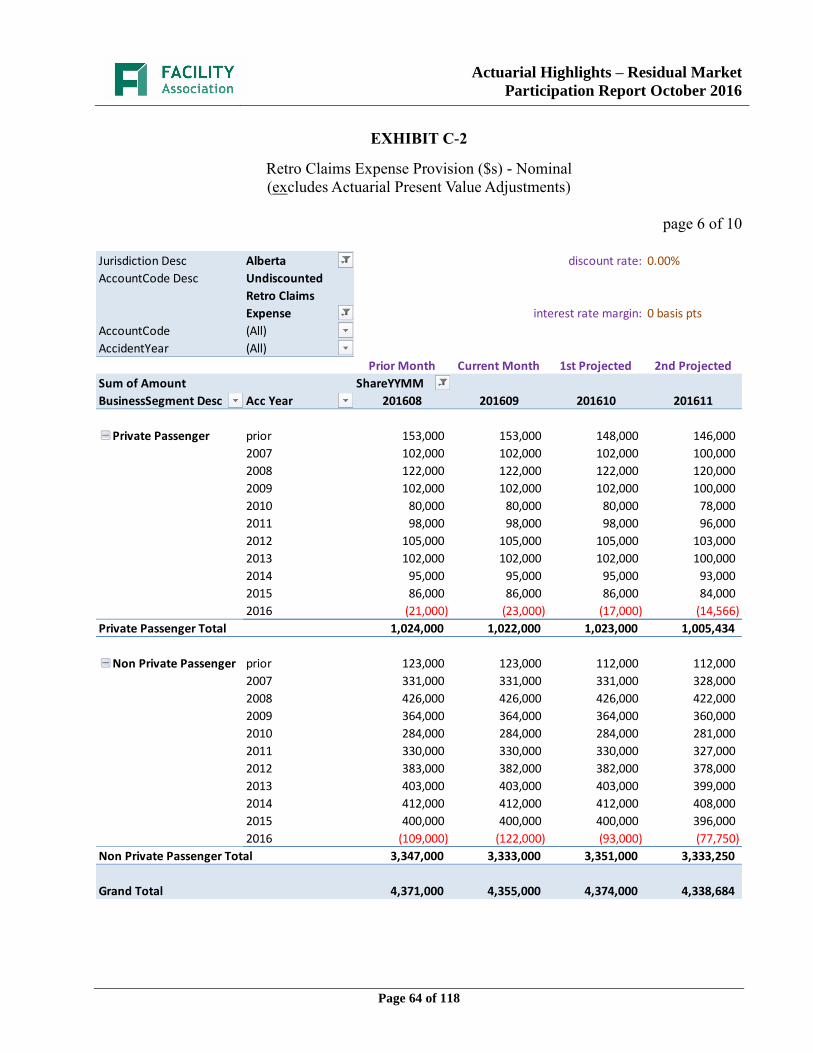
Actuarial Highlights – Residual Market
Participation Report October 2016
Page 64 of 118
EXHIBIT C-2
Retro Claims Expense Provision ($s) - Nominal
(excludes Actuarial Present Value Adjustments)
page 6 of 10
Jurisdiction Desc Alberta discount rate: 0.00%
AccountCode Desc Undiscounted
Retro Claims
Expense interest rate margin: 0 basis pts
AccountCode (All)
AccidentYear (All)
Prior Month Current Month 1st Projected 2nd Projected
Sum of Amount ShareYYMM
BusinessSegment Desc Acc Year 201608 201609 201610 201611
Private Passenger prior 153,000 153,000 148,000 146,000
2007 102,000 102,000 102,000 100,000
2008 122,000 122,000 122,000 120,000
2009 102,000 102,000 102,000 100,000
2010 80,000 80,000 80,000 78,000
2011 98,000 98,000 98,000 96,000
2012 105,000 105,000 105,000 103,000
2013 102,000 102,000 102,000 100,000
2014 95,000 95,000 95,000 93,000
2015 86,000 86,000 86,000 84,000
2016 (21,000) (23,000) (17,000) (14,566)
Private Passenger Total 1,024,000 1,022,000 1,023,000 1,005,434
Non Private Passenger prior 123,000 123,000 112,000 112,000
2007 331,000 331,000 331,000 328,000
2008 426,000 426,000 426,000 422,000
2009 364,000 364,000 364,000 360,000
2010 284,000 284,000 284,000 281,000
2011 330,000 330,000 330,000 327,000
2012 383,000 382,000 382,000 378,000
2013 403,000 403,000 403,000 399,000
2014 412,000 412,000 412,000 408,000
2015 400,000 400,000 400,000 396,000
2016 (109,000) (122,000) (93,000) (77,750)
Non Private Passenger Total 3,347,000 3,333,000 3,351,000 3,333,250
Grand Total 4,371,000 4,355,000 4,374,000 4,338,684
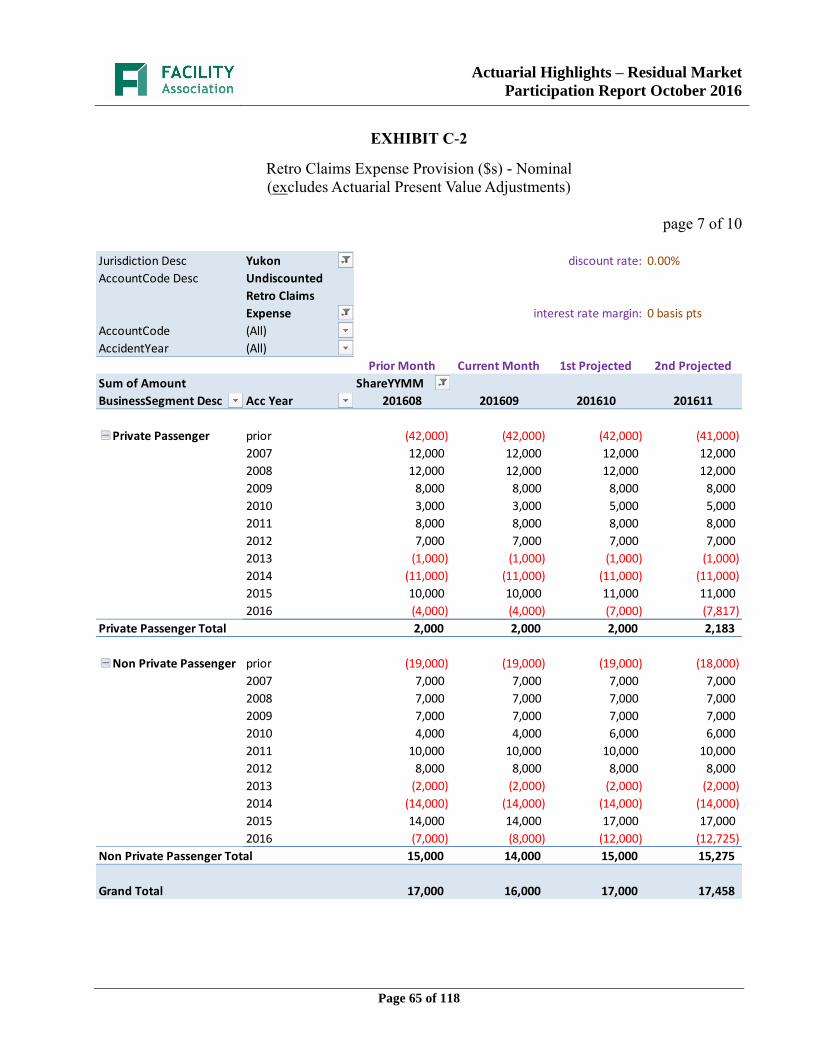
Actuarial Highlights – Residual Market
Participation Report October 2016
Page 65 of 118
EXHIBIT C-2
Retro Claims Expense Provision ($s) - Nominal
(excludes Actuarial Present Value Adjustments)
page 7 of 10
Jurisdiction Desc Yukon discount rate: 0.00%
AccountCode Desc Undiscounted
Retro Claims
Expense interest rate margin: 0 basis pts
AccountCode (All)
AccidentYear (All)
Prior Month Current Month 1st Projected 2nd Projected
Sum of Amount ShareYYMM
BusinessSegment Desc Acc Year 201608 201609 201610 201611
Private Passenger prior (42,000) (42,000) (42,000) (41,000)
2007 12,000 12,000 12,000 12,000
2008 12,000 12,000 12,000 12,000
2009 8,000 8,000 8,000 8,000
2010 3,000 3,000 5,000 5,000
2011 8,000 8,000 8,000 8,000
2012 7,000 7,000 7,000 7,000
2013 (1,000) (1,000) (1,000) (1,000)
2014 (11,000) (11,000) (11,000) (11,000)
2015 10,000 10,000 11,000 11,000
2016 (4,000) (4,000) (7,000) (7,817)
Private Passenger Total 2,000 2,000 2,000 2,183
Non Private Passenger prior (19,000) (19,000) (19,000) (18,000)
2007 7,000 7,000 7,000 7,000
2008 7,000 7,000 7,000 7,000
2009 7,000 7,000 7,000 7,000
2010 4,000 4,000 6,000 6,000
2011 10,000 10,000 10,000 10,000
2012 8,000 8,000 8,000 8,000
2013 (2,000) (2,000) (2,000) (2,000)
2014 (14,000) (14,000) (14,000) (14,000)
2015 14,000 14,000 17,000 17,000
2016 (7,000) (8,000) (12,000) (12,725)
Non Private Passenger Total 15,000 14,000 15,000 15,275
Grand Total 17,000 16,000 17,000 17,458
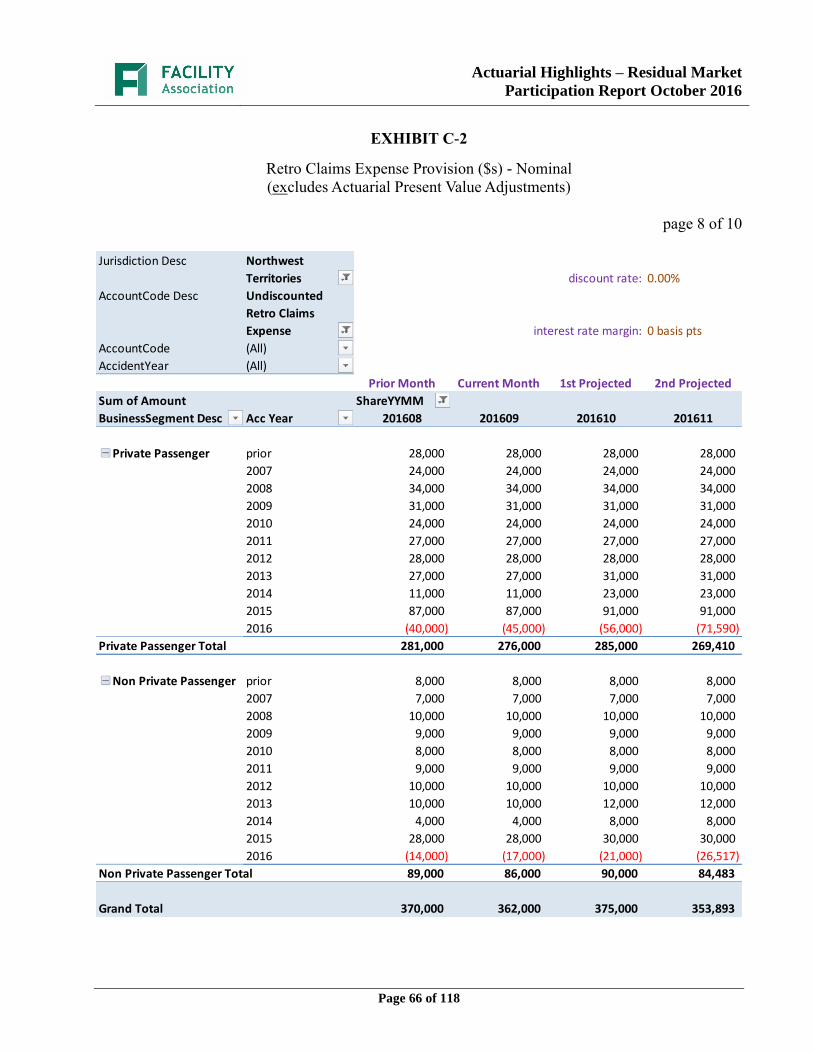
Actuarial Highlights – Residual Market
Participation Report October 2016
Page 66 of 118
EXHIBIT C-2
Retro Claims Expense Provision ($s) - Nominal
(excludes Actuarial Present Value Adjustments)
page 8 of 10
Jurisdiction Desc Northwest
Territories discount rate: 0.00%
AccountCode Desc Undiscounted
Retro Claims
Expense interest rate margin: 0 basis pts
AccountCode (All)
AccidentYear (All)
Prior Month Current Month 1st Projected 2nd Projected
Sum of Amount ShareYYMM
BusinessSegment Desc Acc Year 201608 201609 201610 201611
Private Passenger prior 28,000 28,000 28,000 28,000
2007 24,000 24,000 24,000 24,000
2008 34,000 34,000 34,000 34,000
2009 31,000 31,000 31,000 31,000
2010 24,000 24,000 24,000 24,000
2011 27,000 27,000 27,000 27,000
2012 28,000 28,000 28,000 28,000
2013 27,000 27,000 31,000 31,000
2014 11,000 11,000 23,000 23,000
2015 87,000 87,000 91,000 91,000
2016 (40,000) (45,000) (56,000) (71,590)
Private Passenger Total 281,000 276,000 285,000 269,410
Non Private Passenger prior 8,000 8,000 8,000 8,000
2007 7,000 7,000 7,000 7,000
2008 10,000 10,000 10,000 10,000
2009 9,000 9,000 9,000 9,000
2010 8,000 8,000 8,000 8,000
2011 9,000 9,000 9,000 9,000
2012 10,000 10,000 10,000 10,000
2013 10,000 10,000 12,000 12,000
2014 4,000 4,000 8,000 8,000
2015 28,000 28,000 30,000 30,000
2016 (14,000) (17,000) (21,000) (26,517)
Non Private Passenger Total 89,000 86,000 90,000 84,483
Grand Total 370,000 362,000 375,000 353,893
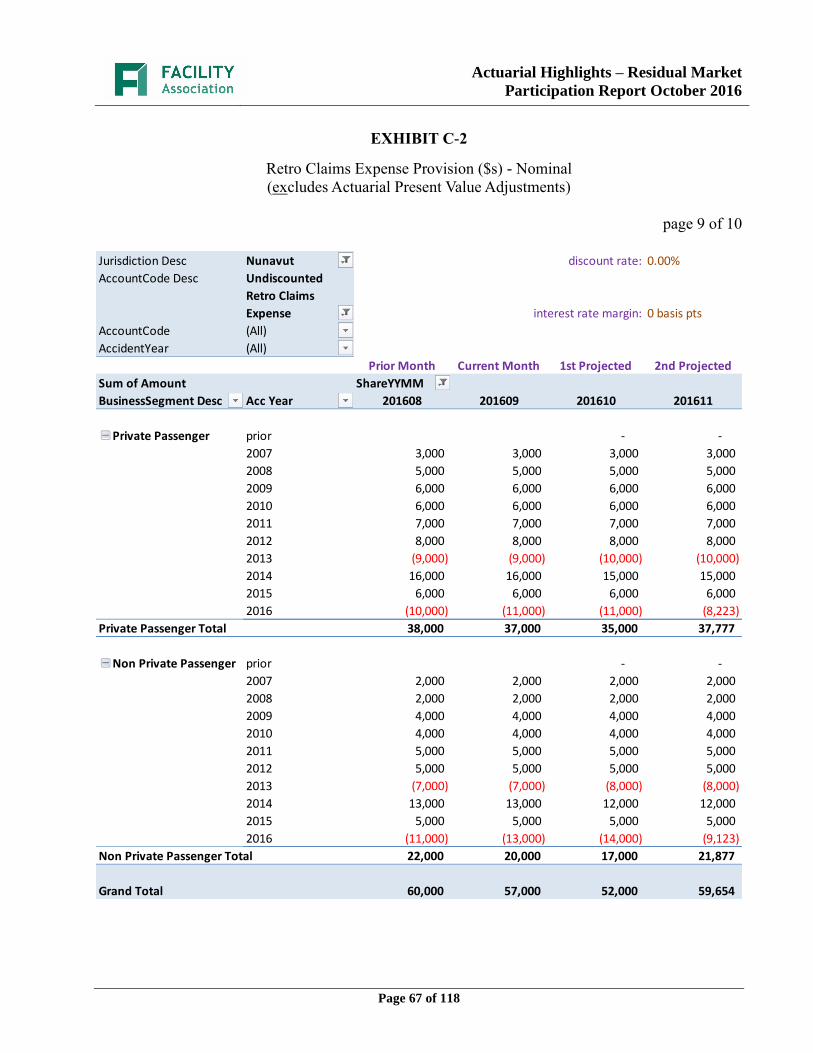
Actuarial Highlights – Residual Market
Participation Report October 2016
Page 67 of 118
EXHIBIT C-2
Retro Claims Expense Provision ($s) - Nominal
(excludes Actuarial Present Value Adjustments)
page 9 of 10
Jurisdiction Desc Nunavut discount rate: 0.00%
AccountCode Desc Undiscounted
Retro Claims
Expense interest rate margin: 0 basis pts
AccountCode (All)
AccidentYear (All)
Prior Month Current Month 1st Projected 2nd Projected
Sum of Amount ShareYYMM
BusinessSegment Desc Acc Year 201608 201609 201610 201611
Private Passenger prior - -
2007 3,000 3,000 3,000 3,000
2008 5,000 5,000 5,000 5,000
2009 6,000 6,000 6,000 6,000
2010 6,000 6,000 6,000 6,000
2011 7,000 7,000 7,000 7,000
2012 8,000 8,000 8,000 8,000
2013 (9,000) (9,000) (10,000) (10,000)
2014 16,000 16,000 15,000 15,000
2015 6,000 6,000 6,000 6,000
2016 (10,000) (11,000) (11,000) (8,223)
Private Passenger Total 38,000 37,000 35,000 37,777
Non Private Passenger prior - -
2007 2,000 2,000 2,000 2,000
2008 2,000 2,000 2,000 2,000
2009 4,000 4,000 4,000 4,000
2010 4,000 4,000 4,000 4,000
2011 5,000 5,000 5,000 5,000
2012 5,000 5,000 5,000 5,000
2013 (7,000) (7,000) (8,000) (8,000)
2014 13,000 13,000 12,000 12,000
2015 5,000 5,000 5,000 5,000
2016 (11,000) (13,000) (14,000) (9,123)
Non Private Passenger Total 22,000 20,000 17,000 21,877
Grand Total 60,000 57,000 52,000 59,654
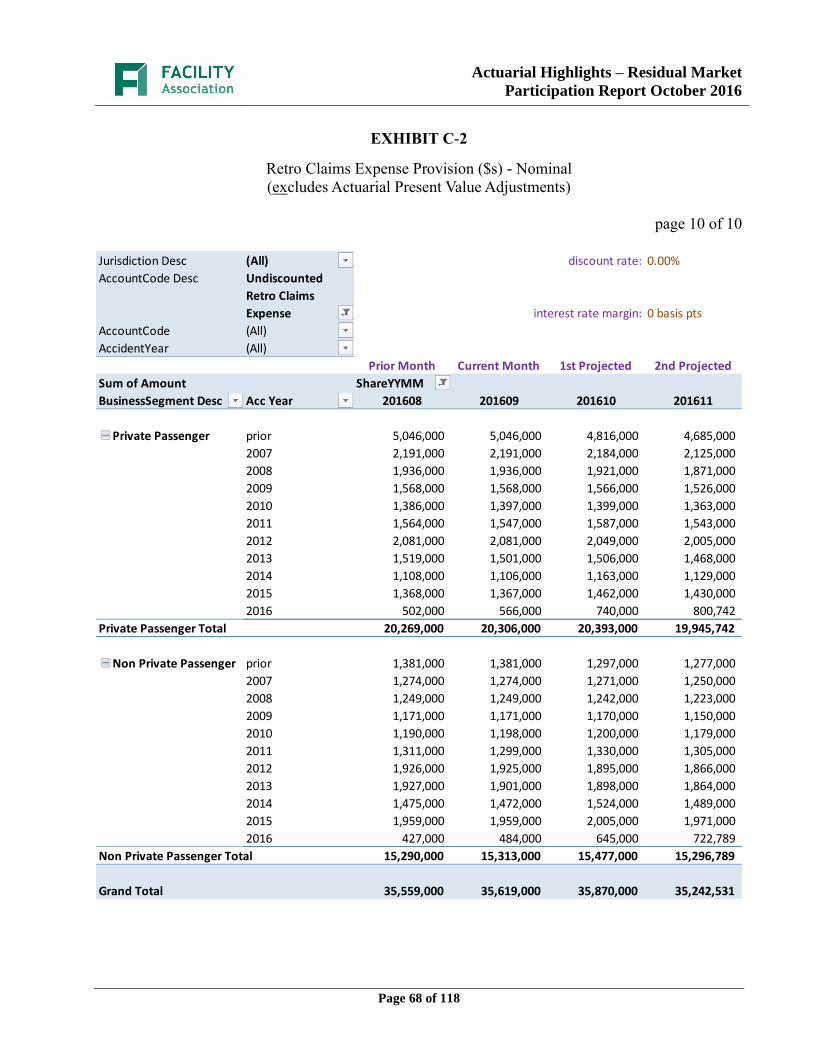
Actuarial Highlights – Residual Market
Participation Report October 2016
Page 68 of 118
EXHIBIT C-2
Retro Claims Expense Provision ($s) - Nominal
(excludes Actuarial Present Value Adjustments)
page 10 of 10
Jurisdiction Desc (All) discount rate: 0.00%
AccountCode Desc Undiscounted
Retro Claims
Expense interest rate margin: 0 basis pts
AccountCode (All)
AccidentYear (All)
Prior Month Current Month 1st Projected 2nd Projected
Sum of Amount ShareYYMM
BusinessSegment Desc Acc Year 201608 201609 201610 201611
Private Passenger prior 5,046,000 5,046,000 4,816,000 4,685,000
2007 2,191,000 2,191,000 2,184,000 2,125,000
2008 1,936,000 1,936,000 1,921,000 1,871,000
2009 1,568,000 1,568,000 1,566,000 1,526,000
2010 1,386,000 1,397,000 1,399,000 1,363,000
2011 1,564,000 1,547,000 1,587,000 1,543,000
2012 2,081,000 2,081,000 2,049,000 2,005,000
2013 1,519,000 1,501,000 1,506,000 1,468,000
2014 1,108,000 1,106,000 1,163,000 1,129,000
2015 1,368,000 1,367,000 1,462,000 1,430,000
2016 502,000 566,000 740,000 800,742
Private Passenger Total 20,269,000 20,306,000 20,393,000 19,945,742
Non Private Passenger prior 1,381,000 1,381,000 1,297,000 1,277,000
2007 1,274,000 1,274,000 1,271,000 1,250,000
2008 1,249,000 1,249,000 1,242,000 1,223,000
2009 1,171,000 1,171,000 1,170,000 1,150,000
2010 1,190,000 1,198,000 1,200,000 1,179,000
2011 1,311,000 1,299,000 1,330,000 1,305,000
2012 1,926,000 1,925,000 1,895,000 1,866,000
2013 1,927,000 1,901,000 1,898,000 1,864,000
2014 1,475,000 1,472,000 1,524,000 1,489,000
2015 1,959,000 1,959,000 2,005,000 1,971,000
2016 427,000 484,000 645,000 722,789
Non Private Passenger Total 15,290,000 15,313,000 15,477,000 15,296,789
Grand Total 35,559,000 35,619,000 35,870,000 35,242,531
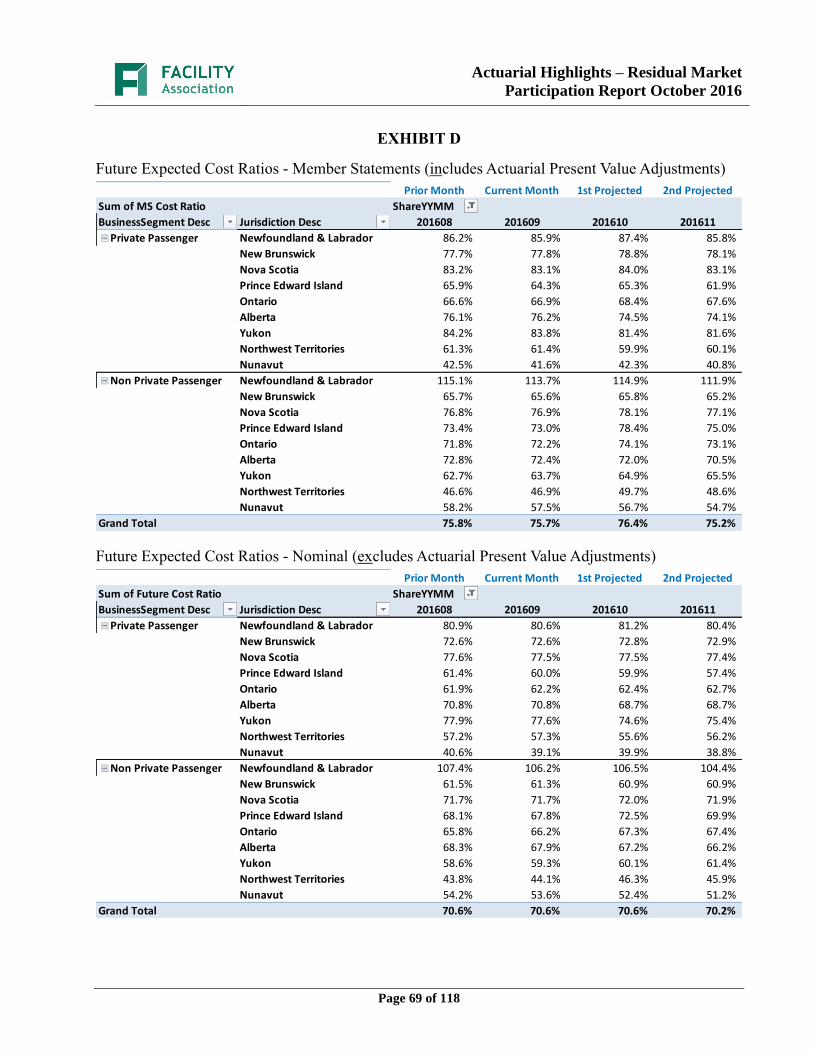
Actuarial Highlights – Residual Market
Participation Report October 2016
Page 69 of 118
EXHIBIT D
Future Expected Cost Ratios - Member Statements (includes Actuarial Present Value Adjustments)
Future Expected Cost Ratios - Nominal (excludes Actuarial Present Value Adjustments)
Prior Month Current Month 1st Projected 2nd Projected
Sum of MS Cost Ratio ShareYYMM
BusinessSegment Desc Jurisdiction Desc 201608 201609 201610 201611
Private Passenger Newfoundland & Labrador 86.2% 85.9% 87.4% 85.8%
New Brunswick 77.7% 77.8% 78.8% 78.1%
Nova Scotia 83.2% 83.1% 84.0% 83.1%
Prince Edward Island 65.9% 64.3% 65.3% 61.9%
Ontario 66.6% 66.9% 68.4% 67.6%
Alberta 76.1% 76.2% 74.5% 74.1%
Yukon 84.2% 83.8% 81.4% 81.6%
Northwest Territories 61.3% 61.4% 59.9% 60.1%
Nunavut 42.5% 41.6% 42.3% 40.8%
Non Private Passenger Newfoundland & Labrador 115.1% 113.7% 114.9% 111.9%
New Brunswick 65.7% 65.6% 65.8% 65.2%
Nova Scotia 76.8% 76.9% 78.1% 77.1%
Prince Edward Island 73.4% 73.0% 78.4% 75.0%
Ontario 71.8% 72.2% 74.1% 73.1%
Alberta 72.8% 72.4% 72.0% 70.5%
Yukon 62.7% 63.7% 64.9% 65.5%
Northwest Territories 46.6% 46.9% 49.7% 48.6%
Nunavut 58.2% 57.5% 56.7% 54.7%
Grand Total 75.8% 75.7% 76.4% 75.2%
Prior Month Current Month 1st Projected 2nd Projected
Sum of Future Cost Ratio ShareYYMM
BusinessSegment Desc Jurisdiction Desc 201608 201609 201610 201611
Private Passenger Newfoundland & Labrador 80.9% 80.6% 81.2% 80.4%
New Brunswick 72.6% 72.6% 72.8% 72.9%
Nova Scotia 77.6% 77.5% 77.5% 77.4%
Prince Edward Island 61.4% 60.0% 59.9% 57.4%
Ontario 61.9% 62.2% 62.4% 62.7%
Alberta 70.8% 70.8% 68.7% 68.7%
Yukon 77.9% 77.6% 74.6% 75.4%
Northwest Territories 57.2% 57.3% 55.6% 56.2%
Nunavut 40.6% 39.1% 39.9% 38.8%
Non Private Passenger Newfoundland & Labrador 107.4% 106.2% 106.5% 104.4%
New Brunswick 61.5% 61.3% 60.9% 60.9%
Nova Scotia 71.7% 71.7% 72.0% 71.9%
Prince Edward Island 68.1% 67.8% 72.5% 69.9%
Ontario 65.8% 66.2% 67.3% 67.4%
Alberta 68.3% 67.9% 67.2% 66.2%
Yukon 58.6% 59.3% 60.1% 61.4%
Northwest Territories 43.8% 44.1% 46.3% 45.9%
Nunavut 54.2% 53.6% 52.4% 51.2%
Grand Total 70.6% 70.6% 70.6% 70.2%

Actuarial Highlights – Residual Market
Participation Report October 2016
Page 70 of 118
EXHIBIT E
Discount Rate & Margins for Adverse Deviations
The tables below present selected margins for adverse development by coverage (the total is a
weighted average, based on the unpaid claims projection for December 31, 2016 from the valuation),
followed by the selected discount rate and the associated margin for investment income.
page 1 of 9
NEWFOUNDLAND AND LABRADOR
Private Passenger Non-Private Passenger
Selected Margins for Adverse Development Selected Margins for Adverse Development
Accident
Year
Third Party
Liability
Accident
Benefits
Other
CoveragesTOTAL
Third Party
Liability
Accident
Benefits
Other
CoveragesTOTAL
1995 10.0% 10.0% 5.0% 10.0% 10.0% 10.0% 5.0% 10.0%
1996 10.0% 10.0% 5.0% 10.0% 10.0% 10.0% 5.0% 10.0%
1997 10.0% 10.0% 5.0% 10.0% 10.0% 10.0% 5.0% 10.0%
1998 10.0% 10.0% 5.0% 10.0% 10.0% 10.0% 5.0% 10.0%
1999 10.0% 10.0% 5.0% 10.0% 10.0% 10.0% 5.0% 10.0%
2000 10.0% 10.0% 5.0% 10.0% 10.0% 10.0% 5.0% 10.0%
2001 10.0% 10.0% 5.0% 10.0% 10.0% 10.0% 5.0% 10.0%
2002 10.0% 10.0% 5.0% 10.0% 10.0% 10.0% 5.0% 10.0%
2003 10.0% 10.0% 5.0% 10.0% 10.0% 10.0% 5.0% 10.0%
2004 10.0% 10.0% 5.0% 10.0% 10.0% 10.0% 5.0% 10.0%
2005 10.0% 10.0% 5.0% 10.0% 10.0% 10.0% 5.0% 10.0%
2006 10.0% 10.0% 5.0% 10.0% 10.0% 10.0% 5.0% 10.0%
2007 10.0% 10.0% 5.0% 10.0% 10.0% 10.0% 5.0% 10.0%
2008 10.0% 10.0% 5.0% 10.0% 10.0% 10.0% 5.0% 10.0%
2009 10.0% 10.0% 5.0% 10.0% 10.0% 10.0% 5.0% 10.0%
2010 10.0% 10.0% 5.0% 10.0% 10.0% 10.0% 5.0% 10.0%
2011 10.0% 10.0% 5.0% 10.0% 10.0% 10.0% 5.0% 10.0%
2012 10.0% 10.0% 5.0% 10.0% 10.0% 10.0% 5.0% 10.0%
2013 10.0% 10.0% 5.0% 10.0% 10.0% 10.0% 5.0% 10.0%
2014 10.0% 10.0% 5.0% 10.0% 10.0% 10.0% 5.0% 10.0%
2015 10.0% 10.0% 5.0% 10.0% 10.0% 10.0% 5.0% 10.0%
2016 10.0% 10.0% 5.0% 9.9% 10.0% 10.0% 5.0% 10.0%
prem liab 10.0% 10.0% 5.0% 9.0% 10.0% 10.0% 5.0% 9.6%
discount rate: 0.62% discount rate: 0.62%
margin (basis points): 25 margin (basis points): 25
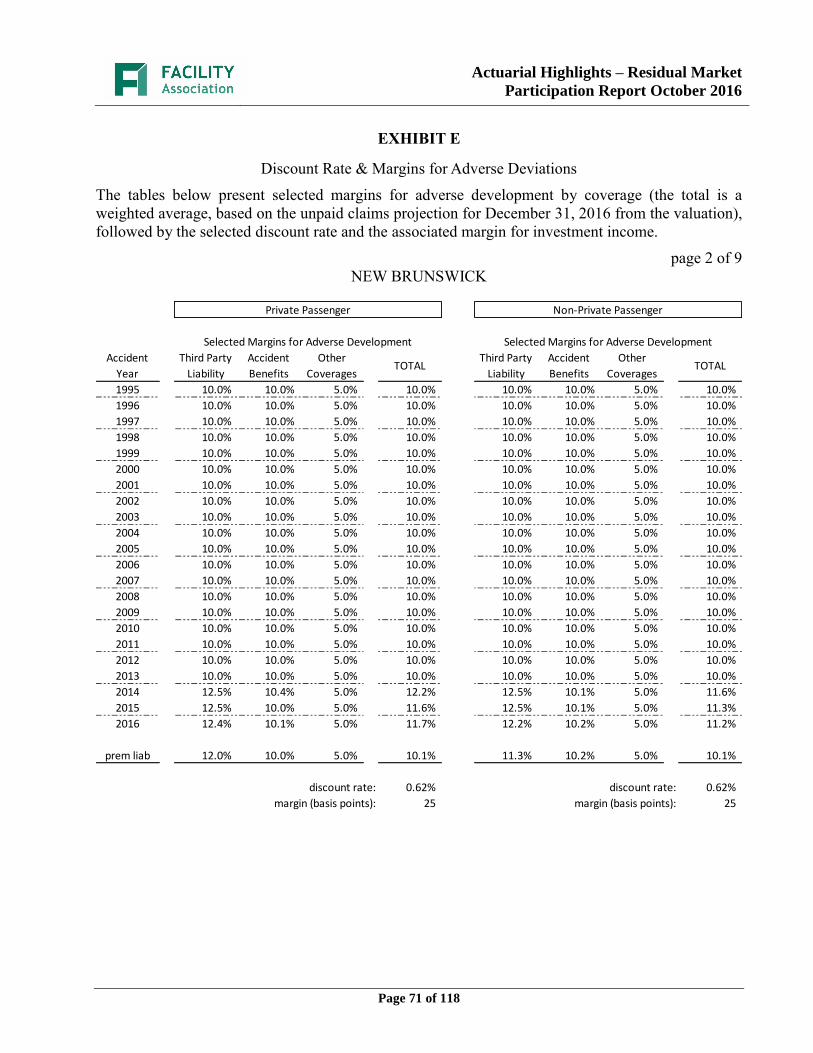
Actuarial Highlights – Residual Market
Participation Report October 2016
Page 71 of 118
EXHIBIT E
Discount Rate & Margins for Adverse Deviations
The tables below present selected margins for adverse development by coverage (the total is a
weighted average, based on the unpaid claims projection for December 31, 2016 from the valuation),
followed by the selected discount rate and the associated margin for investment income.
page 2 of 9
NEW BRUNSWICK
Private Passenger Non-Private Passenger
Selected Margins for Adverse Development Selected Margins for Adverse Development
Accident
Year
Third Party
Liability
Accident
Benefits
Other
CoveragesTOTAL
Third Party
Liability
Accident
Benefits
Other
CoveragesTOTAL
1995 10.0% 10.0% 5.0% 10.0% 10.0% 10.0% 5.0% 10.0%
1996 10.0% 10.0% 5.0% 10.0% 10.0% 10.0% 5.0% 10.0%
1997 10.0% 10.0% 5.0% 10.0% 10.0% 10.0% 5.0% 10.0%
1998 10.0% 10.0% 5.0% 10.0% 10.0% 10.0% 5.0% 10.0%
1999 10.0% 10.0% 5.0% 10.0% 10.0% 10.0% 5.0% 10.0%
2000 10.0% 10.0% 5.0% 10.0% 10.0% 10.0% 5.0% 10.0%
2001 10.0% 10.0% 5.0% 10.0% 10.0% 10.0% 5.0% 10.0%
2002 10.0% 10.0% 5.0% 10.0% 10.0% 10.0% 5.0% 10.0%
2003 10.0% 10.0% 5.0% 10.0% 10.0% 10.0% 5.0% 10.0%
2004 10.0% 10.0% 5.0% 10.0% 10.0% 10.0% 5.0% 10.0%
2005 10.0% 10.0% 5.0% 10.0% 10.0% 10.0% 5.0% 10.0%
2006 10.0% 10.0% 5.0% 10.0% 10.0% 10.0% 5.0% 10.0%
2007 10.0% 10.0% 5.0% 10.0% 10.0% 10.0% 5.0% 10.0%
2008 10.0% 10.0% 5.0% 10.0% 10.0% 10.0% 5.0% 10.0%
2009 10.0% 10.0% 5.0% 10.0% 10.0% 10.0% 5.0% 10.0%
2010 10.0% 10.0% 5.0% 10.0% 10.0% 10.0% 5.0% 10.0%
2011 10.0% 10.0% 5.0% 10.0% 10.0% 10.0% 5.0% 10.0%
2012 10.0% 10.0% 5.0% 10.0% 10.0% 10.0% 5.0% 10.0%
2013 10.0% 10.0% 5.0% 10.0% 10.0% 10.0% 5.0% 10.0%
2014 12.5% 10.4% 5.0% 12.2% 12.5% 10.1% 5.0% 11.6%
2015 12.5% 10.0% 5.0% 11.6% 12.5% 10.1% 5.0% 11.3%
2016 12.4% 10.1% 5.0% 11.7% 12.2% 10.2% 5.0% 11.2%
prem liab 12.0% 10.0% 5.0% 10.1% 11.3% 10.2% 5.0% 10.1%
discount rate: 0.62% discount rate: 0.62%
margin (basis points): 25 margin (basis points): 25
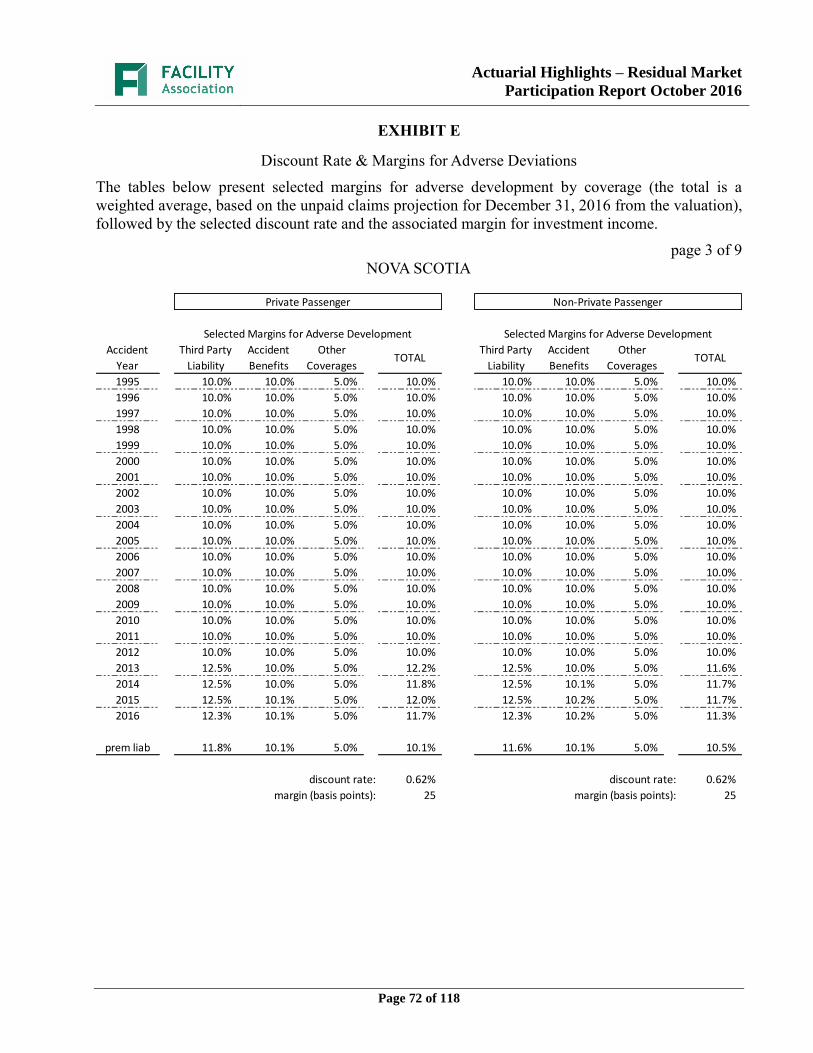
Actuarial Highlights – Residual Market
Participation Report October 2016
Page 72 of 118
EXHIBIT E
Discount Rate & Margins for Adverse Deviations
The tables below present selected margins for adverse development by coverage (the total is a
weighted average, based on the unpaid claims projection for December 31, 2016 from the valuation),
followed by the selected discount rate and the associated margin for investment income.
page 3 of 9
NOVA SCOTIA
Private Passenger Non-Private Passenger
Selected Margins for Adverse Development Selected Margins for Adverse Development
Accident
Year
Third Party
Liability
Accident
Benefits
Other
CoveragesTOTAL
Third Party
Liability
Accident
Benefits
Other
CoveragesTOTAL
1995 10.0% 10.0% 5.0% 10.0% 10.0% 10.0% 5.0% 10.0%
1996 10.0% 10.0% 5.0% 10.0% 10.0% 10.0% 5.0% 10.0%
1997 10.0% 10.0% 5.0% 10.0% 10.0% 10.0% 5.0% 10.0%
1998 10.0% 10.0% 5.0% 10.0% 10.0% 10.0% 5.0% 10.0%
1999 10.0% 10.0% 5.0% 10.0% 10.0% 10.0% 5.0% 10.0%
2000 10.0% 10.0% 5.0% 10.0% 10.0% 10.0% 5.0% 10.0%
2001 10.0% 10.0% 5.0% 10.0% 10.0% 10.0% 5.0% 10.0%
2002 10.0% 10.0% 5.0% 10.0% 10.0% 10.0% 5.0% 10.0%
2003 10.0% 10.0% 5.0% 10.0% 10.0% 10.0% 5.0% 10.0%
2004 10.0% 10.0% 5.0% 10.0% 10.0% 10.0% 5.0% 10.0%
2005 10.0% 10.0% 5.0% 10.0% 10.0% 10.0% 5.0% 10.0%
2006 10.0% 10.0% 5.0% 10.0% 10.0% 10.0% 5.0% 10.0%
2007 10.0% 10.0% 5.0% 10.0% 10.0% 10.0% 5.0% 10.0%
2008 10.0% 10.0% 5.0% 10.0% 10.0% 10.0% 5.0% 10.0%
2009 10.0% 10.0% 5.0% 10.0% 10.0% 10.0% 5.0% 10.0%
2010 10.0% 10.0% 5.0% 10.0% 10.0% 10.0% 5.0% 10.0%
2011 10.0% 10.0% 5.0% 10.0% 10.0% 10.0% 5.0% 10.0%
2012 10.0% 10.0% 5.0% 10.0% 10.0% 10.0% 5.0% 10.0%
2013 12.5% 10.0% 5.0% 12.2% 12.5% 10.0% 5.0% 11.6%
2014 12.5% 10.0% 5.0% 11.8% 12.5% 10.1% 5.0% 11.7%
2015 12.5% 10.1% 5.0% 12.0% 12.5% 10.2% 5.0% 11.7%
2016 12.3% 10.1% 5.0% 11.7% 12.3% 10.2% 5.0% 11.3%
prem liab 11.8% 10.1% 5.0% 10.1% 11.6% 10.1% 5.0% 10.5%
discount rate: 0.62% discount rate: 0.62%
margin (basis points): 25 margin (basis points): 25
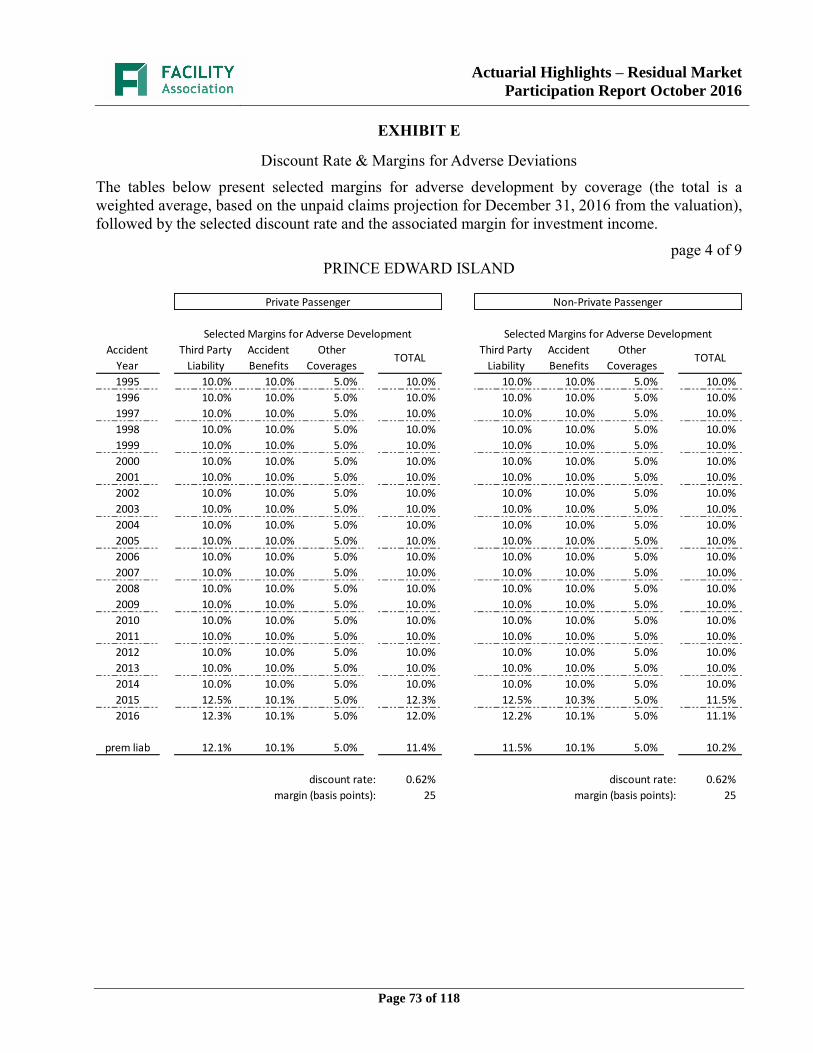
Actuarial Highlights – Residual Market
Participation Report October 2016
Page 73 of 118
EXHIBIT E
Discount Rate & Margins for Adverse Deviations
The tables below present selected margins for adverse development by coverage (the total is a
weighted average, based on the unpaid claims projection for December 31, 2016 from the valuation),
followed by the selected discount rate and the associated margin for investment income.
page 4 of 9
PRINCE EDWARD ISLAND
Private Passenger Non-Private Passenger
Selected Margins for Adverse Development Selected Margins for Adverse Development
Accident
Year
Third Party
Liability
Accident
Benefits
Other
CoveragesTOTAL
Third Party
Liability
Accident
Benefits
Other
CoveragesTOTAL
1995 10.0% 10.0% 5.0% 10.0% 10.0% 10.0% 5.0% 10.0%
1996 10.0% 10.0% 5.0% 10.0% 10.0% 10.0% 5.0% 10.0%
1997 10.0% 10.0% 5.0% 10.0% 10.0% 10.0% 5.0% 10.0%
1998 10.0% 10.0% 5.0% 10.0% 10.0% 10.0% 5.0% 10.0%
1999 10.0% 10.0% 5.0% 10.0% 10.0% 10.0% 5.0% 10.0%
2000 10.0% 10.0% 5.0% 10.0% 10.0% 10.0% 5.0% 10.0%
2001 10.0% 10.0% 5.0% 10.0% 10.0% 10.0% 5.0% 10.0%
2002 10.0% 10.0% 5.0% 10.0% 10.0% 10.0% 5.0% 10.0%
2003 10.0% 10.0% 5.0% 10.0% 10.0% 10.0% 5.0% 10.0%
2004 10.0% 10.0% 5.0% 10.0% 10.0% 10.0% 5.0% 10.0%
2005 10.0% 10.0% 5.0% 10.0% 10.0% 10.0% 5.0% 10.0%
2006 10.0% 10.0% 5.0% 10.0% 10.0% 10.0% 5.0% 10.0%
2007 10.0% 10.0% 5.0% 10.0% 10.0% 10.0% 5.0% 10.0%
2008 10.0% 10.0% 5.0% 10.0% 10.0% 10.0% 5.0% 10.0%
2009 10.0% 10.0% 5.0% 10.0% 10.0% 10.0% 5.0% 10.0%
2010 10.0% 10.0% 5.0% 10.0% 10.0% 10.0% 5.0% 10.0%
2011 10.0% 10.0% 5.0% 10.0% 10.0% 10.0% 5.0% 10.0%
2012 10.0% 10.0% 5.0% 10.0% 10.0% 10.0% 5.0% 10.0%
2013 10.0% 10.0% 5.0% 10.0% 10.0% 10.0% 5.0% 10.0%
2014 10.0% 10.0% 5.0% 10.0% 10.0% 10.0% 5.0% 10.0%
2015 12.5% 10.1% 5.0% 12.3% 12.5% 10.3% 5.0% 11.5%
2016 12.3% 10.1% 5.0% 12.0% 12.2% 10.1% 5.0% 11.1%
prem liab 12.1% 10.1% 5.0% 11.4% 11.5% 10.1% 5.0% 10.2%
discount rate: 0.62% discount rate: 0.62%
margin (basis points): 25 margin (basis points): 25
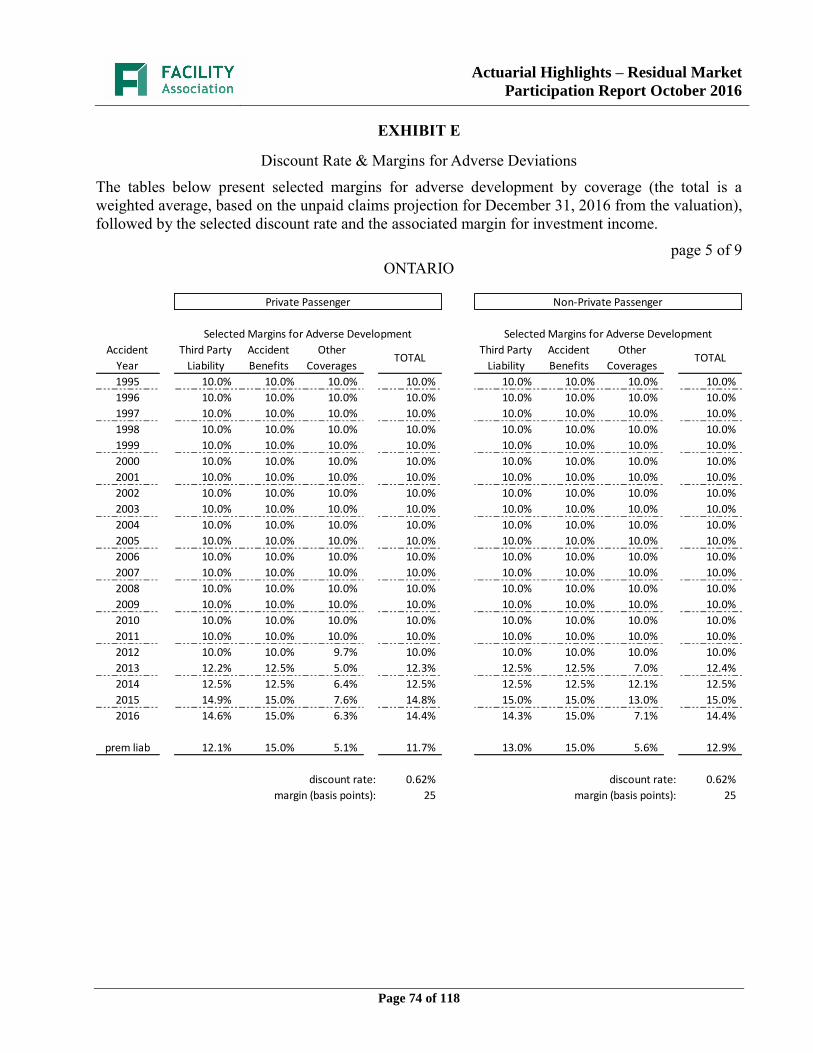
Actuarial Highlights – Residual Market
Participation Report October 2016
Page 74 of 118
EXHIBIT E
Discount Rate & Margins for Adverse Deviations
The tables below present selected margins for adverse development by coverage (the total is a
weighted average, based on the unpaid claims projection for December 31, 2016 from the valuation),
followed by the selected discount rate and the associated margin for investment income.
page 5 of 9
ONTARIO
Private Passenger Non-Private Passenger
Selected Margins for Adverse Development Selected Margins for Adverse Development
Accident
Year
Third Party
Liability
Accident
Benefits
Other
CoveragesTOTAL
Third Party
Liability
Accident
Benefits
Other
CoveragesTOTAL
1995 10.0% 10.0% 10.0% 10.0% 10.0% 10.0% 10.0% 10.0%
1996 10.0% 10.0% 10.0% 10.0% 10.0% 10.0% 10.0% 10.0%
1997 10.0% 10.0% 10.0% 10.0% 10.0% 10.0% 10.0% 10.0%
1998 10.0% 10.0% 10.0% 10.0% 10.0% 10.0% 10.0% 10.0%
1999 10.0% 10.0% 10.0% 10.0% 10.0% 10.0% 10.0% 10.0%
2000 10.0% 10.0% 10.0% 10.0% 10.0% 10.0% 10.0% 10.0%
2001 10.0% 10.0% 10.0% 10.0% 10.0% 10.0% 10.0% 10.0%
2002 10.0% 10.0% 10.0% 10.0% 10.0% 10.0% 10.0% 10.0%
2003 10.0% 10.0% 10.0% 10.0% 10.0% 10.0% 10.0% 10.0%
2004 10.0% 10.0% 10.0% 10.0% 10.0% 10.0% 10.0% 10.0%
2005 10.0% 10.0% 10.0% 10.0% 10.0% 10.0% 10.0% 10.0%
2006 10.0% 10.0% 10.0% 10.0% 10.0% 10.0% 10.0% 10.0%
2007 10.0% 10.0% 10.0% 10.0% 10.0% 10.0% 10.0% 10.0%
2008 10.0% 10.0% 10.0% 10.0% 10.0% 10.0% 10.0% 10.0%
2009 10.0% 10.0% 10.0% 10.0% 10.0% 10.0% 10.0% 10.0%
2010 10.0% 10.0% 10.0% 10.0% 10.0% 10.0% 10.0% 10.0%
2011 10.0% 10.0% 10.0% 10.0% 10.0% 10.0% 10.0% 10.0%
2012 10.0% 10.0% 9.7% 10.0% 10.0% 10.0% 10.0% 10.0%
2013 12.2% 12.5% 5.0% 12.3% 12.5% 12.5% 7.0% 12.4%
2014 12.5% 12.5% 6.4% 12.5% 12.5% 12.5% 12.1% 12.5%
2015 14.9% 15.0% 7.6% 14.8% 15.0% 15.0% 13.0% 15.0%
2016 14.6% 15.0% 6.3% 14.4% 14.3% 15.0% 7.1% 14.4%
prem liab 12.1% 15.0% 5.1% 11.7% 13.0% 15.0% 5.6% 12.9%
discount rate: 0.62% discount rate: 0.62%
margin (basis points): 25 margin (basis points): 25
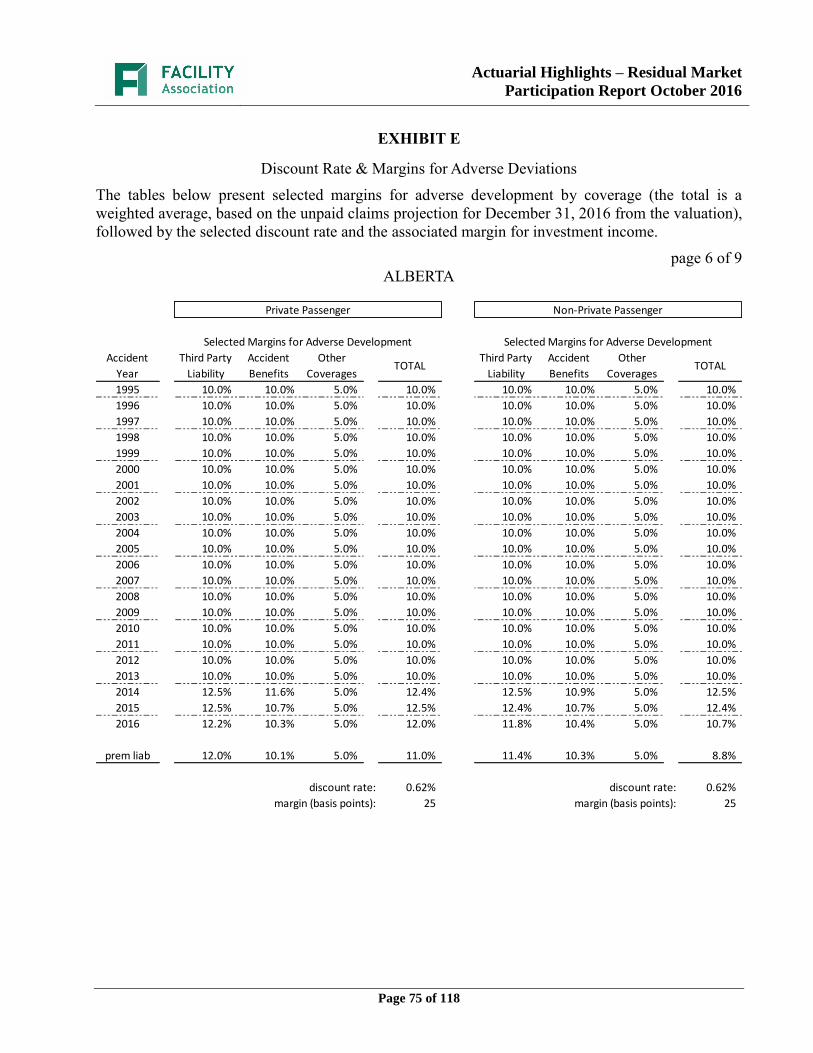
Actuarial Highlights – Residual Market
Participation Report October 2016
Page 75 of 118
EXHIBIT E
Discount Rate & Margins for Adverse Deviations
The tables below present selected margins for adverse development by coverage (the total is a
weighted average, based on the unpaid claims projection for December 31, 2016 from the valuation),
followed by the selected discount rate and the associated margin for investment income.
page 6 of 9
ALBERTA
Private Passenger Non-Private Passenger
Selected Margins for Adverse Development Selected Margins for Adverse Development
Accident
Year
Third Party
Liability
Accident
Benefits
Other
CoveragesTOTAL
Third Party
Liability
Accident
Benefits
Other
CoveragesTOTAL
1995 10.0% 10.0% 5.0% 10.0% 10.0% 10.0% 5.0% 10.0%
1996 10.0% 10.0% 5.0% 10.0% 10.0% 10.0% 5.0% 10.0%
1997 10.0% 10.0% 5.0% 10.0% 10.0% 10.0% 5.0% 10.0%
1998 10.0% 10.0% 5.0% 10.0% 10.0% 10.0% 5.0% 10.0%
1999 10.0% 10.0% 5.0% 10.0% 10.0% 10.0% 5.0% 10.0%
2000 10.0% 10.0% 5.0% 10.0% 10.0% 10.0% 5.0% 10.0%
2001 10.0% 10.0% 5.0% 10.0% 10.0% 10.0% 5.0% 10.0%
2002 10.0% 10.0% 5.0% 10.0% 10.0% 10.0% 5.0% 10.0%
2003 10.0% 10.0% 5.0% 10.0% 10.0% 10.0% 5.0% 10.0%
2004 10.0% 10.0% 5.0% 10.0% 10.0% 10.0% 5.0% 10.0%
2005 10.0% 10.0% 5.0% 10.0% 10.0% 10.0% 5.0% 10.0%
2006 10.0% 10.0% 5.0% 10.0% 10.0% 10.0% 5.0% 10.0%
2007 10.0% 10.0% 5.0% 10.0% 10.0% 10.0% 5.0% 10.0%
2008 10.0% 10.0% 5.0% 10.0% 10.0% 10.0% 5.0% 10.0%
2009 10.0% 10.0% 5.0% 10.0% 10.0% 10.0% 5.0% 10.0%
2010 10.0% 10.0% 5.0% 10.0% 10.0% 10.0% 5.0% 10.0%
2011 10.0% 10.0% 5.0% 10.0% 10.0% 10.0% 5.0% 10.0%
2012 10.0% 10.0% 5.0% 10.0% 10.0% 10.0% 5.0% 10.0%
2013 10.0% 10.0% 5.0% 10.0% 10.0% 10.0% 5.0% 10.0%
2014 12.5% 11.6% 5.0% 12.4% 12.5% 10.9% 5.0% 12.5%
2015 12.5% 10.7% 5.0% 12.5% 12.4% 10.7% 5.0% 12.4%
2016 12.2% 10.3% 5.0% 12.0% 11.8% 10.4% 5.0% 10.7%
prem liab 12.0% 10.1% 5.0% 11.0% 11.4% 10.3% 5.0% 8.8%
discount rate: 0.62% discount rate: 0.62%
margin (basis points): 25 margin (basis points): 25

Actuarial Highlights – Residual Market
Participation Report October 2016
Page 76 of 118
EXHIBIT E
Discount Rate & Margins for Adverse Deviations
The tables below present selected margins for adverse development by coverage (the total is a
weighted average, based on the unpaid claims projection for December 31, 2016 from the valuation),
followed by the selected discount rate and the associated margin for investment income.
page 7 of 9
YUKON
Private Passenger Non-Private Passenger
Selected Margins for Adverse Development Selected Margins for Adverse Development
Accident
Year
Third Party
Liability
Accident
Benefits
Other
CoveragesTOTAL
Third Party
Liability
Accident
Benefits
Other
CoveragesTOTAL
1995 10.0% 10.0% 5.0% 10.0% 10.0% 10.0% 5.0% 10.0%
1996 10.0% 10.0% 5.0% 10.0% 10.0% 10.0% 5.0% 10.0%
1997 10.0% 10.0% 5.0% 10.0% 10.0% 10.0% 5.0% 10.0%
1998 10.0% 10.0% 5.0% 10.0% 10.0% 10.0% 5.0% 10.0%
1999 10.0% 10.0% 5.0% 10.0% 10.0% 10.0% 5.0% 10.0%
2000 10.0% 10.0% 5.0% 10.0% 10.0% 10.0% 5.0% 10.0%
2001 10.0% 10.0% 5.0% 10.0% 10.0% 10.0% 5.0% 10.0%
2002 10.0% 10.0% 5.0% 10.0% 10.0% 10.0% 5.0% 10.0%
2003 10.0% 10.0% 5.0% 10.0% 10.0% 10.0% 5.0% 10.0%
2004 10.0% 10.0% 5.0% 10.0% 10.0% 10.0% 5.0% 10.0%
2005 10.0% 10.0% 5.0% 10.0% 10.0% 10.0% 5.0% 10.0%
2006 10.0% 10.0% 5.0% 10.0% 10.0% 10.0% 5.0% 10.0%
2007 10.0% 10.0% 5.0% 10.0% 10.0% 10.0% 5.0% 10.0%
2008 10.0% 10.0% 5.0% 10.0% 10.0% 10.0% 5.0% 10.0%
2009 10.0% 10.0% 5.0% 10.0% 10.0% 10.0% 5.0% 10.0%
2010 10.0% 10.0% 5.0% 10.0% 10.0% 10.0% 5.0% 10.0%
2011 10.0% 10.0% 5.0% 10.0% 10.0% 10.0% 5.0% 10.0%
2012 10.0% 10.0% 5.0% 10.0% 10.0% 10.0% 5.0% 10.0%
2013 10.0% 10.0% 5.0% 10.0% 10.0% 10.0% 5.0% 10.0%
2014 12.5% 10.6% 5.0% 12.4% 12.5% 11.7% 5.0% 12.4%
2015 12.5% 10.7% 5.0% 12.4% 12.4% 12.4% 5.0% 12.3%
2016 12.3% 10.8% 5.0% 12.3% 11.6% 11.3% 5.0% 10.8%
prem liab 12.1% 10.6% 5.0% 11.5% 11.5% 11.7% 5.0% 9.8%
discount rate: 0.62% discount rate: 0.62%
margin (basis points): 25 margin (basis points): 25

Actuarial Highlights – Residual Market
Participation Report October 2016
Page 77 of 118
EXHIBIT E
Discount Rate & Margins for Adverse Deviations
The tables below present selected margins for adverse development by coverage (the total is a
weighted average, based on the unpaid claims projection for December 31, 2016 from the valuation),
followed by the selected discount rate and the associated margin for investment income.
page 8 of 9
NORTHWEST TERRITORIES
Private Passenger Non-Private Passenger
Selected Margins for Adverse Development Selected Margins for Adverse Development
Accident
Year
Third Party
Liability
Accident
Benefits
Other
CoveragesTOTAL
Third Party
Liability
Accident
Benefits
Other
CoveragesTOTAL
1995 10.0% 10.0% 5.0% 10.0% 10.0% 10.0% 5.0% 10.0%
1996 10.0% 10.0% 5.0% 10.0% 10.0% 10.0% 5.0% 10.0%
1997 10.0% 10.0% 5.0% 10.0% 10.0% 10.0% 5.0% 10.0%
1998 10.0% 10.0% 5.0% 10.0% 10.0% 10.0% 5.0% 10.0%
1999 10.0% 10.0% 5.0% 10.0% 10.0% 10.0% 5.0% 10.0%
2000 10.0% 10.0% 5.0% 10.0% 10.0% 10.0% 5.0% 10.0%
2001 10.0% 10.0% 5.0% 10.0% 10.0% 10.0% 5.0% 10.0%
2002 10.0% 10.0% 5.0% 10.0% 10.0% 10.0% 5.0% 10.0%
2003 10.0% 10.0% 5.0% 10.0% 10.0% 10.0% 5.0% 10.0%
2004 10.0% 10.0% 5.0% 10.0% 10.0% 10.0% 5.0% 10.0%
2005 10.0% 10.0% 5.0% 10.0% 10.0% 10.0% 5.0% 10.0%
2006 10.0% 10.0% 5.0% 10.0% 10.0% 10.0% 5.0% 10.0%
2007 10.0% 10.0% 5.0% 10.0% 10.0% 10.0% 5.0% 10.0%
2008 10.0% 10.0% 5.0% 10.0% 10.0% 10.0% 5.0% 10.0%
2009 10.0% 10.0% 5.0% 10.0% 10.0% 10.0% 5.0% 10.0%
2010 10.0% 10.0% 5.0% 10.0% 10.0% 10.0% 5.0% 10.0%
2011 10.0% 10.0% 5.0% 10.0% 10.0% 10.0% 5.0% 10.0%
2012 10.0% 10.0% 5.0% 10.0% 10.0% 10.0% 5.0% 10.0%
2013 10.0% 10.0% 5.0% 10.0% 10.0% 10.0% 5.0% 10.0%
2014 12.5% 11.4% 5.0% 12.5% 12.5% 10.8% 5.0% 12.3%
2015 12.5% 11.3% 5.0% 12.3% 12.2% 11.1% 5.0% 10.7%
2016 12.0% 11.4% 5.0% 11.4% 12.0% 11.0% 5.0% 10.9%
prem liab 11.2% 10.9% 5.0% 9.3% 11.5% 11.1% 5.0% 9.5%
discount rate: 0.62% discount rate: 0.62%
margin (basis points): 25 margin (basis points): 25
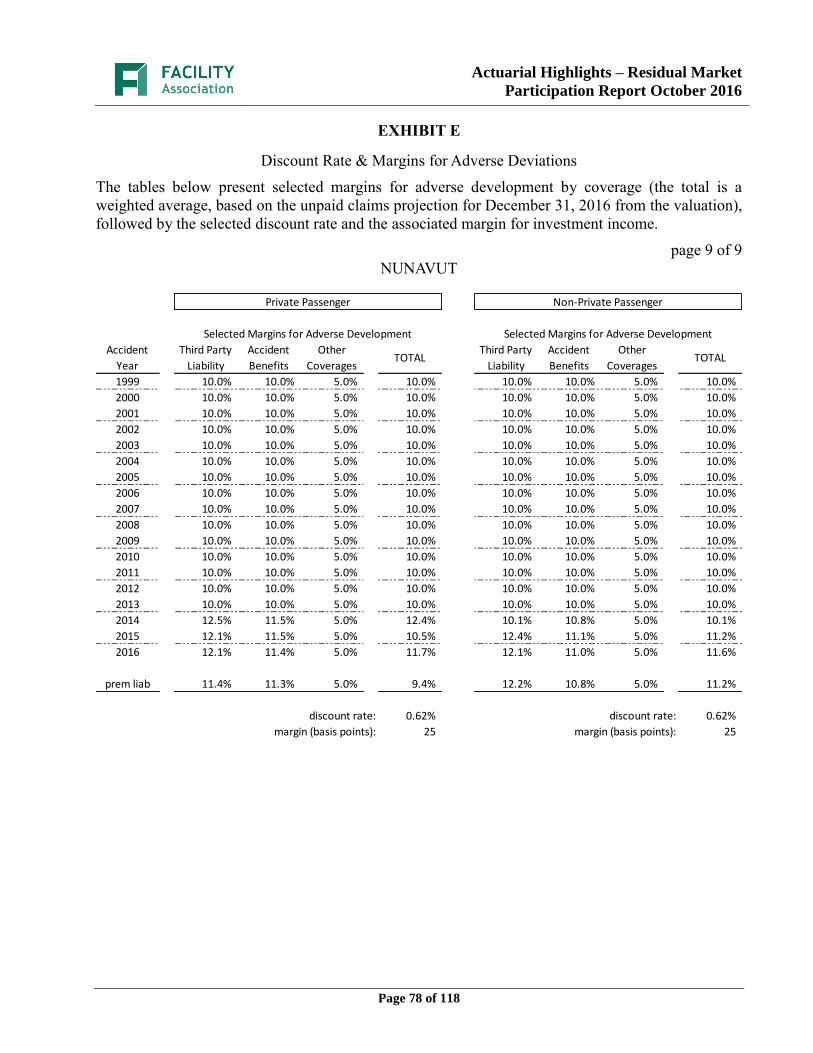
Actuarial Highlights – Residual Market
Participation Report October 2016
Page 78 of 118
EXHIBIT E
Discount Rate & Margins for Adverse Deviations
The tables below present selected margins for adverse development by coverage (the total is a
weighted average, based on the unpaid claims projection for December 31, 2016 from the valuation),
followed by the selected discount rate and the associated margin for investment income.
page 9 of 9
NUNAVUT
Private Passenger Non-Private Passenger
Selected Margins for Adverse Development Selected Margins for Adverse Development
Accident
Year
Third Party
Liability
Accident
Benefits
Other
CoveragesTOTAL
Third Party
Liability
Accident
Benefits
Other
CoveragesTOTAL
1999 10.0% 10.0% 5.0% 10.0% 10.0% 10.0% 5.0% 10.0%
2000 10.0% 10.0% 5.0% 10.0% 10.0% 10.0% 5.0% 10.0%
2001 10.0% 10.0% 5.0% 10.0% 10.0% 10.0% 5.0% 10.0%
2002 10.0% 10.0% 5.0% 10.0% 10.0% 10.0% 5.0% 10.0%
2003 10.0% 10.0% 5.0% 10.0% 10.0% 10.0% 5.0% 10.0%
2004 10.0% 10.0% 5.0% 10.0% 10.0% 10.0% 5.0% 10.0%
2005 10.0% 10.0% 5.0% 10.0% 10.0% 10.0% 5.0% 10.0%
2006 10.0% 10.0% 5.0% 10.0% 10.0% 10.0% 5.0% 10.0%
2007 10.0% 10.0% 5.0% 10.0% 10.0% 10.0% 5.0% 10.0%
2008 10.0% 10.0% 5.0% 10.0% 10.0% 10.0% 5.0% 10.0%
2009 10.0% 10.0% 5.0% 10.0% 10.0% 10.0% 5.0% 10.0%
2010 10.0% 10.0% 5.0% 10.0% 10.0% 10.0% 5.0% 10.0%
2011 10.0% 10.0% 5.0% 10.0% 10.0% 10.0% 5.0% 10.0%
2012 10.0% 10.0% 5.0% 10.0% 10.0% 10.0% 5.0% 10.0%
2013 10.0% 10.0% 5.0% 10.0% 10.0% 10.0% 5.0% 10.0%
2014 12.5% 11.5% 5.0% 12.4% 10.1% 10.8% 5.0% 10.1%
2015 12.1% 11.5% 5.0% 10.5% 12.4% 11.1% 5.0% 11.2%
2016 12.1% 11.4% 5.0% 11.7% 12.1% 11.0% 5.0% 11.6%
prem liab 11.4% 11.3% 5.0% 9.4% 12.2% 10.8% 5.0% 11.2%
discount rate: 0.62% discount rate: 0.62%
margin (basis points): 25 margin (basis points): 25
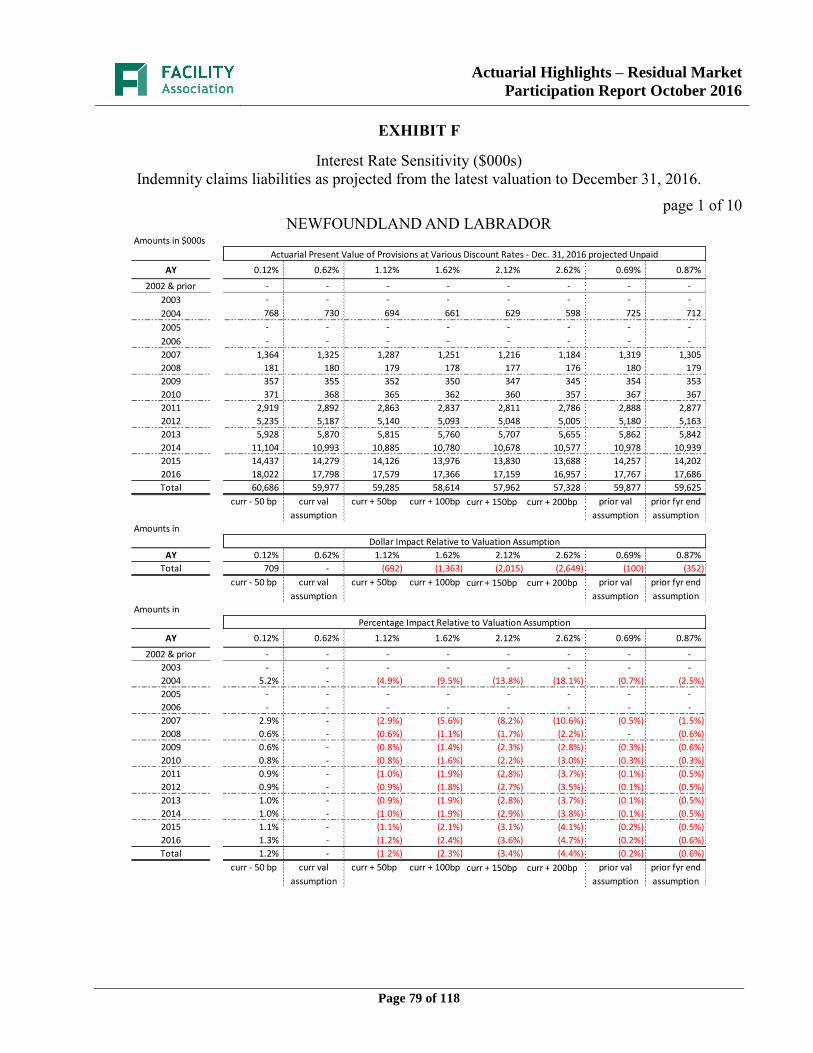
Actuarial Highlights – Residual Market
Participation Report October 2016
Page 79 of 118
EXHIBIT F
Interest Rate Sensitivity ($000s)
Indemnity claims liabilities as projected from the latest valuation to December 31, 2016.
page 1 of 10
NEWFOUNDLAND AND LABRADOR
Amounts in $000s
Actuarial Present Value of Provisions at Various Discount Rates - Dec. 31, 2016 projected Unpaid
AY 0.12% 0.62% 1.12% 1.62% 2.12% 2.62% 0.69% 0.87%
2002 & prior - - - - - - - -
2003 - - - - - - - -
2004 768 730 694 661 629 598 725 712
2005 - - - - - - - -
2006 - - - - - - - -
2007 1,364 1,325 1,287 1,251 1,216 1,184 1,319 1,305
2008 181 180 179 178 177 176 180 179
2009 357 355 352 350 347 345 354 353
2010 371 368 365 362 360 357 367 367
2011 2,919 2,892 2,863 2,837 2,811 2,786 2,888 2,877
2012 5,235 5,187 5,140 5,093 5,048 5,005 5,180 5,163
2013 5,928 5,870 5,815 5,760 5,707 5,655 5,862 5,842
2014 11,104 10,993 10,885 10,780 10,678 10,577 10,978 10,939
2015 14,437 14,279 14,126 13,976 13,830 13,688 14,257 14,202
2016 18,022 17,798 17,579 17,366 17,159 16,957 17,767 17,686
Total 60,686 59,977 59,285 58,614 57,962 57,328 59,877 59,625
curr - 50 bp curr val curr + 50bp curr + 100bp curr + 150bp curr + 200bp prior val prior fyr end
assumption assumption assumption
Amounts in
Dollar Impact Relative to Valuation Assumption
AY 0.12% 0.62% 1.12% 1.62% 2.12% 2.62% 0.69% 0.87%
Total 709 - (692) (1,363) (2,015) (2,649) (100) (352)
curr - 50 bp curr val curr + 50bp curr + 100bp curr + 150bp curr + 200bp prior val prior fyr end
assumption assumption assumption
Amounts in
Percentage Impact Relative to Valuation Assumption
AY 0.12% 0.62% 1.12% 1.62% 2.12% 2.62% 0.69% 0.87%
2002 & prior - - - - - - - -
2003 - - - - - - - -
2004 5.2% - (4.9%) (9.5%) (13.8%) (18.1%) (0.7%) (2.5%)
2005 - - - - - - - -
2006 - - - - - - - -
2007 2.9% - (2.9%) (5.6%) (8.2%) (10.6%) (0.5%) (1.5%)
2008 0.6% - (0.6%) (1.1%) (1.7%) (2.2%) - (0.6%)
2009 0.6% - (0.8%) (1.4%) (2.3%) (2.8%) (0.3%) (0.6%)
2010 0.8% - (0.8%) (1.6%) (2.2%) (3.0%) (0.3%) (0.3%)
2011 0.9% - (1.0%) (1.9%) (2.8%) (3.7%) (0.1%) (0.5%)
2012 0.9% - (0.9%) (1.8%) (2.7%) (3.5%) (0.1%) (0.5%)
2013 1.0% - (0.9%) (1.9%) (2.8%) (3.7%) (0.1%) (0.5%)
2014 1.0% - (1.0%) (1.9%) (2.9%) (3.8%) (0.1%) (0.5%)
2015 1.1% - (1.1%) (2.1%) (3.1%) (4.1%) (0.2%) (0.5%)
2016 1.3% - (1.2%) (2.4%) (3.6%) (4.7%) (0.2%) (0.6%)
Total 1.2% - (1.2%) (2.3%) (3.4%) (4.4%) (0.2%) (0.6%)
curr - 50 bp curr val curr + 50bp curr + 100bp curr + 150bp curr + 200bp prior val prior fyr end
assumption assumption assumption

Actuarial Highlights – Residual Market
Participation Report October 2016
Page 80 of 118
EXHIBIT F
Interest Rate Sensitivity ($000s)
Indemnity claims liabilities as projected from the latest valuation to December 31, 2016.
page 2 of 10
NEW BRUNSWICK
Amounts in $000s
Actuarial Present Value of Provisions at Various Discount Rates - Dec. 31, 2016 projected Unpaid
AY 0.12% 0.62% 1.12% 1.62% 2.12% 2.62% 0.69% 0.87%
2002 & prior - - - - - - - -
2003 231 230 229 228 227 226 230 230
2004 - - - - - - - -
2005 218 211 204 197 190 184 209 207
2006 227 222 217 212 208 203 221 219
2007 6 6 6 6 6 6 6 6
2008 444 436 428 420 413 406 434 432
2009 403 396 390 384 378 372 395 393
2010 539 532 527 521 515 510 532 530
2011 2,138 2,118 2,096 2,077 2,058 2,039 2,115 2,107
2012 2,680 2,656 2,633 2,610 2,588 2,566 2,653 2,644
2013 5,756 5,699 5,643 5,589 5,536 5,485 5,691 5,670
2014 6,006 5,940 5,876 5,815 5,755 5,695 5,931 5,908
2015 7,320 7,223 7,127 7,035 6,945 6,858 7,209 7,174
2016 8,165 8,041 7,920 7,802 7,687 7,577 8,024 7,980
Total 34,133 33,710 33,296 32,896 32,506 32,127 33,650 33,500
curr - 50 bp curr val curr + 50bp curr + 100bp curr + 150bp curr + 200bp prior val prior fyr end
assumption assumption assumption
Amounts in
Dollar Impact Relative to Valuation Assumption
AY 0.12% 0.62% 1.12% 1.62% 2.12% 2.62% 0.69% 0.87%
Total 423 - (414) (814) (1,204) (1,583) (60) (210)
curr - 50 bp curr val curr + 50bp curr + 100bp curr + 150bp curr + 200bp prior val prior fyr end
assumption assumption assumption
Amounts in
Percentage Impact Relative to Valuation Assumption
AY 0.12% 0.62% 1.12% 1.62% 2.12% 2.62% 0.69% 0.87%
2002 & prior - - - - - - - -
2003 0.4% - (0.4%) (0.9%) (1.3%) (1.7%) - -
2004 - - - - - - - -
2005 3.3% - (3.3%) (6.6%) (10.0%) (12.8%) (0.9%) (1.9%)
2006 2.3% - (2.3%) (4.5%) (6.3%) (8.6%) (0.5%) (1.4%)
2007 - - - - - - - -
2008 1.8% - (1.8%) (3.7%) (5.3%) (6.9%) (0.5%) (0.9%)
2009 1.8% - (1.5%) (3.0%) (4.5%) (6.1%) (0.3%) (0.8%)
2010 1.3% - (0.9%) (2.1%) (3.2%) (4.1%) - (0.4%)
2011 0.9% - (1.0%) (1.9%) (2.8%) (3.7%) (0.1%) (0.5%)
2012 0.9% - (0.9%) (1.7%) (2.6%) (3.4%) (0.1%) (0.5%)
2013 1.0% - (1.0%) (1.9%) (2.9%) (3.8%) (0.1%) (0.5%)
2014 1.1% - (1.1%) (2.1%) (3.1%) (4.1%) (0.2%) (0.5%)
2015 1.3% - (1.3%) (2.6%) (3.8%) (5.1%) (0.2%) (0.7%)
2016 1.5% - (1.5%) (3.0%) (4.4%) (5.8%) (0.2%) (0.8%)
Total 1.3% - (1.2%) (2.4%) (3.6%) (4.7%) (0.2%) (0.6%)
curr - 50 bp curr val curr + 50bp curr + 100bp curr + 150bp curr + 200bp prior val prior fyr end
assumption assumption assumption
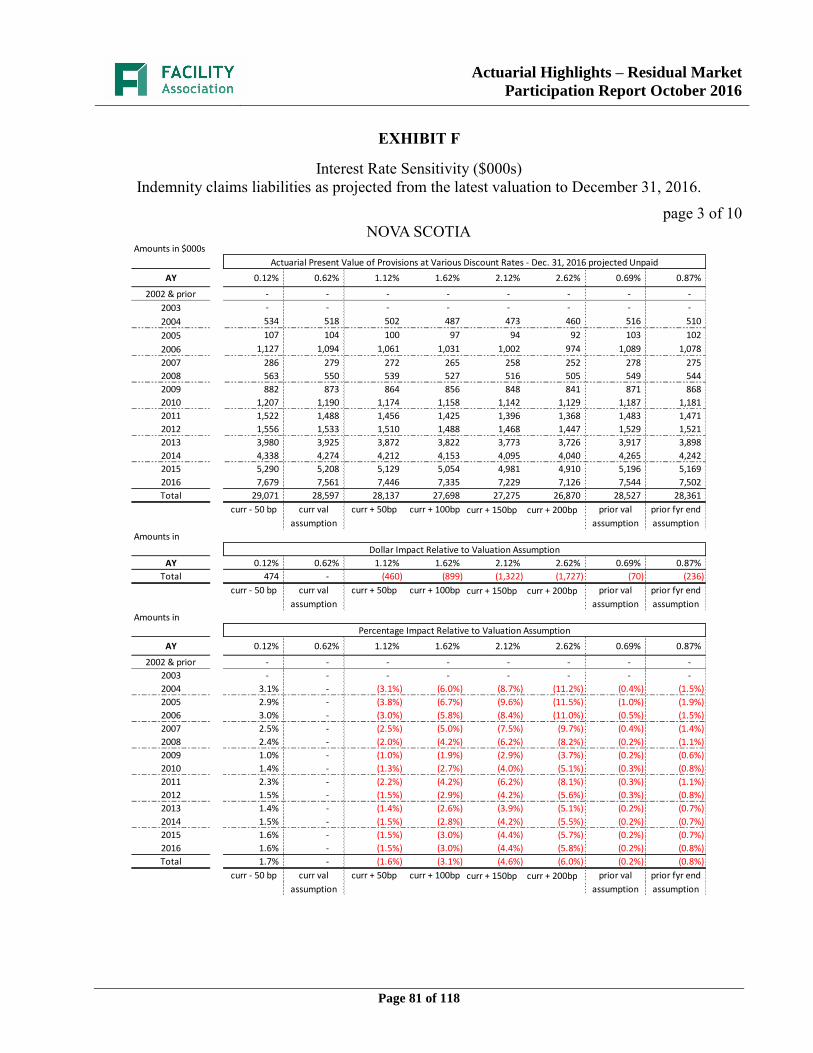
Actuarial Highlights – Residual Market
Participation Report October 2016
Page 81 of 118
EXHIBIT F
Interest Rate Sensitivity ($000s)
Indemnity claims liabilities as projected from the latest valuation to December 31, 2016.
page 3 of 10
NOVA SCOTIA
Amounts in $000s
Actuarial Present Value of Provisions at Various Discount Rates - Dec. 31, 2016 projected Unpaid
AY 0.12% 0.62% 1.12% 1.62% 2.12% 2.62% 0.69% 0.87%
2002 & prior - - - - - - - -
2003 - - - - - - - -
2004 534 518 502 487 473 460 516 510
2005 107 104 100 97 94 92 103 102
2006 1,127 1,094 1,061 1,031 1,002 974 1,089 1,078
2007 286 279 272 265 258 252 278 275
2008 563 550 539 527 516 505 549 544
2009 882 873 864 856 848 841 871 868
2010 1,207 1,190 1,174 1,158 1,142 1,129 1,187 1,181
2011 1,522 1,488 1,456 1,425 1,396 1,368 1,483 1,471
2012 1,556 1,533 1,510 1,488 1,468 1,447 1,529 1,521
2013 3,980 3,925 3,872 3,822 3,773 3,726 3,917 3,898
2014 4,338 4,274 4,212 4,153 4,095 4,040 4,265 4,242
2015 5,290 5,208 5,129 5,054 4,981 4,910 5,196 5,169
2016 7,679 7,561 7,446 7,335 7,229 7,126 7,544 7,502
Total 29,071 28,597 28,137 27,698 27,275 26,870 28,527 28,361
curr - 50 bp curr val curr + 50bp curr + 100bp curr + 150bp curr + 200bp prior val prior fyr end
assumption assumption assumption
Amounts in
Dollar Impact Relative to Valuation Assumption
AY 0.12% 0.62% 1.12% 1.62% 2.12% 2.62% 0.69% 0.87%
Total 474 - (460) (899) (1,322) (1,727) (70) (236)
curr - 50 bp curr val curr + 50bp curr + 100bp curr + 150bp curr + 200bp prior val prior fyr end
assumption assumption assumption
Amounts in
Percentage Impact Relative to Valuation Assumption
AY 0.12% 0.62% 1.12% 1.62% 2.12% 2.62% 0.69% 0.87%
2002 & prior - - - - - - - -
2003 - - - - - - - -
2004 3.1% - (3.1%) (6.0%) (8.7%) (11.2%) (0.4%) (1.5%)
2005 2.9% - (3.8%) (6.7%) (9.6%) (11.5%) (1.0%) (1.9%)
2006 3.0% - (3.0%) (5.8%) (8.4%) (11.0%) (0.5%) (1.5%)
2007 2.5% - (2.5%) (5.0%) (7.5%) (9.7%) (0.4%) (1.4%)
2008 2.4% - (2.0%) (4.2%) (6.2%) (8.2%) (0.2%) (1.1%)
2009 1.0% - (1.0%) (1.9%) (2.9%) (3.7%) (0.2%) (0.6%)
2010 1.4% - (1.3%) (2.7%) (4.0%) (5.1%) (0.3%) (0.8%)
2011 2.3% - (2.2%) (4.2%) (6.2%) (8.1%) (0.3%) (1.1%)
2012 1.5% - (1.5%) (2.9%) (4.2%) (5.6%) (0.3%) (0.8%)
2013 1.4% - (1.4%) (2.6%) (3.9%) (5.1%) (0.2%) (0.7%)
2014 1.5% - (1.5%) (2.8%) (4.2%) (5.5%) (0.2%) (0.7%)
2015 1.6% - (1.5%) (3.0%) (4.4%) (5.7%) (0.2%) (0.7%)
2016 1.6% - (1.5%) (3.0%) (4.4%) (5.8%) (0.2%) (0.8%)
Total 1.7% - (1.6%) (3.1%) (4.6%) (6.0%) (0.2%) (0.8%)
curr - 50 bp curr val curr + 50bp curr + 100bp curr + 150bp curr + 200bp prior val prior fyr end
assumption assumption assumption
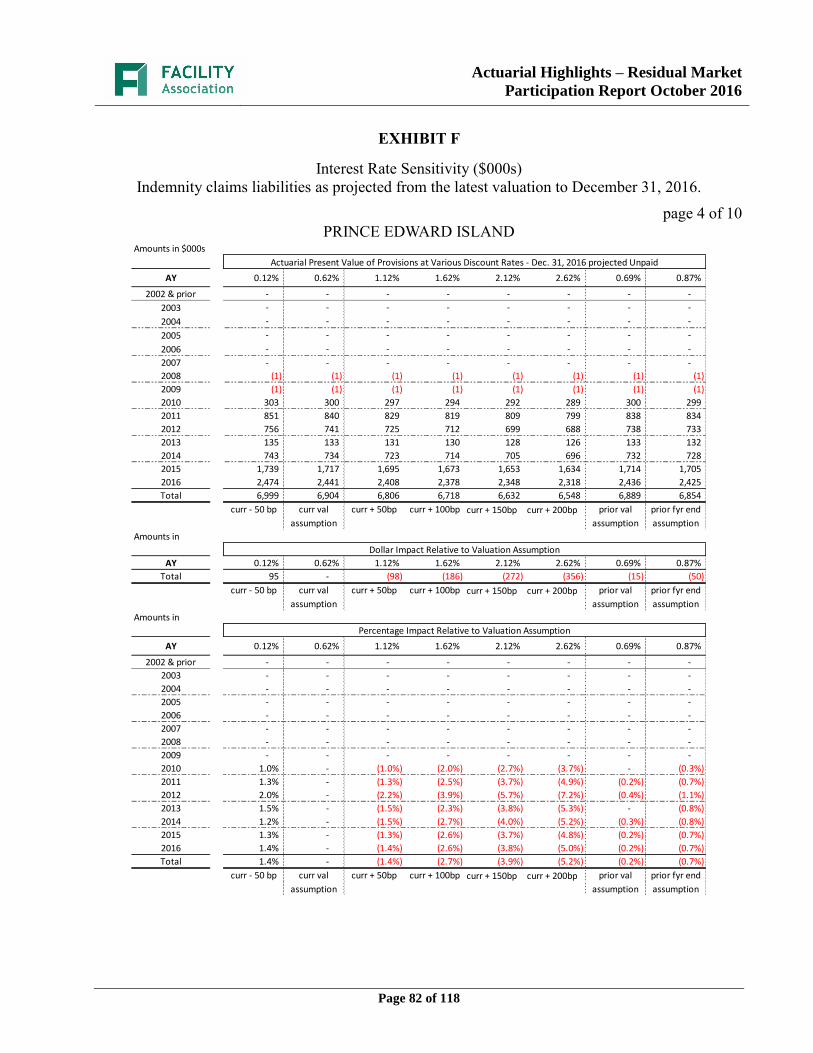
Actuarial Highlights – Residual Market
Participation Report October 2016
Page 82 of 118
EXHIBIT F
Interest Rate Sensitivity ($000s)
Indemnity claims liabilities as projected from the latest valuation to December 31, 2016.
page 4 of 10
PRINCE EDWARD ISLAND
Amounts in $000s
Actuarial Present Value of Provisions at Various Discount Rates - Dec. 31, 2016 projected Unpaid
AY 0.12% 0.62% 1.12% 1.62% 2.12% 2.62% 0.69% 0.87%
2002 & prior - - - - - - - -
2003 - - - - - - - -
2004 - - - - - - - -
2005 - - - - - - - -
2006 - - - - - - - -
2007 - - - - - - - -
2008 (1) (1) (1) (1) (1) (1) (1) (1)
2009 (1) (1) (1) (1) (1) (1) (1) (1)
2010 303 300 297 294 292 289 300 299
2011 851 840 829 819 809 799 838 834
2012 756 741 725 712 699 688 738 733
2013 135 133 131 130 128 126 133 132
2014 743 734 723 714 705 696 732 728
2015 1,739 1,717 1,695 1,673 1,653 1,634 1,714 1,705
2016 2,474 2,441 2,408 2,378 2,348 2,318 2,436 2,425
Total 6,999 6,904 6,806 6,718 6,632 6,548 6,889 6,854
curr - 50 bp curr val curr + 50bp curr + 100bp curr + 150bp curr + 200bp prior val prior fyr end
assumption assumption assumption
Amounts in
Dollar Impact Relative to Valuation Assumption
AY 0.12% 0.62% 1.12% 1.62% 2.12% 2.62% 0.69% 0.87%
Total 95 - (98) (186) (272) (356) (15) (50)
curr - 50 bp curr val curr + 50bp curr + 100bp curr + 150bp curr + 200bp prior val prior fyr end
assumption assumption assumption
Amounts in
Percentage Impact Relative to Valuation Assumption
AY 0.12% 0.62% 1.12% 1.62% 2.12% 2.62% 0.69% 0.87%
2002 & prior - - - - - - - -
2003 - - - - - - - -
2004 - - - - - - - -
2005 - - - - - - - -
2006 - - - - - - - -
2007 - - - - - - - -
2008 - - - - - - - -
2009 - - - - - - - -
2010 1.0% - (1.0%) (2.0%) (2.7%) (3.7%) - (0.3%)
2011 1.3% - (1.3%) (2.5%) (3.7%) (4.9%) (0.2%) (0.7%)
2012 2.0% - (2.2%) (3.9%) (5.7%) (7.2%) (0.4%) (1.1%)
2013 1.5% - (1.5%) (2.3%) (3.8%) (5.3%) - (0.8%)
2014 1.2% - (1.5%) (2.7%) (4.0%) (5.2%) (0.3%) (0.8%)
2015 1.3% - (1.3%) (2.6%) (3.7%) (4.8%) (0.2%) (0.7%)
2016 1.4% - (1.4%) (2.6%) (3.8%) (5.0%) (0.2%) (0.7%)
Total 1.4% - (1.4%) (2.7%) (3.9%) (5.2%) (0.2%) (0.7%)
curr - 50 bp curr val curr + 50bp curr + 100bp curr + 150bp curr + 200bp prior val prior fyr end
assumption assumption assumption
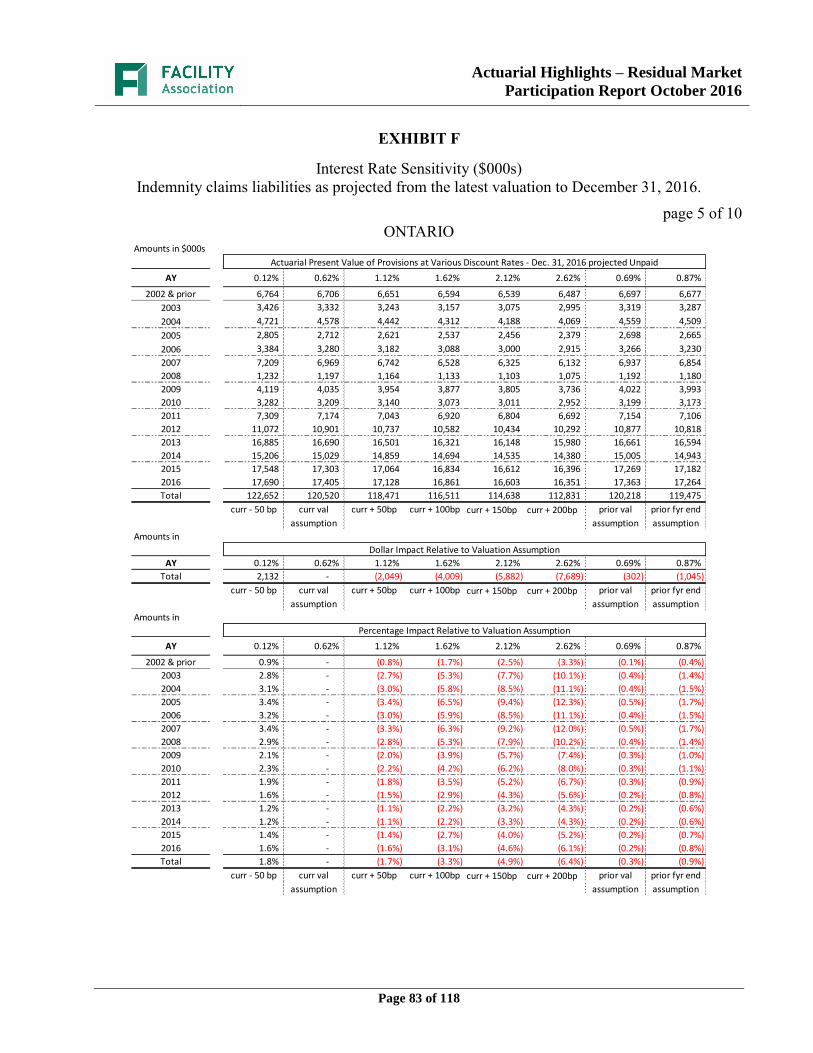
Actuarial Highlights – Residual Market
Participation Report October 2016
Page 83 of 118
EXHIBIT F
Interest Rate Sensitivity ($000s)
Indemnity claims liabilities as projected from the latest valuation to December 31, 2016.
page 5 of 10
ONTARIO
Amounts in $000s
Actuarial Present Value of Provisions at Various Discount Rates - Dec. 31, 2016 projected Unpaid
AY 0.12% 0.62% 1.12% 1.62% 2.12% 2.62% 0.69% 0.87%
2002 & prior 6,764 6,706 6,651 6,594 6,539 6,487 6,697 6,677
2003 3,426 3,332 3,243 3,157 3,075 2,995 3,319 3,287
2004 4,721 4,578 4,442 4,312 4,188 4,069 4,559 4,509
2005 2,805 2,712 2,621 2,537 2,456 2,379 2,698 2,665
2006 3,384 3,280 3,182 3,088 3,000 2,915 3,266 3,230
2007 7,209 6,969 6,742 6,528 6,325 6,132 6,937 6,854
2008 1,232 1,197 1,164 1,133 1,103 1,075 1,192 1,180
2009 4,119 4,035 3,954 3,877 3,805 3,736 4,022 3,993
2010 3,282 3,209 3,140 3,073 3,011 2,952 3,199 3,173
2011 7,309 7,174 7,043 6,920 6,804 6,692 7,154 7,106
2012 11,072 10,901 10,737 10,582 10,434 10,292 10,877 10,818
2013 16,885 16,690 16,501 16,321 16,148 15,980 16,661 16,594
2014 15,206 15,029 14,859 14,694 14,535 14,380 15,005 14,943
2015 17,548 17,303 17,064 16,834 16,612 16,396 17,269 17,182
2016 17,690 17,405 17,128 16,861 16,603 16,351 17,363 17,264
Total 122,652 120,520 118,471 116,511 114,638 112,831 120,218 119,475
curr - 50 bp curr val curr + 50bp curr + 100bp curr + 150bp curr + 200bp prior val prior fyr end
assumption assumption assumption
Amounts in
Dollar Impact Relative to Valuation Assumption
AY 0.12% 0.62% 1.12% 1.62% 2.12% 2.62% 0.69% 0.87%
Total 2,132 - (2,049) (4,009) (5,882) (7,689) (302) (1,045)
curr - 50 bp curr val curr + 50bp curr + 100bp curr + 150bp curr + 200bp prior val prior fyr end
assumption assumption assumption
Amounts in
Percentage Impact Relative to Valuation Assumption
AY 0.12% 0.62% 1.12% 1.62% 2.12% 2.62% 0.69% 0.87%
2002 & prior 0.9% - (0.8%) (1.7%) (2.5%) (3.3%) (0.1%) (0.4%)
2003 2.8% - (2.7%) (5.3%) (7.7%) (10.1%) (0.4%) (1.4%)
2004 3.1% - (3.0%) (5.8%) (8.5%) (11.1%) (0.4%) (1.5%)
2005 3.4% - (3.4%) (6.5%) (9.4%) (12.3%) (0.5%) (1.7%)
2006 3.2% - (3.0%) (5.9%) (8.5%) (11.1%) (0.4%) (1.5%)
2007 3.4% - (3.3%) (6.3%) (9.2%) (12.0%) (0.5%) (1.7%)
2008 2.9% - (2.8%) (5.3%) (7.9%) (10.2%) (0.4%) (1.4%)
2009 2.1% - (2.0%) (3.9%) (5.7%) (7.4%) (0.3%) (1.0%)
2010 2.3% - (2.2%) (4.2%) (6.2%) (8.0%) (0.3%) (1.1%)
2011 1.9% - (1.8%) (3.5%) (5.2%) (6.7%) (0.3%) (0.9%)
2012 1.6% - (1.5%) (2.9%) (4.3%) (5.6%) (0.2%) (0.8%)
2013 1.2% - (1.1%) (2.2%) (3.2%) (4.3%) (0.2%) (0.6%)
2014 1.2% - (1.1%) (2.2%) (3.3%) (4.3%) (0.2%) (0.6%)
2015 1.4% - (1.4%) (2.7%) (4.0%) (5.2%) (0.2%) (0.7%)
2016 1.6% - (1.6%) (3.1%) (4.6%) (6.1%) (0.2%) (0.8%)
Total 1.8% - (1.7%) (3.3%) (4.9%) (6.4%) (0.3%) (0.9%)
curr - 50 bp curr val curr + 50bp curr + 100bp curr + 150bp curr + 200bp prior val prior fyr end
assumption assumption assumption
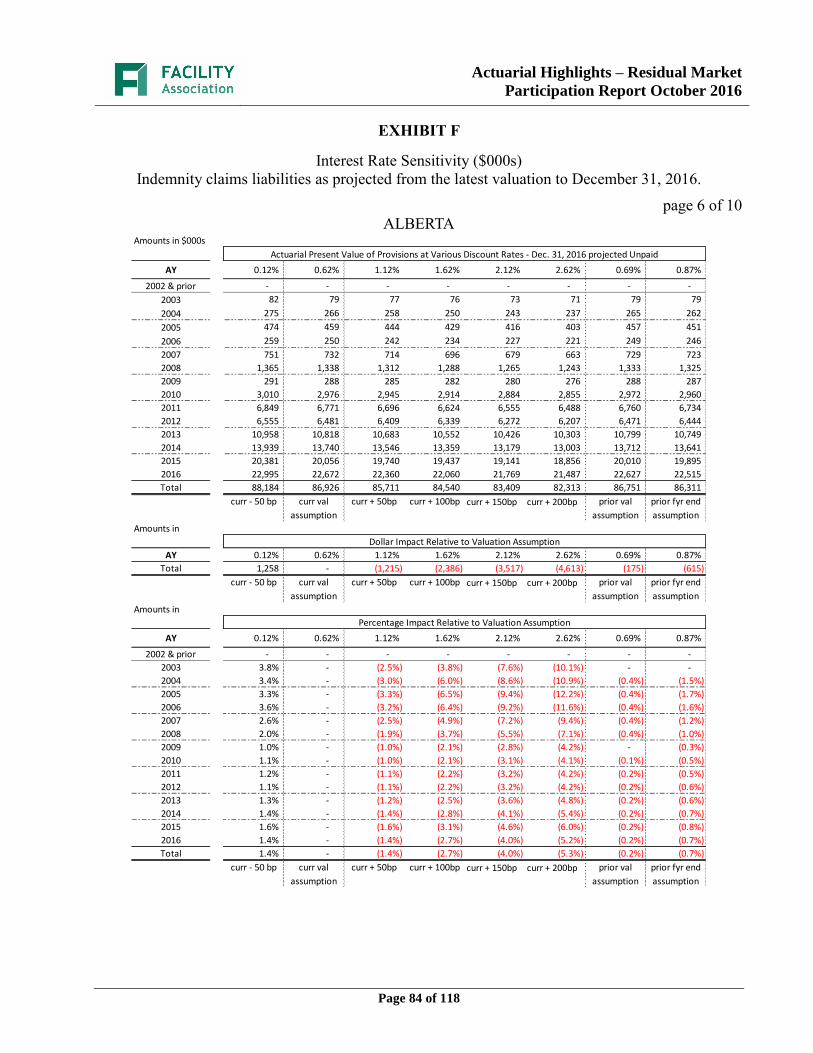
Actuarial Highlights – Residual Market
Participation Report October 2016
Page 84 of 118
EXHIBIT F
Interest Rate Sensitivity ($000s)
Indemnity claims liabilities as projected from the latest valuation to December 31, 2016.
page 6 of 10
ALBERTA
Amounts in $000s
Actuarial Present Value of Provisions at Various Discount Rates - Dec. 31, 2016 projected Unpaid
AY 0.12% 0.62% 1.12% 1.62% 2.12% 2.62% 0.69% 0.87%
2002 & prior - - - - - - - -
2003 82 79 77 76 73 71 79 79
2004 275 266 258 250 243 237 265 262
2005 474 459 444 429 416 403 457 451
2006 259 250 242 234 227 221 249 246
2007 751 732 714 696 679 663 729 723
2008 1,365 1,338 1,312 1,288 1,265 1,243 1,333 1,325
2009 291 288 285 282 280 276 288 287
2010 3,010 2,976 2,945 2,914 2,884 2,855 2,972 2,960
2011 6,849 6,771 6,696 6,624 6,555 6,488 6,760 6,734
2012 6,555 6,481 6,409 6,339 6,272 6,207 6,471 6,444
2013 10,958 10,818 10,683 10,552 10,426 10,303 10,799 10,749
2014 13,939 13,740 13,546 13,359 13,179 13,003 13,712 13,641
2015 20,381 20,056 19,740 19,437 19,141 18,856 20,010 19,895
2016 22,995 22,672 22,360 22,060 21,769 21,487 22,627 22,515
Total 88,184 86,926 85,711 84,540 83,409 82,313 86,751 86,311
curr - 50 bp curr val curr + 50bp curr + 100bp curr + 150bp curr + 200bp prior val prior fyr end
assumption assumption assumption
Amounts in
Dollar Impact Relative to Valuation Assumption
AY 0.12% 0.62% 1.12% 1.62% 2.12% 2.62% 0.69% 0.87%
Total 1,258 - (1,215) (2,386) (3,517) (4,613) (175) (615)
curr - 50 bp curr val curr + 50bp curr + 100bp curr + 150bp curr + 200bp prior val prior fyr end
assumption assumption assumption
Amounts in
Percentage Impact Relative to Valuation Assumption
AY 0.12% 0.62% 1.12% 1.62% 2.12% 2.62% 0.69% 0.87%
2002 & prior - - - - - - - -
2003 3.8% - (2.5%) (3.8%) (7.6%) (10.1%) - -
2004 3.4% - (3.0%) (6.0%) (8.6%) (10.9%) (0.4%) (1.5%)
2005 3.3% - (3.3%) (6.5%) (9.4%) (12.2%) (0.4%) (1.7%)
2006 3.6% - (3.2%) (6.4%) (9.2%) (11.6%) (0.4%) (1.6%)
2007 2.6% - (2.5%) (4.9%) (7.2%) (9.4%) (0.4%) (1.2%)
2008 2.0% - (1.9%) (3.7%) (5.5%) (7.1%) (0.4%) (1.0%)
2009 1.0% - (1.0%) (2.1%) (2.8%) (4.2%) - (0.3%)
2010 1.1% - (1.0%) (2.1%) (3.1%) (4.1%) (0.1%) (0.5%)
2011 1.2% - (1.1%) (2.2%) (3.2%) (4.2%) (0.2%) (0.5%)
2012 1.1% - (1.1%) (2.2%) (3.2%) (4.2%) (0.2%) (0.6%)
2013 1.3% - (1.2%) (2.5%) (3.6%) (4.8%) (0.2%) (0.6%)
2014 1.4% - (1.4%) (2.8%) (4.1%) (5.4%) (0.2%) (0.7%)
2015 1.6% - (1.6%) (3.1%) (4.6%) (6.0%) (0.2%) (0.8%)
2016 1.4% - (1.4%) (2.7%) (4.0%) (5.2%) (0.2%) (0.7%)
Total 1.4% - (1.4%) (2.7%) (4.0%) (5.3%) (0.2%) (0.7%)
curr - 50 bp curr val curr + 50bp curr + 100bp curr + 150bp curr + 200bp prior val prior fyr end
assumption assumption assumption
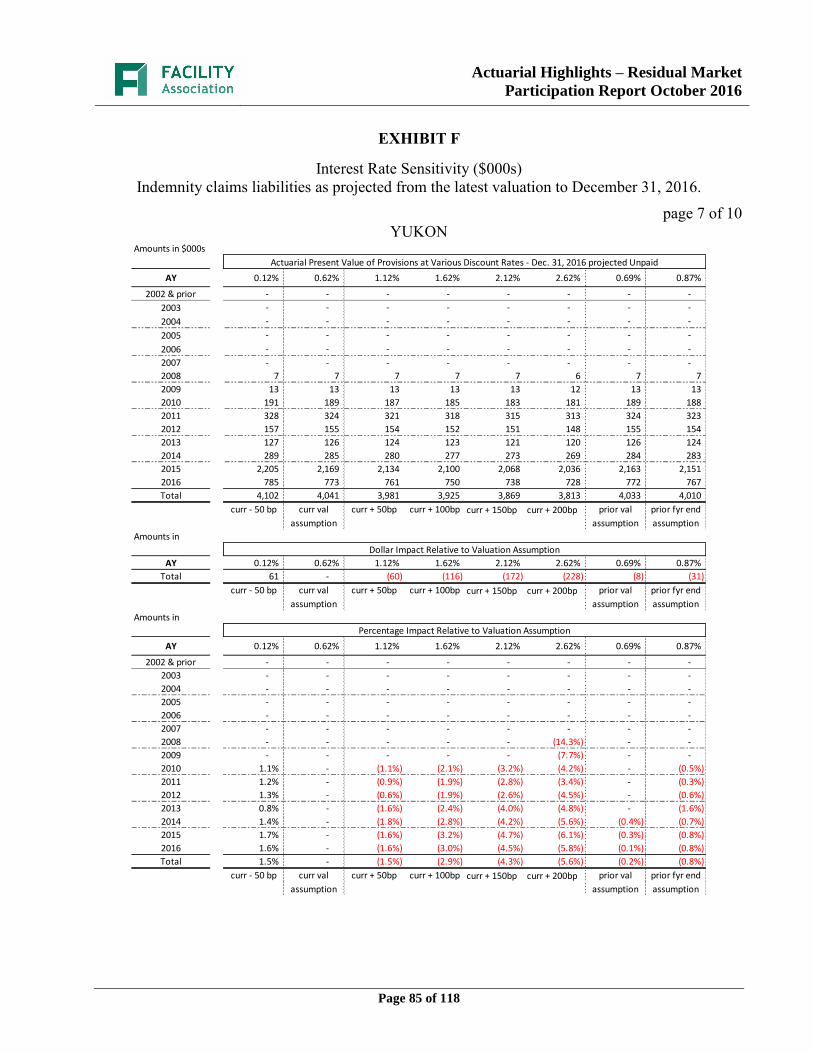
Actuarial Highlights – Residual Market
Participation Report October 2016
Page 85 of 118
EXHIBIT F
Interest Rate Sensitivity ($000s)
Indemnity claims liabilities as projected from the latest valuation to December 31, 2016.
page 7 of 10
YUKON
Amounts in $000s
Actuarial Present Value of Provisions at Various Discount Rates - Dec. 31, 2016 projected Unpaid
AY 0.12% 0.62% 1.12% 1.62% 2.12% 2.62% 0.69% 0.87%
2002 & prior - - - - - - - -
2003 - - - - - - - -
2004 - - - - - - - -
2005 - - - - - - - -
2006 - - - - - - - -
2007 - - - - - - - -
2008 7 7 7 7 7 6 7 7
2009 13 13 13 13 13 12 13 13
2010 191 189 187 185 183 181 189 188
2011 328 324 321 318 315 313 324 323
2012 157 155 154 152 151 148 155 154
2013 127 126 124 123 121 120 126 124
2014 289 285 280 277 273 269 284 283
2015 2,205 2,169 2,134 2,100 2,068 2,036 2,163 2,151
2016 785 773 761 750 738 728 772 767
Total 4,102 4,041 3,981 3,925 3,869 3,813 4,033 4,010
curr - 50 bp curr val curr + 50bp curr + 100bp curr + 150bp curr + 200bp prior val prior fyr end
assumption assumption assumption
Amounts in
Dollar Impact Relative to Valuation Assumption
AY 0.12% 0.62% 1.12% 1.62% 2.12% 2.62% 0.69% 0.87%
Total 61 - (60) (116) (172) (228) (8) (31)
curr - 50 bp curr val curr + 50bp curr + 100bp curr + 150bp curr + 200bp prior val prior fyr end
assumption assumption assumption
Amounts in
Percentage Impact Relative to Valuation Assumption
AY 0.12% 0.62% 1.12% 1.62% 2.12% 2.62% 0.69% 0.87%
2002 & prior - - - - - - - -
2003 - - - - - - - -
2004 - - - - - - - -
2005 - - - - - - - -
2006 - - - - - - - -
2007 - - - - - - - -
2008 - - - - - (14.3%) - -
2009 - - - - - (7.7%) - -
2010 1.1% - (1.1%) (2.1%) (3.2%) (4.2%) - (0.5%)
2011 1.2% - (0.9%) (1.9%) (2.8%) (3.4%) - (0.3%)
2012 1.3% - (0.6%) (1.9%) (2.6%) (4.5%) - (0.6%)
2013 0.8% - (1.6%) (2.4%) (4.0%) (4.8%) - (1.6%)
2014 1.4% - (1.8%) (2.8%) (4.2%) (5.6%) (0.4%) (0.7%)
2015 1.7% - (1.6%) (3.2%) (4.7%) (6.1%) (0.3%) (0.8%)
2016 1.6% - (1.6%) (3.0%) (4.5%) (5.8%) (0.1%) (0.8%)
Total 1.5% - (1.5%) (2.9%) (4.3%) (5.6%) (0.2%) (0.8%)
curr - 50 bp curr val curr + 50bp curr + 100bp curr + 150bp curr + 200bp prior val prior fyr end
assumption assumption assumption
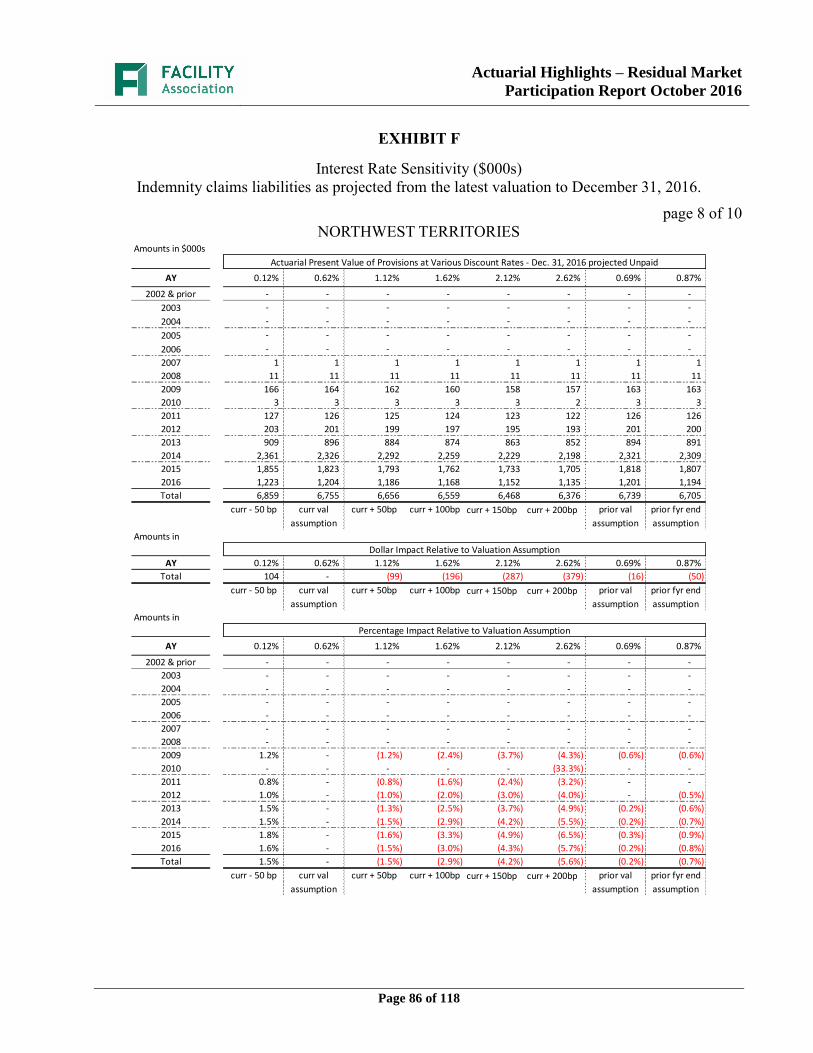
Actuarial Highlights – Residual Market
Participation Report October 2016
Page 86 of 118
EXHIBIT F
Interest Rate Sensitivity ($000s)
Indemnity claims liabilities as projected from the latest valuation to December 31, 2016.
page 8 of 10
NORTHWEST TERRITORIES
Amounts in $000s
Actuarial Present Value of Provisions at Various Discount Rates - Dec. 31, 2016 projected Unpaid
AY 0.12% 0.62% 1.12% 1.62% 2.12% 2.62% 0.69% 0.87%
2002 & prior - - - - - - - -
2003 - - - - - - - -
2004 - - - - - - - -
2005 - - - - - - - -
2006 - - - - - - - -
2007 1 1 1 1 1 1 1 1
2008 11 11 11 11 11 11 11 11
2009 166 164 162 160 158 157 163 163
2010 3 3 3 3 3 2 3 3
2011 127 126 125 124 123 122 126 126
2012 203 201 199 197 195 193 201 200
2013 909 896 884 874 863 852 894 891
2014 2,361 2,326 2,292 2,259 2,229 2,198 2,321 2,309
2015 1,855 1,823 1,793 1,762 1,733 1,705 1,818 1,807
2016 1,223 1,204 1,186 1,168 1,152 1,135 1,201 1,194
Total 6,859 6,755 6,656 6,559 6,468 6,376 6,739 6,705
curr - 50 bp curr val curr + 50bp curr + 100bp curr + 150bp curr + 200bp prior val prior fyr end
assumption assumption assumption
Amounts in
Dollar Impact Relative to Valuation Assumption
AY 0.12% 0.62% 1.12% 1.62% 2.12% 2.62% 0.69% 0.87%
Total 104 - (99) (196) (287) (379) (16) (50)
curr - 50 bp curr val curr + 50bp curr + 100bp curr + 150bp curr + 200bp prior val prior fyr end
assumption assumption assumption
Amounts in
Percentage Impact Relative to Valuation Assumption
AY 0.12% 0.62% 1.12% 1.62% 2.12% 2.62% 0.69% 0.87%
2002 & prior - - - - - - - -
2003 - - - - - - - -
2004 - - - - - - - -
2005 - - - - - - - -
2006 - - - - - - - -
2007 - - - - - - - -
2008 - - - - - - - -
2009 1.2% - (1.2%) (2.4%) (3.7%) (4.3%) (0.6%) (0.6%)
2010 - - - - - (33.3%) - -
2011 0.8% - (0.8%) (1.6%) (2.4%) (3.2%) - -
2012 1.0% - (1.0%) (2.0%) (3.0%) (4.0%) - (0.5%)
2013 1.5% - (1.3%) (2.5%) (3.7%) (4.9%) (0.2%) (0.6%)
2014 1.5% - (1.5%) (2.9%) (4.2%) (5.5%) (0.2%) (0.7%)
2015 1.8% - (1.6%) (3.3%) (4.9%) (6.5%) (0.3%) (0.9%)
2016 1.6% - (1.5%) (3.0%) (4.3%) (5.7%) (0.2%) (0.8%)
Total 1.5% - (1.5%) (2.9%) (4.2%) (5.6%) (0.2%) (0.7%)
curr - 50 bp curr val curr + 50bp curr + 100bp curr + 150bp curr + 200bp prior val prior fyr end
assumption assumption assumption
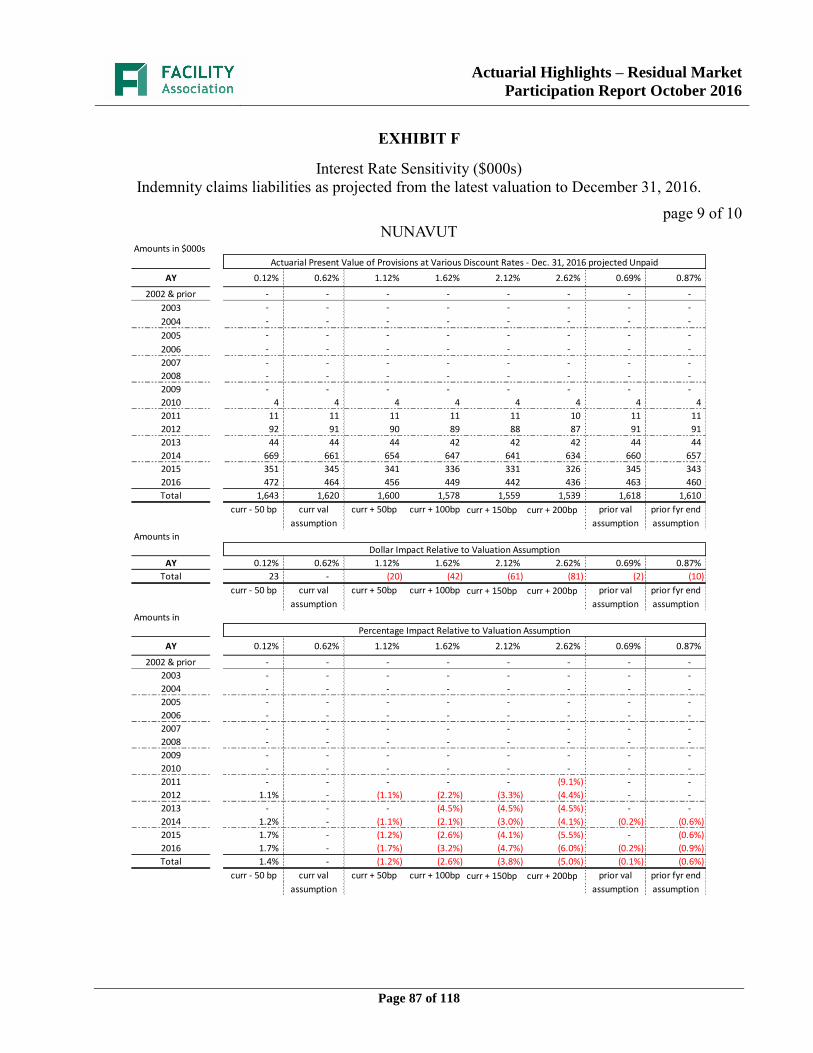
Actuarial Highlights – Residual Market
Participation Report October 2016
Page 87 of 118
EXHIBIT F
Interest Rate Sensitivity ($000s)
Indemnity claims liabilities as projected from the latest valuation to December 31, 2016.
page 9 of 10
NUNAVUT
Amounts in $000s
Actuarial Present Value of Provisions at Various Discount Rates - Dec. 31, 2016 projected Unpaid
AY 0.12% 0.62% 1.12% 1.62% 2.12% 2.62% 0.69% 0.87%
2002 & prior - - - - - - - -
2003 - - - - - - - -
2004 - - - - - - - -
2005 - - - - - - - -
2006 - - - - - - - -
2007 - - - - - - - -
2008 - - - - - - - -
2009 - - - - - - - -
2010 4 4 4 4 4 4 4 4
2011 11 11 11 11 11 10 11 11
2012 92 91 90 89 88 87 91 91
2013 44 44 44 42 42 42 44 44
2014 669 661 654 647 641 634 660 657
2015 351 345 341 336 331 326 345 343
2016 472 464 456 449 442 436 463 460
Total 1,643 1,620 1,600 1,578 1,559 1,539 1,618 1,610
curr - 50 bp curr val curr + 50bp curr + 100bp curr + 150bp curr + 200bp prior val prior fyr end
assumption assumption assumption
Amounts in
Dollar Impact Relative to Valuation Assumption
AY 0.12% 0.62% 1.12% 1.62% 2.12% 2.62% 0.69% 0.87%
Total 23 - (20) (42) (61) (81) (2) (10)
curr - 50 bp curr val curr + 50bp curr + 100bp curr + 150bp curr + 200bp prior val prior fyr end
assumption assumption assumption
Amounts in
Percentage Impact Relative to Valuation Assumption
AY 0.12% 0.62% 1.12% 1.62% 2.12% 2.62% 0.69% 0.87%
2002 & prior - - - - - - - -
2003 - - - - - - - -
2004 - - - - - - - -
2005 - - - - - - - -
2006 - - - - - - - -
2007 - - - - - - - -
2008 - - - - - - - -
2009 - - - - - - - -
2010 - - - - - - - -
2011 - - - - - (9.1%) - -
2012 1.1% - (1.1%) (2.2%) (3.3%) (4.4%) - -
2013 - - - (4.5%) (4.5%) (4.5%) - -
2014 1.2% - (1.1%) (2.1%) (3.0%) (4.1%) (0.2%) (0.6%)
2015 1.7% - (1.2%) (2.6%) (4.1%) (5.5%) - (0.6%)
2016 1.7% - (1.7%) (3.2%) (4.7%) (6.0%) (0.2%) (0.9%)
Total 1.4% - (1.2%) (2.6%) (3.8%) (5.0%) (0.1%) (0.6%)
curr - 50 bp curr val curr + 50bp curr + 100bp curr + 150bp curr + 200bp prior val prior fyr end
assumption assumption assumption
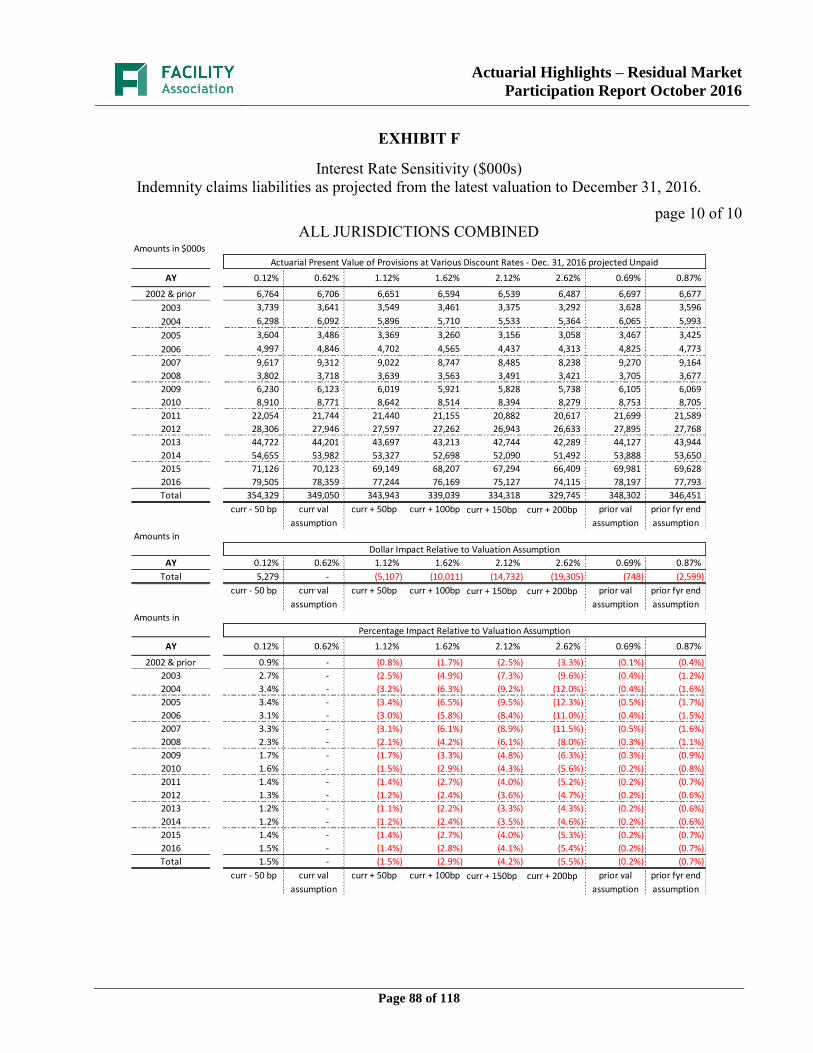
Actuarial Highlights – Residual Market
Participation Report October 2016
Page 88 of 118
EXHIBIT F
Interest Rate Sensitivity ($000s)
Indemnity claims liabilities as projected from the latest valuation to December 31, 2016.
page 10 of 10
ALL JURISDICTIONS COMBINED
Amounts in $000s
Actuarial Present Value of Provisions at Various Discount Rates - Dec. 31, 2016 projected Unpaid
AY 0.12% 0.62% 1.12% 1.62% 2.12% 2.62% 0.69% 0.87%
2002 & prior 6,764 6,706 6,651 6,594 6,539 6,487 6,697 6,677
2003 3,739 3,641 3,549 3,461 3,375 3,292 3,628 3,596
2004 6,298 6,092 5,896 5,710 5,533 5,364 6,065 5,993
2005 3,604 3,486 3,369 3,260 3,156 3,058 3,467 3,425
2006 4,997 4,846 4,702 4,565 4,437 4,313 4,825 4,773
2007 9,617 9,312 9,022 8,747 8,485 8,238 9,270 9,164
2008 3,802 3,718 3,639 3,563 3,491 3,421 3,705 3,677
2009 6,230 6,123 6,019 5,921 5,828 5,738 6,105 6,069
2010 8,910 8,771 8,642 8,514 8,394 8,279 8,753 8,705
2011 22,054 21,744 21,440 21,155 20,882 20,617 21,699 21,589
2012 28,306 27,946 27,597 27,262 26,943 26,633 27,895 27,768
2013 44,722 44,201 43,697 43,213 42,744 42,289 44,127 43,944
2014 54,655 53,982 53,327 52,698 52,090 51,492 53,888 53,650
2015 71,126 70,123 69,149 68,207 67,294 66,409 69,981 69,628
2016 79,505 78,359 77,244 76,169 75,127 74,115 78,197 77,793
Total 354,329 349,050 343,943 339,039 334,318 329,745 348,302 346,451
curr - 50 bp curr val curr + 50bp curr + 100bp curr + 150bp curr + 200bp prior val prior fyr end
assumption assumption assumption
Amounts in
Dollar Impact Relative to Valuation Assumption
AY 0.12% 0.62% 1.12% 1.62% 2.12% 2.62% 0.69% 0.87%
Total 5,279 - (5,107) (10,011) (14,732) (19,305) (748) (2,599)
curr - 50 bp curr val curr + 50bp curr + 100bp curr + 150bp curr + 200bp prior val prior fyr end
assumption assumption assumption
Amounts in
Percentage Impact Relative to Valuation Assumption
AY 0.12% 0.62% 1.12% 1.62% 2.12% 2.62% 0.69% 0.87%
2002 & prior 0.9% - (0.8%) (1.7%) (2.5%) (3.3%) (0.1%) (0.4%)
2003 2.7% - (2.5%) (4.9%) (7.3%) (9.6%) (0.4%) (1.2%)
2004 3.4% - (3.2%) (6.3%) (9.2%) (12.0%) (0.4%) (1.6%)
2005 3.4% - (3.4%) (6.5%) (9.5%) (12.3%) (0.5%) (1.7%)
2006 3.1% - (3.0%) (5.8%) (8.4%) (11.0%) (0.4%) (1.5%)
2007 3.3% - (3.1%) (6.1%) (8.9%) (11.5%) (0.5%) (1.6%)
2008 2.3% - (2.1%) (4.2%) (6.1%) (8.0%) (0.3%) (1.1%)
2009 1.7% - (1.7%) (3.3%) (4.8%) (6.3%) (0.3%) (0.9%)
2010 1.6% - (1.5%) (2.9%) (4.3%) (5.6%) (0.2%) (0.8%)
2011 1.4% - (1.4%) (2.7%) (4.0%) (5.2%) (0.2%) (0.7%)
2012 1.3% - (1.2%) (2.4%) (3.6%) (4.7%) (0.2%) (0.6%)
2013 1.2% - (1.1%) (2.2%) (3.3%) (4.3%) (0.2%) (0.6%)
2014 1.2% - (1.2%) (2.4%) (3.5%) (4.6%) (0.2%) (0.6%)
2015 1.4% - (1.4%) (2.7%) (4.0%) (5.3%) (0.2%) (0.7%)
2016 1.5% - (1.4%) (2.8%) (4.1%) (5.4%) (0.2%) (0.7%)
Total 1.5% - (1.5%) (2.9%) (4.2%) (5.5%) (0.2%) (0.7%)
curr - 50 bp curr val curr + 50bp curr + 100bp curr + 150bp curr + 200bp prior val prior fyr end
assumption assumption assumption
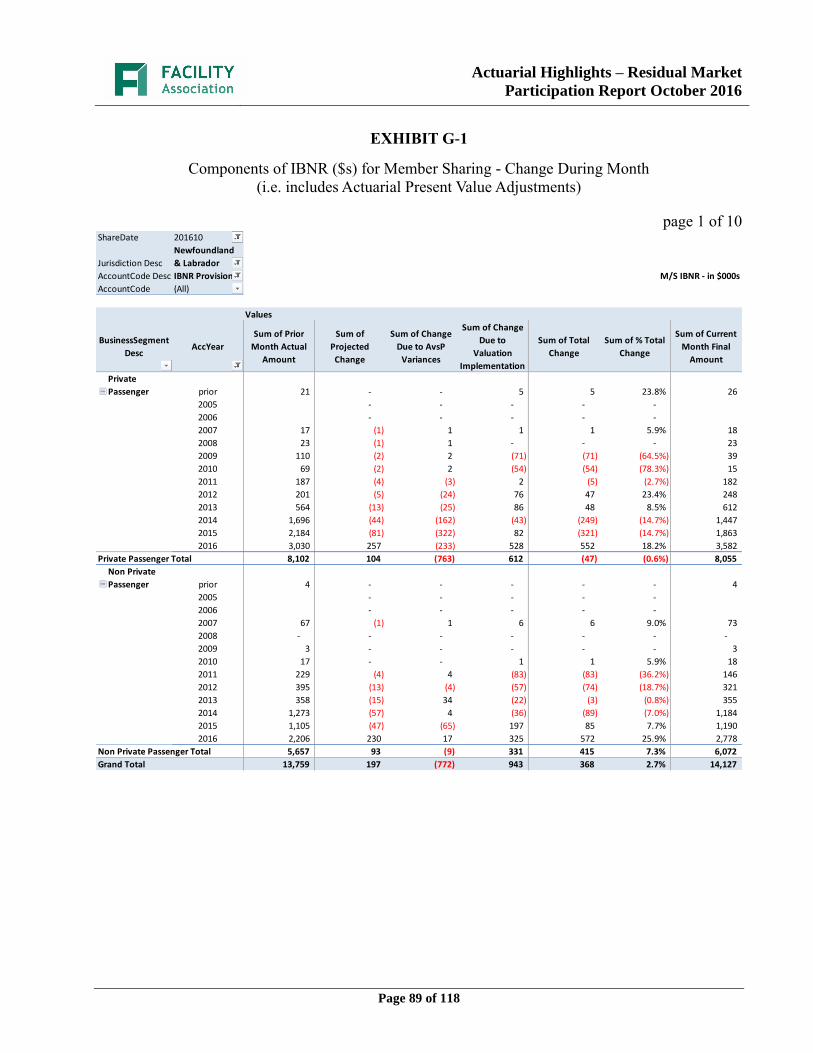
Actuarial Highlights – Residual Market
Participation Report October 2016
Page 89 of 118
EXHIBIT G-1
Components of IBNR ($s) for Member Sharing - Change During Month
(i.e. includes Actuarial Present Value Adjustments)
page 1 of 10
ShareDate 201610
Jurisdiction Desc
Newfoundland
& Labrador
AccountCode Desc IBNR Provision M/S IBNR - in $000s
AccountCode (All)
Values
BusinessSegment
DescAccYear
Sum of Prior
Month Actual
Amount
Sum of
Projected
Change
Sum of Change
Due to AvsP
Variances
Sum of Change
Due to
Valuation
Implementation
Sum of Total
Change
Sum of % Total
Change
Sum of Current
Month Final
Amount
Private
Passenger prior 21 - - 5 5 23.8% 26
2005 - - - - -
2006 - - - - -
2007 17 (1) 1 1 1 5.9% 18
2008 23 (1) 1 - - - 23
2009 110 (2) 2 (71) (71) (64.5%) 39
2010 69 (2) 2 (54) (54) (78.3%) 15
2011 187 (4) (3) 2 (5) (2.7%) 182
2012 201 (5) (24) 76 47 23.4% 248
2013 564 (13) (25) 86 48 8.5% 612
2014 1,696 (44) (162) (43) (249) (14.7%) 1,447
2015 2,184 (81) (322) 82 (321) (14.7%) 1,863
2016 3,030 257 (233) 528 552 18.2% 3,582
Private Passenger Total 8,102 104 (763) 612 (47) (0.6%) 8,055
Non Private
Passenger prior 4 - - - - - 4
2005 - - - - -
2006 - - - - -
2007 67 (1) 1 6 6 9.0% 73
2008 - - - - - - -
2009 3 - - - - - 3
2010 17 - - 1 1 5.9% 18
2011 229 (4) 4 (83) (83) (36.2%) 146
2012 395 (13) (4) (57) (74) (18.7%) 321
2013 358 (15) 34 (22) (3) (0.8%) 355
2014 1,273 (57) 4 (36) (89) (7.0%) 1,184
2015 1,105 (47) (65) 197 85 7.7% 1,190
2016 2,206 230 17 325 572 25.9% 2,778
Non Private Passenger Total 5,657 93 (9) 331 415 7.3% 6,072
Grand Total 13,759 197 (772) 943 368 2.7% 14,127
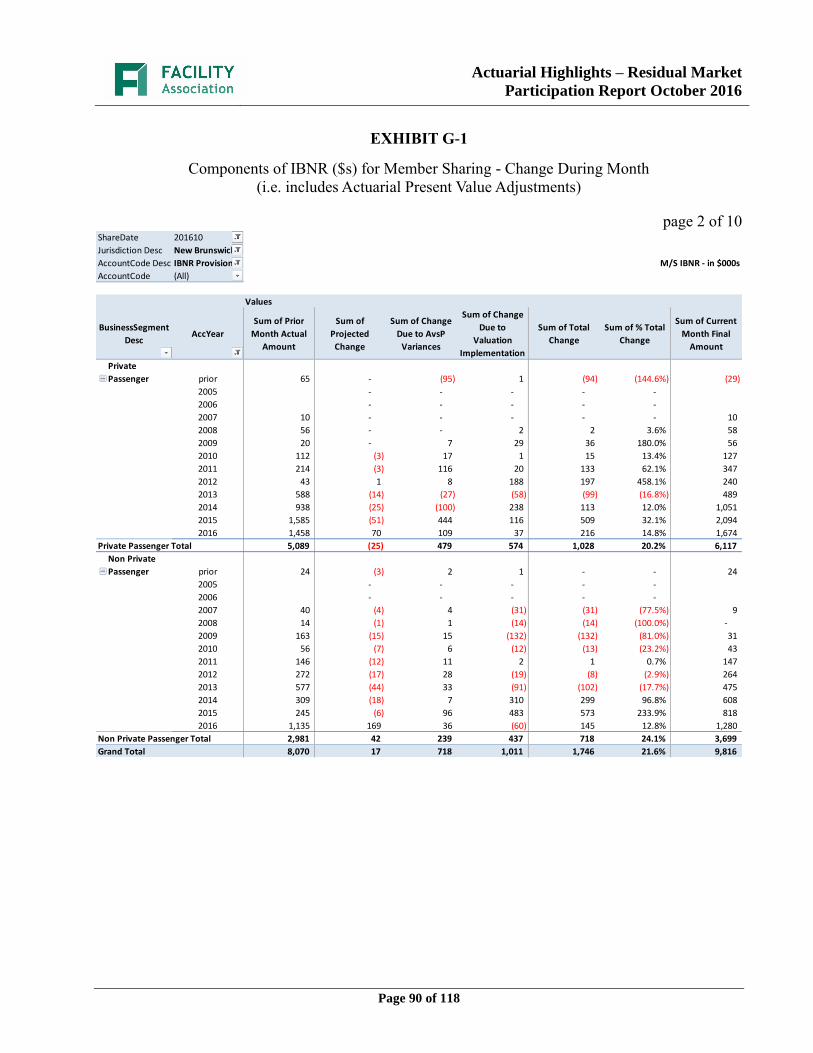
Actuarial Highlights – Residual Market
Participation Report October 2016
Page 90 of 118
EXHIBIT G-1
Components of IBNR ($s) for Member Sharing - Change During Month
(i.e. includes Actuarial Present Value Adjustments)
page 2 of 10
ShareDate 201610
Jurisdiction Desc New Brunswick
AccountCode Desc IBNR Provision M/S IBNR - in $000s
AccountCode (All)
Values
BusinessSegment
DescAccYear
Sum of Prior
Month Actual
Amount
Sum of
Projected
Change
Sum of Change
Due to AvsP
Variances
Sum of Change
Due to
Valuation
Implementation
Sum of Total
Change
Sum of % Total
Change
Sum of Current
Month Final
Amount
Private
Passenger prior 65 - (95) 1 (94) (144.6%) (29)
2005 - - - - -
2006 - - - - -
2007 10 - - - - - 10
2008 56 - - 2 2 3.6% 58
2009 20 - 7 29 36 180.0% 56
2010 112 (3) 17 1 15 13.4% 127
2011 214 (3) 116 20 133 62.1% 347
2012 43 1 8 188 197 458.1% 240
2013 588 (14) (27) (58) (99) (16.8%) 489
2014 938 (25) (100) 238 113 12.0% 1,051
2015 1,585 (51) 444 116 509 32.1% 2,094
2016 1,458 70 109 37 216 14.8% 1,674
Private Passenger Total 5,089 (25) 479 574 1,028 20.2% 6,117
Non Private
Passenger prior 24 (3) 2 1 - - 24
2005 - - - - -
2006 - - - - -
2007 40 (4) 4 (31) (31) (77.5%) 9
2008 14 (1) 1 (14) (14) (100.0%) -
2009 163 (15) 15 (132) (132) (81.0%) 31
2010 56 (7) 6 (12) (13) (23.2%) 43
2011 146 (12) 11 2 1 0.7% 147
2012 272 (17) 28 (19) (8) (2.9%) 264
2013 577 (44) 33 (91) (102) (17.7%) 475
2014 309 (18) 7 310 299 96.8% 608
2015 245 (6) 96 483 573 233.9% 818
2016 1,135 169 36 (60) 145 12.8% 1,280
Non Private Passenger Total 2,981 42 239 437 718 24.1% 3,699
Grand Total 8,070 17 718 1,011 1,746 21.6% 9,816

Actuarial Highlights – Residual Market
Participation Report October 2016
Page 91 of 118
EXHIBIT G-1
Components of IBNR ($s) for Member Sharing - Change During Month
(i.e. includes Actuarial Present Value Adjustments)
page 3 of 10
ShareDate 201610
Jurisdiction Desc Nova Scotia
AccountCode Desc IBNR Provision M/S IBNR - in $000s
AccountCode (All)
Values
BusinessSegment
DescAccYear
Sum of Prior
Month Actual
Amount
Sum of
Projected
Change
Sum of Change
Due to AvsP
Variances
Sum of Change
Due to
Valuation
Implementation
Sum of Total
Change
Sum of % Total
Change
Sum of Current
Month Final
Amount
Private
Passenger prior 585 (7) 255 (468) (220) (37.6%) 365
2005 - - - - -
2006 - - - - -
2007 192 (3) 3 (47) (47) (24.5%) 145
2008 3 (1) 226 43 268 8,933.3% 271
2009 141 (3) 3 (82) (82) (58.2%) 59
2010 (3) 1 (121) 52 (68) 2,266.7% (71)
2011 20 - - 2 2 10.0% 22
2012 377 7 4 (275) (264) (70.0%) 113
2013 161 (1) 6 (6) (1) (0.6%) 160
2014 645 19 (24) (71) (76) (11.8%) 569
2015 1,016 29 (95) (63) (129) (12.7%) 887
2016 1,368 83 83 - 166 12.1% 1,534
Private Passenger Total 4,505 124 340 (915) (451) (10.0%) 4,054
Non Private
Passenger prior 6 - - 13 13 216.7% 19
2005 - - - - -
2006 - - - - -
2007 (5) - - - - - (5)
2008 17 1 - 1 2 11.8% 19
2009 (5) - - - - - (5)
2010 25 (1) 1 2 2 8.0% 27
2011 95 (1) 41 5 45 47.4% 140
2012 104 (3) 5 (12) (10) (9.6%) 94
2013 (279) 6 (16) 601 591 (211.8%) 312
2014 276 (6) 55 114 163 59.1% 439
2015 1,760 (66) 46 25 5 0.3% 1,765
2016 1,911 166 96 105 367 19.2% 2,278
Non Private Passenger Total 3,905 96 228 854 1,178 30.2% 5,083
Grand Total 8,410 220 568 (61) 727 8.6% 9,137

Actuarial Highlights – Residual Market
Participation Report October 2016
Page 92 of 118
EXHIBIT G-1
Components of IBNR ($s) for Member Sharing - Change During Month
(i.e. includes Actuarial Present Value Adjustments)
page 4 of 10
ShareDate 201610
Jurisdiction Desc
Prince Edward
Island
AccountCode Desc IBNR Provision M/S IBNR - in $000s
AccountCode (All)
Values
BusinessSegment
DescAccYear
Sum of Prior
Month Actual
Amount
Sum of
Projected
Change
Sum of Change
Due to AvsP
Variances
Sum of Change
Due to
Valuation
Implementation
Sum of Total
Change
Sum of % Total
Change
Sum of Current
Month Final
Amount
Private
Passenger prior 21 - - - - - 21
2005 - - - - -
2006 - - - - -
2007 (1) - - - - - (1)
2008 (1) - - - - - (1)
2009 - - - - - - -
2010 28 (1) 1 - - - 28
2011 61 - - (2) (2) (3.3%) 59
2012 99 (1) 1 (84) (84) (84.8%) 15
2013 125 (1) 1 (65) (65) (52.0%) 60
2014 180 (4) 4 72 72 40.0% 252
2015 334 (27) 30 127 130 38.9% 464
2016 230 41 25 96 162 70.4% 392
Private Passenger Total 1,076 7 62 144 213 19.8% 1,289
Non Private
Passenger prior (1) - - - - - (1)
2005 - - - - -
2006 - - - - -
2007 - - - - - - -
2008 (2) - - - - - (2)
2009 - - - - - - -
2010 - - - - - - -
2011 21 - - (1) (1) (4.8%) 20
2012 129 (1) 1 (13) (13) (10.1%) 116
2013 59 (1) 1 - - - 59
2014 269 (2) 2 (39) (39) (14.5%) 230
2015 436 (4) 4 17 17 3.9% 453
2016 127 45 (299) 272 18 14.2% 145
Non Private Passenger Total 1,038 37 (291) 236 (18) (1.7%) 1,020
Grand Total 2,114 44 (229) 380 195 9.2% 2,309
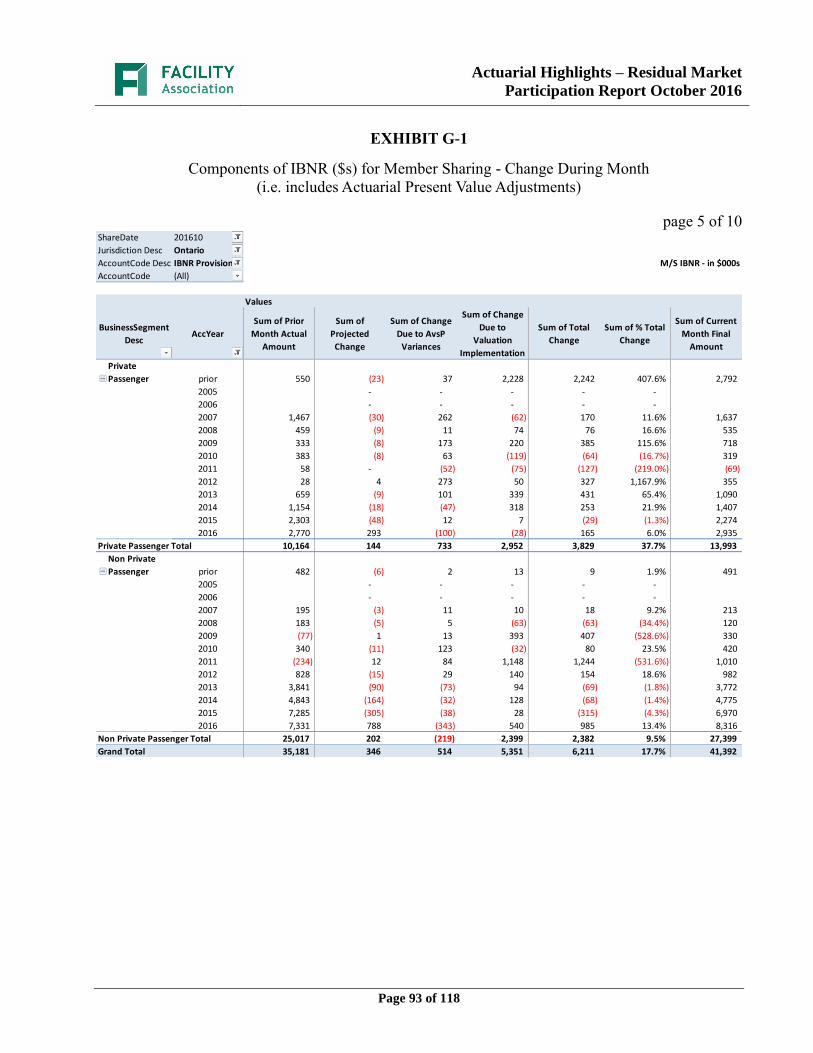
Actuarial Highlights – Residual Market
Participation Report October 2016
Page 93 of 118
EXHIBIT G-1
Components of IBNR ($s) for Member Sharing - Change During Month
(i.e. includes Actuarial Present Value Adjustments)
page 5 of 10
ShareDate 201610
Jurisdiction Desc Ontario
AccountCode Desc IBNR Provision M/S IBNR - in $000s
AccountCode (All)
Values
BusinessSegment
DescAccYear
Sum of Prior
Month Actual
Amount
Sum of
Projected
Change
Sum of Change
Due to AvsP
Variances
Sum of Change
Due to
Valuation
Implementation
Sum of Total
Change
Sum of % Total
Change
Sum of Current
Month Final
Amount
Private
Passenger prior 550 (23) 37 2,228 2,242 407.6% 2,792
2005 - - - - -
2006 - - - - -
2007 1,467 (30) 262 (62) 170 11.6% 1,637
2008 459 (9) 11 74 76 16.6% 535
2009 333 (8) 173 220 385 115.6% 718
2010 383 (8) 63 (119) (64) (16.7%) 319
2011 58 - (52) (75) (127) (219.0%) (69)
2012 28 4 273 50 327 1,167.9% 355
2013 659 (9) 101 339 431 65.4% 1,090
2014 1,154 (18) (47) 318 253 21.9% 1,407
2015 2,303 (48) 12 7 (29) (1.3%) 2,274
2016 2,770 293 (100) (28) 165 6.0% 2,935
Private Passenger Total 10,164 144 733 2,952 3,829 37.7% 13,993
Non Private
Passenger prior 482 (6) 2 13 9 1.9% 491
2005 - - - - -
2006 - - - - -
2007 195 (3) 11 10 18 9.2% 213
2008 183 (5) 5 (63) (63) (34.4%) 120
2009 (77) 1 13 393 407 (528.6%) 330
2010 340 (11) 123 (32) 80 23.5% 420
2011 (234) 12 84 1,148 1,244 (531.6%) 1,010
2012 828 (15) 29 140 154 18.6% 982
2013 3,841 (90) (73) 94 (69) (1.8%) 3,772
2014 4,843 (164) (32) 128 (68) (1.4%) 4,775
2015 7,285 (305) (38) 28 (315) (4.3%) 6,970
2016 7,331 788 (343) 540 985 13.4% 8,316
Non Private Passenger Total 25,017 202 (219) 2,399 2,382 9.5% 27,399
Grand Total 35,181 346 514 5,351 6,211 17.7% 41,392
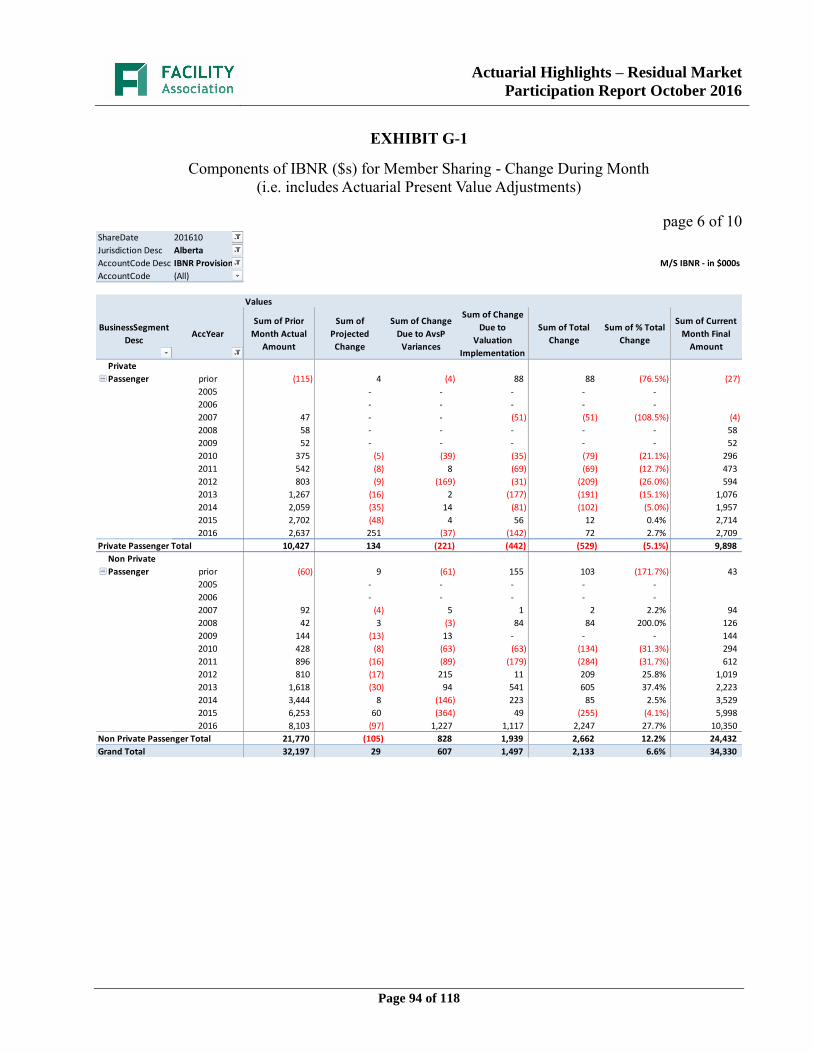
Actuarial Highlights – Residual Market
Participation Report October 2016
Page 94 of 118
EXHIBIT G-1
Components of IBNR ($s) for Member Sharing - Change During Month
(i.e. includes Actuarial Present Value Adjustments)
page 6 of 10
ShareDate 201610
Jurisdiction Desc Alberta
AccountCode Desc IBNR Provision M/S IBNR - in $000s
AccountCode (All)
Values
BusinessSegment
DescAccYear
Sum of Prior
Month Actual
Amount
Sum of
Projected
Change
Sum of Change
Due to AvsP
Variances
Sum of Change
Due to
Valuation
Implementation
Sum of Total
Change
Sum of % Total
Change
Sum of Current
Month Final
Amount
Private
Passenger prior (115) 4 (4) 88 88 (76.5%) (27)
2005 - - - - -
2006 - - - - -
2007 47 - - (51) (51) (108.5%) (4)
2008 58 - - - - - 58
2009 52 - - - - - 52
2010 375 (5) (39) (35) (79) (21.1%) 296
2011 542 (8) 8 (69) (69) (12.7%) 473
2012 803 (9) (169) (31) (209) (26.0%) 594
2013 1,267 (16) 2 (177) (191) (15.1%) 1,076
2014 2,059 (35) 14 (81) (102) (5.0%) 1,957
2015 2,702 (48) 4 56 12 0.4% 2,714
2016 2,637 251 (37) (142) 72 2.7% 2,709
Private Passenger Total 10,427 134 (221) (442) (529) (5.1%) 9,898
Non Private
Passenger prior (60) 9 (61) 155 103 (171.7%) 43
2005 - - - - -
2006 - - - - -
2007 92 (4) 5 1 2 2.2% 94
2008 42 3 (3) 84 84 200.0% 126
2009 144 (13) 13 - - - 144
2010 428 (8) (63) (63) (134) (31.3%) 294
2011 896 (16) (89) (179) (284) (31.7%) 612
2012 810 (17) 215 11 209 25.8% 1,019
2013 1,618 (30) 94 541 605 37.4% 2,223
2014 3,444 8 (146) 223 85 2.5% 3,529
2015 6,253 60 (364) 49 (255) (4.1%) 5,998
2016 8,103 (97) 1,227 1,117 2,247 27.7% 10,350
Non Private Passenger Total 21,770 (105) 828 1,939 2,662 12.2% 24,432
Grand Total 32,197 29 607 1,497 2,133 6.6% 34,330

Actuarial Highlights – Residual Market
Participation Report October 2016
Page 95 of 118
EXHIBIT G-1
Components of IBNR ($s) for Member Sharing - Change During Month
(i.e. includes Actuarial Present Value Adjustments)
page 7 of 10
ShareDate 201610
Jurisdiction Desc Yukon
AccountCode Desc IBNR Provision M/S IBNR - in $000s
AccountCode (All)
Values
BusinessSegment
DescAccYear
Sum of Prior
Month Actual
Amount
Sum of
Projected
Change
Sum of Change
Due to AvsP
Variances
Sum of Change
Due to
Valuation
Implementation
Sum of Total
Change
Sum of % Total
Change
Sum of Current
Month Final
Amount
Private
Passenger prior 5 - - - - - 5
2005 - - - - -
2006 - - - - -
2007 - - - - - - -
2008 15 - - (7) (7) (46.7%) 8
2009 15 - - (2) (2) (13.3%) 13
2010 35 - (60) (1) (61) (174.3%) (26)
2011 57 1 (1) (3) (3) (5.3%) 54
2012 60 (2) 2 (6) (6) (10.0%) 54
2013 99 (1) 1 (13) (13) (13.1%) 86
2014 201 (3) 3 (38) (38) (18.9%) 163
2015 382 (21) (54) (24) (99) (25.9%) 283
2016 296 10 19 (48) (19) (6.4%) 277
Private Passenger Total 1,165 (16) (90) (142) (248) (21.3%) 917
Non Private
Passenger prior 1 - - - - - 1
2005 - - - - -
2006 - - - - -
2007 - - - - - - -
2008 1 - - - - - 1
2009 - - - - - - -
2010 2 - - - - - 2
2011 6 - - - - - 6
2012 (34) 1 (1) 55 55 (161.8%) 21
2013 52 (2) 2 (2) (2) (3.8%) 50
2014 95 (4) 4 (3) (3) (3.2%) 92
2015 121 (7) 5 86 84 69.4% 205
2016 306 16 (17) (2) (3) (1.0%) 303
Non Private Passenger Total 550 4 (7) 134 131 23.8% 681
Grand Total 1,715 (12) (97) (8) (117) (6.8%) 1,598
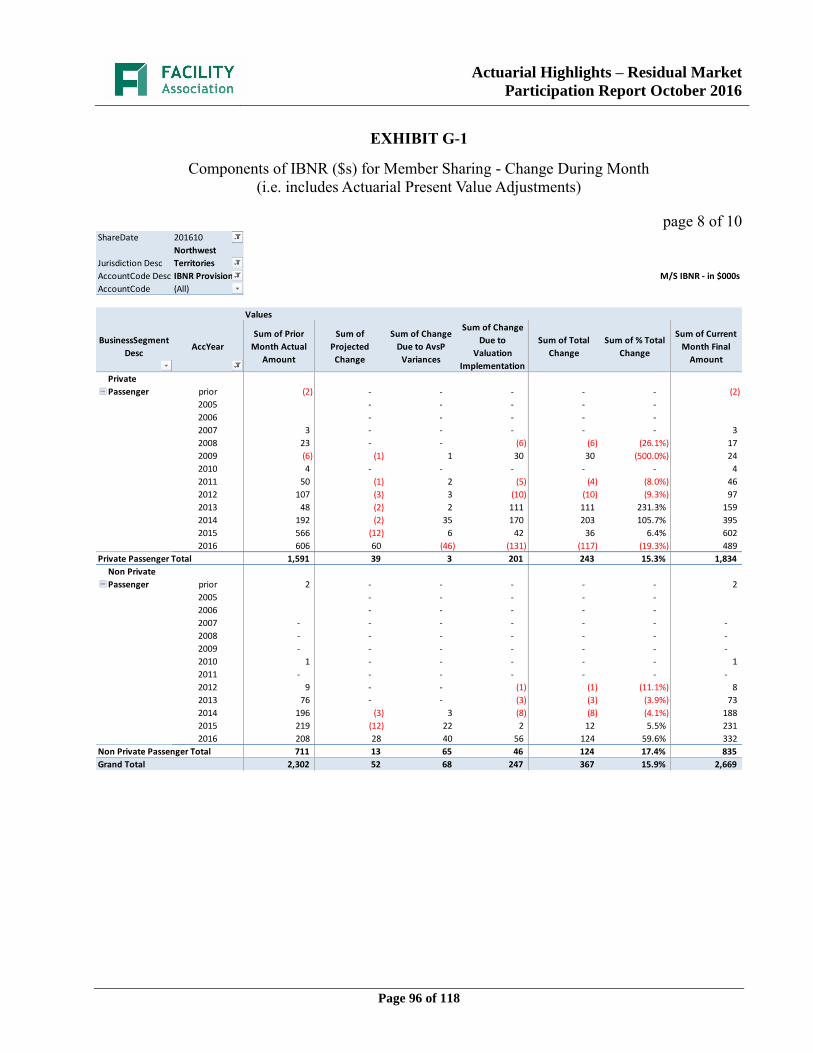
Actuarial Highlights – Residual Market
Participation Report October 2016
Page 96 of 118
EXHIBIT G-1
Components of IBNR ($s) for Member Sharing - Change During Month
(i.e. includes Actuarial Present Value Adjustments)
page 8 of 10
ShareDate 201610
Jurisdiction Desc
Northwest
Territories
AccountCode Desc IBNR Provision M/S IBNR - in $000s
AccountCode (All)
Values
BusinessSegment
DescAccYear
Sum of Prior
Month Actual
Amount
Sum of
Projected
Change
Sum of Change
Due to AvsP
Variances
Sum of Change
Due to
Valuation
Implementation
Sum of Total
Change
Sum of % Total
Change
Sum of Current
Month Final
Amount
Private
Passenger prior (2) - - - - - (2)
2005 - - - - -
2006 - - - - -
2007 3 - - - - - 3
2008 23 - - (6) (6) (26.1%) 17
2009 (6) (1) 1 30 30 (500.0%) 24
2010 4 - - - - - 4
2011 50 (1) 2 (5) (4) (8.0%) 46
2012 107 (3) 3 (10) (10) (9.3%) 97
2013 48 (2) 2 111 111 231.3% 159
2014 192 (2) 35 170 203 105.7% 395
2015 566 (12) 6 42 36 6.4% 602
2016 606 60 (46) (131) (117) (19.3%) 489
Private Passenger Total 1,591 39 3 201 243 15.3% 1,834
Non Private
Passenger prior 2 - - - - - 2
2005 - - - - -
2006 - - - - -
2007 - - - - - - -
2008 - - - - - - -
2009 - - - - - - -
2010 1 - - - - - 1
2011 - - - - - - -
2012 9 - - (1) (1) (11.1%) 8
2013 76 - - (3) (3) (3.9%) 73
2014 196 (3) 3 (8) (8) (4.1%) 188
2015 219 (12) 22 2 12 5.5% 231
2016 208 28 40 56 124 59.6% 332
Non Private Passenger Total 711 13 65 46 124 17.4% 835
Grand Total 2,302 52 68 247 367 15.9% 2,669

Actuarial Highlights – Residual Market
Participation Report October 2016
Page 97 of 118
EXHIBIT G-1
Components of IBNR ($s) for Member Sharing - Change During Month
(i.e. includes Actuarial Present Value Adjustments)
page 9 of 10
ShareDate 201610
Jurisdiction Desc Nunavut
AccountCode Desc IBNR Provision M/S IBNR - in $000s
AccountCode (All)
Values
BusinessSegment
DescAccYear
Sum of Prior
Month Actual
Amount
Sum of
Projected
Change
Sum of Change
Due to AvsP
Variances
Sum of Change
Due to
Valuation
Implementation
Sum of Total
Change
Sum of % Total
Change
Sum of Current
Month Final
Amount
Private
Passenger prior (2) - - - - - (2)
2005 - - - - -
2006 - - - - -
2007 1 - - (1) (1) (100.0%) -
2008 1 - - - - - 1
2009 - - - - - - -
2010 6 - - - - - 6
2011 14 - - (1) (1) (7.1%) 13
2012 29 - - (3) (3) (10.3%) 26
2013 33 - - (5) (5) (15.2%) 28
2014 54 - - (3) (3) (5.6%) 51
2015 197 (7) 7 1 1 0.5% 198
2016 57 10 17 24 51 89.5% 108
Private Passenger Total 390 3 24 12 39 10.0% 429
Non Private
Passenger prior - - - - - - -
2005 - - - - -
2006 - - - - -
2007 - - - - - - -
2008 - - - - - - -
2009 - - - - - - -
2010 - - - - - - -
2011 - - - - - - -
2012 7 - - - - - 7
2013 23 - - (3) (3) (13.0%) 20
2014 97 - - (6) (6) (6.2%) 91
2015 181 (2) 2 2 2 1.1% 183
2016 189 30 (8) (12) 10 5.3% 199
Non Private Passenger Total 497 28 (6) (19) 3 0.6% 500
Grand Total 887 31 18 (7) 42 4.7% 929
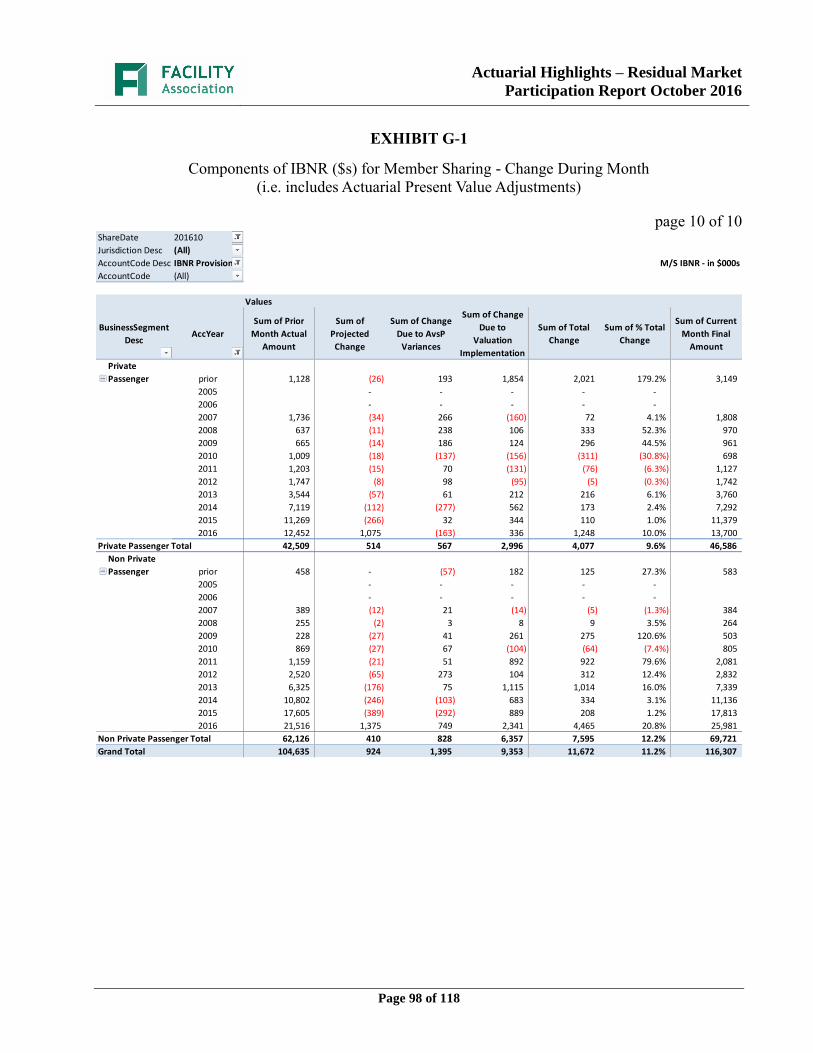
Actuarial Highlights – Residual Market
Participation Report October 2016
Page 98 of 118
EXHIBIT G-1
Components of IBNR ($s) for Member Sharing - Change During Month
(i.e. includes Actuarial Present Value Adjustments)
page 10 of 10
ShareDate 201610
Jurisdiction Desc (All)
AccountCode Desc IBNR Provision M/S IBNR - in $000s
AccountCode (All)
Values
BusinessSegment
DescAccYear
Sum of Prior
Month Actual
Amount
Sum of
Projected
Change
Sum of Change
Due to AvsP
Variances
Sum of Change
Due to
Valuation
Implementation
Sum of Total
Change
Sum of % Total
Change
Sum of Current
Month Final
Amount
Private
Passenger prior 1,128 (26) 193 1,854 2,021 179.2% 3,149
2005 - - - - -
2006 - - - - -
2007 1,736 (34) 266 (160) 72 4.1% 1,808
2008 637 (11) 238 106 333 52.3% 970
2009 665 (14) 186 124 296 44.5% 961
2010 1,009 (18) (137) (156) (311) (30.8%) 698
2011 1,203 (15) 70 (131) (76) (6.3%) 1,127
2012 1,747 (8) 98 (95) (5) (0.3%) 1,742
2013 3,544 (57) 61 212 216 6.1% 3,760
2014 7,119 (112) (277) 562 173 2.4% 7,292
2015 11,269 (266) 32 344 110 1.0% 11,379
2016 12,452 1,075 (163) 336 1,248 10.0% 13,700
Private Passenger Total 42,509 514 567 2,996 4,077 9.6% 46,586
Non Private
Passenger prior 458 - (57) 182 125 27.3% 583
2005 - - - - -
2006 - - - - -
2007 389 (12) 21 (14) (5) (1.3%) 384
2008 255 (2) 3 8 9 3.5% 264
2009 228 (27) 41 261 275 120.6% 503
2010 869 (27) 67 (104) (64) (7.4%) 805
2011 1,159 (21) 51 892 922 79.6% 2,081
2012 2,520 (65) 273 104 312 12.4% 2,832
2013 6,325 (176) 75 1,115 1,014 16.0% 7,339
2014 10,802 (246) (103) 683 334 3.1% 11,136
2015 17,605 (389) (292) 889 208 1.2% 17,813
2016 21,516 1,375 749 2,341 4,465 20.8% 25,981
Non Private Passenger Total 62,126 410 828 6,357 7,595 12.2% 69,721
Grand Total 104,635 924 1,395 9,353 11,672 11.2% 116,307
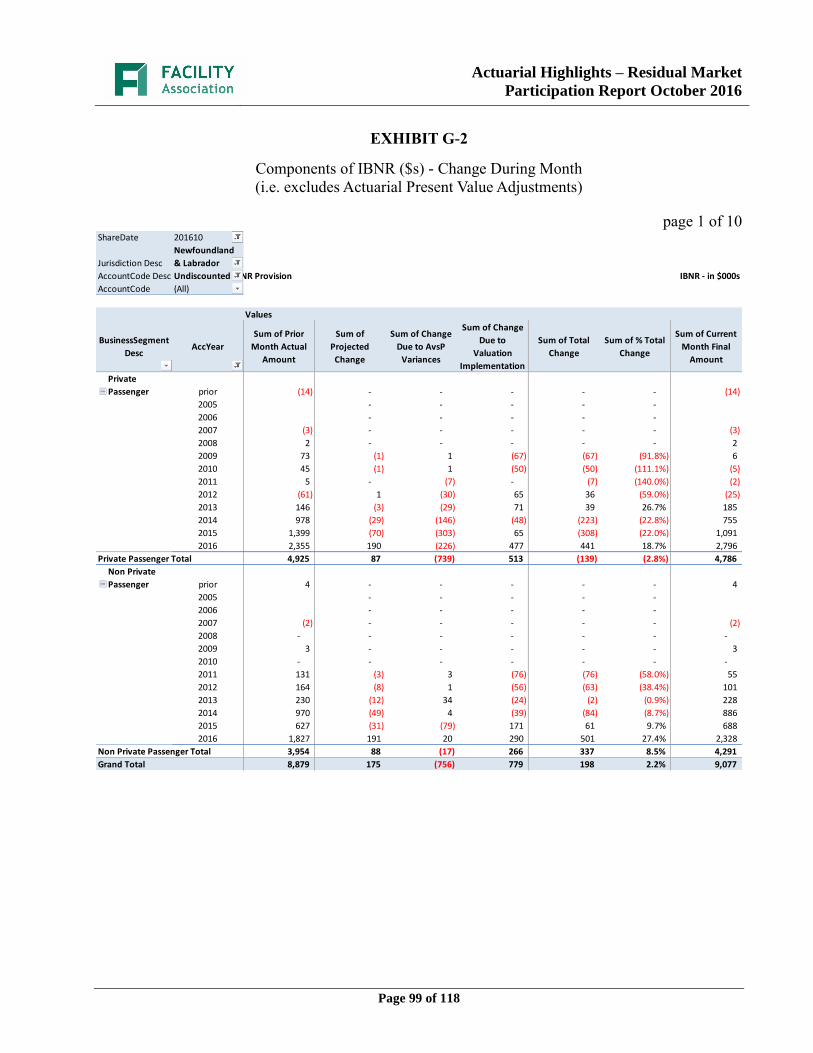
Actuarial Highlights – Residual Market
Participation Report October 2016
Page 99 of 118
EXHIBIT G-2
Components of IBNR ($s) - Change During Month
(i.e. excludes Actuarial Present Value Adjustments)
page 1 of 10
ShareDate 201610
Jurisdiction Desc
Newfoundland
& Labrador
AccountCode Desc Undiscounted IBNR Provision IBNR - in $000s
AccountCode (All)
Values
BusinessSegment
DescAccYear
Sum of Prior
Month Actual
Amount
Sum of
Projected
Change
Sum of Change
Due to AvsP
Variances
Sum of Change
Due to
Valuation
Implementation
Sum of Total
Change
Sum of % Total
Change
Sum of Current
Month Final
Amount
Private
Passenger prior (14) - - - - - (14)
2005 - - - - -
2006 - - - - -
2007 (3) - - - - - (3)
2008 2 - - - - - 2
2009 73 (1) 1 (67) (67) (91.8%) 6
2010 45 (1) 1 (50) (50) (111.1%) (5)
2011 5 - (7) - (7) (140.0%) (2)
2012 (61) 1 (30) 65 36 (59.0%) (25)
2013 146 (3) (29) 71 39 26.7% 185
2014 978 (29) (146) (48) (223) (22.8%) 755
2015 1,399 (70) (303) 65 (308) (22.0%) 1,091
2016 2,355 190 (226) 477 441 18.7% 2,796
Private Passenger Total 4,925 87 (739) 513 (139) (2.8%) 4,786
Non Private
Passenger prior 4 - - - - - 4
2005 - - - - -
2006 - - - - -
2007 (2) - - - - - (2)
2008 - - - - - - -
2009 3 - - - - - 3
2010 - - - - - - -
2011 131 (3) 3 (76) (76) (58.0%) 55
2012 164 (8) 1 (56) (63) (38.4%) 101
2013 230 (12) 34 (24) (2) (0.9%) 228
2014 970 (49) 4 (39) (84) (8.7%) 886
2015 627 (31) (79) 171 61 9.7% 688
2016 1,827 191 20 290 501 27.4% 2,328
Non Private Passenger Total 3,954 88 (17) 266 337 8.5% 4,291
Grand Total 8,879 175 (756) 779 198 2.2% 9,077

Actuarial Highlights – Residual Market
Participation Report October 2016
Page 100 of 118
EXHIBIT G-2
Components of IBNR ($s) - Change During Month
(i.e. excludes Actuarial Present Value Adjustments)
page 2 of 10
ShareDate 201610
Jurisdiction Desc New Brunswick
AccountCode Desc Undiscounted IBNR Provision IBNR - in $000s
AccountCode (All)
Values
BusinessSegment
DescAccYear
Sum of Prior
Month Actual
Amount
Sum of
Projected
Change
Sum of Change
Due to AvsP
Variances
Sum of Change
Due to
Valuation
Implementation
Sum of Total
Change
Sum of % Total
Change
Sum of Current
Month Final
Amount
Private
Passenger prior 32 - (95) - (95) (296.9%) (63)
2005 - - - - -
2006 - - - - -
2007 9 - - - - - 9
2008 8 - - - - - 8
2009 4 - 7 26 33 825.0% 37
2010 80 (2) 16 - 14 17.5% 94
2011 78 (2) 119 15 132 169.2% 210
2012 (88) 3 7 171 181 (205.7%) 93
2013 370 (11) (29) (55) (95) (25.7%) 275
2014 548 (19) (77) 207 111 20.3% 659
2015 1,120 (45) 440 101 496 44.3% 1,616
2016 1,065 27 121 21 169 15.9% 1,234
Private Passenger Total 3,226 (49) 509 486 946 29.3% 4,172
Non Private
Passenger prior 2 (2) 2 - - - 2
2005 - - - - -
2006 - - - - -
2007 37 (4) 4 (29) (29) (78.4%) 8
2008 11 (1) 1 (13) (13) (118.2%) (2)
2009 132 (13) 13 (122) (122) (92.4%) 10
2010 37 (7) 7 (11) (11) (29.7%) 26
2011 71 (11) 11 - - - 71
2012 153 (15) 27 (20) (8) (5.2%) 145
2013 260 (39) 29 (86) (96) (36.9%) 164
2014 129 (13) 4 278 269 208.5% 398
2015 54 5 89 436 530 981.5% 584
2016 954 153 41 (58) 136 14.3% 1,090
Non Private Passenger Total 1,840 53 228 375 656 35.7% 2,496
Grand Total 5,066 4 737 861 1,602 31.6% 6,668
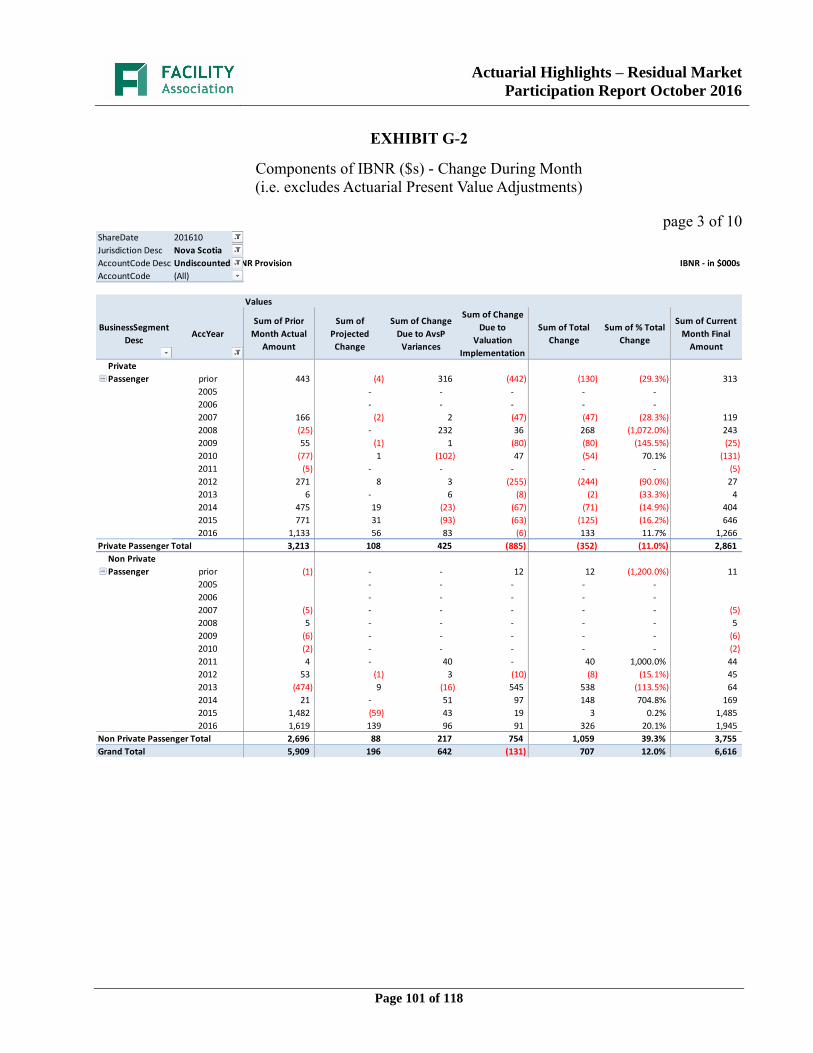
Actuarial Highlights – Residual Market
Participation Report October 2016
Page 101 of 118
EXHIBIT G-2
Components of IBNR ($s) - Change During Month
(i.e. excludes Actuarial Present Value Adjustments)
page 3 of 10
ShareDate 201610
Jurisdiction Desc Nova Scotia
AccountCode Desc Undiscounted IBNR Provision IBNR - in $000s
AccountCode (All)
Values
BusinessSegment
DescAccYear
Sum of Prior
Month Actual
Amount
Sum of
Projected
Change
Sum of Change
Due to AvsP
Variances
Sum of Change
Due to
Valuation
Implementation
Sum of Total
Change
Sum of % Total
Change
Sum of Current
Month Final
Amount
Private
Passenger prior 443 (4) 316 (442) (130) (29.3%) 313
2005 - - - - -
2006 - - - - -
2007 166 (2) 2 (47) (47) (28.3%) 119
2008 (25) - 232 36 268 (1,072.0%) 243
2009 55 (1) 1 (80) (80) (145.5%) (25)
2010 (77) 1 (102) 47 (54) 70.1% (131)
2011 (5) - - - - - (5)
2012 271 8 3 (255) (244) (90.0%) 27
2013 6 - 6 (8) (2) (33.3%) 4
2014 475 19 (23) (67) (71) (14.9%) 404
2015 771 31 (93) (63) (125) (16.2%) 646
2016 1,133 56 83 (6) 133 11.7% 1,266
Private Passenger Total 3,213 108 425 (885) (352) (11.0%) 2,861
Non Private
Passenger prior (1) - - 12 12 (1,200.0%) 11
2005 - - - - -
2006 - - - - -
2007 (5) - - - - - (5)
2008 5 - - - - - 5
2009 (6) - - - - - (6)
2010 (2) - - - - - (2)
2011 4 - 40 - 40 1,000.0% 44
2012 53 (1) 3 (10) (8) (15.1%) 45
2013 (474) 9 (16) 545 538 (113.5%) 64
2014 21 - 51 97 148 704.8% 169
2015 1,482 (59) 43 19 3 0.2% 1,485
2016 1,619 139 96 91 326 20.1% 1,945
Non Private Passenger Total 2,696 88 217 754 1,059 39.3% 3,755
Grand Total 5,909 196 642 (131) 707 12.0% 6,616
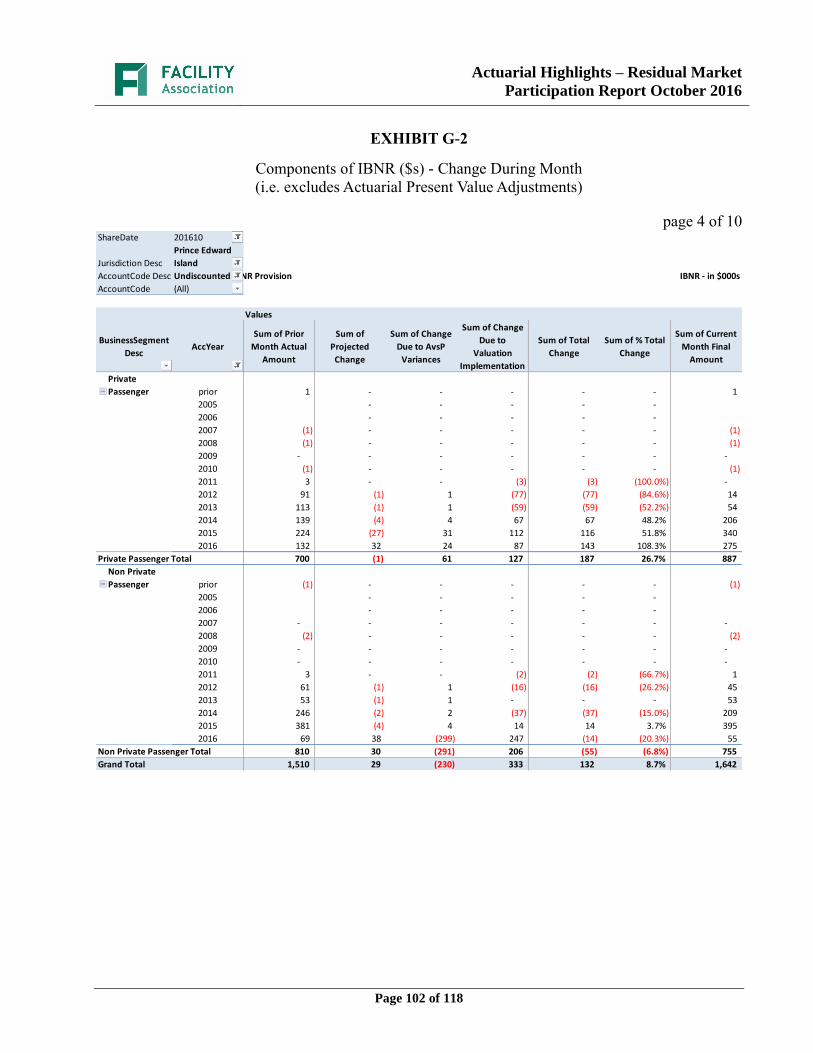
Actuarial Highlights – Residual Market
Participation Report October 2016
Page 102 of 118
EXHIBIT G-2
Components of IBNR ($s) - Change During Month
(i.e. excludes Actuarial Present Value Adjustments)
page 4 of 10
ShareDate 201610
Jurisdiction Desc
Prince Edward
Island
AccountCode Desc Undiscounted IBNR Provision IBNR - in $000s
AccountCode (All)
Values
BusinessSegment
DescAccYear
Sum of Prior
Month Actual
Amount
Sum of
Projected
Change
Sum of Change
Due to AvsP
Variances
Sum of Change
Due to
Valuation
Implementation
Sum of Total
Change
Sum of % Total
Change
Sum of Current
Month Final
Amount
Private
Passenger prior 1 - - - - - 1
2005 - - - - -
2006 - - - - -
2007 (1) - - - - - (1)
2008 (1) - - - - - (1)
2009 - - - - - - -
2010 (1) - - - - - (1)
2011 3 - - (3) (3) (100.0%) -
2012 91 (1) 1 (77) (77) (84.6%) 14
2013 113 (1) 1 (59) (59) (52.2%) 54
2014 139 (4) 4 67 67 48.2% 206
2015 224 (27) 31 112 116 51.8% 340
2016 132 32 24 87 143 108.3% 275
Private Passenger Total 700 (1) 61 127 187 26.7% 887
Non Private
Passenger prior (1) - - - - - (1)
2005 - - - - -
2006 - - - - -
2007 - - - - - - -
2008 (2) - - - - - (2)
2009 - - - - - - -
2010 - - - - - - -
2011 3 - - (2) (2) (66.7%) 1
2012 61 (1) 1 (16) (16) (26.2%) 45
2013 53 (1) 1 - - - 53
2014 246 (2) 2 (37) (37) (15.0%) 209
2015 381 (4) 4 14 14 3.7% 395
2016 69 38 (299) 247 (14) (20.3%) 55
Non Private Passenger Total 810 30 (291) 206 (55) (6.8%) 755
Grand Total 1,510 29 (230) 333 132 8.7% 1,642

Actuarial Highlights – Residual Market
Participation Report October 2016
Page 103 of 118
EXHIBIT G-2
Components of IBNR ($s) - Change During Month
(i.e. excludes Actuarial Present Value Adjustments)
page 5 of 10
ShareDate 201610
Jurisdiction Desc Ontario
AccountCode Desc Undiscounted IBNR Provision IBNR - in $000s
AccountCode (All)
Values
BusinessSegment
DescAccYear
Sum of Prior
Month Actual
Amount
Sum of
Projected
Change
Sum of Change
Due to AvsP
Variances
Sum of Change
Due to
Valuation
Implementation
Sum of Total
Change
Sum of % Total
Change
Sum of Current
Month Final
Amount
Private
Passenger prior (702) (6) 21 2,005 2,020 (287.7%) 1,318
2005 - - - - -
2006 - - - - -
2007 1,125 (23) 249 (91) 135 12.0% 1,260
2008 412 (8) 11 65 68 16.5% 480
2009 160 (3) 183 195 375 234.4% 535
2010 167 (3) 58 (118) (63) (37.7%) 104
2011 (109) 2 (54) (76) (128) 117.4% (237)
2012 (342) 7 286 32 325 (95.0%) (17)
2013 288 (6) 99 298 391 135.8% 679
2014 723 (14) (50) 278 214 29.6% 937
2015 1,855 (46) 14 - (32) (1.7%) 1,823
2016 2,375 262 (114) (31) 117 4.9% 2,492
Private Passenger Total 5,952 162 703 2,557 3,422 57.5% 9,374
Non Private
Passenger prior 247 (4) 4 - - - 247
2005 - - - - -
2006 - - - - -
2007 78 (2) 10 - 8 10.3% 86
2008 124 (2) 2 (60) (60) (48.4%) 64
2009 (186) 4 10 359 373 (200.5%) 187
2010 291 (9) 121 (30) 82 28.2% 373
2011 (597) 18 102 1,048 1,168 (195.6%) 571
2012 229 (7) 27 116 136 59.4% 365
2013 2,271 (68) 37 70 39 1.7% 2,310
2014 3,682 (147) (16) 97 (66) (1.8%) 3,616
2015 5,608 (280) (38) - (318) (5.7%) 5,290
2016 6,214 678 (345) 467 800 12.9% 7,014
Non Private Passenger Total 17,961 181 (86) 2,067 2,162 12.0% 20,123
Grand Total 23,913 343 617 4,624 5,584 23.4% 29,497

Actuarial Highlights – Residual Market
Participation Report October 2016
Page 104 of 118
EXHIBIT G-2
Components of IBNR ($s) - Change During Month
(i.e. excludes Actuarial Present Value Adjustments)
page 6 of 10
ShareDate 201610
Jurisdiction Desc Alberta
AccountCode Desc Undiscounted IBNR Provision IBNR - in $000s
AccountCode (All)
Values
BusinessSegment
DescAccYear
Sum of Prior
Month Actual
Amount
Sum of
Projected
Change
Sum of Change
Due to AvsP
Variances
Sum of Change
Due to
Valuation
Implementation
Sum of Total
Change
Sum of % Total
Change
Sum of Current
Month Final
Amount
Private
Passenger prior (162) 4 (4) 90 90 (55.6%) (72)
2005 - - - - -
2006 - - - - -
2007 44 - - (49) (49) (111.4%) (5)
2008 43 - - - - - 43
2009 48 - - - - - 48
2010 194 (2) 2 (34) (34) (17.5%) 160
2011 360 (4) 4 (67) (67) (18.6%) 293
2012 626 (6) (172) (32) (210) (33.5%) 416
2013 1,041 (10) (4) (168) (182) (17.5%) 859
2014 1,611 (24) 7 (85) (102) (6.3%) 1,509
2015 2,256 (34) (4) 38 - - 2,256
2016 2,300 226 (36) (137) 53 2.3% 2,353
Private Passenger Total 8,361 150 (207) (444) (501) (6.0%) 7,860
Non Private
Passenger prior (95) 7 (59) 142 90 (94.7%) (5)
2005 - - - - -
2006 - - - - -
2007 30 (3) 3 - - - 30
2008 (59) 6 (6) 76 76 (128.8%) 17
2009 118 (12) 12 - - - 118
2010 309 (3) (44) (59) (106) (34.3%) 203
2011 443 (4) (57) (168) (229) (51.7%) 214
2012 411 (4) 208 - 204 49.6% 615
2013 872 (9) 75 480 546 62.6% 1,418
2014 2,464 37 (152) 183 68 2.8% 2,532
2015 4,668 93 (380) - (287) (6.1%) 4,381
2016 6,823 (197) 1,199 1,016 2,018 29.6% 8,841
Non Private Passenger Total 15,984 (89) 799 1,670 2,380 14.9% 18,364
Grand Total 24,345 61 592 1,226 1,879 7.7% 26,224
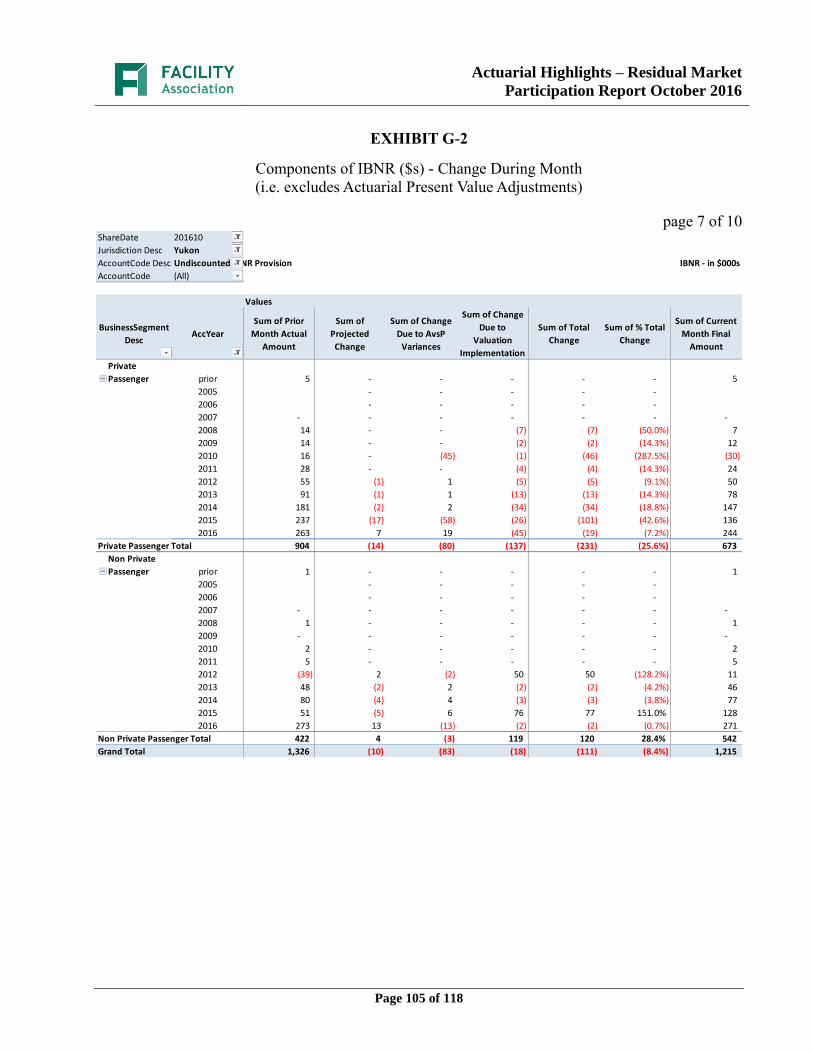
Actuarial Highlights – Residual Market
Participation Report October 2016
Page 105 of 118
EXHIBIT G-2
Components of IBNR ($s) - Change During Month
(i.e. excludes Actuarial Present Value Adjustments)
page 7 of 10
ShareDate 201610
Jurisdiction Desc Yukon
AccountCode Desc Undiscounted IBNR Provision IBNR - in $000s
AccountCode (All)
Values
BusinessSegment
DescAccYear
Sum of Prior
Month Actual
Amount
Sum of
Projected
Change
Sum of Change
Due to AvsP
Variances
Sum of Change
Due to
Valuation
Implementation
Sum of Total
Change
Sum of % Total
Change
Sum of Current
Month Final
Amount
Private
Passenger prior 5 - - - - - 5
2005 - - - - -
2006 - - - - -
2007 - - - - - - -
2008 14 - - (7) (7) (50.0%) 7
2009 14 - - (2) (2) (14.3%) 12
2010 16 - (45) (1) (46) (287.5%) (30)
2011 28 - - (4) (4) (14.3%) 24
2012 55 (1) 1 (5) (5) (9.1%) 50
2013 91 (1) 1 (13) (13) (14.3%) 78
2014 181 (2) 2 (34) (34) (18.8%) 147
2015 237 (17) (58) (26) (101) (42.6%) 136
2016 263 7 19 (45) (19) (7.2%) 244
Private Passenger Total 904 (14) (80) (137) (231) (25.6%) 673
Non Private
Passenger prior 1 - - - - - 1
2005 - - - - -
2006 - - - - -
2007 - - - - - - -
2008 1 - - - - - 1
2009 - - - - - - -
2010 2 - - - - - 2
2011 5 - - - - - 5
2012 (39) 2 (2) 50 50 (128.2%) 11
2013 48 (2) 2 (2) (2) (4.2%) 46
2014 80 (4) 4 (3) (3) (3.8%) 77
2015 51 (5) 6 76 77 151.0% 128
2016 273 13 (13) (2) (2) (0.7%) 271
Non Private Passenger Total 422 4 (3) 119 120 28.4% 542
Grand Total 1,326 (10) (83) (18) (111) (8.4%) 1,215

Actuarial Highlights – Residual Market
Participation Report October 2016
Page 106 of 118
EXHIBIT G-2
Components of IBNR ($s) - Change During Month
(i.e. excludes Actuarial Present Value Adjustments)
page 8 of 10
ShareDate 201610
Jurisdiction Desc
Northwest
Territories
AccountCode Desc Undiscounted IBNR Provision IBNR - in $000s
AccountCode (All)
Values
BusinessSegment
DescAccYear
Sum of Prior
Month Actual
Amount
Sum of
Projected
Change
Sum of Change
Due to AvsP
Variances
Sum of Change
Due to
Valuation
Implementation
Sum of Total
Change
Sum of % Total
Change
Sum of Current
Month Final
Amount
Private
Passenger prior (2) - - - - - (2)
2005 - - - - -
2006 - - - - -
2007 3 - - - - - 3
2008 21 - - (6) (6) (28.6%) 15
2009 (19) - - 28 28 (147.4%) 9
2010 4 - - - - - 4
2011 38 (1) 2 (5) (4) (10.5%) 34
2012 89 (3) 3 (9) (9) (10.1%) 80
2013 27 (1) 1 102 102 377.8% 129
2014 73 (2) 43 150 191 261.6% 264
2015 415 (12) 7 35 30 7.2% 445
2016 524 52 (40) (118) (106) (20.2%) 418
Private Passenger Total 1,173 33 16 177 226 19.3% 1,399
Non Private
Passenger prior 2 - - - - - 2
2005 - - - - -
2006 - - - - -
2007 - - - - - - -
2008 - - - - - - -
2009 - - - - - - -
2010 1 - - - - - 1
2011 - - - - - - -
2012 8 - - (1) (1) (12.5%) 7
2013 28 - - (3) (3) (10.7%) 25
2014 89 (3) 3 (9) (9) (10.1%) 80
2015 197 (12) 22 - 10 5.1% 207
2016 185 25 40 52 117 63.2% 302
Non Private Passenger Total 510 10 65 39 114 22.4% 624
Grand Total 1,683 43 81 216 340 20.2% 2,023

Actuarial Highlights – Residual Market
Participation Report October 2016
Page 107 of 118
EXHIBIT G-2
Components of IBNR ($s) - Change During Month
(i.e. excludes Actuarial Present Value Adjustments)
page 9 of 10
ShareDate 201610
Jurisdiction Desc Nunavut
AccountCode Desc Undiscounted IBNR Provision IBNR - in $000s
AccountCode (All)
Values
BusinessSegment
DescAccYear
Sum of Prior
Month Actual
Amount
Sum of
Projected
Change
Sum of Change
Due to AvsP
Variances
Sum of Change
Due to
Valuation
Implementation
Sum of Total
Change
Sum of % Total
Change
Sum of Current
Month Final
Amount
Private
Passenger prior (2) - - - - - (2)
2005 - - - - -
2006 - - - - -
2007 1 - - (1) (1) (100.0%) -
2008 1 - - - - - 1
2009 - - - - - - -
2010 5 - - - - - 5
2011 13 - - (1) (1) (7.7%) 12
2012 20 - - (1) (1) (5.0%) 19
2013 31 - - (6) (6) (19.4%) 25
2014 49 - - (3) (3) (6.1%) 46
2015 180 (7) 7 - - - 180
2016 48 9 16 23 48 100.0% 96
Private Passenger Total 346 2 23 11 36 10.4% 382
Non Private
Passenger prior - - - - - - -
2005 - - - - -
2006 - - - - -
2007 - - - - - - -
2008 - - - - - - -
2009 - - - - - - -
2010 - - - - - - -
2011 - - - - - - -
2012 6 - - - - - 6
2013 21 - - (3) (3) (14.3%) 18
2014 42 - - (5) (5) (11.9%) 37
2015 164 (2) 2 2 2 1.2% 166
2016 162 27 (8) (11) 8 4.9% 170
Non Private Passenger Total 395 25 (6) (17) 2 0.5% 397
Grand Total 741 27 17 (6) 38 5.1% 779
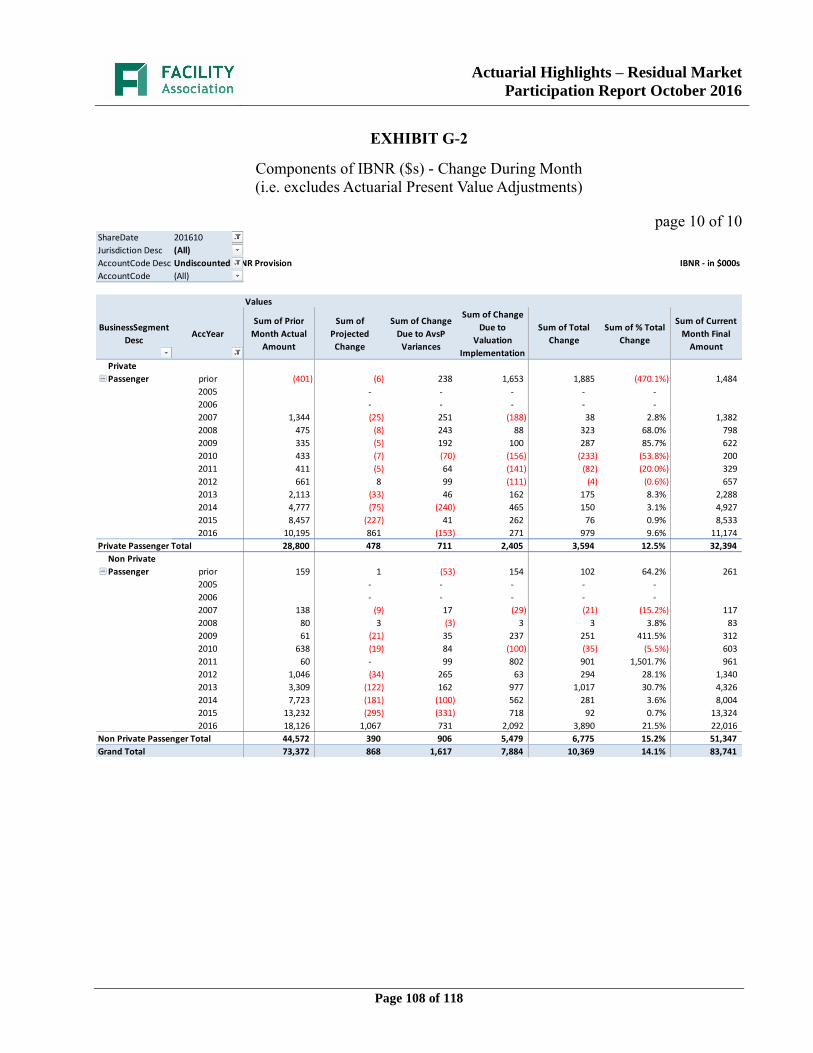
Actuarial Highlights – Residual Market
Participation Report October 2016
Page 108 of 118
EXHIBIT G-2
Components of IBNR ($s) - Change During Month
(i.e. excludes Actuarial Present Value Adjustments)
page 10 of 10
ShareDate 201610
Jurisdiction Desc (All)
AccountCode Desc Undiscounted IBNR Provision IBNR - in $000s
AccountCode (All)
Values
BusinessSegment
DescAccYear
Sum of Prior
Month Actual
Amount
Sum of
Projected
Change
Sum of Change
Due to AvsP
Variances
Sum of Change
Due to
Valuation
Implementation
Sum of Total
Change
Sum of % Total
Change
Sum of Current
Month Final
Amount
Private
Passenger prior (401) (6) 238 1,653 1,885 (470.1%) 1,484
2005 - - - - -
2006 - - - - -
2007 1,344 (25) 251 (188) 38 2.8% 1,382
2008 475 (8) 243 88 323 68.0% 798
2009 335 (5) 192 100 287 85.7% 622
2010 433 (7) (70) (156) (233) (53.8%) 200
2011 411 (5) 64 (141) (82) (20.0%) 329
2012 661 8 99 (111) (4) (0.6%) 657
2013 2,113 (33) 46 162 175 8.3% 2,288
2014 4,777 (75) (240) 465 150 3.1% 4,927
2015 8,457 (227) 41 262 76 0.9% 8,533
2016 10,195 861 (153) 271 979 9.6% 11,174
Private Passenger Total 28,800 478 711 2,405 3,594 12.5% 32,394
Non Private
Passenger prior 159 1 (53) 154 102 64.2% 261
2005 - - - - -
2006 - - - - -
2007 138 (9) 17 (29) (21) (15.2%) 117
2008 80 3 (3) 3 3 3.8% 83
2009 61 (21) 35 237 251 411.5% 312
2010 638 (19) 84 (100) (35) (5.5%) 603
2011 60 - 99 802 901 1,501.7% 961
2012 1,046 (34) 265 63 294 28.1% 1,340
2013 3,309 (122) 162 977 1,017 30.7% 4,326
2014 7,723 (181) (100) 562 281 3.6% 8,004
2015 13,232 (295) (331) 718 92 0.7% 13,324
2016 18,126 1,067 731 2,092 3,890 21.5% 22,016
Non Private Passenger Total 44,572 390 906 5,479 6,775 15.2% 51,347
Grand Total 73,372 868 1,617 7,884 10,369 14.1% 83,741
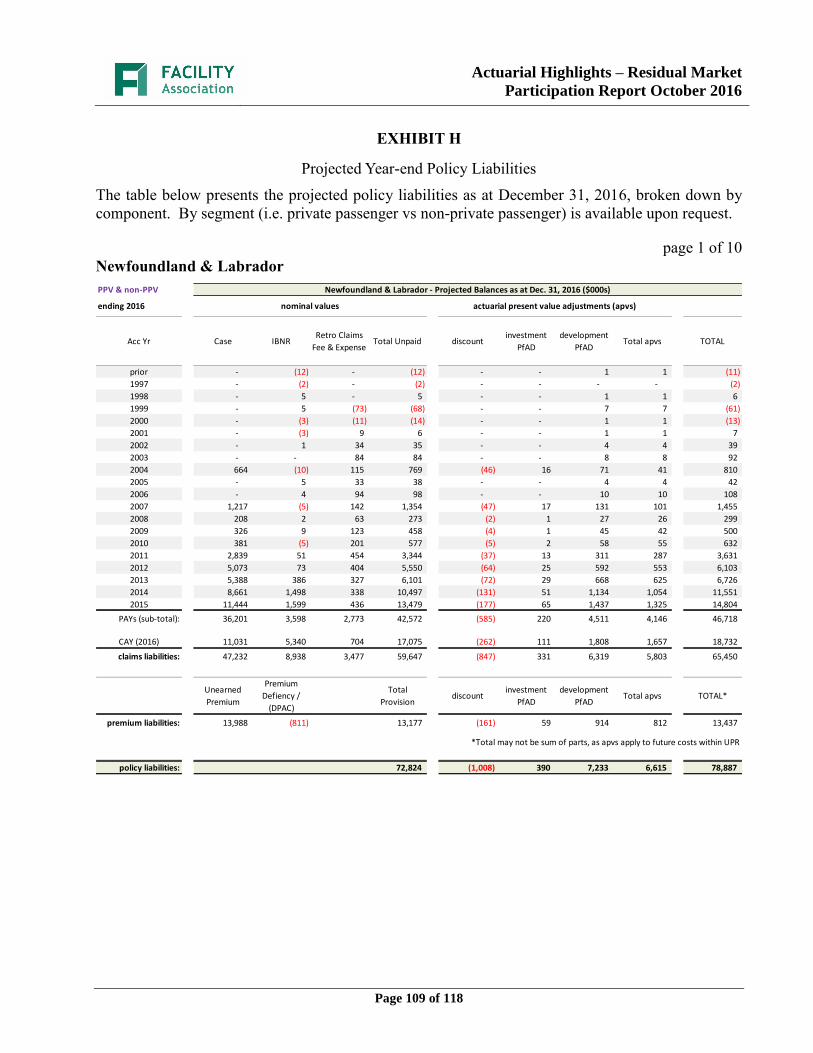
Actuarial Highlights – Residual Market
Participation Report October 2016
Page 109 of 118
EXHIBIT H
Projected Year-end Policy Liabilities
The table below presents the projected policy liabilities as at December 31, 2016, broken down by
component. By segment (i.e. private passenger vs non-private passenger) is available upon request.
page 1 of 10
Newfoundland & Labrador
PPV & non-PPV Newfoundland & Labrador - Projected Balances as at Dec. 31, 2016 ($000s)
ending 2016 nominal values actuarial present value adjustments (apvs)
Acc Yr Case IBNRRetro Claims
Fee & ExpenseTotal Unpaid discount
investment
PfAD
development
PfADTotal apvs TOTAL
prior - (12) - (12) - - 1 1 (11)
1997 - (2) - (2) - - - - (2)
1998 - 5 - 5 - - 1 1 6
1999 - 5 (73) (68) - - 7 7 (61)
2000 - (3) (11) (14) - - 1 1 (13)
2001 - (3) 9 6 - - 1 1 7
2002 - 1 34 35 - - 4 4 39
2003 - - 84 84 - - 8 8 92
2004 664 (10) 115 769 (46) 16 71 41 810
2005 - 5 33 38 - - 4 4 42
2006 - 4 94 98 - - 10 10 108
2007 1,217 (5) 142 1,354 (47) 17 131 101 1,455
2008 208 2 63 273 (2) 1 27 26 299
2009 326 9 123 458 (4) 1 45 42 500
2010 381 (5) 201 577 (5) 2 58 55 632
2011 2,839 51 454 3,344 (37) 13 311 287 3,631
2012 5,073 73 404 5,550 (64) 25 592 553 6,103
2013 5,388 386 327 6,101 (72) 29 668 625 6,726
2014 8,661 1,498 338 10,497 (131) 51 1,134 1,054 11,551
2015 11,444 1,599 436 13,479 (177) 65 1,437 1,325 14,804
PAYs (sub-total): 36,201 3,598 2,773 42,572 (585) 220 4,511 4,146 46,718
CAY (2016) 11,031 5,340 704 17,075 (262) 111 1,808 1,657 18,732
claims liabilities: 47,232 8,938 3,477 59,647 (847) 331 6,319 5,803 65,450
Unearned
Premium
Premium
Defiency /
(DPAC)
Total
Provisiondiscount
investment
PfAD
development
PfADTotal apvs TOTAL*
premium liabilities: 13,988 (811) 13,177 (161) 59 914 812 13,437
*Total may not be sum of parts, as apvs apply to future costs within UPR
policy liabilities: 72,824 (1,008) 390 7,233 6,615 78,887

Actuarial Highlights – Residual Market
Participation Report October 2016
Page 110 of 118
EXHIBIT H
Projected Year-end Policy Liabilities
The table below presents the projected policy liabilities as at December 31, 2016, broken down by
component. By segment (i.e. private passenger vs non-private passenger) is available upon request.
page 2 of 10
New Brunswick
PPV & non-PPV New Brunswick - Projected Balances as at Dec. 31, 2016 ($000s)
ending 2016 nominal values actuarial present value adjustments (apvs)
Acc Yr Case IBNRRetro Claims
Fee & ExpenseTotal Unpaid discount
investment
PfAD
development
PfADTotal apvs TOTAL
prior - 10 1 11 - - 2 2 13
1997 - (2) 5 3 - - - - 3
1998 - 2 4 6 - - - - 6
1999 - 1 5 6 - - - - 6
2000 - 1 4 5 - - - - 5
2001 - (1) 15 14 - - 2 2 16
2002 - - 59 59 - - 8 8 67
2003 228 (15) (10) 203 (1) - 23 22 225
2004 - 8 (48) (40) - - 6 6 (34)
2005 280 (74) (137) 69 (3) 3 34 34 103
2006 197 13 123 333 (9) 2 32 25 358
2007 - 17 226 243 (2) - 24 22 265
2008 600 6 246 852 (20) 5 84 69 921
2009 411 45 272 728 (15) 3 73 61 789
2010 415 114 213 742 (11) 3 71 63 805
2011 1,978 266 410 2,654 (30) 12 252 234 2,888
2012 2,582 224 496 3,302 (36) 11 337 312 3,614
2013 5,146 422 388 5,956 (72) 25 631 584 6,540
2014 4,272 1,011 423 5,706 (75) 28 727 680 6,386
2015 4,353 2,142 407 6,902 (111) 41 852 782 7,684
PAYs (sub-total): 20,462 4,190 3,102 27,754 (385) 133 3,158 2,906 30,660
CAY (2016) 4,339 2,487 120 6,946 (136) 57 892 813 7,759
claims liabilities: 24,801 6,677 3,222 34,700 (521) 190 4,050 3,719 38,419
Unearned
Premium
Premium
Defiency /
(DPAC)
Total
Provisiondiscount
investment
PfAD
development
PfADTotal apvs TOTAL*
premium liabilities: 9,907 (947) 8,960 (86) 32 537 483 8,960
*Total may not be sum of parts, as apvs apply to future costs within UPR
policy liabilities: 43,660 (607) 222 4,587 4,202 47,379

Actuarial Highlights – Residual Market
Participation Report October 2016
Page 111 of 118
EXHIBIT H
Projected Year-end Policy Liabilities
The table below presents the projected policy liabilities as at December 31, 2016, broken down by
component. By segment (i.e. private passenger vs non-private passenger) is available upon request.
page 3 of 10
Nova Scotia
PPV & non-PPV Nova Scotia - Projected Balances as at Dec. 31, 2016 ($000s)
ending 2016 nominal values actuarial present value adjustments (apvs)
Acc Yr Case IBNRRetro Claims
Fee & ExpenseTotal Unpaid discount
investment
PfAD
development
PfADTotal apvs TOTAL
prior - 3 (38) (35) - - 10 10 (25)
1997 - - (14) (14) - - 1 1 (13)
1998 - 6 4 10 - - - - 10
1999 - (1) 3 2 - - - - 2
2000 - 1 6 7 - - - - 7
2001 - 4 15 19 - - 1 1 20
2002 - 14 1 15 - - 1 1 16
2003 - (21) 65 44 - - 9 9 53
2004 - 204 137 341 (12) 3 33 24 365
2005 94 (14) 16 96 (4) 1 9 6 102
2006 289 116 390 795 (29) 6 78 55 850
2007 211 110 327 648 (20) 4 64 48 696
2008 252 238 471 961 (24) 5 93 74 1,035
2009 902 (30) 372 1,244 (14) 4 125 115 1,359
2010 1,120 (127) 249 1,242 (24) 7 122 105 1,347
2011 1,438 37 290 1,765 (47) 16 168 137 1,902
2012 1,441 70 286 1,797 (33) 12 173 152 1,949
2013 3,491 66 279 3,836 (66) 25 477 436 4,272
2014 3,382 558 198 4,138 (76) 29 516 469 4,607
2015 2,661 1,812 257 4,730 (88) 34 594 540 5,270
PAYs (sub-total): 15,281 3,046 3,314 21,641 (437) 146 2,474 2,183 23,824
CAY (2016) 3,234 3,634 172 7,040 (136) 54 869 787 7,827
claims liabilities: 18,515 6,680 3,486 28,681 (573) 200 3,343 2,970 31,651
Unearned
Premium
Premium
Defiency /
(DPAC)
Total
Provisiondiscount
investment
PfAD
development
PfADTotal apvs TOTAL*
premium liabilities: 8,559 (755) 7,804 (86) 30 521 465 7,804
*Total may not be sum of parts, as apvs apply to future costs within UPR
policy liabilities: 36,485 (659) 230 3,864 3,435 39,455
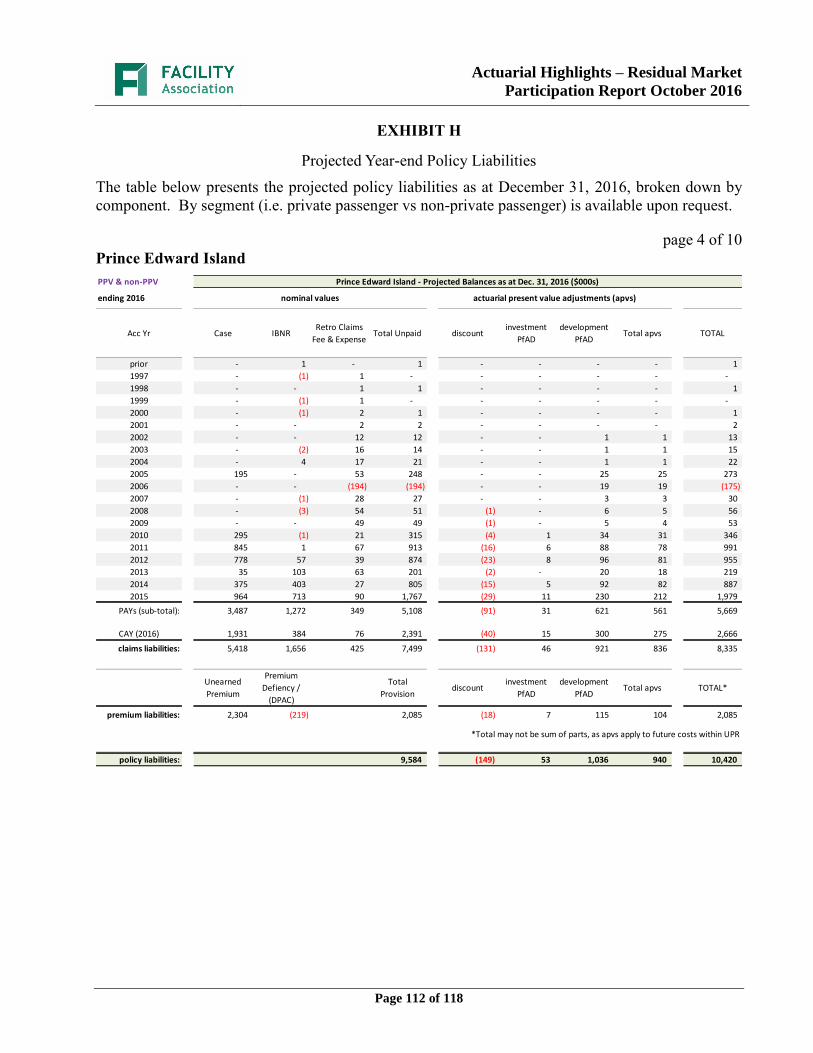
Actuarial Highlights – Residual Market
Participation Report October 2016
Page 112 of 118
EXHIBIT H
Projected Year-end Policy Liabilities
The table below presents the projected policy liabilities as at December 31, 2016, broken down by
component. By segment (i.e. private passenger vs non-private passenger) is available upon request.
page 4 of 10
Prince Edward Island
PPV & non-PPV Prince Edward Island - Projected Balances as at Dec. 31, 2016 ($000s)
ending 2016 nominal values actuarial present value adjustments (apvs)
Acc Yr Case IBNRRetro Claims
Fee & ExpenseTotal Unpaid discount
investment
PfAD
development
PfADTotal apvs TOTAL
prior - 1 - 1 - - - - 1
1997 - (1) 1 - - - - - -
1998 - - 1 1 - - - - 1
1999 - (1) 1 - - - - - -
2000 - (1) 2 1 - - - - 1
2001 - - 2 2 - - - - 2
2002 - - 12 12 - - 1 1 13
2003 - (2) 16 14 - - 1 1 15
2004 - 4 17 21 - - 1 1 22
2005 195 - 53 248 - - 25 25 273
2006 - - (194) (194) - - 19 19 (175)
2007 - (1) 28 27 - - 3 3 30
2008 - (3) 54 51 (1) - 6 5 56
2009 - - 49 49 (1) - 5 4 53
2010 295 (1) 21 315 (4) 1 34 31 346
2011 845 1 67 913 (16) 6 88 78 991
2012 778 57 39 874 (23) 8 96 81 955
2013 35 103 63 201 (2) - 20 18 219
2014 375 403 27 805 (15) 5 92 82 887
2015 964 713 90 1,767 (29) 11 230 212 1,979
PAYs (sub-total): 3,487 1,272 349 5,108 (91) 31 621 561 5,669
CAY (2016) 1,931 384 76 2,391 (40) 15 300 275 2,666
claims liabilities: 5,418 1,656 425 7,499 (131) 46 921 836 8,335
Unearned
Premium
Premium
Defiency /
(DPAC)
Total
Provisiondiscount
investment
PfAD
development
PfADTotal apvs TOTAL*
premium liabilities: 2,304 (219) 2,085 (18) 7 115 104 2,085
*Total may not be sum of parts, as apvs apply to future costs within UPR
policy liabilities: 9,584 (149) 53 1,036 940 10,420
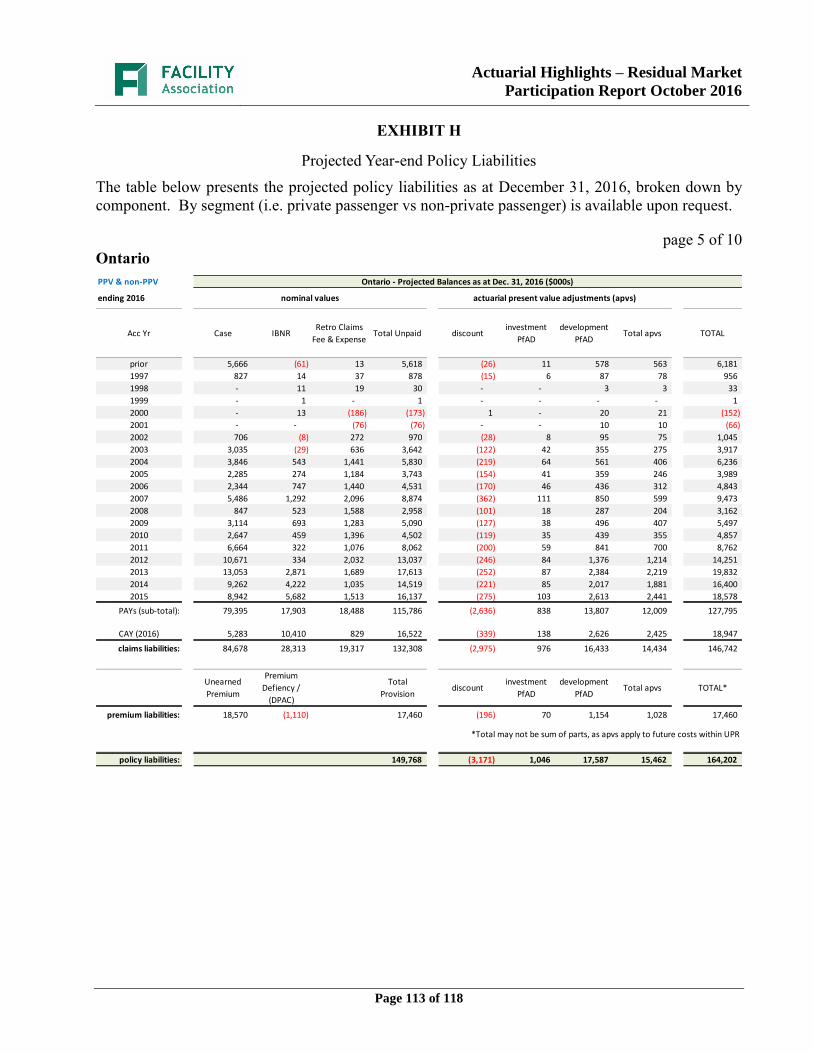
Actuarial Highlights – Residual Market
Participation Report October 2016
Page 113 of 118
EXHIBIT H
Projected Year-end Policy Liabilities
The table below presents the projected policy liabilities as at December 31, 2016, broken down by
component. By segment (i.e. private passenger vs non-private passenger) is available upon request.
page 5 of 10
Ontario
PPV & non-PPV Ontario - Projected Balances as at Dec. 31, 2016 ($000s)
ending 2016 nominal values actuarial present value adjustments (apvs)
Acc Yr Case IBNRRetro Claims
Fee & ExpenseTotal Unpaid discount
investment
PfAD
development
PfADTotal apvs TOTAL
prior 5,666 (61) 13 5,618 (26) 11 578 563 6,181
1997 827 14 37 878 (15) 6 87 78 956
1998 - 11 19 30 - - 3 3 33
1999 - 1 - 1 - - - - 1
2000 - 13 (186) (173) 1 - 20 21 (152)
2001 - - (76) (76) - - 10 10 (66)
2002 706 (8) 272 970 (28) 8 95 75 1,045
2003 3,035 (29) 636 3,642 (122) 42 355 275 3,917
2004 3,846 543 1,441 5,830 (219) 64 561 406 6,236
2005 2,285 274 1,184 3,743 (154) 41 359 246 3,989
2006 2,344 747 1,440 4,531 (170) 46 436 312 4,843
2007 5,486 1,292 2,096 8,874 (362) 111 850 599 9,473
2008 847 523 1,588 2,958 (101) 18 287 204 3,162
2009 3,114 693 1,283 5,090 (127) 38 496 407 5,497
2010 2,647 459 1,396 4,502 (119) 35 439 355 4,857
2011 6,664 322 1,076 8,062 (200) 59 841 700 8,762
2012 10,671 334 2,032 13,037 (246) 84 1,376 1,214 14,251
2013 13,053 2,871 1,689 17,613 (252) 87 2,384 2,219 19,832
2014 9,262 4,222 1,035 14,519 (221) 85 2,017 1,881 16,400
2015 8,942 5,682 1,513 16,137 (275) 103 2,613 2,441 18,578
PAYs (sub-total): 79,395 17,903 18,488 115,786 (2,636) 838 13,807 12,009 127,795
CAY (2016) 5,283 10,410 829 16,522 (339) 138 2,626 2,425 18,947
claims liabilities: 84,678 28,313 19,317 132,308 (2,975) 976 16,433 14,434 146,742
Unearned
Premium
Premium
Defiency /
(DPAC)
Total
Provisiondiscount
investment
PfAD
development
PfADTotal apvs TOTAL*
premium liabilities: 18,570 (1,110) 17,460 (196) 70 1,154 1,028 17,460
*Total may not be sum of parts, as apvs apply to future costs within UPR
policy liabilities: 149,768 (3,171) 1,046 17,587 15,462 164,202

Actuarial Highlights – Residual Market
Participation Report October 2016
Page 114 of 118
EXHIBIT H
Projected Year-end Policy Liabilities
The table below presents the projected policy liabilities as at December 31, 2016, broken down by
component. By segment (i.e. private passenger vs non-private passenger) is available upon request.
page 6 of 10
Alberta
PPV & non-PPV Alberta - Projected Balances as at Dec. 31, 2016 ($000s)
ending 2016 nominal values actuarial present value adjustments (apvs)
Acc Yr Case IBNRRetro Claims
Fee & ExpenseTotal Unpaid discount
investment
PfAD
development
PfADTotal apvs TOTAL
prior - 42 5 47 - - 13 13 60
1997 - (38) 15 (23) - - 5 5 (18)
1998 - 14 (3) 11 - - 1 1 12
1999 - 11 13 24 - - 2 2 26
2000 - (16) 21 5 - - 4 4 9
2001 - 24 29 53 - - 5 5 58
2002 - (12) 55 43 - - 7 7 50
2003 72 (13) 89 148 (5) 1 15 11 159
2004 290 (80) 38 248 (9) 3 25 19 267
2005 420 (9) (154) 257 (11) 7 55 51 308
2006 231 6 148 385 (16) 4 38 26 411
2007 772 23 423 1,218 (39) 10 120 91 1,309
2008 1,377 60 536 1,973 (47) 14 194 161 2,134
2009 153 162 454 769 (11) 2 77 68 837
2010 2,051 353 354 2,758 (37) 14 273 250 3,008
2011 5,662 497 418 6,577 (93) 35 649 591 7,168
2012 5,180 1,003 475 6,658 (93) 37 655 599 7,257
2013 8,812 2,213 493 11,518 (184) 75 1,133 1,024 12,542
2014 8,535 3,924 495 12,954 (229) 91 1,588 1,450 14,404
2015 11,666 6,484 474 18,624 (366) 149 2,447 2,230 20,854
PAYs (sub-total): 45,221 14,648 4,378 64,247 (1,140) 442 7,306 6,608 70,855
CAY (2016) 10,479 11,490 (103) 21,866 (385) 146 2,640 2,401 24,267
claims liabilities: 55,700 26,138 4,275 86,113 (1,525) 588 9,946 9,009 95,122
Unearned
Premium
Premium
Defiency /
(DPAC)
Total
Provisiondiscount
investment
PfAD
development
PfADTotal apvs TOTAL*
premium liabilities: 27,714 (2,403) 25,311 (217) 84 1,371 1,238 25,311
*Total may not be sum of parts, as apvs apply to future costs within UPR
policy liabilities: 111,424 (1,742) 672 11,317 10,247 120,433
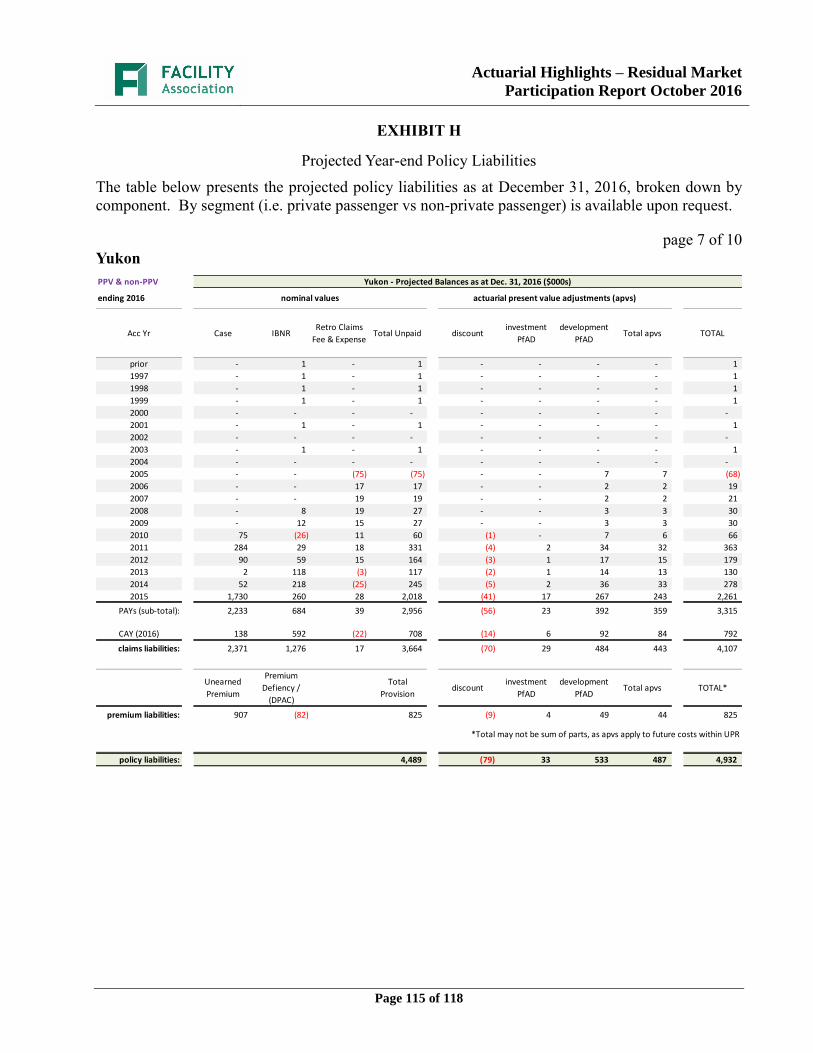
Actuarial Highlights – Residual Market
Participation Report October 2016
Page 115 of 118
EXHIBIT H
Projected Year-end Policy Liabilities
The table below presents the projected policy liabilities as at December 31, 2016, broken down by
component. By segment (i.e. private passenger vs non-private passenger) is available upon request.
page 7 of 10
Yukon
PPV & non-PPV Yukon - Projected Balances as at Dec. 31, 2016 ($000s)
ending 2016 nominal values actuarial present value adjustments (apvs)
Acc Yr Case IBNRRetro Claims
Fee & ExpenseTotal Unpaid discount
investment
PfAD
development
PfADTotal apvs TOTAL
prior - 1 - 1 - - - - 1
1997 - 1 - 1 - - - - 1
1998 - 1 - 1 - - - - 1
1999 - 1 - 1 - - - - 1
2000 - - - - - - - - -
2001 - 1 - 1 - - - - 1
2002 - - - - - - - - -
2003 - 1 - 1 - - - - 1
2004 - - - - - - - - -
2005 - - (75) (75) - - 7 7 (68)
2006 - - 17 17 - - 2 2 19
2007 - - 19 19 - - 2 2 21
2008 - 8 19 27 - - 3 3 30
2009 - 12 15 27 - - 3 3 30
2010 75 (26) 11 60 (1) - 7 6 66
2011 284 29 18 331 (4) 2 34 32 363
2012 90 59 15 164 (3) 1 17 15 179
2013 2 118 (3) 117 (2) 1 14 13 130
2014 52 218 (25) 245 (5) 2 36 33 278
2015 1,730 260 28 2,018 (41) 17 267 243 2,261
PAYs (sub-total): 2,233 684 39 2,956 (56) 23 392 359 3,315
CAY (2016) 138 592 (22) 708 (14) 6 92 84 792
claims liabilities: 2,371 1,276 17 3,664 (70) 29 484 443 4,107
Unearned
Premium
Premium
Defiency /
(DPAC)
Total
Provisiondiscount
investment
PfAD
development
PfADTotal apvs TOTAL*
premium liabilities: 907 (82) 825 (9) 4 49 44 825
*Total may not be sum of parts, as apvs apply to future costs within UPR
policy liabilities: 4,489 (79) 33 533 487 4,932

Actuarial Highlights – Residual Market
Participation Report October 2016
Page 116 of 118
EXHIBIT H
Projected Year-end Policy Liabilities
The table below presents the projected policy liabilities as at December 31, 2016, broken down by
component. By segment (i.e. private passenger vs non-private passenger) is available upon request.
page 8 of 10
Northwest Territories
PPV & non-PPV Northwest Territories - Projected Balances as at Dec. 31, 2016 ($000s)
ending 2016 nominal values actuarial present value adjustments (apvs)
Acc Yr Case IBNRRetro Claims
Fee & ExpenseTotal Unpaid discount
investment
PfAD
development
PfADTotal apvs TOTAL
prior - (1) - (1) - - - - (1)
1997 - 1 - 1 - - - - 1
1998 - 1 - 1 - - - - 1
1999 - 2 - 2 - - - - 2
2000 - (1) - (1) - - - - (1)
2001 - 1 - 1 - - - - 1
2002 - 1 - 1 - - - - 1
2003 - - - - - - - - -
2004 - (2) - (2) - - - - (2)
2005 - - 17 17 - - 1 1 18
2006 - (2) 19 17 - - 2 2 19
2007 - 3 31 34 (1) - 3 2 36
2008 - 15 44 59 (1) - 6 5 64
2009 149 9 40 198 (2) 1 20 19 217
2010 - 5 32 37 - - 3 3 40
2011 91 32 36 159 (1) 1 16 16 175
2012 109 83 38 230 (3) 1 23 21 251
2013 713 147 43 903 (13) 5 99 91 994
2014 1,815 336 31 2,182 (39) 15 293 269 2,451
2015 1,061 640 121 1,822 (37) 15 221 199 2,021
PAYs (sub-total): 3,938 1,270 452 5,660 (97) 38 687 628 6,288
CAY (2016) 359 841 (105) 1,095 (23) 10 146 133 1,228
claims liabilities: 4,297 2,111 347 6,755 (120) 48 833 761 7,516
Unearned
Premium
Premium
Defiency /
(DPAC)
Total
Provisiondiscount
investment
PfAD
development
PfADTotal apvs TOTAL*
premium liabilities: 1,793 (182) 1,611 (10) 4 70 64 1,611
*Total may not be sum of parts, as apvs apply to future costs within UPR
policy liabilities: 8,366 (130) 52 903 825 9,127
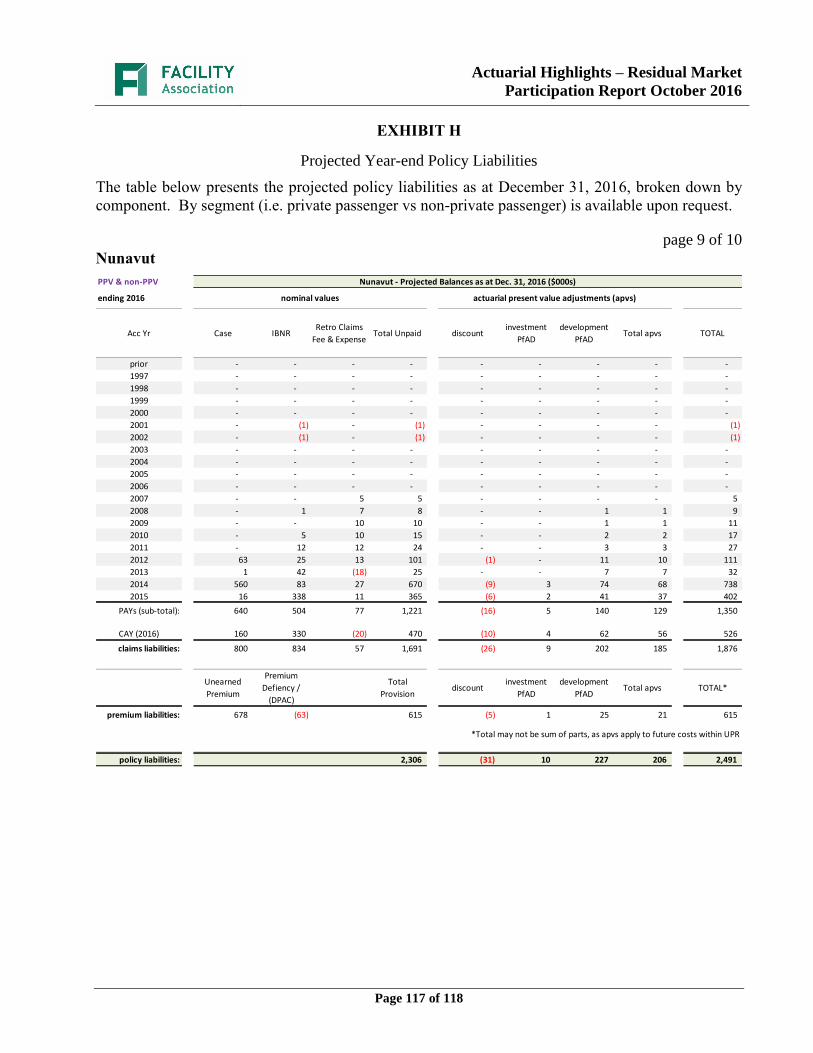
Actuarial Highlights – Residual Market
Participation Report October 2016
Page 117 of 118
EXHIBIT H
Projected Year-end Policy Liabilities
The table below presents the projected policy liabilities as at December 31, 2016, broken down by
component. By segment (i.e. private passenger vs non-private passenger) is available upon request.
page 9 of 10
Nunavut
PPV & non-PPV Nunavut - Projected Balances as at Dec. 31, 2016 ($000s)
ending 2016 nominal values actuarial present value adjustments (apvs)
Acc Yr Case IBNRRetro Claims
Fee & ExpenseTotal Unpaid discount
investment
PfAD
development
PfADTotal apvs TOTAL
prior - - - - - - - - -
1997 - - - - - - - - -
1998 - - - - - - - - -
1999 - - - - - - - - -
2000 - - - - - - - - -
2001 - (1) - (1) - - - - (1)
2002 - (1) - (1) - - - - (1)
2003 - - - - - - - - -
2004 - - - - - - - - -
2005 - - - - - - - - -
2006 - - - - - - - - -
2007 - - 5 5 - - - - 5
2008 - 1 7 8 - - 1 1 9
2009 - - 10 10 - - 1 1 11
2010 - 5 10 15 - - 2 2 17
2011 - 12 12 24 - - 3 3 27
2012 63 25 13 101 (1) - 11 10 111
2013 1 42 (18) 25 - - 7 7 32
2014 560 83 27 670 (9) 3 74 68 738
2015 16 338 11 365 (6) 2 41 37 402
PAYs (sub-total): 640 504 77 1,221 (16) 5 140 129 1,350
CAY (2016) 160 330 (20) 470 (10) 4 62 56 526
claims liabilities: 800 834 57 1,691 (26) 9 202 185 1,876
Unearned
Premium
Premium
Defiency /
(DPAC)
Total
Provisiondiscount
investment
PfAD
development
PfADTotal apvs TOTAL*
premium liabilities: 678 (63) 615 (5) 1 25 21 615
*Total may not be sum of parts, as apvs apply to future costs within UPR
policy liabilities: 2,306 (31) 10 227 206 2,491
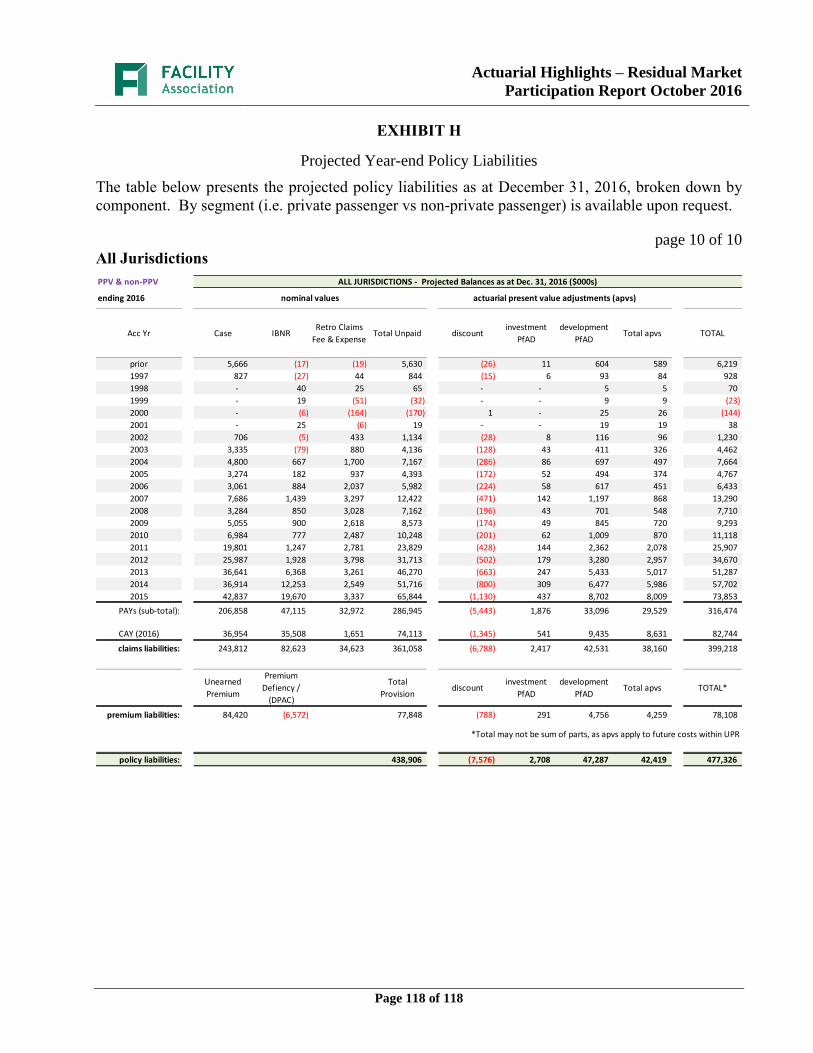
Actuarial Highlights – Residual Market
Participation Report October 2016
Page 118 of 118
EXHIBIT H
Projected Year-end Policy Liabilities
The table below presents the projected policy liabilities as at December 31, 2016, broken down by
component. By segment (i.e. private passenger vs non-private passenger) is available upon request.
page 10 of 10
All Jurisdictions
PPV & non-PPV ALL JURISDICTIONS - Projected Balances as at Dec. 31, 2016 ($000s)
ending 2016 nominal values actuarial present value adjustments (apvs)
Acc Yr Case IBNRRetro Claims
Fee & ExpenseTotal Unpaid discount
investment
PfAD
development
PfADTotal apvs TOTAL
prior 5,666 (17) (19) 5,630 (26) 11 604 589 6,219
1997 827 (27) 44 844 (15) 6 93 84 928
1998 - 40 25 65 - - 5 5 70
1999 - 19 (51) (32) - - 9 9 (23)
2000 - (6) (164) (170) 1 - 25 26 (144)
2001 - 25 (6) 19 - - 19 19 38
2002 706 (5) 433 1,134 (28) 8 116 96 1,230
2003 3,335 (79) 880 4,136 (128) 43 411 326 4,462
2004 4,800 667 1,700 7,167 (286) 86 697 497 7,664
2005 3,274 182 937 4,393 (172) 52 494 374 4,767
2006 3,061 884 2,037 5,982 (224) 58 617 451 6,433
2007 7,686 1,439 3,297 12,422 (471) 142 1,197 868 13,290
2008 3,284 850 3,028 7,162 (196) 43 701 548 7,710
2009 5,055 900 2,618 8,573 (174) 49 845 720 9,293
2010 6,984 777 2,487 10,248 (201) 62 1,009 870 11,118
2011 19,801 1,247 2,781 23,829 (428) 144 2,362 2,078 25,907
2012 25,987 1,928 3,798 31,713 (502) 179 3,280 2,957 34,670
2013 36,641 6,368 3,261 46,270 (663) 247 5,433 5,017 51,287
2014 36,914 12,253 2,549 51,716 (800) 309 6,477 5,986 57,702
2015 42,837 19,670 3,337 65,844 (1,130) 437 8,702 8,009 73,853
PAYs (sub-total): 206,858 47,115 32,972 286,945 (5,443) 1,876 33,096 29,529 316,474
CAY (2016) 36,954 35,508 1,651 74,113 (1,345) 541 9,435 8,631 82,744
claims liabilities: 243,812 82,623 34,623 361,058 (6,788) 2,417 42,531 38,160 399,218
Unearned
Premium
Premium
Defiency /
(DPAC)
Total
Provisiondiscount
investment
PfAD
development
PfADTotal apvs TOTAL*
premium liabilities: 84,420 (6,572) 77,848 (788) 291 4,756 4,259 78,108
*Total may not be sum of parts, as apvs apply to future costs within UPR
policy liabilities: 438,906 (7,576) 2,708 47,287 42,419 477,326


