Facilities Mapping and Management With...
53
Facilities Mapping & Management with GIS at the Shenandoah & Frederick Divisions of Washington Gas Timothy S. Miller Engineering Section Leader 10.12.04
Transcript of Facilities Mapping and Management With...

Facilities Mapping & Management with GISat the Shenandoah & Frederick Divisions of Washington Gas
Timothy S. MillerEngineering Section Leader
10.12.04

Who is Washington Gas?

Who is Washington Gas?
Service territory is centered around the Nation’s capital.
! 13 Counties & The District of Columbia
! 1,000,000 customers
! 1,800 employees
! 11,211 miles of main
! 11,200 miles of service
! SmallWorld GIS

Who is Washington Gas?
Service territory is located in the northern Shenandoah Valley.
! 4 Counties
! 15,000 customers
! 33 employees
! 359 miles of main
! 173 miles of service
! ArcView 3.3 GIS

Who is Washington Gas?
Service territory is located in Northern Maryland.
! 1 County
! 25,000 customers
! 36 employees
! 437 miles of main
! 314 miles of service
! ArcView 3.3 GIS (migrated from SG)
How did our GIS begin?
In the beginning………How did you find
me?
I had the right
software!

What data did we have?
“Vintage” System (@ SG):!System maps consisted of 219
mylar tax maps and inserts
! 1,900 Mains drawings! Approximately 1,300 hand-drawn & 600
AutoCAD DWGs
! Drawing index system on 3x5 cards! Based on Streets and Intersecting Streets
! 11,000 Service work orders! Include a service sketch on back of work
order

What did we want?
“A seamless, computer-based mapping system with the
functionality to trace a pipeline to the nearest shutoff valve(s) and print a list of affected customers.”

How did we begin?
Initial project (1994):
! Contracted GeoSQL Corporation
! AutoCAD & Oracle-based GIS solution
! $30,000 contract:! $10,000 for Basemapping,
Transmission Pipes & Appurtenances
! $10,000 for Software
! $10,000 for Custom Programming Interface

How did we begin?
Why GeoSQL failed:! The software never functioned as
demonstrated and promised for the budgeted amount.
! What we gained:! Basemapping (USGS Quad-based
planimetrics – 18 Quads)
! Digitized Transmission Facilities (Pipes, Valves, Insulators, Blowoffs, Gate Stations, etc.)
! What we learned:! Don’t expect “the world”
! “Sequential implementation”

How did we continue?
Next project phase (1997):! Re-focused our effort
! Determined to begin the major task of digitizing all of our mains facilities
! MapInfo selected since previous experience with the software! Purchased 5 licenses
! Software worked well!
! Converted mains, appurtenances & USGS basemapping to MapInfo format
! Contracted support services (programming) @ hourly rate

How did we continue?
Why MapInfo didn’t work for us:! Business geographics software
! Not as “technical” ! Coordinate conversion issues (raster
registration)
! No tracing functionality
! AutoCAD DWG files had to be converted to MapInfo TAB files
! Consultant’s programmer quit
! Replacement consultant didn’t deliver as represented
! Made an offer that ESRI didn’t refuse

How did we continue?
What we gained:! Purchased E-size color scanner
! Scanned 219 mylar tax maps in color
! Obtained digital tax mapping from municipalities! Replaced original USGS base
! Still USGS-rectified
! Began heads-up digitizing of mains – populated size, material, pressure designation, length

How did we continue?
What we gained:
Scanned Mylar Tax Map Digital Tax Map

What was the software solution?
Next project phase (1998 - present):
! One-for-one trade with ESRI for each MapInfo license
! Contracted Anderson & Associates to help in the conversion
! First week:! Converted data
! Trained on new software
! Created a “laundry list” of customization items

What was our land base?
A Potpourri:! Frederick County / Winchester:
! Compiled previously obtained data from County E911 data (ArcInfo)
! Included tax parcels & addresses
! Clarke County:! Obtained data from ArcInfo GIS system
! Included digital ortho photos, tax parcels, street centerlines, & building footprints
! Shenandoah County:! No digital County data – Contracted Anderson to digitize a tax map base
! Included tax parcels
! Warren County:! No digital County data – Also included in Anderson contract
How is the land base organized?
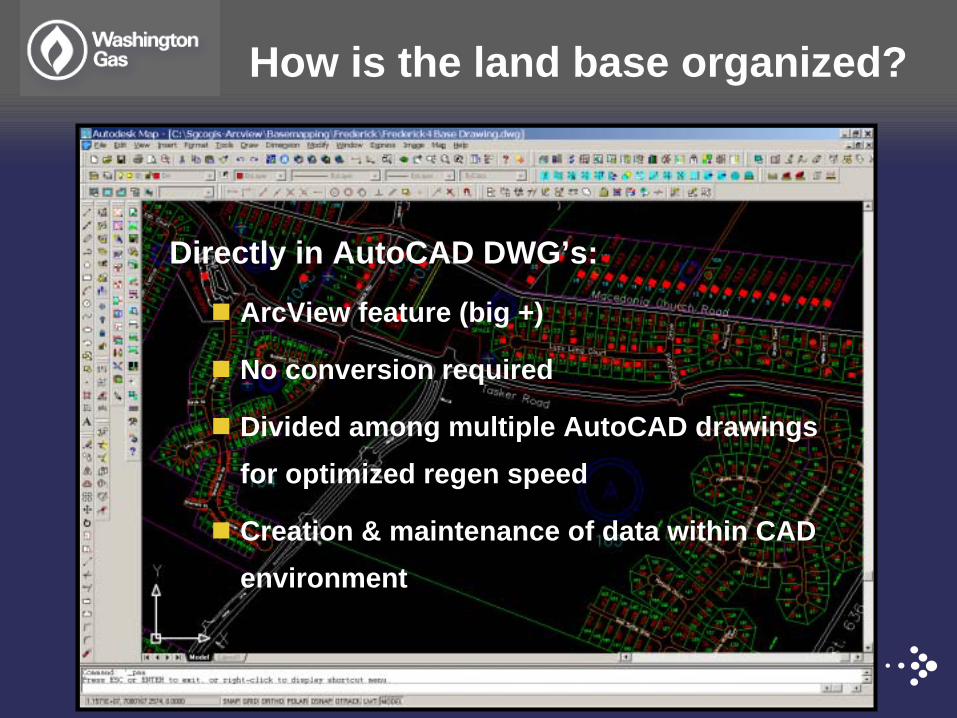
Directly in AutoCAD DWG’s:
! ArcView feature (big +)
! No conversion required
! Divided among multiple AutoCAD drawings for optimized regen speed
! Creation & maintenance of data within CAD environment
What is our system premise?
Since our land base is not “survey” accurate, our pipelines & appurtenances are a digital index to record drawings.
! Only map mains and appurtenances
! Primary emphasis that pipes are drawn on the correct side of the street
! No dimensions to facilities are mapped
! “Relative” accuracy
! Drill-down to record drawings

How does it work?

How does it work?

How does it work?

How does it work?
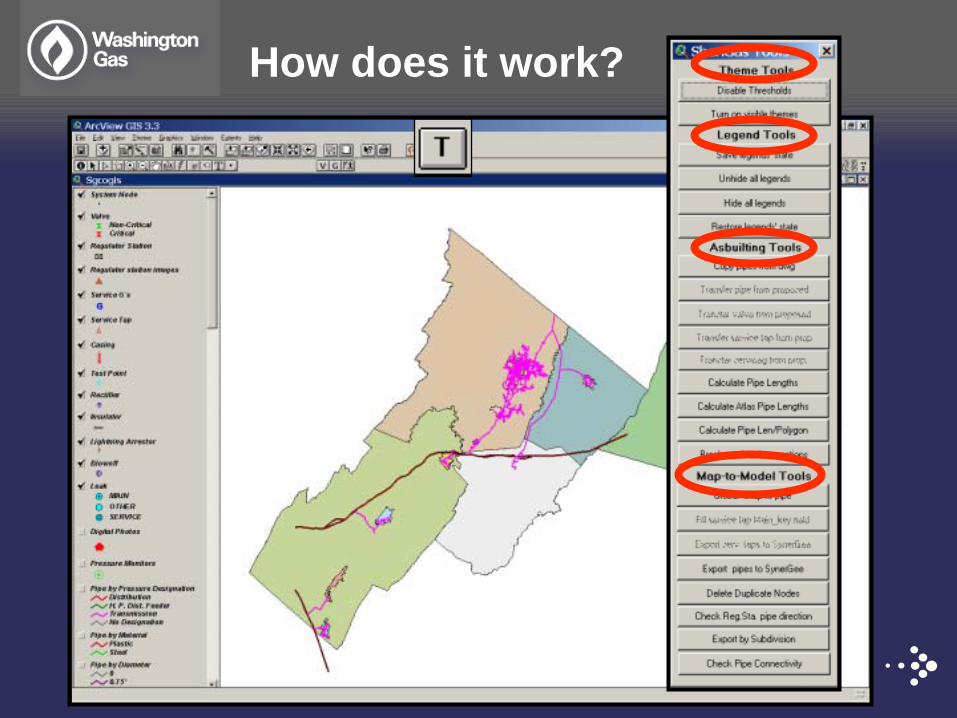
How does it work?
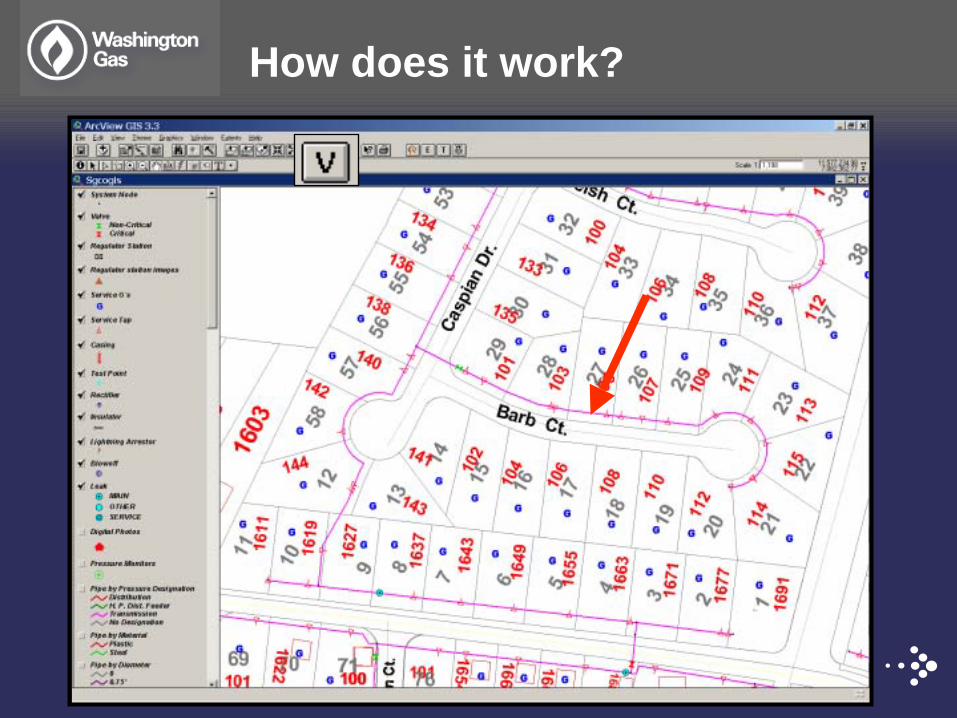
How does it work?

How does it work?

How does it work?

How does it work?

How does it work?

How does it work?

What are the applications?
Mapping @ Frederick

What are the applications?
Maintaining Leak Data

What are the applications?
Viewing Leak Work Orders

What are the applications?
Pipeline Trace

What are the applications?

What are the applications?

What are the applications?
Critical Valves

What are the applications?
Leak Survey Areas

What are the applications?
Miss Utility Grid Selection
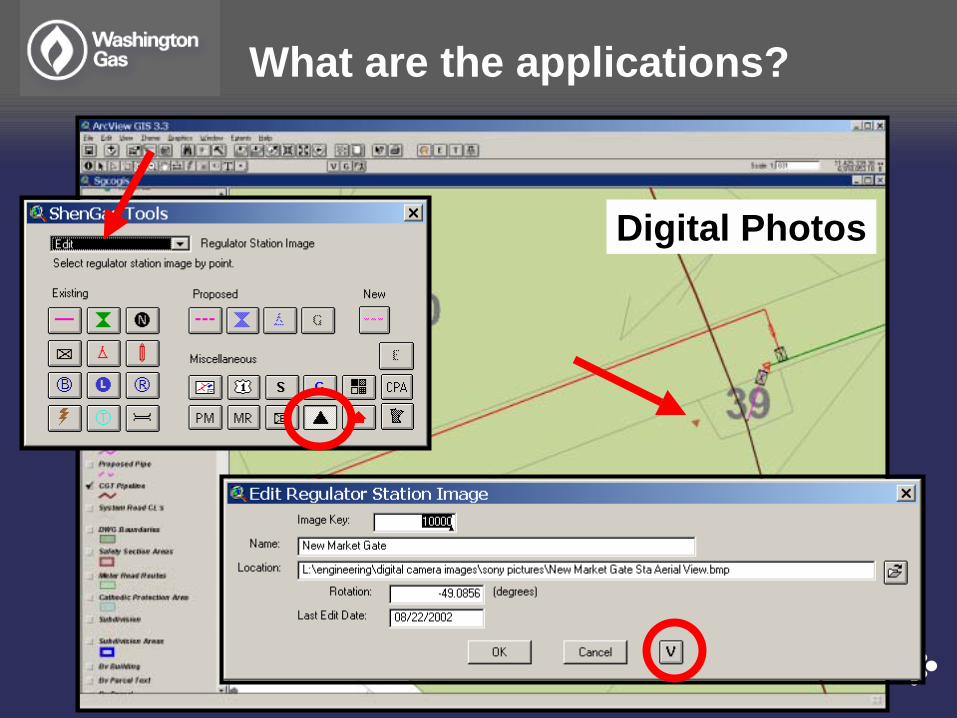
What are the applications?
Digital Photos

What are the applications?
Gate Station Photo

What are the applications?
Hydraulic Analysis

What are the applications?
Hydraulic Analysis

What are the applications?
Printed System Atlas

Dispatch2 Desktops
On-Call Personnel(Laptops from each section)
Who uses our system?
Marketing2 Laptops
Construction4 Laptops
Pressure &
Measurement1 Laptop
Contract Locator4 Laptops
Engineering“Keepers of the Data”
5 Desktops & 2 Laptops

How much has it cost?
! Original contract ……………………………………$30,000
! Obtaining basemapping from others ………….. $12,000
! Digitizing facilities & populating data ………... $124,000
! Software ………………………………....………….. $35,000
! Consulting …………………………………………... $29,000
! Custom programming ………………………….…. $57,000
! TOTAL ………………………………………………. $287,000
! THE BENEFITS …...……………………………… PRICELESS!
! Example: Pulling records each day using mapping has saved an estimated $15,000 per year.
From 1994 to the present:

Where do we go from here?

! A uniform repository of geographical data
! More accurate data entry and editing
! More intuitive data objects
! Features with richer context
! Better maps
! Dynamic map display features
! Better defined shapes of features
! Feature sets are continuous
! Multiple users can edit data simultaneously
What are the benefits?

What are some challenges?
Spatial discrepancy within Shenandoah data. Continue with index premise or rubbersheet entities?

What are some challenges?
No spatial discrepancy within Frederick facilities,but no digital tax map entities.

What are some challenges?
Digitize raster tax maps and rubbersheet to orthos?

What are some challenges?
! Remain a non-Smallworld shop
! Beginning a 3-year conversion project – what $ and time requirements?! Migrating existing systems into the ArcGIS solution
! Ensuring existing custom functionality migrates
! Maintaining user-friendliness and deployment within new system
! Internet mapping?
! GPS functionality?
! PDA applications?

What is your experience?
If you have made the conversion from ArcView 3.3 to ArcGIS 9,
I need to talk to you.
Thank you!

For more information, or a copy of this presentation, contactTimothy S. [email protected] or 301-644-2320
© 2004 WGL Holdings, Inc.