Facilities Inventory System Report 2016 - Washington. Facilities Inventory System Report. RCW...
25
2017 Facilities Inventory System Report RCW 43.82.150 Office of Financial Management State Facilities Oversight Program November 2017
Transcript of Facilities Inventory System Report 2016 - Washington. Facilities Inventory System Report. RCW...

2017 Facilities Inventory System Report RCW 43.82.150
Office of Financial Management State Facilities Oversight Program November 2017

To accommodate persons with disabilities, this document is available in alternate formats by calling the Office of Financial Management at 360-902-3063. TTY/TDD users should contact OFM via the
Washington Relay Service at 711 or 1-800-833-6388.
Visit our website at www.ofm.wa.gov

1
Table of Contents
Overview ............................................................................................................................................ 2
Requirement and purpose ................................................................................................................... 2
2017 facilities inventory results ........................................................................................................... 2
New facilities portfolio management system ....................................................................................... 2
Statewide Facilities Summary .......................................................................................................... 3
Total facility inventory summary .......................................................................................................... 3
Square feet by functional area ............................................................................................................ 3
Square feet by property class ............................................................................................................. 4
Building condition summary ................................................................................................................ 4
Owned square feet change by county .................................................................................................. 6
Leased square feet change by county .................................................................................................. 7
Summary of Owned Facilities in Inventory ..................................................................................... 8
Owned facilities by functional area ...................................................................................................... 8
Top agencies for owned square footage ............................................................................................. 8
Owned space by property classification .............................................................................................. 9
Age of owned facilities ........................................................................................................................ 9
Condition of owned facilities.............................................................................................................. 10
Density of owned facilities (by county) .............................................................................................. 11
Summary of Leased Inventory ....................................................................................................... 12
Leased facilities and contracts by functional area ............................................................................. 12
Top agencies for leased square footage ........................................................................................... 13
Leased contract space by property classification .............................................................................. 13
Occupancy period of leased facilities ................................................................................................ 14
Condition of leased facilities.............................................................................................................. 14
Density of leased facilities (by county) ................................................................................................ 14
2010–17 Facilities Inventory Trend ................................................................................................ 16
Total state facilities by year ............................................................................................................... 16
Total square footage by year ............................................................................................................. 17
Contact Information ........................................................................................................................ 17
Appendix A: Facilities Demographics by Agency ........................................................................ 18
Appendix B: Facilities Demographics by County......................................................................... 21

2
Overview Requirement and purpose The state of Washington owns and leases thousands of facilities that house state agencies. This represents a significant financial investment by the citizens of Washington. To monitor this investment, the Office of Financial Management (OFM) gathers and reports the state’s facilities inventory from state agencies as prescribed in RCW 43.82.150. This document is a summary of the data reported in 2017. A facility is defined as a building or other structure with at least one wall, a roof and a permanent foundation, regardless of occupancy. Facilities in the inventory range from residences and classrooms and office buildings, to grain elevators and node sites -- and more. The state facilities inventory is used to inform the state’s Six-Year Facilities Plan, capital budget decisions, comprehensive emergency management planning and other analyses related to state facilities. 2017 facilities inventory results As of October 2017, 72 state agencies1 and higher education institutions reported 10,542 facilities totaling just over 116.3 million square feet. Approximately 88.2 percent of these facilities are owned by Washington state agencies. The remaining 11.8 percent consist of leased facilities. State facilities are located in every county, with Garfield County having the fewest (21) and King County having the most (1,301). Since 2016, the state’s facilities inventory has increased by over 1.5 million square feet. The change between 2016 and 2017 is largely the result of new construction and improved reporting in higher education. Modest decreases were reported in the human services and natural resources functional areas. The 2017 facilities inventory, including the facility owner, location, type, condition, size of each facility and other pertinent facility data, is available at https://www.ofm.wa.gov/facilities/state-agency-facility-oversight/facilities-inventory.
New facilities portfolio management system Over the past year, OFM worked with state agencies to acquire and successfully deploy a new technology solution to gather and report the state’s facilities inventory. This new system has improved the accuracy of the state’s facilities inventory by providing a stable platform to collect, validate and store data from all reporting state agencies. It also provides greater visibility into how leased facilities and lease contracts relate to one another. As a result, this report now contains clarification of the number of leased facilities and associated lease contracts. More information about this new enterprise wide technology solution is available at https://www.ofm.wa.gov/facilities/state-agency-facility-oversight/facilities-inventory/facilities-portfolio-management-tool-fpmt.
1All state agencies and higher education institutions were contacted to report their 2017 facilities inventory. All agricultural commissions are exempt from reporting per RCW 15.04.200. Most legislative and judicial agencies did not report back to confirm data for their agencies for the 2017 inventory report. This report does not include K-12 school facilities.

3
Statewide Facilities Summary The state of Washington owns, maintains, leases or occupies 10,542 facilities statewide. These facilities represent the state’s physical presence in the communities it serves. State employees, volunteers, contractors and community partners perform a large variety of functions in these facilities such as educating citizens, providing social services, licensing businesses and auditing government operations. Many of the state’s facilities also serve as residences and prison facilities, and support various functions.
Total facility inventory summary In fall 2017, 72 state agencies reported a total of 116,267,925 square feet. Thirty agencies reported 9,422 owned facilities, totaling 102,372,626 square feet. Sixty-eight agencies reported 1,120 leased facilities, totaling 13,647,341 square feet. Based on square footage, 88.2 percent of the state’s facilities inventory is owned and 11.8 percent is leased from the private sector.
Square feet by functional area The chart below depicts the percentage of owned versus leased square footage by functional area. The owned square footage that higher education occupies dwarfs all other functional areas.
0 20,000,000 40,000,000 60,000,000 80,000,000
Higher Education
Human Services
General Government
Natural Resources
Transportation
Education
Square Feet by Functional Area
Leased Owned

4
Square feet by property class The chart below breaks down total square footage by property class for the full inventory. Property class is defined as a broad category of space composed of specific space type such as office- administrative. As with previous reports, the facilities inventory continues to indicate that facility assets are primarily used for educational, general office and health care activities. The inventory indicates leased facilities overwhelmingly are used for office space, with almost 64 percent of the total leased space.
Building condition summary Agencies are asked to rank the general condition of each facility in their respective inventory on a scale of 1-Superior to 5-Emergency Use Only. Condition is assessed on factors such as exterior, interior, lighting, maintenance levels and building system reliability. The following table depicts the condition of all state facilities based on this scale. Agencies generally ranked facility conditions as either “adequate (2)” or “fair (3).” Few leased facilities are categorized as “poor condition-limited (4)” or “emergency use only (5).” A total of 6.1 percent of the current inventory is rated as being for emergency use only due to poor facility condition.
0
4
8
12
16
20
24
28
Millio
ns
Square Feet by Property Class
Leased Owned

5
0
500
1,000
1,500
2,000
2,500
3,000
3,500
4,000
4,500
1 - Superior 2 - Adequate 3 - Fair 4 - Limited 5 - Emergency UseOnly
N/A
Facilities Count by Condition Rating
Leased Owned

6
Owned square feet change by county The inventory of state facilities increased by nine facilities and 1,377,289 square feet from 2016 to 2017. The map below shows the owned square footage change from the past year. Total owned square footage significantly increased in King, Whitman and Benton counties. These increases are primarily the result of new construction and purchases at the University of Washington, Washington State University and Columbia Basin Community College, respectively. Over 200,000 square feet was added to the inventory as the result of improved reporting by agencies. The inventory also had a measurable decrease in Spokane County as the result of the demolition of a large building on the Department of Social and Health Services’ Eastern State Hospital campus.

7
Leased square feet change by county The inventory of state leased facilities increased by approximately 142,627 square feet from 2016 to 2017. Approximately 70 leased facilities were added to the state’s inventory2. The map below illustrates leased square footage change from the past year. The largest increases occurred in Pierce County as a result of a new facility leased from the federal government at Camp Murray.
2 Previous reports counted a leased facility or facilities and its associated leased contract(s) as a record in the inventory. The new facilities portfolio management tool provides more visibility into leased facilities and their associated lease contracts. However, this new methodology of collecting data prevents OFM from providing an exact comparison. More information is provided in the Summary of Leased Facilities in the Inventory.

8
Summary of Owned Facilities in Inventory Thirty agencies reported 9,422 owned facilities totaling 102,372,626 square feet. Based on square footage, the owned inventory represents 88.2 percent of the state’s total facilities inventory. Owned facilities by functional area The table below shows the total owned square feet by functional area. Higher education represented the largest single functional area with 67.4 percent of all state-owned facilities.
Owned Functional Area Breakdown
Functional Area Owned Square Feet Percentage of Inventory Owned Facilities Percentage of
Inventory
Higher Education 69,002,62
67.4 2,885 30.6 Human Services 15,105,92
14.8 1,387 14.7
General Government 7,033,87
6.9 288 3.1 Natural Resources 6,313,48
6.2 3,723 39.5
Transportation 4,175,10
4.0 1,099 11.7 Education-Other 741,600 0.7 40 0.4
Top agencies for owned square footage The top 10 agencies for owned square footage represents roughly 88 percent of the owned inventory. The University of Washington, community and technical college system and Washington State University, respectively, combine for 56.2 percent of the total.
Top Agencies for Owned Square Feet Agency Square Feet Facilities
1. University of Washington 22,877,361 571 2. Community and technical college system 20,529,4
979
3. Washington State University 14,161,6
865 4. Department of Corrections 8,546,45
814
5. Department of Enterprise Services 5,276,95
90 6. Department of Social and Health Services 5,174,45
496
7. Department of Transportation 3,577,19
943 8. Western Washington University 3,469,24
118
9. Central Washington University 3,383,43
191 10. State Parks and Recreation Commission 3,049,63
2,636
9
Owned space by property classification Property classification is organized into 10 categories, which are then further defined in nearly 40 specific space types. The property classification is defined by the primary use of the facility. The chart below depicts the percentage of facilities by property classification. Close to 50 percent of owned facilities are used for higher education classrooms, general offices and correctional facilities.
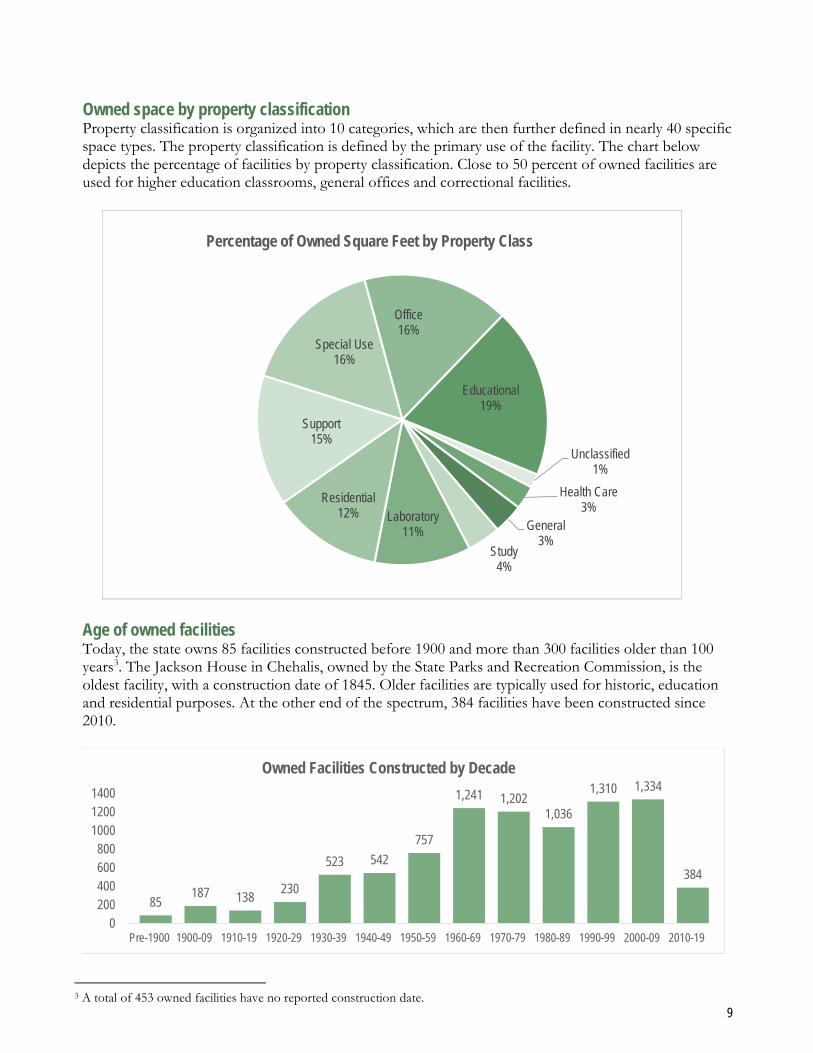
Age of owned facilities Today, the state owns 85 facilities constructed before 1900 and more than 300 facilities older than 100 years3. The Jackson House in Chehalis, owned by the State Parks and Recreation Commission, is the oldest facility, with a construction date of 1845. Older facilities are typically used for historic, education and residential purposes. At the other end of the spectrum, 384 facilities have been constructed since 2010.
3 A total of 453 owned facilities have no reported construction date.
Unclassified1%
Health Care3%
General3%
Study4%
Laboratory11%
Residential12%
Support15%
Special Use16%
Office16%
Educational19%
Percentage of Owned Square Feet by Property Class
85187 138 230
523 542757
1,241 1,2021,036
1,310 1,334
384
0200400600800
100012001400
Pre-1900 1900-09 1910-19 1920-29 1930-39 1940-49 1950-59 1960-69 1970-79 1980-89 1990-99 2000-09 2010-19
Owned Facilities Constructed by Decade

10
Condition of owned facilities Agencies were asked to rank the condition of their facilities on a scale of “1-Superior” to “5-Emergency Use Only.” Condition is assessed based on factors such as exterior, interior, lighting, maintenance levels and building system reliability. The table below shows the condition of owned facilities based on this scale, which is a high-level snapshot. A more thorough approach to condition assessment is needed for more robust information.
Owned Facility Condition Breakdown
Facility Condition Rating Number of Facilities
Percentage of Inventory
1 Superior - High level of satisfaction with facility; maintenance emergencies rare
778
8.3
2 Adequate - Satisfaction with facility; usual maintenance takes about a week to complete; occasional maintenance emergencies
3,384
35.9
3 Fair - Basic level of service, lack of pride in physical exterior; maintenance takes up to one month to complete; high number of emergencies
3,307
35.1
4 Limited Functionality - Low level of service; negative experiences in functionality and responsiveness; maintenance takes up to one
1,096
11.6
5 Emergency Use Only - Services not available unless emergency; consistent customer complaints; mistrust of facility services, reactive
543
5.8
N/A Not Assessed - Agency has not assessed facility or did not report 314 3.3

11
Density of owned facilities (by county) All 39 counties have state-owned facilities, ranging from 18 in Pend Oreille County to 1,122 in King County. King, Pierce and Thurston counties have a combined 2,418 facilities, or 25.7 percent of the owned inventory. In Eastern Washington, Spokane and Whitman counties have a total of 1,138 facilities, or 12.1 percent of the owned inventory. The map below depicts the distribution of owned facilities by county.

12
Summary of Leased Inventory Sixty-eight agencies reported 1,120 leased facilities totaling 13,647,341 square feet. Based on square footage, the leased inventory represents 11.8 percent of the state’s total facilities inventory. The state’s new facilities portfolio management tool allows OFM to gather and report more accurate lease contract data. State agencies reported 1,075 lease contracts for these leased facilities, with a total obligation of roughly $329 million a year. A total of 98 facilities have more than one lease contract. While most leases are for just one leased facility, the relationship between lease contracts and leased facilities varies. For instance:
One leased facility has 15 lease contracts with multiple state agencies occupying the same facility.
Several Washington State Parks are leased with one lease contract for 15 or more facilities. For example, this could be a single contract that covers restrooms, storage sheds, cottages and administrative offices in multiple locations/facilities.
Leased facilities and contracts by functional area The table below depicts the total leased square feet by functional area. Human services represented the largest single functional area, with 299 leases totaling 4,762,930 square feet, or 34.3 percent of all leased facility space.
Leased Square Footage by Functional Area
Functional Area Leased Square Feet
Percentage of Inventory
Leased Facilities
Percentage of Inventory
Lease Contracts
Percentage of Inventory
Human services 4,762,930 34.9
246 21.9 299 27.8 General Government 3,979,112 29.2
240 21.4 241 22.4
Higher education 3,313,850
24.3
227 20.2
277 25.8 Transportation 758,252 5.5 94 8.4 99 9.2
Natural resources 750,290 5.5
337 30.1 141 13.1 Education-Other 82,907 0.6 15 1.3 18 1.7
Leased facilities are counted multiple times when used across multiple functional areas.

13
Top agencies for leased square footage The table below shows the top 10 agencies with the most leased square footage. The Department of Social and Health Services accounts for 19.9 percent of the total leased inventory.
Top Agencies for Leased Square Feet Agency Square Feet Leases
1. Department of Social and Health Services 2,763,311 135
2. University of Washington 1,792,853 157
3. Military Department 1,443,270 120
4. Community and technical college system 1,143,706 70
5. Office of the Attorney General 467,904 17
6. Department of Corrections 462,214 65
7. Department of Health 434,547 12
8. Employment Security Department 420,070 37
9. Consolidated Technology Services (WaTech) 389,785 4
10. Department of Licensing 363,883 56 Leased contract space by property classification Property classification is organized into nine categories, which are then further defined in nearly 40 space types. The property classification is defined by the primary use of the facility. The chart below depicts the percentage of facilities by property classification. The inventory shows that leased facilities are used primarily for office space.
Office64%
Support9%
Special Use9%
Laboratory8%
Educational8%
Residential2%
Health Care.5%
Study.4%
General.1%
Percentage of LeasedSquare Feet by Space Type

14
Occupancy period of leased facilities Agencies were asked to provide the known date when they first started leasing from their current location. A total of 130 facilities have a known occupancy of more than 40 years. Most of these facilities are used by State Parks and Recreation Commission and the Military Department. The occupancy year was not reported for 277 facilities.
Condition of leased facilities Agencies were asked to rank the condition of their facilities on a scale of “1-Superior” to “5-Emergency Services Only.” Condition is assessed on factors such as exterior, interior, lighting, maintenance levels and building system reliability. The table below shows the condition of state leased facilities based on this scale. A more thorough approach to condition assessment is needed for more robust information.
Leased Facility Condition Breakdown
Facility Condition Rating
Number of Facilities
4
Percentage of Inventory
1 Superior - High level of satisfaction with facility; maintenance emergencies
rare 122 9.5
2 Adequate - Satisfaction with facility; usual maintenance takes about a week to complete; occasional maintenance emergencies 577 44.8
3 Fair - Basic level of service, lack of pride in physical exterior; maintenance
takes up to one month to complete; high number of emergencies 222 17.2
4 Limited Functionality - Low level of service; negative experiences in functionality and responsiveness; maintenance takes up to one year to complete 55 4.3
5 Emergency Services Only - Services not available unless emergency; consistent customer complaints; mistrust of facility services, reactive maintenance is the norm 4 0.3
N/A Not Assessed - Agency has not assessed facility or did not report 307 23.9 Density of leased facilities (by county)
4 The total number of facilities in this table exceeds the total number of leased facilities because the facility condition is provided by each state agency in a collocated facility.
312281
182
105
23
107
0-10 Years 11-20 Years 21-30 Years 31-40 Years 41-50 Years 50+ Years
Facil
ities
Occupancy Period of Leased Facilities

15
Thirty-six counties have leased facilities. Two counties have more than 100 leased facilities: King has 179 and Thurston has 129. Garfield, Lincoln and Wahkiakum counties have no leased facilities. The map below depicts the distribution of leased facilities by county.

16
2010–17 Facilities Inventory Trend Since 2010, OFM has prepared a summary report of the owned and leased facilities inventory. This information equips the state of Washington to better strategize for efficiency and cost savings related to facilities. OFM has prepared a trend summary to demonstrate how the state has reported owned and leased facilities over the past eight years, shown below.
Total state facilities by year The eight-year trend shows the total number of state facilities reported has increased since 2010 by approximately 212 reported facilities, or more than 2.1 percent.
9,033 9,054 8,933 8,802 9,237 9,395 9,413 9,422
1,297 1,295 1,254 1,2761,309 1,293 1,286 1,120
0
2,000
4,000
6,000
8,000
10,000
12,000
2 0 1 0 2 0 1 1 2 0 1 2 2 0 1 3 2 0 1 4 2 0 1 5 2 0 1 6 2 0 1 7
Total Reported Facilities
Owned Leased

17
Total square footage by year The eight-year trend demonstrates that the total square footage has increased on the owned side by nearly 8,590,000 square feet. This is a combination of new construction and the identification of facilities previously underreported. The trend shows that the total square footage has decreased on the leased side by approximately 435,000 square feet.
Contact Information For questions about the data collection process, instructions or results, or to provide feedback, please contact these OFM staff members:
Laurie Wood Facilities and GIS Data Analyst [email protected] 360-902-0461
Amy McMahan Facilities Oversight Program Manager [email protected] 360-902-9824
93,783 93,947 95,202 96,866 98,364 100,780 100,995 102,373
14,082 14,297 13,359 13,262 13,514 13,714 13,505 13,647
2 0 1 0 2 0 1 1 2 0 1 2 2 0 1 3 2 0 1 4 2 0 1 5 2 0 1 6 2 0 1 7
Thou
sand
s
Total Reported Square Feet
Owned Leased

18 | P a g e
Appendix A: Facilities Demographics by Agency The following chart is a summary by agency of the total facilities and total square footage (by leased and owned facilities) for all types of facilities. The chart is sorted by the agency percentage of total state inventory based on the total square footage.
Agency Name Number of
Owned Facilities
Number of Leased
Facilities
Total Number of Facilities
Total Owned Square Feet
Total Leased Square Feet
Total Square Feet
Percentage of Total
Inventory
Change in Square Feet from 2016
University of Washington 571 113 684 22,877,361 2,040,811 24,918,172 21.4
Community and technical college system 979 70 1,049 20,529,467 1,143,706 21,673,173 18.6
Washington State University 865 23 888 14,161,653 154,982 14,316,635 12.3
Department of Corrections 814 62 876 8,546,450 462,214 9,008,664 7.7
Department of Social and Health Services 496 116 612 5,174,450 2,763,311 7,937,761 6.8
Department of Enterprise Services 90 5 95 5,276,950 332,660 5,609,610 4.8
Department of Transportation 943 17 960 3,577,197 222,405 3,799,602 3.3
Western Washington University 118 7 125 3,469,240 32,372 3,501,612 3.0
Central Washington University 191 7 198 3,383,430 46,009 3,429,439 2.9
State Parks and Recreation Commission 2,636 221 2,857 3,049,632 230,000 3,279,632 2.8
Military Department 193 124 317 1,579,905 1,443,270 3,023,175 2.6
Eastern Washington University 88 7 95 2,906,902 69,177 2,976,079 2.6
The Evergreen State College 72 1 73 1,630,157 7,318 1,637,475 1.4
Department of Fish and Wildlife 806 40 846 1,449,749 153,514 1,603,263 1.4
Department of Natural Resources 261 16 277 1,406,293 51,355 1,457,648 1.3
Department of Labor and Industries 4 20 24 415,454 324,871 740,325 0.6
Washington State Patrol 153 18 171 577,275 149,931 727,206 0.6
Department of Veterans Affairs 60 2 62 614,107 27,402 641,509 0.6
Department of Ecology 9 23 32 394,867 163,718 558,585 0.5
Department of Health 2 10 12 81,753 434,547 516,300 0.4
Employment Security Department 2 36 38 93,550 420,070 513,620 0.4
Office of the Attorney General 0 16 16 0 467,904 467,904 0.4

19 | P a g e
Agency Name Number of
Owned Facilities
Number of Leased
Facilities
Total Number of Facilities
Total Owned Square Feet
Total Leased Square Feet
Total Square Feet
Percentage of Total
Inventory
Change in Square Feet from 2016
Consolidated Technology Services (WaTech) 0 4 4 0 389,785 389,785 0.3
Department of Licensing 3 56 59 20,637 363,883 384,520 0.3
Department of Revenue 0 17 17 0 319,559 319,559 0.3
Department of Commerce 0 6 6 0 296,098 296,098 0.3
Office of the Secretary of State 5 3 8 177,022 85,570 262,592 0.2
Washington State Center for Childhood Deafness and Hearing Loss 17 0 17 249,453 0 249,453 0.2
Health Care Authority 0 4 4 0 225,607 225,607 0.2
Washington State Historical Society 4 0 4 181,460 0 181,460 0.2
Washington State Criminal Justice Training Commission 9 1 10 180,162 270 180,432 0.2
State School for the Blind 14 0 14 166,600 0 166,600 0.1
Department of Agriculture 11 36 47 12,944 134,650 147,594 0.1
Eastern Washington Historical Society 5 0 5 144,087 0 144,087 0.1
State Board for Community and Technical Colleges 1 1 2 44,419 39,757 84,176 0.1
Liquor and Cannabis Board 0 11 11 0 80,790 80,790 0.1
Board of Industrial Insurance Appeals 0 9 9 0 78,759 78,759 0.1
Office of the State Auditor 0 13 13 0 66,146 66,146 0.1
Department of Retirement Systems 0 2 2 0 62,691 62,691 0.1
Office of the Insurance Commissioner 0 4 4 0 60,661 60,661 0.1
State Lottery Commission 0 7 7 0 57,894 57,894 0.0
Department of Early Learning 0 7 7 0 57,851 57,851 0.0
Utilities and Transportation Commission 0 2 2 0 53,234 53,234 0.0
Washington State Gambling Commission 0 5 5 0 50,519 50,519 0.0
Department of Financial Institutions 0 2 2 0 49,245 49,245 0.0
Office of Administrative Hearings 0 4 4 0 41,420 41,420 0.0
State Investment Board 0 3 3 0 34,774 34,774 0.0
Student Achievement Council 0 2 2 0 27,676 27,676 0.0

20 | P a g e
Agency Name Number of
Owned Facilities
Number of Leased
Facilities
Total Number of Facilities
Total Owned Square Feet
Total Leased Square Feet
Total Square Feet
Percentage of Total
Inventory
Change in Square Feet from 2016
Washington State Housing Finance Commission 0 1 1 0 26,014 26,014 0.0
Office of Financial Management 0 2 2 0 21,776 21,776 0.0
Department of Services for the Blind 0 7 7 0 16,843 16,843 0.0
Public Employment Relations Commission 0 2 2 0 11,730 11,730 0.0
Superintendent of Public Instruction 0 7 7 0 10,917 10,917 0.0
Human Rights Commission 0 2 2 0 9,036 9,036 0.0
Puget Sound Partnership 0 1 1 0 8,500 8,500 0.0
Workforce Training and Education Coordinating Board 0 1 1 0 8,168 8,168 0.0
Washington State Traffic Safety Commission 0 1 1 0 8,113 8,113 0.0
Public Disclosure Commission 0 1 1 0 7,682 7,682 0.0
County Road Administration Board 0 1 1 0 7,349 7,349 0.0
Washington State Arts Commission 0 1 1 0 5,971 5,971 0.0
Environmental and Land Use Hearings Office 0 1 1 0 5,653 5,653 0.0
Transportation Improvement Board 0 1 1 0 4,632 4,632 0.0
Board of Tax Appeals 0 1 1 0 4,427 4,427 0.0
State Board of Accountancy 0 1 1 0 4,129 4,129 0.0
Columbia River Gorge Commission 0 1 1 0 2,900 2,900 0.0
Washington Health Care Facilities Authority 0 1 1 0 2,780 2,780 0.0
Office of the Governor 0 3 3 0 2,561 2,561 0.0
Washington Horse Racing Commission 0 1 1 0 2,093 2,093 0.0
Law Enforcement Officers' and Fire Fighters' Plan 2 Retirement Board 0 1 1 0 1,998 1,998 0.0
Transportation Commission 0 1 1 0 1,939 1,939 0.0
Board for Volunteer Firefighters and Reserve Officers 0 1 1 0 1,402 1,402 0.0
Washington State Commission on Hispanic Affairs 0 1 1 0 300 300 0.0

21 | P a g e
Appendix B: Facilities Demographics by County The following chart is a summary, by county, of the total facilities and total square footage (by leased and own facilities) for all types of facilities, sorted by county name.
County Owned Facilities
Leased Facilities
Total Facilities
Owned Square Feet
Leased Square Feet
Total Square Feet Largest Agency by Square Feet
Adams 64 1 65 89,395 923 90,318 Washington State University
Asotin 90 6 96 176,430 27,354 203,784 Department of Fish and Wildlife
Benton 159 24 183 884,098 195,450 1,079,548 Washington State University
Chelan 192 37 229 833,877 82,438 916,315 Community and technical college system
Clallam 183 10 193 915,217 64,205 979,422 Department of Corrections
Clark 229 21 250 2,262,368 288,014 2,550,382 Community and technical college system
Columbia 75 1 76 59,868 1,800 61,668 State Parks and Recreation Commission
Cowlitz 128 17 145 760,374 137,407 897,781 Community and technical college system
Douglas 42 47 89 52,939 81,891 134,830 State Parks and Recreation Commission
Ferry 32 3 35 48,431 8,677 57,108 Department of Transportation
Franklin 161 32 193 1,554,697 63,129 1,617,826 Department of Corrections
Garfield 21 0 21 27,003 0 27,003 Washington State University
Grant 252 40 292 750,893 98,225 849,118 Community and technical college system
Grays Harbor 224 11 235 1,309,329 64,721 1,374,050 Department of Corrections
Island 270 5 275 391,354 23,067 414,421 State Parks and Recreation Commission
Jefferson 394 5 399 1,371,204 20,999 1,392,203 State Parks and Recreation Commission
King 1,122 179 1,301 30,975,531 3,646,199 34,621,730 University of Washington
Kitsap 269 27 296 1,318,675 84,058 1,402,733 Community and technical college system
Kittitas 348 11 359 3,655,355 49,947 3,705,302 Central Washington University
Klickitat 110 25 135 155,619 32,977 188,596 State Parks and Recreation Commission
Lewis 163 33 196 878,187 79,839 958,026 Community and technical college system

22 | P a g e
County Owned Facilities
Leased Facilities
Total Facilities
Owned Square Feet
Leased Square Feet
Total Square Feet Largest Agency by Square Feet
Lincoln 58 0 58 82,825 0 82,825 Department of Transportation
Mason 244 6 250 1,009,494 37,250 1,046,744 Department of Corrections
Okanogan 180 44 224 258,877 66,684 325,561 Department of Fish and Wildlife
Pacific 233 5 238 439,435 25,656 465,091 State Parks and Recreation Commission
Pend Oreille 18 4 22 31,267 21,797 53,064 Department of Transportation
Pierce 865 53 918 9,750,472 1,096,745 10,847,217 Department of Social and Health Services
San Juan 283 5 288 214,879 4,221 219,100 University of Washington
Skagit 286 14 300 1,349,198 131,238 1,480,436 Department of Enterprise Services
Skamania 64 2 66 65,323 6,732 72,055 Department of Fish and Wildlife
Snohomish 270 64 334 3,599,045 786,494 4,385,539 Community and technical college system
Spokane 572 99 671 8,612,131 1,402,310 10,014,441 Eastern Washington University
Stevens 65 6 71 160,423 36,813 197,236 Community and technical college system
Thurston 431 129 560 8,382,772 3,985,970 12,368,742 Department of Enterprise Services
Wahkiakum 22 0 22 39,170 0 39,170 Department of Fish and Wildlife
Walla Walla 159 11 170 2,204,182 85,439 2,289,621 Department of Corrections
Whatcom 283 27 310 4,299,284 300,703 4,599,987 Western Washington University
Whitman 566 9 575 11,625,998 37,279 11,663,277 Washington State University
Yakima 294 83 377 1,772,030 494,341 2,266,371 Community and technical college system
Out of State 1 24 25 4,977 76,349 81,326 University of Washington

Washington State Office of Financial Management Insurance Building ♦ PO Box 43113
Olympia, WA 98504-3113 ♦ 360-902-3063