FACILITIES FINANCING AND FUNDING OPTIONS - City … · FACILITIES FINANCING AND FUNDING OPTIONS...
18
TUKWILA FACILITY NEEDS ASSESSMENT AND FEASIBILITY STUDY FACILITIES FINANCING AND FUNDING OPTIONS DRAFT: AUGUST 9, 2015 INTRODUCTION The City of Tukwila is conducting a Facility Needs Assessment and Feasibility Study to plan for the long-term sustainability of the City’s facilities, optimize organizational efficiencies, and improve public safety. Goals of the Facilities Needs Assessment and Feasibility Study include developing a shared understanding of how the City’s facility needs fit within broader capital needs over the next 20 years and identifying potential options for funding facility projects in a timely manner. To support the City’s facility planning, this document describes the City of Tukwila’s fiscal position concerning capital investment, and more specifically, the additional capital investment required to fully fund the two major facility plan options. This document is organized as follows: Section 1: Consideration of Planned Capital Improvements This section provides background information and context on the City’s planned capital improvements. Any project within the Facilities Plan will need to be considered within the context of the City’s currently identified needs. The Capital Improvement Program (CIP) provides context to support a conversation about the relative priority of facility investments compared to other capital needs. Section 2: Consideration of Potential Financing Options and Funding Sources This section reviews the City’s options for financing and funding. Funding strategies will consider how the City will pay for facility investments and financing strategies provide the City options for when it will pay for facility investments. This document is an addendum to the Operating and Capital Funding Situation Assessment (August 19, 2013), hereafter referred to as “Situation Assessment,” which provides additional context on the City’s fiscal position. Subsequent analysis will evaluate the full life cycle costs associated with potential or preferred financing options determined by the City. The analysis will factor in differences in financing costs (including interest rates, bond issuance fees, and management fees) of the finance options and how the options change the impact to the City’s annual budget (the effective annual cost to the general fund).
-
Upload
duongkhuong -
Category
Documents
-
view
216 -
download
1
Transcript of FACILITIES FINANCING AND FUNDING OPTIONS - City … · FACILITIES FINANCING AND FUNDING OPTIONS...
TUKWILA FACILITY NEEDS ASSESSMENT AND FEASIBILITY STUDY
FACILITIES FINANCING AND FUNDING OPTIONS
DRAFT: AUGUST 9, 2015
INTRODUCTION
The City of Tukwila is conducting a Facility Needs Assessment and Feasibility Study to plan for
the long-term sustainability of the City’s facilities, optimize organizational efficiencies, and
improve public safety. Goals of the Facilities Needs Assessment and Feasibility Study include
developing a shared understanding of how the City’s facility needs fit within broader capital
needs over the next 20 years and identifying potential options for funding facility projects in a
timely manner. To support the City’s facility planning, this document describes the City of
Tukwila’s fiscal position concerning capital investment, and more specifically, the additional
capital investment required to fully fund the two major facility plan options. This document is
organized as follows:
Section 1: Consideration of Planned Capital Improvements
This section provides background information and context on the City’s planned capital
improvements. Any project within the Facilities Plan will need to be considered within the
context of the City’s currently identified needs. The Capital Improvement Program (CIP)
provides context to support a conversation about the relative priority of facility investments
compared to other capital needs.
Section 2: Consideration of Potential Financing Options and Funding Sources
This section reviews the City’s options for financing and funding. Funding strategies will
consider how the City will pay for facility investments and financing strategies provide the
City options for when it will pay for facility investments.
This document is an addendum to the Operating and Capital Funding Situation Assessment
(August 19, 2013), hereafter referred to as “Situation Assessment,” which provides additional
context on the City’s fiscal position.
Subsequent analysis will evaluate the full life cycle costs associated with potential or preferred
financing options determined by the City. The analysis will factor in differences in financing costs
(including interest rates, bond issuance fees, and management fees) of the finance options and
how the options change the impact to the City’s annual budget (the effective annual cost to the
general fund).

CITY OF TUKWILA FACILITY NEEDS ASSESSMENT AND FEASIBILITY STUDY FACILITIES FINANCING AND FUNDING OPTIONS
August 9, 2015 2
SECTION 1: CONSIDERATION OF PLANNED CAPITAL IMPROVEMENTS
The Situation Assessment describes the City’s current operating and capital funding situation as
well as projected changes. The following provides an update to the capital funding priorities
established in the 2013-2018 Six-Year CIP with the 2015-2020 Six-year CIP.
2015-2020 Six-Year Capital Improvement Program Funding
Exhibit 1 summarizes the City of Tukwila’s current six-year CIP, as well as capital needs identified
beyond the six-year planning period. The City has identified approximately $70.9 million in
capital projects (outside of the facilities improvements) for completion over the next six years
and approximately $297.8 million in total identified capital project needs.
Exhibit 1 Summary of Six-Year Capital Expenditures and Revenues, 2015-2020
(Not including enterprise funds. In millions)
Source: City of Tukwila, 2015; and BERK, 2015.
Summary of Capital Expenditures
Transportation projects, including those for residential streets and bridges and arterial
streets, comprise the largest portion of near-term capital needs making up approximately
89% of total identified costs.
2015-2020
6-Year
Total
6-Year
Percent of
Total
Beyond 6
Years
Beyond 6
Years
Percent of
Total
Total
Identified
Cost
Percent
of Total
Capital Expenditures
Residential Streets $13.86 20% $7.51 3% $21.37 7%
Bridges & Arterial Streets $48.76 69% $122.40 54% $171.15 57%
Parks & Recreation $4.87 7% $24.83 11% $29.70 10%
Facilities $2.25 3% $52.25 23% $54.50 18%
General Improvements $1.20 2% $0.20 0% $1.40 0%
Fire Improvements $0.00 0% $19.69 9% $19.69 7%
Total Expenditures $70.94 100% $226.87 100% $297.81 100%
Funding Sources
City Operating Revenue $14.35 20% $105.92 47% $120.27 40%
Grants $31.16 44% $39.31 17% $70.47 24%
Impact Fees $1.03 1% $14.81 7% $15.84 5%
Loans/Bonds $12.25 17% $57.52 25% $69.77 23%
Mitigation $0.98 1% $0.02 0% $1.00 0%
MVFT $0.00 0% $0.00 0% $0.00 0%
Other $11.18 16% $9.29 4% $20.47 7%
Parking Tax $0.00 0% $0.00 0% $0.00 0%
REET $0.00 0% $0.00 0% $0.00 0%
Total Funding $70.94 100% $226.87 100% $297.81 100%

CITY OF TUKWILA FACILITY NEEDS ASSESSMENT AND FEASIBILITY STUDY FACILITIES FINANCING AND FUNDING OPTIONS
August 9, 2015 3
Parks and Recreation is the next largest portion, comprising about 7% of total identified
costs followed by facilities at 3% of total identified costs.
General Improvements and Fire Improvements make up a smaller portion of overall capital
costs. All major improvements to fire facilities are currently planned to occur beyond the six-
year CIP.
Summary of Funding Sources
The majority of funds planned for all projects in the CIP (40%) come from City operarating
revenues, which primarily support transportation and parks and recreation projects. Over
the long term, city operating revenue allocations for capital improvements may decline as
Tukwila is projected to move from having a surplus of operating revenues to a shortfall, as
discussed in the Situation Assessment.
Grants are programmed to pay for approximately 24% of capital projects in the long term.
The City plans to use financing, including loans and bonds, for about 17% of project costs
over the next six years.
“Other” funding sources include donations and contributions, developer contributions, and
sale of existing property.
Future Facilities Funding Implications The analysis of the CIP shows that the City has identified many capital needs beyond what it is
able to pay for within the next six years. These additional projects total approximately $226.8
million, and while funding sources are identified in the CIP, the mix in funding sources between
the six-year programmed projects and the longer-term projects shows the uncertainty in the
long-term funding picture.
About 47% of projects beyond six years are estimated to be funded by city operating
revenues, compared to 20% for near-term projects. Allocating this much discretionary
funding to capital investments will be challenged by an operating shortfall that is projected
to start in 2016. With operating costs increasing faster than operating revenues, the general
fund budget will be pressed to support general operations.
The City has reduced its reliance on grants (44% for the 2015-2020 CIP, compared to 54% in
the 2013-18 CIP). Grants are applied for and awarded on a project-by-project basis, and are
most commonly used in transportation and parks and recreation projects. Garnering
additional grants to support transportation needs would free up general capital and
operating revenues for use on other capital projects.
The City has previously issued bonds to finance certain capital projects. Current bond
capacity to meet facilities needs is limited by existing bond debt, but additional capacity will
free up as bonds are paid.. Additionally, it means some CIP funding is already supporting
debt service. Additional debt service will constrict the City’s ability to make new capital
investments going forward.

CITY OF TUKWILA FACILITY NEEDS ASSESSMENT AND FEASIBILITY STUDY FACILITIES FINANCING AND FUNDING OPTIONS
August 9, 2015 4
Facility Plan Costs
Initial facilities funding estimates were developed by Rice Fergus Miller and programmed into
two phasing options:
Option A: a more aggressive and less costly phasing plan, with a total cost of $98.54 million,
not including potential debt service, between 2015 and 2040.
Option B: a less aggressive and more costly phasing plan, with a cost of $139.34 million, not
including potential debt service, between 2015 and 2040.
Two factors drive the cost difference between the two phasing options:
Option B includes interim repairs to both City Hall and the 6300 adminstrative building to
extend their useful life to allow for a less aggressive schedule.
In Option B, significant investments, particularly in the City Hall building, happen towards
the end of the 2040 window, making those investments subject to inflation and growing
construction costs.
These options are shown in Exhibit 2.

CITY OF TUKWILA FACILITY NEEDS ASSESSMENT AND FEASIBILITY STUDY FACILITIES FINANCING AND FUNDING OPTIONS
August 9, 2015 5
Exhibit 2 Phasing Options A and B
(In millions)
Source: City of Tukwila, 2015; Rice Fergus Miller, 2015; and BERK, 2015
Remedying the deficiencies of the City’s current facilities for municipal services will take significant commitment
from the City and its residents. Some of the public works facilities (an assumed 50% for the purposes of this analysis)
can be paid for with enterprise funds. That portion of the public works facility has been netted out of the
subsequent analysis. Even still, both phasing options are likely to require financing a portion of the facility
improvements.
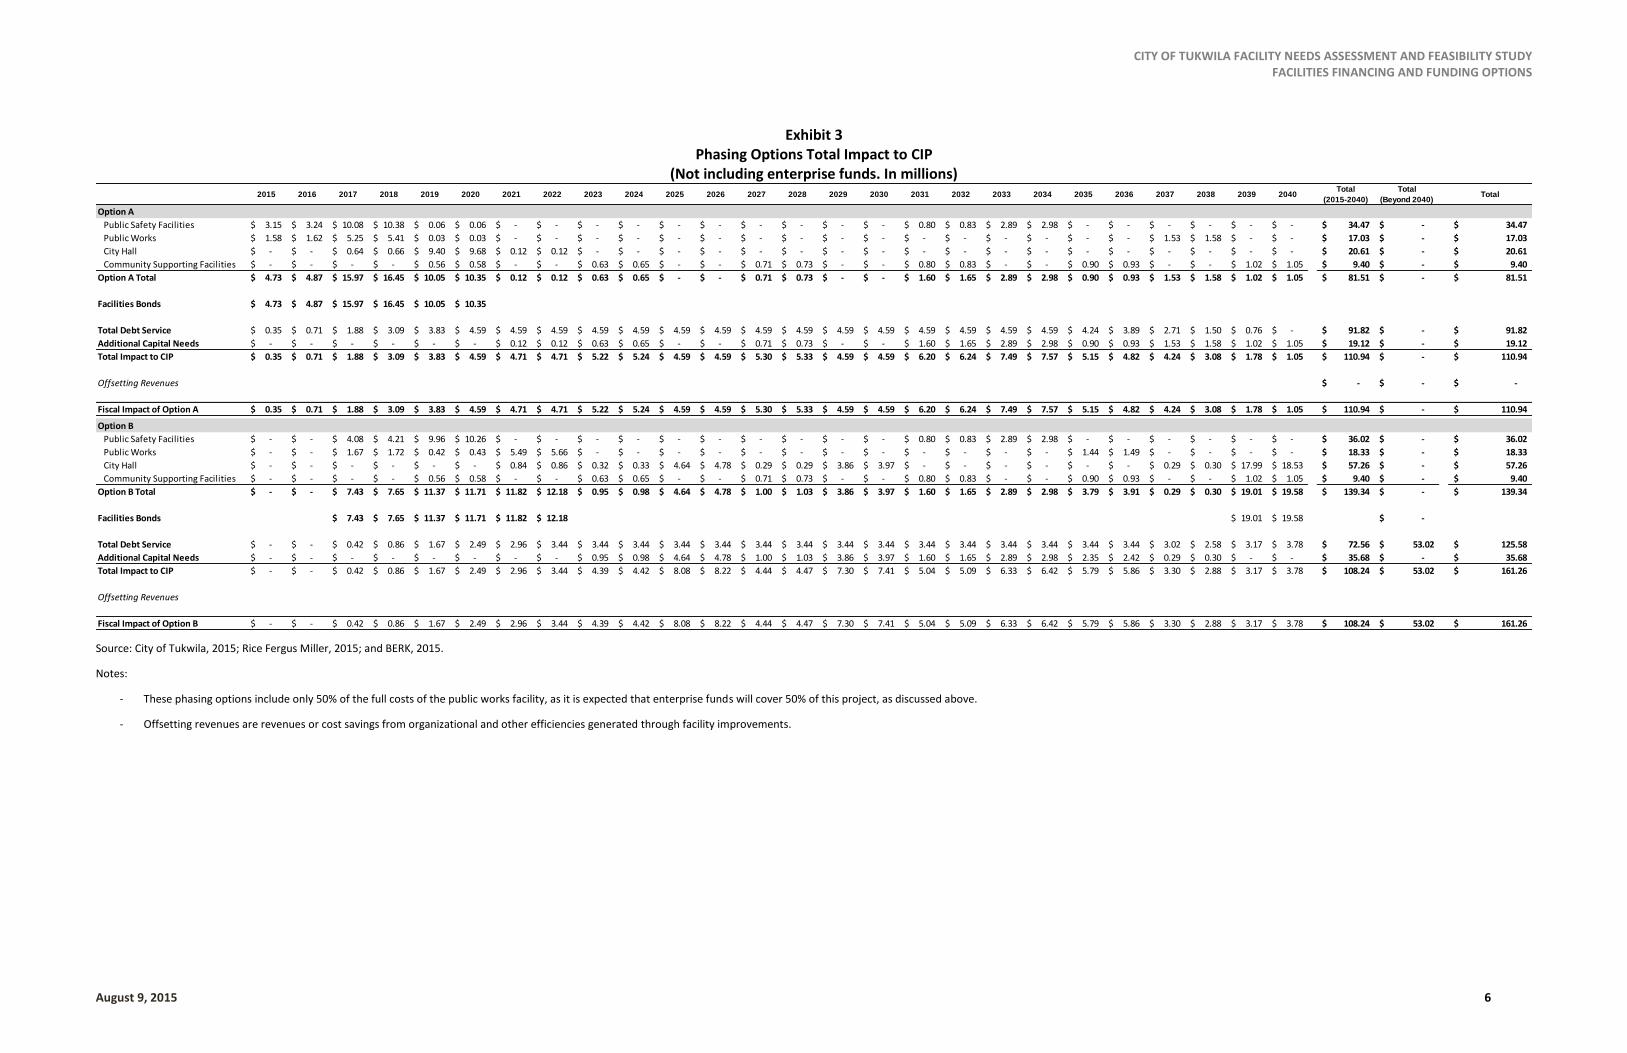
The impact to the overall budget in a given year includes direct costs of facility projects, financing costs, or a
combination of both. Exhibit 3 presents both phasing options with bonds timed to significant capital needs. The
result of this analysis shows that Option B ($186.9 million) is significantly more expensive than Option A ($134.2
million) in the long-term. Additionally, Option B requires significant debt service ($51.1 million) after 2040.
2015 2016 2017 2018 2019 2020 2021 2022 2023 2024 2025 2026 2027 2028 2029 2030 2031 2032 2033 2034 2035 2036 2037 2038 2039 2040 Project Total
Option A
Public Safety Facilities 3.15$ 3.24$ 10.08$ 10.38$ 0.06$ 0.06$ -$ -$ -$ -$ -$ -$ -$ -$ -$ -$ 0.80$ 0.83$ 2.89$ 2.98$ -$ -$ -$ -$ -$ -$ 34.47$
Public Works 3.15$ 3.24$ 10.50$ 10.82$ 0.06$ 0.06$ -$ -$ -$ -$ -$ -$ -$ -$ -$ -$ -$ -$ -$ -$ -$ -$ 3.07$ 3.16$ -$ -$ 34.05$
City Hall -$ -$ 0.64$ 0.66$ 9.40$ 9.68$ 0.12$ 0.12$ -$ -$ -$ -$ -$ -$ -$ -$ -$ -$ -$ -$ -$ -$ -$ -$ -$ -$ 20.61$
Community Supporting Facilities -$ -$ -$ -$ 0.56$ 0.58$ -$ -$ 0.63$ 0.65$ -$ -$ 0.71$ 0.73$ -$ -$ 0.80$ 0.83$ -$ -$ 0.90$ 0.93$ -$ -$ 1.02$ 1.05$ 9.40$
Total 6.30$ 6.49$ 21.22$ 21.85$ 10.07$ 10.38$ 0.12$ 0.12$ 0.63$ 0.65$ -$ -$ 0.71$ 0.73$ -$ -$ 1.60$ 1.65$ 2.89$ 2.98$ 0.90$ 0.93$ 3.07$ 3.16$ 1.02$ 1.05$ 98.54$
Option B
Public Safety Facilities -$ -$ 4.08$ 4.21$ 9.96$ 10.26$ -$ -$ -$ -$ -$ -$ -$ -$ -$ -$ 0.80$ 0.83$ 2.89$ 2.98$ -$ -$ -$ -$ -$ -$ 36.02$
Public Works -$ -$ 3.34$ 3.44$ 0.84$ 0.87$ 10.99$ 11.31$ -$ -$ -$ -$ -$ -$ -$ -$ -$ -$ -$ -$ 2.89$ 2.98$ -$ -$ -$ -$ 36.66$
City Hall -$ -$ -$ -$ -$ -$ 0.84$ 0.86$ 0.32$ 0.33$ 4.64$ 4.78$ 0.29$ 0.29$ 3.86$ 3.97$ -$ -$ -$ -$ -$ -$ 0.29$ 0.30$ 17.99$ 18.53$ 57.26$
Community Supporting Facilities -$ -$ -$ -$ 0.56$ 0.58$ -$ -$ 0.63$ 0.65$ -$ -$ 0.71$ 0.73$ -$ -$ 0.80$ 0.83$ -$ -$ 0.90$ 0.93$ -$ -$ 1.02$ 1.05$ 9.40$
Total -$ -$ 7.43$ 7.65$ 11.37$ 11.71$ 11.82$ 12.18$ 0.95$ 0.98$ 4.64$ 4.78$ 1.00$ 1.03$ 3.86$ 3.97$ 1.60$ 1.65$ 2.89$ 2.98$ 3.79$ 3.91$ 0.29$ 0.30$ 19.01$ 19.58$ 139.34$
CITY OF TUKWILA FACILITY NEEDS ASSESSMENT AND FEASIBILITY STUDY FACILITIES FINANCING AND FUNDING OPTIONS
August 9, 2015 6
Exhibit 3 Phasing Options Total Impact to CIP
(Not including enterprise funds. In millions)
Source: City of Tukwila, 2015; Rice Fergus Miller, 2015; and BERK, 2015.
Notes:
- These phasing options include only 50% of the full costs of the public works facility, as it is expected that enterprise funds will cover 50% of this project, as discussed above.
- Offsetting revenues are revenues or cost savings from organizational and other efficiencies generated through facility improvements.
2015 2016 2017 2018 2019 2020 2021 2022 2023 2024 2025 2026 2027 2028 2029 2030 2031 2032 2033 2034 2035 2036 2037 2038 2039 2040Total
(2015-2040)
Total
(Beyond 2040)Total
Option A
Public Safety Facilities 3.15$ 3.24$ 10.08$ 10.38$ 0.06$ 0.06$ -$ -$ -$ -$ -$ -$ -$ -$ -$ -$ 0.80$ 0.83$ 2.89$ 2.98$ -$ -$ -$ -$ -$ -$ 34.47$ -$ 34.47$
Public Works 1.58$ 1.62$ 5.25$ 5.41$ 0.03$ 0.03$ -$ -$ -$ -$ -$ -$ -$ -$ -$ -$ -$ -$ -$ -$ -$ -$ 1.53$ 1.58$ -$ -$ 17.03$ -$ 17.03$
City Hall -$ -$ 0.64$ 0.66$ 9.40$ 9.68$ 0.12$ 0.12$ -$ -$ -$ -$ -$ -$ -$ -$ -$ -$ -$ -$ -$ -$ -$ -$ -$ -$ 20.61$ -$ 20.61$
Community Supporting Facilities -$ -$ -$ -$ 0.56$ 0.58$ -$ -$ 0.63$ 0.65$ -$ -$ 0.71$ 0.73$ -$ -$ 0.80$ 0.83$ -$ -$ 0.90$ 0.93$ -$ -$ 1.02$ 1.05$ 9.40$ -$ 9.40$
Option A Total 4.73$ 4.87$ 15.97$ 16.45$ 10.05$ 10.35$ 0.12$ 0.12$ 0.63$ 0.65$ -$ -$ 0.71$ 0.73$ -$ -$ 1.60$ 1.65$ 2.89$ 2.98$ 0.90$ 0.93$ 1.53$ 1.58$ 1.02$ 1.05$ 81.51$ -$ 81.51$
Facilities Bonds 4.73$ 4.87$ 15.97$ 16.45$ 10.05$ 10.35$
Total Debt Service 0.35$ 0.71$ 1.88$ 3.09$ 3.83$ 4.59$ 4.59$ 4.59$ 4.59$ 4.59$ 4.59$ 4.59$ 4.59$ 4.59$ 4.59$ 4.59$ 4.59$ 4.59$ 4.59$ 4.59$ 4.24$ 3.89$ 2.71$ 1.50$ 0.76$ -$ 91.82$ -$ 91.82$
Additional Capital Needs -$ -$ -$ -$ -$ -$ 0.12$ 0.12$ 0.63$ 0.65$ -$ -$ 0.71$ 0.73$ -$ -$ 1.60$ 1.65$ 2.89$ 2.98$ 0.90$ 0.93$ 1.53$ 1.58$ 1.02$ 1.05$ 19.12$ -$ 19.12$
Total Impact to CIP 0.35$ 0.71$ 1.88$ 3.09$ 3.83$ 4.59$ 4.71$ 4.71$ 5.22$ 5.24$ 4.59$ 4.59$ 5.30$ 5.33$ 4.59$ 4.59$ 6.20$ 6.24$ 7.49$ 7.57$ 5.15$ 4.82$ 4.24$ 3.08$ 1.78$ 1.05$ 110.94$ -$ 110.94$
Offsetting Revenues -$ -$ -$
Fiscal Impact of Option A 0.35$ 0.71$ 1.88$ 3.09$ 3.83$ 4.59$ 4.71$ 4.71$ 5.22$ 5.24$ 4.59$ 4.59$ 5.30$ 5.33$ 4.59$ 4.59$ 6.20$ 6.24$ 7.49$ 7.57$ 5.15$ 4.82$ 4.24$ 3.08$ 1.78$ 1.05$ 110.94$ -$ 110.94$
Option B
Public Safety Facilities -$ -$ 4.08$ 4.21$ 9.96$ 10.26$ -$ -$ -$ -$ -$ -$ -$ -$ -$ -$ 0.80$ 0.83$ 2.89$ 2.98$ -$ -$ -$ -$ -$ -$ 36.02$ -$ 36.02$
Public Works -$ -$ 1.67$ 1.72$ 0.42$ 0.43$ 5.49$ 5.66$ -$ -$ -$ -$ -$ -$ -$ -$ -$ -$ -$ -$ 1.44$ 1.49$ -$ -$ -$ -$ 18.33$ -$ 18.33$
City Hall -$ -$ -$ -$ -$ -$ 0.84$ 0.86$ 0.32$ 0.33$ 4.64$ 4.78$ 0.29$ 0.29$ 3.86$ 3.97$ -$ -$ -$ -$ -$ -$ 0.29$ 0.30$ 17.99$ 18.53$ 57.26$ -$ 57.26$
Community Supporting Facilities -$ -$ -$ -$ 0.56$ 0.58$ -$ -$ 0.63$ 0.65$ -$ -$ 0.71$ 0.73$ -$ -$ 0.80$ 0.83$ -$ -$ 0.90$ 0.93$ -$ -$ 1.02$ 1.05$ 9.40$ -$ 9.40$
Option B Total -$ -$ 7.43$ 7.65$ 11.37$ 11.71$ 11.82$ 12.18$ 0.95$ 0.98$ 4.64$ 4.78$ 1.00$ 1.03$ 3.86$ 3.97$ 1.60$ 1.65$ 2.89$ 2.98$ 3.79$ 3.91$ 0.29$ 0.30$ 19.01$ 19.58$ 139.34$ -$ 139.34$
Facilities Bonds 7.43$ 7.65$ 11.37$ 11.71$ 11.82$ 12.18$ 19.01$ 19.58$ -$
Total Debt Service -$ -$ 0.42$ 0.86$ 1.67$ 2.49$ 2.96$ 3.44$ 3.44$ 3.44$ 3.44$ 3.44$ 3.44$ 3.44$ 3.44$ 3.44$ 3.44$ 3.44$ 3.44$ 3.44$ 3.44$ 3.44$ 3.02$ 2.58$ 3.17$ 3.78$ 72.56$ 53.02$ 125.58$
Additional Capital Needs -$ -$ -$ -$ -$ -$ -$ -$ 0.95$ 0.98$ 4.64$ 4.78$ 1.00$ 1.03$ 3.86$ 3.97$ 1.60$ 1.65$ 2.89$ 2.98$ 2.35$ 2.42$ 0.29$ 0.30$ -$ -$ 35.68$ -$ 35.68$
Total Impact to CIP -$ -$ 0.42$ 0.86$ 1.67$ 2.49$ 2.96$ 3.44$ 4.39$ 4.42$ 8.08$ 8.22$ 4.44$ 4.47$ 7.30$ 7.41$ 5.04$ 5.09$ 6.33$ 6.42$ 5.79$ 5.86$ 3.30$ 2.88$ 3.17$ 3.78$ 108.24$ 53.02$ 161.26$
Offsetting Revenues
Fiscal Impact of Option B -$ -$ 0.42$ 0.86$ 1.67$ 2.49$ 2.96$ 3.44$ 4.39$ 4.42$ 8.08$ 8.22$ 4.44$ 4.47$ 7.30$ 7.41$ 5.04$ 5.09$ 6.33$ 6.42$ 5.79$ 5.86$ 3.30$ 2.88$ 3.17$ 3.78$ 108.24$ 53.02$ 161.26$

CITY OF TUKWILA FACILITY NEEDS ASSESSMENT AND FEASIBILITY STUDY FACILITIES FINANCING AND FUNDING OPTIONS
August 9, 2015 7
The costs associated with both phasing options must be considered in the context of the City’s
additional capital needs. As discussed above, the CIP identifies planned capital improvements
for a six-year planning horizon as well as significant capital improvement needs that fall outside
of the six-year window. Tukwila’s 2013-2018 CIP planned for $71.03 million over six years and
the 2015–2020 CIP planned for slightly less at $68.46 million over six years (all CIP figures
updated to 2015$). It is notable that the 2013-2018 CIP allocation is slightly higher than the
more recent CIP, owing to a larger number of grants. The availability of grants in general, and
the share of revenues they represent to Tukwila, is expected to decline over the next several
years. This is explored in more detail in the Situation Assessment.
The similiarity in funding amounts suggests recent stability in the City’s CIP funding. Tukwila, like
most cities, plans for major capital improvements in the front half of its published six-year CIP.
For both CIPs, more than 80% of the investments were planned for the first half of the CIP
window. Tukwila updates the CIP every two years, along with its operating budget.
To provide a sense of scale of the City’s facilities needs identified in the needs assessment, the
analysis provides a forecast of Tukwila’s CIP allocation over the next 25 years. The Typical CIP
Forecast is based on the first two years of the 2015-2020 CIP, forecast to 2040 based on a
standard inflation assumption.
Exhibit 4 and Exhibit 5 illustrate how each phasing option fits within the City’s forecasted CIP
allocation over the next 25 years.

CITY OF TUKWILA FACILITY NEEDS ASSESSMENT AND FEASIBILITY STUDY FACILITIES FINANCING AND FUNDING OPTIONS
August 9, 2015 8
Exhibit 4 Review of Facilities Phasing Option A Fiscal Impacts and Debt Service Compared to
Previous Capital Expenditures Budgets, 2015-2040
(In millions) Source: City of Tukwila, 2015; Rice Fergus Miller, 2015; and BERK, 2015.
Option A, the more expedient, but less expensive facilities option would require a 20-year
commitment of 11% of the City of Tukwila’s CIP based on the high CIP allocation or 19%
based on the low-medium allocation.
This facilities phasing option would have a significant fiscal impact on the CIP. Between the
2015 and 2036, as much as 39% (in 2019 based on the low-medium CIP allocation) of the
City of Tukwila’s CIP would be dedicated to this facilities plan. After the 2036, the fiscal
impact would be significantly smaller: less than 10% of either allocation annually.
Given the size of some of the individual facility investments, both phasing options would
likely require use of debt financing. Total debt service (existing debt service and debt service
from these facilities projects) over the 20-year plan would be between 13% of the City of
Tukwila’s CIP based on the high CIP allocation or 22% based on the low-medium allocation.

CITY OF TUKWILA FACILITY NEEDS ASSESSMENT AND FEASIBILITY STUDY FACILITIES FINANCING AND FUNDING OPTIONS
August 9, 2015 9
Exhibit 5 Review of Facilities Phasing Option B Fiscal Impacts and Debt Service Compared to
Previous Capital Expenditures Budgets, 2015-2040 (Not including enterprise funds. In millions)
Source: City of Tukwila, 2015; Rice Fergus Miller, 2015; and BERK, 2015.
Option B, the more slowly paced, but more costly facilities option would require a 20-year
commitment of, on average, 11% of the City of Tukwila’s CIP based on the high CIP
allocation or 23% based on the low-medium allocation. It would also require a commitment
of additional commitment of CIP dollars past the period of this phasing plan, until 2059.
Like Option A, Option B would have a significant fiscal impact on the CIP, absorbing as much
as 36% of the full CIP capacity in 2025 (based on the Typical CIP Forecast).
Both options require significant financing. Total debt service (existing debt service and debt
service from these facilities projects) over the 20-year plan would be between 11% of the
City of Tukwila’s CIP based on the high CIP allocation or 19% based on the low-medium
allocation.
Unlike Option A, the bond commitments enabling this facilities plan would continue for 19
years after 2040. An additional $53.0 million would be spent on this facilities plan across
those years.
CITY OF TUKWILA FACILITY NEEDS ASSESSMENT AND FEASIBILITY STUDY FACILITIES FINANCING AND FUNDING OPTIONS
August 9, 2015 10
SECTION 2: CONSIDERATION OF POTENTIAL FINANCING AND FUNDING SOURCES
Given the current deficiencies in the City’s municipal service facilities, the City may opt to secure
funds using debt to invest in facilities improvements in the near-term, which will be paid back
over time. This debt option would allow the City to improve its facilities at a rate that could not
be supported by operating surpluses alone, reduce the risk to public safely to which the City is
currently exposed given the condition of its municipal service faciltiies, and allow the City to
make facilities investments without delaying investment in the other capital needs identified in
its CIP. There are a number of debt options available to the City; this section describes three of
the most common for municipal facility investments in Washington State.
Beyond the financing and funding of these projects, the City always has the option to reprioritize
its CIP to eliminate projects and free up CIP funding capacity for these facilities projects. The
City’s CIP is already strategically prioritized, as there are millions of dollars more of
infrastructure projects identified than can be feasibly funded over the next six years.
FINANCE OPTIONS
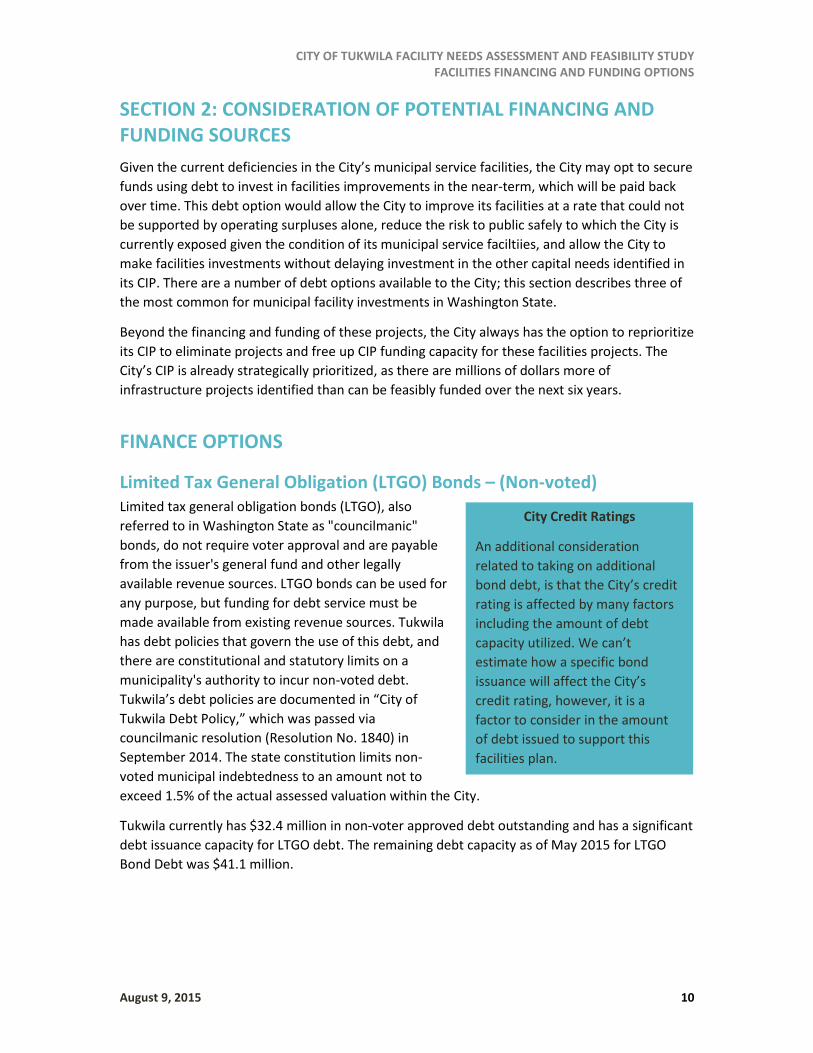
Limited Tax General Obligation (LTGO) Bonds – (Non-voted) Limited tax general obligation bonds (LTGO), also
referred to in Washington State as "councilmanic"
bonds, do not require voter approval and are payable
from the issuer's general fund and other legally
available revenue sources. LTGO bonds can be used for
any purpose, but funding for debt service must be
made available from existing revenue sources. Tukwila
has debt policies that govern the use of this debt, and
there are constitutional and statutory limits on a
municipality's authority to incur non-voted debt.
Tukwila’s debt policies are documented in “City of
Tukwila Debt Policy,” which was passed via
councilmanic resolution (Resolution No. 1840) in
September 2014. The state constitution limits non-
voted municipal indebtedness to an amount not to
exceed 1.5% of the actual assessed valuation within the City.
Tukwila currently has $32.4 million in non-voter approved debt outstanding and has a significant
debt issuance capacity for LTGO debt. The remaining debt capacity as of May 2015 for LTGO
Bond Debt was $41.1 million.
City Credit Ratings
An additional consideration
related to taking on additional
bond debt, is that the City’s credit
rating is affected by many factors
including the amount of debt
capacity utilized. We can’t
estimate how a specific bond
issuance will affect the City’s
credit rating, however, it is a
factor to consider in the amount
of debt issued to support this
facilities plan.
CITY OF TUKWILA FACILITY NEEDS ASSESSMENT AND FEASIBILITY STUDY FACILITIES FINANCING AND FUNDING OPTIONS
August 9, 2015 11
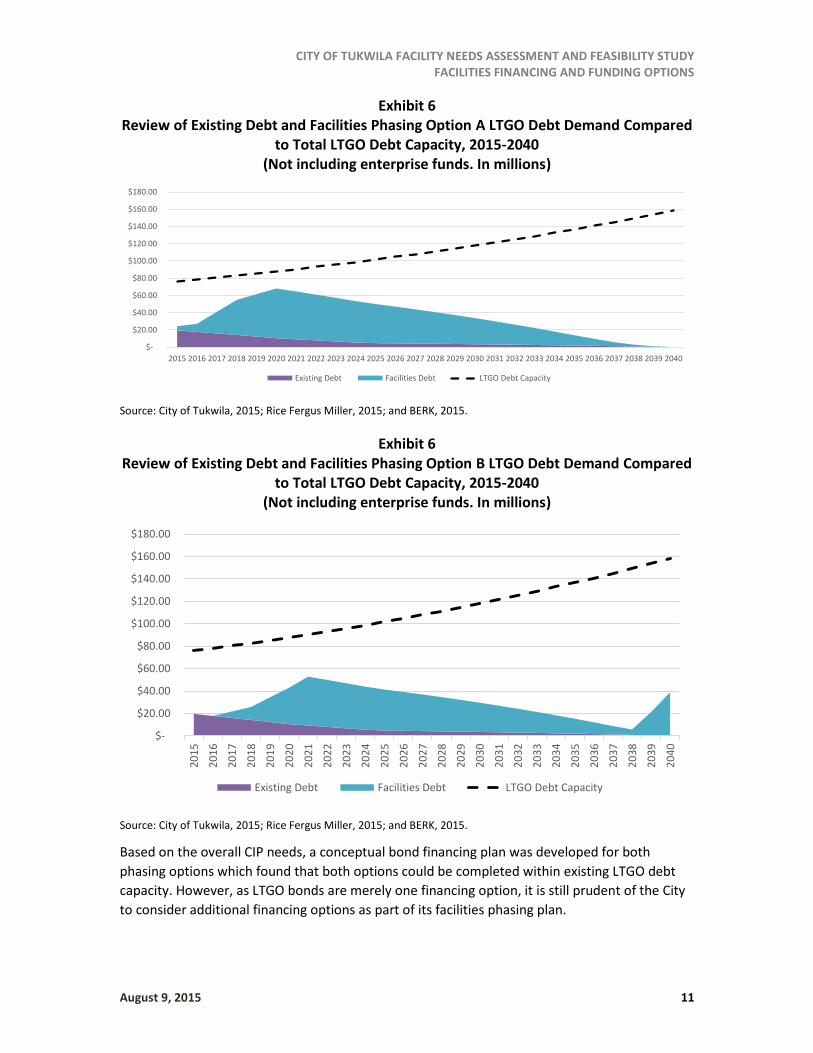
Exhibit 6 Review of Existing Debt and Facilities Phasing Option A LTGO Debt Demand Compared
to Total LTGO Debt Capacity, 2015-2040 (Not including enterprise funds. In millions)
Source: City of Tukwila, 2015; Rice Fergus Miller, 2015; and BERK, 2015.
Exhibit 6 Review of Existing Debt and Facilities Phasing Option B LTGO Debt Demand Compared
to Total LTGO Debt Capacity, 2015-2040 (Not including enterprise funds. In millions)
Source: City of Tukwila, 2015; Rice Fergus Miller, 2015; and BERK, 2015.
Based on the overall CIP needs, a conceptual bond financing plan was developed for both
phasing options which found that both options could be completed within existing LTGO debt
capacity. However, as LTGO bonds are merely one financing option, it is still prudent of the City
to consider additional financing options as part of its facilities phasing plan.
$-
$20.00
$40.00
$60.00
$80.00
$100.00
$120.00
$140.00
$160.00
$180.00
2015 2016 2017 2018 2019 2020 2021 2022 2023 2024 2025 2026 2027 2028 2029 2030 2031 2032 2033 2034 2035 2036 2037 2038 2039 2040
Existing Debt Facilities Debt LTGO Debt Capacity
$-
$20.00
$40.00
$60.00
$80.00
$100.00
$120.00
$140.00
$160.00
$180.00
20
15
20
16
20
17
20
18
20
19
20
20
20
21
20
22
20
23
20
24
20
25
20
26
20
27
20
28
20
29
20
30
20
31
20
32
20
33
20
34
20
35
20
36
20
37
20
38
20
39
20
40
Existing Debt Facilities Debt LTGO Debt Capacity

CITY OF TUKWILA FACILITY NEEDS ASSESSMENT AND FEASIBILITY STUDY FACILITIES FINANCING AND FUNDING OPTIONS
August 9, 2015 12
Considerations:
One of the benefits of LTGO bonds is that they can be passed by councilmanic ordinance.
LTGO bond capacity is substantial, but limited. Currently, the City of Tukwila has $41.4
million in LTGO bond capacity. Given the flexible nature of LTGO debt it is an important tool
for the City’s ability to react to unexpected expenses. While the City has enough capacity to
support either facilities option with LTGO dept, deploying too much of the City’ bond
capacity will limit its abilility to respond to unexpected expenses.
Since bonds are debt, the added costs of interest will increase project costs long term.
63-20 Financing 63-20 is a method of obtaining tax-exempt financing that allows public bonds to be used to
construct public facilities if they are secured by a lease agreement. A nonprofit corporation
issues tax-exempt debt on behalf of a political subdivision for the purpose of financing facilities.
Generally, these bonds require a credit-worthy private developer that is willing to enter into a
lease to support the bond offering. The nonprofit corporation also manages and operates the
building over the lease term. The facility is transferred to the government entity once the debt is
retired. The tenant is required to be either a governmental entity or a charitable organization. A
minimum 90% of the space must be occupied by the governmental entity, as specified by
“private use” requirements.
63-20 financed bonds have a higher interest rate and issuance fees due to the perceived higher
level of risk compared to the general obligation bond, which has the full backing of the
governmental jurisdiction. 63-20 financed bonds also have a small asset management fee
associated with them.
Benefits of 63-20 financing include the ability to realize construction cost savings through using
a general contractor/construction manager (GC/CM) project delivery process compared to the
design-bid-build model typically used for government facilities construction. Under this project
delivery method, the general contractor guarantees a fixed price for the work and takes on the
additional construction risk of subcontracting the project work. In addition, the contractor
provides specialized project management, scheduling, budgeting, and other advice early on and
throughout the project design process, which can result in a more efficient construction process
and less costly project. This project delivery process is especially advantageous for unique or
complex projects where governmental agencies may not have experience. The cost savings are
not guaranteed, and they vary by project depending on the situation. Lastly, 63-20 bonds do not
count towards a jurisdiction’s debt limit, which is advantageous for jurisdictions with limited or
no debt capacity.
Considerations:

CITY OF TUKWILA FACILITY NEEDS ASSESSMENT AND FEASIBILITY STUDY FACILITIES FINANCING AND FUNDING OPTIONS
August 9, 2015 13
63-20 bonds may make sense when private sector involvement in developing a governmental
facility is likely to provide significant benefits compared to a traditional public approach. These
benefits may be most apparent for facilities that:
Are time-sensitive, requiring for example an expedited schedule.
Are cost-sensitive or require price certainty for annual budgeting or other purposes (that is,
requiring a shift of all or a portion of the risk of project cost overruns from the governmental
entity to the nonprofit issuer and its private development team).
Otherwise require specialized development skills, knowledge, or approaches.
The obligation to pay rent is not a debt of the agency for the purposes of constitutional and
statutory limitations on state debt. 63-20 bonds offer an option when the agency already
carries the debt allowed by statutory regulation.
FUNDING SOURCES
Unlimited Tax General Obligation (UTGO) Bonds – (Voted) Unlimited tax general obligation (UTGO) bonds are both a financing and funding source as their
issuance includes the levy of an additional tax to repay them. These bonds require 60% voter
approval and may only be used for capital purposes. When residents of a city vote for a bond
issue, they are being asked to approve: (a) the issuance of a fixed amount of general obligation
bonds and (b) the levy of an additional tax to repay the bonds, unlimited as to rate or amount.
Once voter approval is obtained, a municipal corporation is still restricted by constitutional and
statutory debt limits with these bonds. The statutory debt limits on this type of debt is 2.5% of
the assessed value of property inclusive of any LTGO (non-voted) debt.
The City currently has $32.4 million (2015$) in non-voter approved debt outstanding applicable
to its UTGO debt. Debt Capacity as of May 2015 for UTGO Bond Debt is $90.1 million (2015$).
This is not directly additive to LTGO debt capacity. Only $49 million (2015$) in UTGO bond
capacity would be available if LTGO debt capacity was reached.
Considerations:
To approve UTGO bonds, an election must be held and the measure must be approved by at
least 60%. Thus, these bonds would be most effective for discrete projects, for instance the
public safety facility.
The City has bond capacity and can choose to use it for facilities. Given the magnitude of the
facility needs, it may be both practical and necessary to use UTGO capacity for some or all of
the early project needs, which would also allow the City to keep CIP funds available for
other later projects.
Since bonds are debt, the added costs of interest will increase project costs long term.
CITY OF TUKWILA FACILITY NEEDS ASSESSMENT AND FEASIBILITY STUDY FACILITIES FINANCING AND FUNDING OPTIONS
August 9, 2015 14
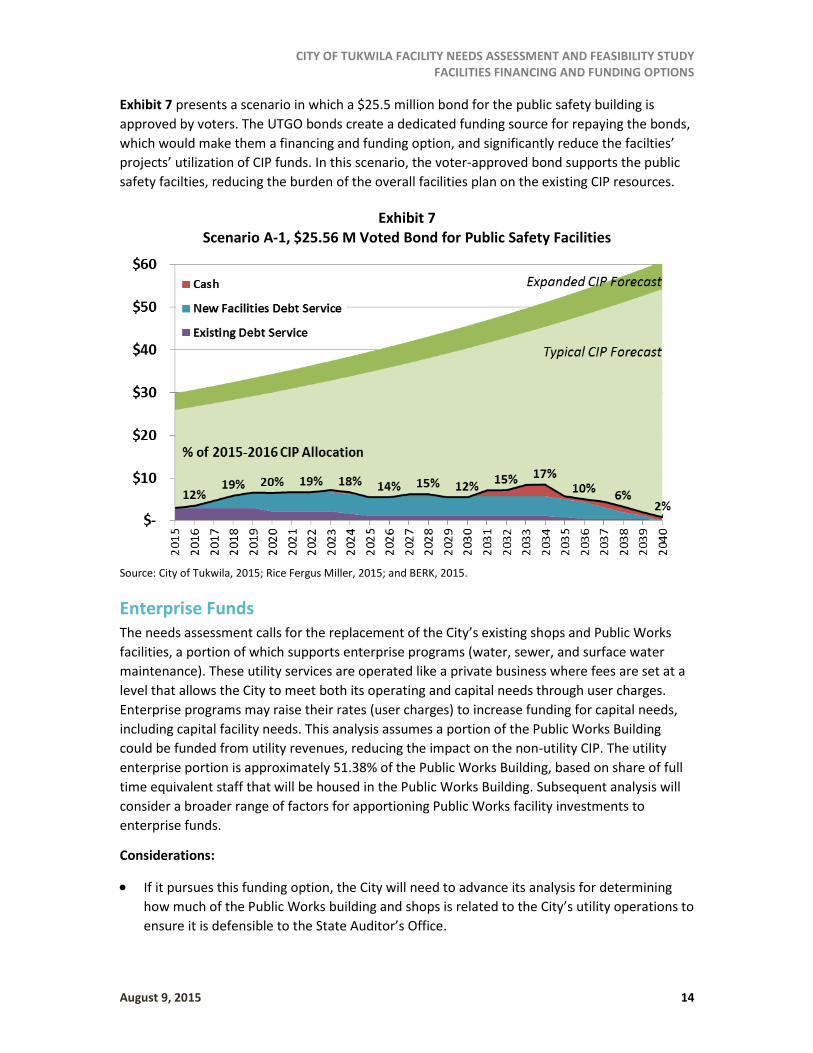
Exhibit 7 presents a scenario in which a $25.5 million bond for the public safety building is
approved by voters. The UTGO bonds create a dedicated funding source for repaying the bonds,
which would make them a financing and funding option, and significantly reduce the facilties’
projects’ utilization of CIP funds. In this scenario, the voter-approved bond supports the public
safety facilties, reducing the burden of the overall facilities plan on the existing CIP resources.
Exhibit 7 Scenario A-1, $25.56 M Voted Bond for Public Safety Facilities
Source: City of Tukwila, 2015; Rice Fergus Miller, 2015; and BERK, 2015.
Enterprise Funds The needs assessment calls for the replacement of the City’s existing shops and Public Works
facilities, a portion of which supports enterprise programs (water, sewer, and surface water
maintenance). These utility services are operated like a private business where fees are set at a
level that allows the City to meet both its operating and capital needs through user charges.
Enterprise programs may raise their rates (user charges) to increase funding for capital needs,
including capital facility needs. This analysis assumes a portion of the Public Works Building
could be funded from utility revenues, reducing the impact on the non-utility CIP. The utility
enterprise portion is approximately 51.38% of the Public Works Building, based on share of full
time equivalent staff that will be housed in the Public Works Building. Subsequent analysis will
consider a broader range of factors for apportioning Public Works facility investments to
enterprise funds.
Considerations:
If it pursues this funding option, the City will need to advance its analysis for determining
how much of the Public Works building and shops is related to the City’s utility operations to
ensure it is defensible to the State Auditor’s Office.

CITY OF TUKWILA FACILITY NEEDS ASSESSMENT AND FEASIBILITY STUDY FACILITIES FINANCING AND FUNDING OPTIONS
August 9, 2015 15
It is likely that this option would impact the rates utility consumers pay. The potential
impact on and individual payer would vary by service usage and additional analysis would be
needed to estimate the overal impact to utility payers if this alternative is pursued. Since
2011, utility tax rates have increased annually between 3% and 15%, resulting in average
monthy bill impacts ranging from $5.95 to $10.01 per month (cumulative across residential
water, sewer, and surface water services).
Surplus Property While a review of current property and market value was not conducted as part of this study,
the City of Tukwila may have property that would be suitable to surplus and sell to help fund
facility investments.
New and Additional Taxes
Transportation Benefit District Levied Taxes
As per Chapter 36.73 RCW, cities can create a transportation benefit district (TBD) through their
legislative authority. A TBD is an independent taxing district that can impose fees to fund
transportation improvements. These taxes are not restricted to capital construction projects and
can be used for maintenance and preservation on road and non-motorized projects. TBDs can
include other counties, cities, port districts, or transit districts through inter-local agreements.
TBDs do not have to include the entire jurisdiction of the establishing entity. The two taxation
options TBDs are authorized to levy include:
Up to a $100 Motor Vehicle Excise Tax (MVET) levied via a TBD. One tax that can be
imposed by a TBD is an up to $100 MVET (36.73.075 RCW). A $20 MVET can be imposed
without a vote of the people. The City of Tukwila could consider exploring the policy option
of levying this $20 MVET on its entire jurisdiction via a TBD. However, a small population
base means that this is unlikely to generate significant revenues. In 2014, this option would
have generated $0.2 million in additional revenues.
Up to a 0.02% Sales and Use Tax (SUT) levied via a TBD. Another tax that can be imposed
by a TBD is an up to a 0.02% SUT (36.73.075 RCW). Due to the City of Tukwila’s robust
taxable retail sales base, an additional SUT levied via a TBD could be a useful tool to
generate additional sales tax revenues. In 2014 alone, this option would have generated
$3.9 million in additional SUT revenues.
Long term, a TBD could expand the City’s CIP capacity, yielding additional revenues to
support the facilities plan. The impact of these funds is shown in Exhibit 8. Scenario A-2
would increase the City’s overall CIP capacity, therefore reduce the percentage of the CIP
necessary to support this facilties plan.

CITY OF TUKWILA FACILITY NEEDS ASSESSMENT AND FEASIBILITY STUDY FACILITIES FINANCING AND FUNDING OPTIONS
August 9, 2015 16
Exhibit 8 Scenario A-2, 0.02% Sales and Use Tax Levied via a TBD
Source: City of Tukwila, 2015; Rice Fergus Miller, 2015; and BERK, 2015.
Considerations:
Revenues generated by a TBD can only be used for transportation purposes, however, as
64% of the costs identified in the CIP are for transportation projects, it is expected that
these funds could replace existing general funds supported transportation projects.
Development of a TBD requires two stages of councilmanic action: (1) development of the
authorizing ordinance, and (2) an ordinance to levy the tax desired. This means that this
strategy is unlikely to provide funding in the first two years of this facilities plan.
Levy Lid Lift
As per RCW 84.55.050, the only way for a Washington city without banked capacity to increase
its property taxes by more than one percent is to do a levy lid lift. This occurs when taxing
jurisdictions with a tax rate less than their statutory maximum rate ask voters to increase their
tax rate to an amount equal to or less than the statutory maximum rate, effectively lifting the lid
on the levy rate.
Considerations:
Levy lid lifts are authorized through public vote, which requires a simple majority to pass. It
is unknown whether there is political will to pass such a vote for facilities projects in
Tukwila.

CITY OF TUKWILA FACILITY NEEDS ASSESSMENT AND FEASIBILITY STUDY FACILITIES FINANCING AND FUNDING OPTIONS
August 9, 2015 17
Business and Occupation Tax
A business and occupation (B&O) tax is levied on businesses operating in or with a physical
presence in the city, as described in Chapter 82.04 RCW. The tax can be levied three ways:
Percentage of gross business income (GBI)
Per employee tax
Per square foot tax
Considerations:
Tukwila does not currently levy a B&O Tax. The City could likely generate significant funds by
levying such a tax, however, this may be politically challenging, especially as local businesses
are often considered the payee.
Local B&O taxes require significant administration and enforcement.
Long term, a B&0 Tax could generate significant revenues to support this facilities plan.
A B&O tax rate of 0.2% on GBI can be levied councilmanically, however this ordinance is
subject to a referendum procedure. It is unknown whether there is political will to pass such
a vote for facilities projects in Tukwila if such a referendum were to occur.
Additional General Fund Revenues The City could generate additional general fund revenues to create additional flex to fund
capital facilities improvements. This could be accomplished by reexamining existing taxes and
fees, including:
Admissions Tax
Parking Tax
Revenue Generating Regulatory License Fee
Fire, Traffic, and Park Impact Fees
Considerations:
These taxes and fees can be reexamined, and potentially increased, through councilmanic
action.
The City is already projecting an operating revenue shortfall, so it is expected that these
existing taxes and fees may be evaluated to fill that shortfall. If that proves to be the case, it
is unlikely that there will be enough surplus revenues from these sources to also support
additional capital funds for facilities.

CITY OF TUKWILA FACILITY NEEDS ASSESSMENT AND FEASIBILITY STUDY FACILITIES FINANCING AND FUNDING OPTIONS
August 9, 2015 18
Offsetting Cost Savings It is possible that these new facilities would create both organizational and physical (energy,
water, and maintenance) efficiencies. However, these facilities will also allow for increased use
and be significantly larger than previous facilities, which may negate any efficiency gains. For
that reason, and for the sake of providing conservative estimates, offsetting revenues to support
these projects were not identified.
Considerations:
Offsetting revenues due to organizational and physical efficiencies allowed by these new
facilities are possible, but not necessarily probable, as the new buildings will be larger and
their systems will be more sophisticated. For that reason, potential offsets were considered
net neutral to Tukwila’s budget overall.
Additional Prioritization of Operating Services and Capital Projects These facilities needs are a portion of the City’s overall capital needs. As such, the City can
reprioritize its CIP to provide more capacity for executing these facilities projects. The City can
also consider reducing operational costs. Reducing operational costs, which could take the form
of 10% reduction in services , as determined by Administration and Council, would yield
significant dollars (approximately $4.9 million per year), that could be allocated to capital
projects, and specifically facilities.
Considerations:
Reducing operational costs requires significant service cuts, which are likely to be felt by
residents.
The City is already anticipating future operating shortfalls—it is likely that these shortfalls
will consume any savings from a reduction in operating costs.
The City has already spent significant time prioritizing its capital projects. It is unknown
whether there are any projects that the City would be willing to waylay in favor of facilities.
NEXT STEPS
Several options for financing and funding facilities have been presented in the preceding pages.
It is clear that there is the necessary debt and funding capacity to make these projects feasible.
One next step may include modeling a few financing and funding packages from the options
presented to represent potential discrete funding packages for each option. To do this, a clear
picture of which financing and funding options, under what constraints, are palatable to the City
of Tukwila needs to be established.