Facilitating the Participation of Landlocked...
54
UNITED NATIONS CONFERENCE ON TRADE AND DEVELOPMENT Facilitating the Participation of Landlocked Developing Countries in Commodity Value Chains
Transcript of Facilitating the Participation of Landlocked...
U N I T E D N AT I O N S C O N F E R E N C E O N T R A D E A N D D E V E L O P M E N T
Facilitating the Participation of Landlocked Developing Countries in Commodity Value Chains
UNITED NATIONS CONFERENCE ON TRADE AND DEVELOPMENT
Facilitating the Participation of Landlocked Developing Countries
in Commodity Value Chains
UNITED NATIONS
New York and Geneva, 2015
Note
The designations employed and the presentation of the material do not imply the expression of any opinion on
the part of the United Nations concerning the legal status of any country, territory, city or area, or of authorities or
concerning the delimitation of its frontiers or boundaries.
Material in this publication may be freely quoted or reprinted, but acknowledgement is requested, together with a
copy of the publication containing the quotation or reprint to be sent to the UNCTAD secretariat.
All references to dollars are United States dollars.
UNCTAD/ALDC/2015/2
iii
Facilitating the Participation of Landlocked Developing Countries in Commodity Value Chains
Abstract
Landlocked developing countries (LLDCs) face multiple trade and development challenges. In addition to their
geographical predicaments and remoteness from international markets, most of these countries are commodity
dependent. Primary commodities accounted for more than half of the exports of 27 out of 32 LLDCs in 2011–2013,
and resource-based goods, that is to say, primary goods and resource-based manufactures, accounted for some
three quarters of all exports of goods and services of LLDCs as a group. During the same period, the median share of
exports represented by primary commodities among those countries stood at 84.7 per cent. From 1995 to 1997, the
same figure was 83.2 per cent. Hence, over time, the degree and extent of commodity dependence has increased in
those countries with little or no sign of diversification of exports. Further, they seem to be more commodity dependent
than transit developing countries and other developing countries: the median share in 2011–2014 among transit
countries was 76.7 per cent, compared with 66.2 per cent among other developing countries. The question is, to
what extent does the state of being landlocked keep LLDCs in the production and export of primary commodities?
According to work undertaken by UNCTAD, including in the context of the present study, although geographical
isolation and remoteness from international markets can pose formidable challenges to those countries, these are
not insurmountable.
The present study argues that despite the challenges, the case for diversification and structural economic
transformation remains more persuasive for LLDCs today than ever before. Empirical and historical evidence suggests
that diversification, value addition and retention are key to attaining overall development objectives. The study also
underscores the importance of joining regional and global commodity value chains and the urgency for those countries
to take advantage of their natural resources wealth by enacting sound development polices and strategies that put
productive capacities and structural economic transformation at the centre. The findings, conclusions and policy
recommendations contained herein are expected to highlight the plight of commodity-dependent LLDCs during the
forthcoming global summits and conferences, including the fourteenth session of the United Nations Conference on
Trade and Development.
Key words
Landlocked developing countries, commodity dependence, Vienna Programme of Action, regional and global
commodity value chains
iv
Facilitating the Participation of Landlocked Developing Countries in Commodity Value Chains
Acknowledgements
This publication is the final outcome of the project led by UNCTAD and the Common Fund for Commodities,
“Identifying growth opportunities and supporting measures to facilitate investment in commodity value chains in
landlocked countries” (UNCTAD/CFC/ILZSG/267). The project was formulated in the run-up to the second United
Nations Conference on Landlocked Developing Countries, held in Vienna, in November 2014. It was implemented
with the financial support of the Common Fund for Commodities, to which the UNCTAD secretariat wishes to express
its gratitude.
A team consisting of Mussie Delelegn, Benjamin McCarthy and Michael Bratt (consultant) led the implementation
of the project under the supervision of Tesfachew Taffere, Director of the Division for Africa, Least Developed Countries
and Special Programmes. Patrick Osakwe, Head, Trade and Poverty Branch, provided substantive and technical
input to the final outcome of the project. Regina Ogunyinka, Paulette Lacroix and Sylvie Guy provided secretarial
and administrative support to the project. Madasamyraja Rajalingam did the overall layout, graphics and desktop
publishing. The project team is also grateful to the editor of the publication, Lucy Délèze-Black, and to graphic
designers Nadège Hadjemian and Sophie Combette, for their continued support and engagement in the overall
implementation of the project.
As part of the project, a series of case studies were carried out. Lindani Ndlovu conducted a study on the mining
sectors of Botswana and Zambia, Stephen Golub and Stephanie Kestelman explored the cotton textile sector of
Uzbekistan, Enrique Varela examined the sugar sector of Paraguay and Davaasambuu Dalrai, the copper and coal
sector of Mongolia.
In collaboration with the Office of the High Representative for the Least Developed Countries, Landlocked
Developing Countries and Small Island Developing States (UN-OHRLLS) and the Common Fund for Commodities,
UNCTAD convened an expert meeting in New York, United States of America, in October 2014. The aim of the
meeting was to share the findings and conclusions of the case studies, successful experiences and best practices,
and the policy implications for LLDCs. The meeting was followed by a high-level policy dialogue on turning commodity
dependence into sustainable, inclusive and equitable economic growth for LLDCs, which was held in Vienna during
the second United Nations Conference on Landlocked Developing Countries.
Key policy recommendations emanating from the country case studies, the expert meeting and the high-
level policy dialogue fed into the final outcome document of the Conference: the Vienna Programme of Action for
Landlocked Developing Countries for the Decade 2014–2024. Highlights of lessons learned, successful experiences
and best practices from country case studies are also reflected in the present study in text-box format.
v
Facilitating the Participation of Landlocked Developing Countries in Commodity Value Chains
Contents
Abstract .............................................................................................................................................................. iii
Acknowledgements .............................................................................................................................................iv
Abbreviations .................................................................................................................................................... viii
I. Introduction ............................................................................................................................................................................... 1
II. The Role of Commodities in Landlocked Developing Countries ........................................................................... 4
A. Most landlocked developing countries are highly commodity dependent .................................................4
B. Does the type of commodities exported matter? .......................................................................................9
III. The Global Value Chain Perspective.............................................................................................................................. 12
IV. Improving the Participation of Landlocked Developing Countries in Commodity Value Chains: Focus Areas ............................................................................................................................................................................ 15
A. Trade facilitation .......................................................................................................................................18
B. Infrastructure ............................................................................................................................................23
C. Trade and investment policies ..................................................................................................................25
D. Productive capacities: Human capital, private sector development and national systems of innovation .................................................................................................................30
E. Institutions ................................................................................................................................................34
V. Conclusion ............................................................................................................................................................................... 37
Notes ................................................................................................................................................................................................. 40
Bibliography .................................................................................................................................................................................... 41

vi
Facilitating the Participation of Landlocked Developing Countries in Commodity Value Chains
Boxes
1. Transportation infrastructure can bring opportunities to Zambia’s copper industry ...................................23
2. Creating links between coal production and power generation in Mongolia ..............................................24
3. Botswana’s success in harnessing foreign direct investment to drive greater beneficiation ......................26
4. Economic zones to boost participation of Zambia in global value chains ..................................................33
5. Paraguay’s organic sugar industry ..............................................................................................................34
6. Institutions and economic management :The cotton sector of Uzbekistan ...............................................36
Figures
1. Share of top three products in landlocked developing countries, 2011–2013 .............................................6
2. Herfindahl-Hirschman indices and commodity dependence, average 2011–2013 ......................................6
3. Median share of commodities in total value added for landlocked developing countries, transit countries and other developing countries, 2003–2012 .....................................................................9
4. Share of employment in commodities in landlocked developing countries, transit countries and other developing countries, 2013 or latest year available ........................................10
5. Generic mining value chain .........................................................................................................................15
6. Complete generic cotton-clothing supply chain .........................................................................................16
7. Sugar cane production ................................................................................................................................17
8. Ease of trading across borders for landlocked developing countries, transit countries and other developing countries, 2014 or latest year available .........................................20
9. Logistics performance index indicators for landlocked developing countries, transit countries and other developing countries, 2013 or latest year available .........................................22
10. Good practices for trading across borders that are applied in landlocked developing countries, transit countries and other developing countries, 2013 .............................................................................22
11. Median state of road and rail systems in landlocked developing countries, transit countries and other developing countries, 2012 or latest year available ................................................................24
12. Trade openness in landlocked developing countries, transit countries and other developing countries, 2000–2013 ......................................................................................................26
13. Simple (a)(c) and weighted (b)(d) applied tariffs (medians) in landlocked developing countries, transit countries and other developing countries .....................................................................................27
14. Median share of foreign direct investment stock in gross domestic product in landlocked developing countries, transit countries and other developing countries, 2000–2013 or latest year available ................................................................................................................................27
15. Median investing across borders scores for landlocked developing countries, transit countries and other developing countries, 2009 ............................................................................29
16. Spending on education as a share of government expenditure (a) and research and development expenditure as a share of gross domestic product (b) in landlocked developing countries, transit countries and other developing countries, 2013 or latest year available ......................32
17. Median ease of doing business rankings for landlocked developing countries, transit countries and other developing countries, 2013 ............................................................................32
18. Median worldwide governance indicators for landlocked developing countries, transit countries and other developing countries, 2010–2013 ....................................................................35
vii
Facilitating the Participation of Landlocked Developing Countries in Commodity Value Chains
Tables
1. Summary of commodity dependence of landlocked developing countries based on exports ....................5
2. Level of technological sophistication in landlocked developing countries, 2010–2012 ...............................7
3. Top exports in individual landlocked developing countries, 2011–2013 ...................................................10
4. Top exports in landlocked developing countries as a group, 2011–2013 ..................................................11
5. Key factors for competitiveness in global value chains in agriculture and the extractive industries ..........14
6. State of trade facilitation in landlocked developing countries ....................................................................21

viii
Facilitating the Participation of Landlocked Developing Countries in Commodity Value Chains
Abbreviations
FDI foreign direct investment
GDP gross domestic product
HHI Herfindahl-Hirschman Index
LLDC landlocked developing country
LPI logistics performance index
OECD Organization for Economic Cooperation and Development
SITC Standard International Trade Classification
UNCTAD United Nations Conference on Trade and Development
1
Facilitating the Participation of Landlocked Developing Countries in Commodity Value Chains
I. Introduction
Landlocked developing countries1 face multiple trade and development challenges. In addition to their
geographical predicaments and remoteness from international markets, most of these countries are dependent on
commodities. The overall aim of this study is to identify the prospects for transforming the natural resources wealth
of these countries into inclusive and sustainable development. In particular, it aims to provide an understanding of
how the landlocked condition affects the capacity of a given country to develop its commodity sector in a sustainable
way. This includes identifying and critically examining growth opportunities and supporting measures to facilitate the
participation of LLDCs in regional and global commodity value chains.
This study argues that despite the challenges, the case for diversification and structural economic transformation
remains more persuasive for LLDCs today than ever before. The study also underscores the importance of joining
regional and global commodity value chains and the urgency for LLDCs to take advantage of their natural resources
wealth by enacting sound development polices and strategies that make productive capacities and structural
economic transformation a priority. The findings, conclusions and policy recommendations contained herein are
expected to highlight the plight of commodity-dependent LLDCs during the forthcoming global summits and
conferences, including the fourteenth session of the United Nations Conference on Trade and Development.
A simple comparison can be made of two neighbouring countries. Both are developing countries with populations
of around 10 million people. Both are exporters of agricultural commodities. Both have stable political systems and
share similarities with regard to productive capacities, governance and institutions, hence their comparable scores
on the World Bank’s Ease of Doing Business index and other such measurement tools. It can be assumed that the
two economies are almost alike, except in one important respect: one is a landlocked country, the other is not. What
economy is richer or, at least, has a greater potential of achieving high growth rates?
A fair guess would be the country with a coastline. Many would easily make such a conjecture. Adam Smith,
for example, devotes a large part of book 1, chapter 3, of An Inquiry into the Nature and Causes of the Wealth
of Nations to discussing the advantages of coastal areas compared with the inland parts of a country. This is
not to say that geography is destiny and that the state of being landlocked dooms a country to poverty. Indeed,
people are often quick to point out that the development of Austria, Switzerland and other landlocked developed
European countries has not suffered from the lack of coastlines. There is no denying this fact. Yet, it is also true
that a disproportionately large number of the poorest developing countries are landlocked. Why is that? The short
answer is that being landlocked reduces access to markets by way of greater trade costs. For one thing, the lower
cost of sea transportation compared with land transportation implies greater-than-average transportation costs
for landlocked countries. Because both import and export flows are affected, this can have a negative impact on
landlocked countries’ potential to participate in global value chains and reap the benefits of international fragmentation
of production. For another, being landlocked implies a dependence on neighbours for transit. The administrative
costs of crossing borders, the state of infrastructure in neighbouring countries with coastlines and political relations
between the landlocked countries and their maritime neighbours are factors that have a bearing on landlocked
countries’ access to international markets.2
The socioeconomic situation in LLDCs has been recently analysed in UN-OHRLLS (2013). The report finds
that LLDCs lag behind coastal developing countries and transit-developing countries on virtually every dimension
explored – overall macroeconomic performance, trade and structural diversification, trade facilitation, infrastructure,
human development, quality of governance and the environment. It also seeks to estimate the development cost of
being landlocked, that is to say, how much poorer LLDCs are as a result of their landlocked nature. It is found that the
average level of development in LLDCs is 20 per cent lower than in the average coastal developing country and that
the negative impact ranges from 10–30 per cent.
Noting the specific challenges facing LLDCs, the international community held the second United Nations
Conference on Landlocked Developing Countries in Vienna in November 2014 and adopted the Vienna Programme
of Action for Landlocked Developing Countries for the Decade 2014–2024 (A/CONF.225/L.1 and annex). The Vienna
Programme of Action is a successor to the Almaty Programme of Action (2003). The overarching goal of the Vienna
Programme of Action is “to address the special development needs and challenges of landlocked developing
countries arising from their lack of access to the sea, remoteness and geographical constraints in a more coherent
manner and thus contribute to an enhanced rate of sustainable and inclusive growth, which can contribute to the
2
Facilitating the Participation of Landlocked Developing Countries in Commodity Value Chains
eradication of poverty by moving towards the goal of ending extreme poverty” (para. 21). As such, it has six priorities
for action (section V):
(a) Fundamental transit policy issues;
(b) Infrastructure development and maintenance:
(i) Transport infrastructure;
(ii) Energy and information and communications technology infrastructure;
(c) International trade and trade facilitation:
(i) International trade;
(ii) Trade facilitation;
(d) Regional integration and cooperation;
(e) Structural economic transformation;
(f) Means of implementation.
Yet, being landlocked is but one feature of LLDCs that can impede their development. Another is a widespread
reliance on commodities. For instance, primary commodities accounted for more than half of the exports of 27
out of 32 LLDCs in 2011–2014 and resource-based goods — that is to say, primary goods and resource-based
manufactures – accounted for some three quarters of all exports of goods and services of LLDCs as a group.
Similarly, with regard to foreign direct investment (FDI), data on mergers and acquisitions and greenfield investment
show that minerals and gas is one of two sectors — the other sector being telecommunications – that has received
the highest shares of investment in the past decade in LLDCs (UNCTAD, 2014). Such a heavy dependence on
commodities could pose several challenges. For one thing, there is the contention that the terms of trade between
commodities and manufactures is on a long-term decline, meaning that the prices of commodity exports are on a
falling trend relative to those of manufactures (the Prebisch-Singer hypothesis). For another, there is the issue of price
volatility, which is particularly prevalent and problematic in the case of commodities. A third concern is that natural
resources wealth can result in rent-seeking behaviour, with negative consequences on corruption and governance.
In addition, there is the Dutch disease phenomenon, whereby a sudden increase in foreign exchange earnings from
natural resources leads to an appreciation of the country’s real exchange rate and, as a result, makes other exports
less competitive in the international market.3 However — as with the state of being landlocked — there is nothing
inevitable about the impact of commodities on development, and the relationship is more complex than it might
appear at first glance. Natural resources are therefore, in the words of a World Bank publication, “neither curse nor
destiny” (Lederman and Maloney, 2007). Regardless of the theoretical arguments and empirical results about the
existence of a natural resource curse and the doubts cast upon these, the reality is that many LLDCs are commodity
dependent. Thus, the most relevant question is, how can they use and develop their available productive capacities
to grow their economies sustainably and reduce poverty?
Overall, many LLDCs find themselves mired in two of the four poverty traps highlighted in Collier (2008): landlocked,
with difficult political relations with transit neighbours, and the natural resource trap.4 What is more, the dual problem
of being landlocked and commodity dependent compounds development challenges because the high weight-to-
value ratios often associated with primary products entail higher-than-average transit and transport costs. The present
study addresses these two problems conjointly. Its main objective is to shed light on how commodity-dependent
LLDCs can develop their commodity sectors in a sustainable way. It seeks to identify and articulate the most pressing
challenges, priorities and opportunities to enhance the role of commodities in the economic development of LLDCs.
In this regard, particular attention is paid to the role of LLDCs in commodity value chains and ways in which
their participation in global value chains can be enhanced. The commodities sector is crucial for the economic
revival, growth and sustained development of LLDCs. Hence, putting commodity-based policies at the heart of
their development policies, including in the context of the post-Almaty Programme of Action and the post-2015
development agenda, is crucially important. The commodities sector, if better managed and with value addition and
retention, can be a decisive contributor to building productive capacities, accelerating structural transformation and
generating decent jobs with an impact on poverty reduction. Therefore, the present study is also expected to make
a substantive contribution to enrich the Vienna Programme of Action.
For analytical and comparative purposes, the study follows the classification of LLDCs provided by UN-OHRLLS.
According to this, there are 32 LLDCs spread out over four continents:
3
Facilitating the Participation of Landlocked Developing Countries in Commodity Value Chains
• Africa (16 countries): Botswana, Burkina Faso, Burundi, the Central African Republic, Chad, Ethiopia, Lesotho,
Malawi, Mali, the Niger, Rwanda, South Sudan, Swaziland, Uganda, Zambia and Zimbabwe;
• Asia (10 countries): Afghanistan, Bhutan, Kazakhstan, Kyrgyzstan, the Lao People’s Democratic Republic,
Mongolia, Nepal, Tajikistan, Turkmenistan and Uzbekistan;
• Europe (4 countries): Armenia, Azerbaijan, the Republic of Moldova and the former Yugoslav Republic of
Macedonia;
• South America (2 countries): the Plurinational State of Bolivia5 and Paraguay.
As understanding the economic structure and performance of LLDCs is essential for any analysis of what challenges
they face and how they can develop their commodity sectors, the next section sets the scene by presenting various
indicators on the role of commodities in LLDC economies. The section is thus quantitative in nature. Section III
provides a brief introduction to the global value chain perspective and the main issues it raises. Section IV examines
five focus areas from the perspective of commodity-dependent LLDCs aiming to participate and upgrade in global
value chains: trade facilitation, infrastructure, trade and investment policies, productive capacities, and institutions. It
discusses the key issues, presents brief data on LLDC performance against relevant indicators and considers best
practices and lessons learned. Section V concludes the discussion and provides policy recommendations.
4
Facilitating the Participation of Landlocked Developing Countries in Commodity Value Chains
II. The Role Of Commodities in Landlocked Developing Countries
How important are commodities for LLDCs and their socioeconomic development? There are several ways to
assess the role of commodities that nonetheless all point to the same general conclusion: they are indeed very
important. This section provides justification for treating the state of being landlocked and commodity dependence
as a problem in its own right. It does this in a straightforward descriptive fashion, namely by exploring the share of
commodities in the export baskets of LLDCs, the extent to which these countries are resource-based economies,
how much of their labour force is engaged in the production of commodities and other such indicators. The section
also discusses what specific commodities are important, in which countries, and how, if at all, LLDCs are different in
the context of the commodity problem.
A. MOST LANDLOCKED DEVELOPING COUNTRIES ARE HIGHLY COMMODITY DEPENDENT
Commodities exports are a good starting point to start to get a sense of the importance of natural resources
to LLDCs. If 60 per cent of a country’s merchandise exports are commodities, 6 a country is considered to be
commodity dependent (UNCTAD, 2013a). Based on this definition, no fewer than 247 of 32 LLDCs are commodity
dependent, according to export data in 2011–2013. The number of commodity-dependent countries increases to
27 if the 50 per cent share in export is considered a benchmark, and the role of resources-based goods in their
economies is borne in mind. That is, primary commodities represented more than half of the exports of 27 LLDCs
in 2011–2013, and resource-based goods (primary goods and resource-based manufactures) now account for
about three quarters of all exports of goods and services of LLDCs as a group. The median LLDC by this measure
is, therefore, commodity dependent, with 84.7 per cent of its exports represented by primary commodities. The
shares across all LLDCs range from 28–97.7 per cent (table 1). Trends over the past couple of decades indicate
that commodity dependence among LLDCs seems to have been fairly stable. Twenty-four LLDCs were commodity
dependent in 1995–1997, with a median share of commodities in all exports standing at 83.2 per cent. In 2011–2013
the figure stood at 84.5 per cent. Compared with other country classifications, LLDCs seem to be more commodity
dependent than both transit (developing) countries and other developing countries: the median share in 2011–2013
among transit countries was 76.7 per cent and among other developing countries, 66.2 per cent.8 As pointed out by
several authors (Osakwe, 2007; Redding and Venables, 2003; Radelet and Sachs, 1998), the main and perhaps the
most puzzling question is whether being landlocked per se is a barrier for diversification and whether it is the main
obstacle to export diversification. As long as transit transport costs are relatively higher in those countries, a growing
body of literature suggests that these countries will be in a disadvantaged position to pass the hurdles of export
competitiveness in manufacturing activities. Hence, directly or indirectly, geography dictates the choice of export
structure and performance by making export diversification more challenging for LLDCs. However, intuition and
logic dictate that specializing in exports of primary commodities will not make them competitive either because of
the low-value high-volume export structure. Further, countries that are making progress in attaining the objectives of
sustained growth, development and poverty reduction are those that have managed to break away from the vicious
circle of commodity dependence and underdevelopment. Therefore, it is critical for LLDCs to continually assess
the costs and benefits of their respective export structures and performance from the perspectives of their wider
development goals and objectives. The key lesson to be drawn from the experiences of countries such as Botswana
is that better development policies centred on structural economic transformation and productive capacities, including
diversification and technological sophistication of exports, capable institutions to implement such policies, sound
economic management and political governance as well as sociopolitical stability, can assist LLDCs in achieving their
overall development objectives (Lewin, 2011) This does not mean, however, that Botswana has a fully diversified or
structurally transformed economy. Although it has made substantial progress in effectively using its natural resources
wealth for the socioeconomic well-being and empowerment of its citizens, the country is still heavily dependent on
the mineral sector. The country case study of Botswana shows that diamonds are the leading mineral and that the
revenues earned from diamond sales represent more than 90 per cent of all mining activities.
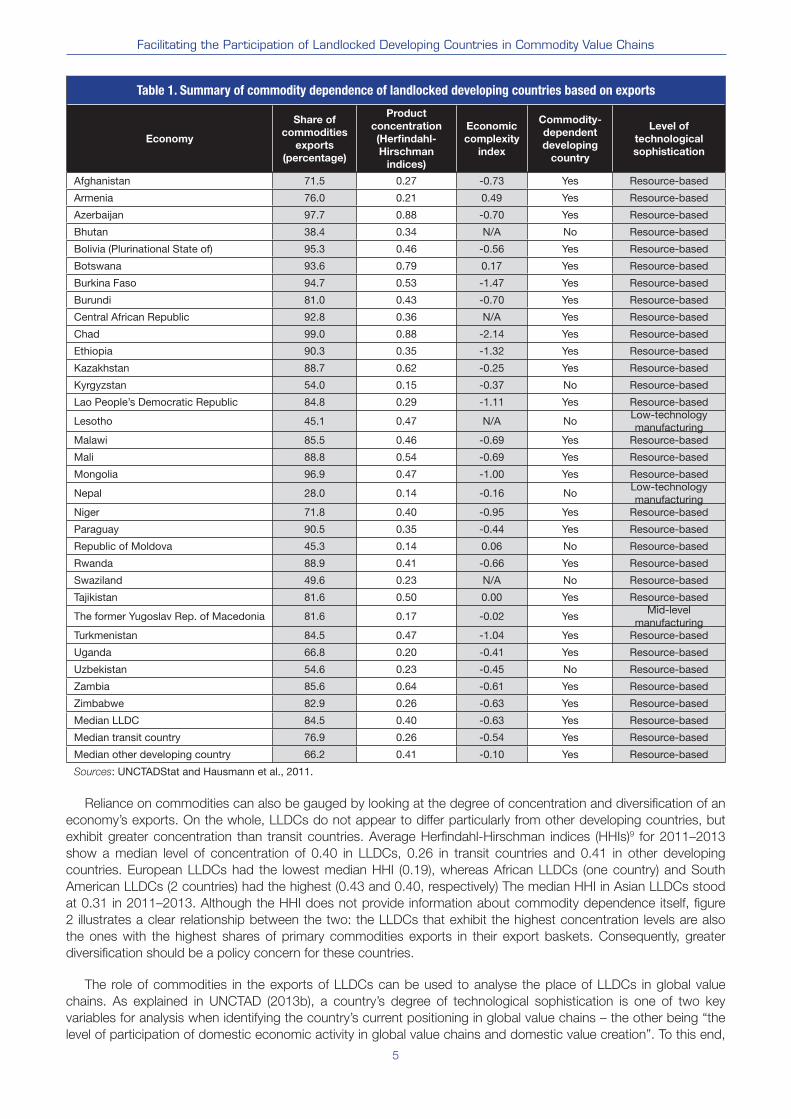
In addition to the share of commodities in exports, a similar indicator that is useful when considering the role
of commodities is the composition of the leading products in LLDCs, where, as shown in figure 1, commodities
dominate: the top three exports of 19 LLDCs in 2011–2013 were all commodities. In comparison, in eight LLDCs,
two of the three leading exports were commodities; in two LLDCs, one of the top exports was a commodity; and
in two, none of the leading exports were commodities. In terms of shares, the top three exports often account for
particularly large proportions of total trade in those LLDCs classified as commodity dependent.
5
Facilitating the Participation of Landlocked Developing Countries in Commodity Value Chains
Table 1. Summary of commodity dependence of landlocked developing countries based on exports
Economy
Share of
commodities
exports
(percentage)
Product
concentration
(Herfindahl-
Hirschman
indices)
Economic
complexity
index
Commodity-
dependent
developing
country
Level of
technological
sophistication
Afghanistan 71.5 0.27 -0.73 Yes Resource-based
Armenia 76.0 0.21 0.49 Yes Resource-based
Azerbaijan 97.7 0.88 -0.70 Yes Resource-based
Bhutan 38.4 0.34 N/A No Resource-based
Bolivia (Plurinational State of) 95.3 0.46 -0.56 Yes Resource-based
Botswana 93.6 0.79 0.17 Yes Resource-based
Burkina Faso 94.7 0.53 -1.47 Yes Resource-based
Burundi 81.0 0.43 -0.70 Yes Resource-based
Central African Republic 92.8 0.36 N/A Yes Resource-based
Chad 99.0 0.88 -2.14 Yes Resource-based
Ethiopia 90.3 0.35 -1.32 Yes Resource-based
Kazakhstan 88.7 0.62 -0.25 Yes Resource-based
Kyrgyzstan 54.0 0.15 -0.37 No Resource-based
Lao People’s Democratic Republic 84.8 0.29 -1.11 Yes Resource-based
Lesotho 45.1 0.47 N/A NoLow-technology manufacturing
Malawi 85.5 0.46 -0.69 Yes Resource-based
Mali 88.8 0.54 -0.69 Yes Resource-based
Mongolia 96.9 0.47 -1.00 Yes Resource-based
Nepal 28.0 0.14 -0.16 NoLow-technology manufacturing
Niger 71.8 0.40 -0.95 Yes Resource-based
Paraguay 90.5 0.35 -0.44 Yes Resource-based
Republic of Moldova 45.3 0.14 0.06 No Resource-based
Rwanda 88.9 0.41 -0.66 Yes Resource-based
Swaziland 49.6 0.23 N/A No Resource-based
Tajikistan 81.6 0.50 0.00 Yes Resource-based
The former Yugoslav Rep. of Macedonia 81.6 0.17 -0.02 YesMid-level
manufacturingTurkmenistan 84.5 0.47 -1.04 Yes Resource-based
Uganda 66.8 0.20 -0.41 Yes Resource-based
Uzbekistan 54.6 0.23 -0.45 No Resource-based
Zambia 85.6 0.64 -0.61 Yes Resource-based
Zimbabwe 82.9 0.26 -0.63 Yes Resource-based
Median LLDC 84.5 0.40 -0.63 Yes Resource-based
Median transit country 76.9 0.26 -0.54 Yes Resource-based
Median other developing country 66.2 0.41 -0.10 Yes Resource-based
Sources: UNCTADStat and Hausmann et al., 2011.
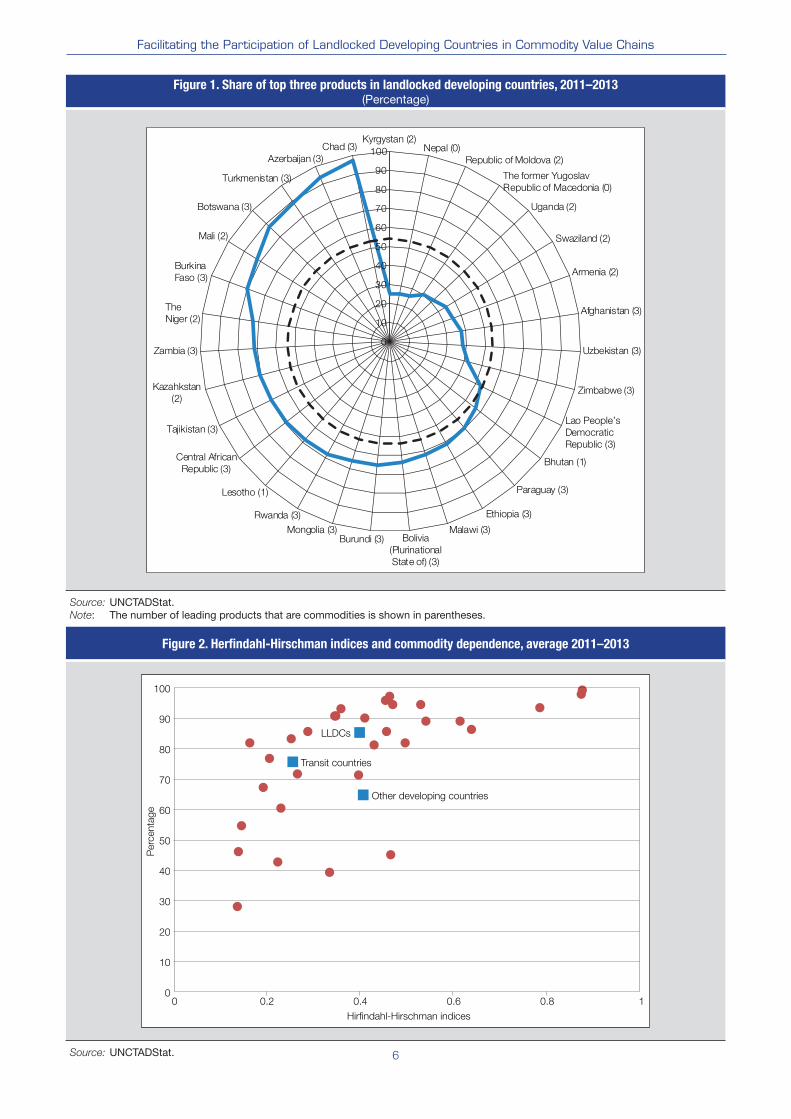
Reliance on commodities can also be gauged by looking at the degree of concentration and diversification of an
economy’s exports. On the whole, LLDCs do not appear to differ particularly from other developing countries, but
exhibit greater concentration than transit countries. Average Herfindahl-Hirschman indices (HHIs)9 for 2011–2013
show a median level of concentration of 0.40 in LLDCs, 0.26 in transit countries and 0.41 in other developing
countries. European LLDCs had the lowest median HHI (0.19), whereas African LLDCs (one country) and South
American LLDCs (2 countries) had the highest (0.43 and 0.40, respectively) The median HHI in Asian LLDCs stood
at 0.31 in 2011–2013. Although the HHI does not provide information about commodity dependence itself, figure
2 illustrates a clear relationship between the two: the LLDCs that exhibit the highest concentration levels are also
the ones with the highest shares of primary commodities exports in their export baskets. Consequently, greater
diversification should be a policy concern for these countries.
The role of commodities in the exports of LLDCs can be used to analyse the place of LLDCs in global value
chains. As explained in UNCTAD (2013b), a country’s degree of technological sophistication is one of two key
variables for analysis when identifying the country’s current positioning in global value chains – the other being “the
level of participation of domestic economic activity in global value chains and domestic value creation”. To this end,
6
Facilitating the Participation of Landlocked Developing Countries in Commodity Value Chains
Figure 1. Share of top three products in landlocked developing countries, 2011–2013(Percentage)
0
10
20
30
40
50
60
70
80
90
100
Kyrgystan (2)Nepal (0)
Republic of Moldova (2)
The former Yugoslav
Republic of Macedonia (0)
Uganda (2)
Swaziland (2)
Armenia (2)
Afghanistan (3)
Uzbekistan (3)
Zimbabwe (3)
Lao People’s
Democratic
Republic (3)
Bhutan (1)
Paraguay (3)
Ethiopia (3)
Malawi (3)Bolivia
(Plurinational
State of) (3)
Burundi (3)Mongolia (3)
Rwanda (3)
Lesotho (1)
Central African
Republic (3)
Tajikistan (3)
Kazahkstan
(2)
Zambia (3)
The
Niger (2)
Burkina
Faso (3)
Mali (2)
Botswana (3)
Turkmenistan (3)
Azerbaijan (3)
Chad (3)
Source: UNCTADStat.Note: The number of leading products that are commodities is shown in parentheses.
Figure 2. Herfindahl-Hirschman indices and commodity dependence, average 2011–2013
LLDCs
Transit countries
Other developing countries
0
10
20
30
40
50
60
70
80
90
100
0 0.2 0.4 0.6 0.8 1
Perc
enta
ge
Hirfindahl-Hirschman indices
Source: UNCTADStat.
7
Facilitating the Participation of Landlocked Developing Countries in Commodity Value Chains
UNCTAD (2013b) builds on the work of Lall (2000) and presents a classification with five levels of technological
sophistication in the following ascending order: resource-based activities, low-technology manufacturing, mid-
level manufacturing, sophisticated manufacturing and knowledge-based services. There are two main differences
between the classification of Lall (2000) and UNCTAD (2013b). First, whereas Lall makes a distinction between
primary products and resource-based manufactures, UNCTAD (2013b) combines the two categories into a single
one: resource-based exports.10 Second, services are not featured in Lall (2000), while UNCTAD (2013b) introduces
knowledge-based services at the apex of value chains. Knowledge-based services encompass insurance, financial
services, computer and information services, royalties and licence fees, and other business services.
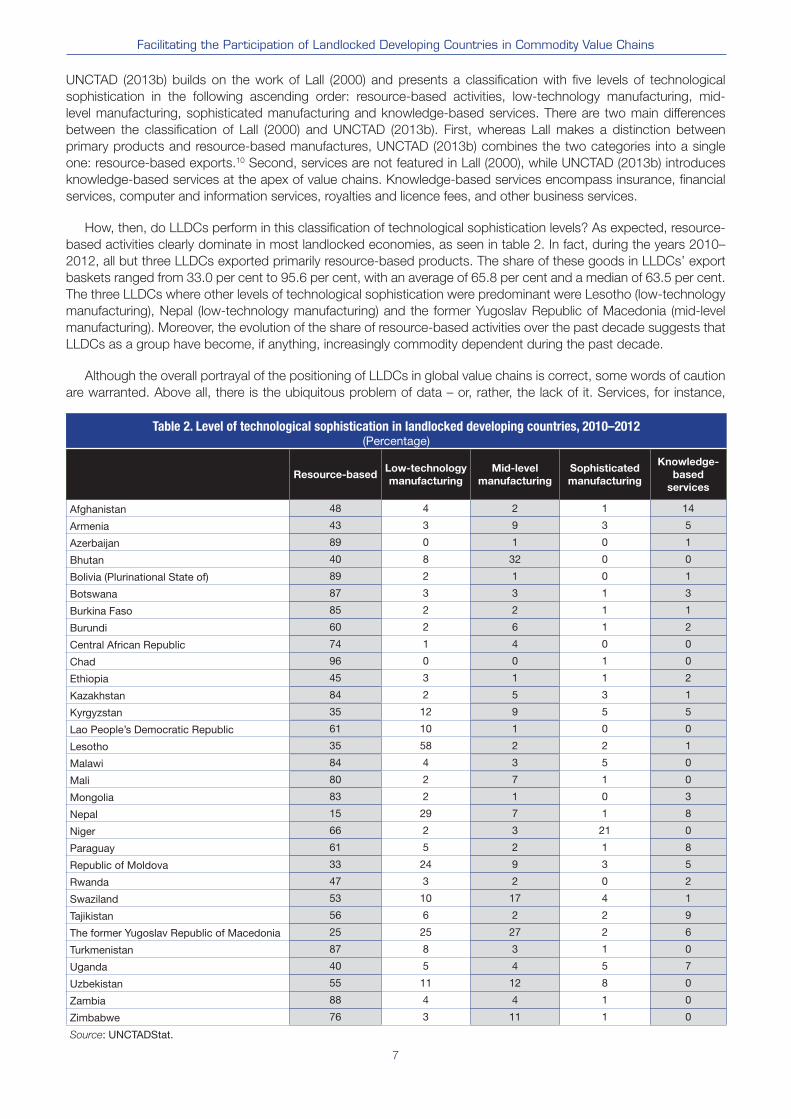
How, then, do LLDCs perform in this classification of technological sophistication levels? As expected, resource-
based activities clearly dominate in most landlocked economies, as seen in table 2. In fact, during the years 2010–
2012, all but three LLDCs exported primarily resource-based products. The share of these goods in LLDCs’ export
baskets ranged from 33.0 per cent to 95.6 per cent, with an average of 65.8 per cent and a median of 63.5 per cent.
The three LLDCs where other levels of technological sophistication were predominant were Lesotho (low-technology
manufacturing), Nepal (low-technology manufacturing) and the former Yugoslav Republic of Macedonia (mid-level
manufacturing). Moreover, the evolution of the share of resource-based activities over the past decade suggests that
LLDCs as a group have become, if anything, increasingly commodity dependent during the past decade.
Although the overall portrayal of the positioning of LLDCs in global value chains is correct, some words of caution
are warranted. Above all, there is the ubiquitous problem of data – or, rather, the lack of it. Services, for instance,
Table 2. Level of technological sophistication in landlocked developing countries, 2010–2012(Percentage)
Resource-basedLow-technology
manufacturing
Mid-level
manufacturing
Sophisticated
manufacturing
Knowledge-
based
services
Afghanistan 48 4 2 1 14
Armenia 43 3 9 3 5
Azerbaijan 89 0 1 0 1
Bhutan 40 8 32 0 0
Bolivia (Plurinational State of) 89 2 1 0 1
Botswana 87 3 3 1 3
Burkina Faso 85 2 2 1 1
Burundi 60 2 6 1 2
Central African Republic 74 1 4 0 0
Chad 96 0 0 1 0
Ethiopia 45 3 1 1 2
Kazakhstan 84 2 5 3 1
Kyrgyzstan 35 12 9 5 5
Lao People’s Democratic Republic 61 10 1 0 0
Lesotho 35 58 2 2 1
Malawi 84 4 3 5 0
Mali 80 2 7 1 0
Mongolia 83 2 1 0 3
Nepal 15 29 7 1 8
Niger 66 2 3 21 0
Paraguay 61 5 2 1 8
Republic of Moldova 33 24 9 3 5
Rwanda 47 3 2 0 2
Swaziland 53 10 17 4 1
Tajikistan 56 6 2 2 9
The former Yugoslav Republic of Macedonia 25 25 27 2 6
Turkmenistan 87 8 3 1 0
Uganda 40 5 4 5 7
Uzbekistan 55 11 12 8 0
Zambia 88 4 4 1 0
Zimbabwe 76 3 11 1 0
Source: UNCTADStat.
8
Facilitating the Participation of Landlocked Developing Countries in Commodity Value Chains
present several measurement problems and some years do not even include data on services exports. Another issue
is that the four merchandise levels of the classification are based on 251 product codes that need not necessarily
correspond to the actual level of technological sophistication in a country or, at least, are not revelatory. To take
an extreme example, the exports of Norway are, according to this measure, highly resource based and, although
petroleum accounts for roughly half of its exports of goods and services, it would, however, be false to position it at
the lowest end of the technological sophistication scale.
Even so, and to reiterate, the analysis is certainly valuable and provides further support to the broader message
that LLDCs’ exports are predominantly resource based and that the exports are often positioned at the lower ends
of global value chains. More importantly, the examination of the levels of technological sophistication of LLDCs has
some tangible policy implications. In the context of commodity-dependent LLDCs in particular, it is worth citing
UNCTAD (2013b) as follows:
For countries with a resource-based economy, GVC [global value chain] development typically implies increasing
GVC participation through diversification into more fragmented value chains and increased exports of intermediate
goods and services, often starting with manufacturing exports at the lower end of technological sophistication, on
the basis of low-cost labour. This pattern mostly results in increased GVC participation and a lower share of domestic
value added in exports (but higher absolute levels of domestic value added creation). Alternatively, GVC development
for resource-based economies can occur by attracting investment in processing activities, increasing domestic value
added, where advantages from proximity to resources outweigh economies of scale.
Another export-based measure of interest is the economic complexity index, which seeks to measure the collective
embedded productive knowledge in an economy by calculating the diversity and ubiquity of the products it exports.
Diversity refers to “the number of distinct products that [a country] makes” and ubiquity is defined “as the number of
countries that make a product” (Hausmann et al., 2011). The resulting economic complexity index is a value that can
be either negative or positive, where a higher value implies greater economic complexity. Hausmann et al. show that
there is a positive relationship between the degree of economic complexity and gross domestic product (GDP) per
capita and that the index is a good predictor of future economic growth. The economic complexity index is, therefore,
a measure with policy relevance.
A look at the economic complexity indices of LLDCs (table 1, column 4) shows that their economies tend towards
less complexity: only three11 of the 27 LLDCs featured in the index had positive economic complexity index values
during 2010–2012. A comparison with other country groups confirms this point, as the median of the LLDC group
was considerably lower than the respective medians of all transition and developing countries. Moreover, as expected,
the economic complexity index suggests that LLDCs that are classified as commodity dependent have, overall, less
complex economies than LLDCs that are not. Given the positive link between economic complexity and income, it
is clear that LLDCs should explore ways in which to increase the embedded productive knowledge – product space
– in their societies, which will in turn lead to structural economic transformation. This is easier said than done and
will be revisited in the subsequent sections of this paper. The basic approach advocated by Hausmann et al. (2011)
may nonetheless be stated here: countries are more likely to succeed “if they focus on products that are close to
their current set of productive capabilities”. In other words, LLDCs should build on their strengths and concentrate on
moving into products that require knowledge similar to that of the goods being currently produced.
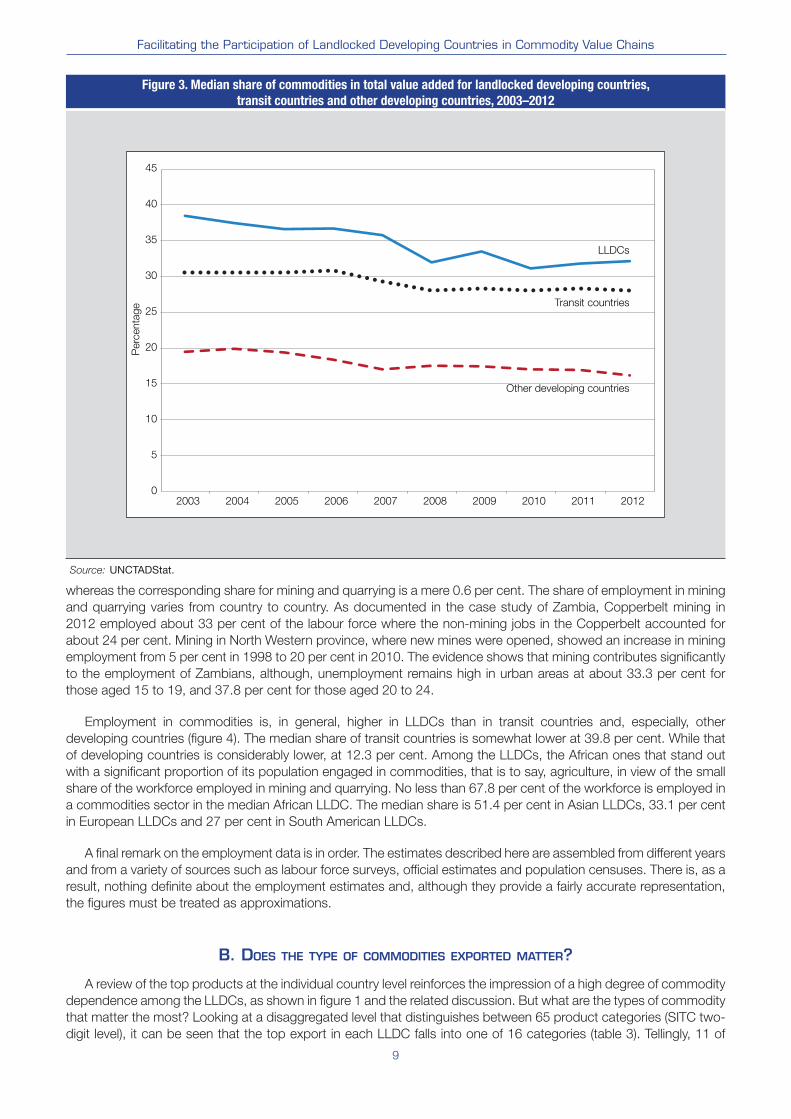
This section has focused so far on export-related indicators to get a sense of the importance of commodities
for LLDCs. Another way to assess the role of natural resources is to look at value added. Commodities contributed
roughly one third to LLDCs’ total value added in 2010–2012, with a median share of 30.1 per cent. The median share
of agriculture during the period was 20.4 per cent; that of mining and utilities was 4.7 per cent.12 Across the LLDCs,
the contribution of commodities ranged from 9.2 per cent (Swaziland) to 61.5 per cent (Azerbaijan). The value added
of agriculture exceeded that of mining and utilities in 23 of the 32 LLDCs. Figure 3, which examines the development
over time in comparison with various country groups, shows that LLDCs are among the three constellations that have
experienced the biggest drops in the share of commodities to total value added. Mainly African and Asian LLDCs
have experienced declining shares of commodities value added in the past decade.
Employment data provide another perspective on the role of commodities in LLDCs and serve as a pointed
reminder of the importance of agriculture to the livelihoods of large parts of the population. Data on 22 LLDCs 13 for
the latest year available reveal that 43.6 per cent of the total workforce in the median country works in agriculture or
mining and quarrying, with almost all engaged in the former. The median stands at 43.6 per cent, and the range varies
from a low of 19.5 per cent (the former Yugoslav Republic of Macedonia) to a high of 78.9 per cent (Burkina Faso). As
expected, agriculture employs the most people by far: the median share for agricultural employment is 40 per cent,
9
Facilitating the Participation of Landlocked Developing Countries in Commodity Value Chains
Figure 3. Median share of commodities in total value added for landlocked developing countries,
transit countries and other developing countries, 2003–2012
0
5
10
15
20
25
30
35
40
45
2003 2004 2005 2006 2007 2008 2009 2010 2011 2012
Perc
enta
ge
LLDCs
Transit countries
Other developing countries
Source: UNCTADStat.
whereas the corresponding share for mining and quarrying is a mere 0.6 per cent. The share of employment in mining
and quarrying varies from country to country. As documented in the case study of Zambia, Copperbelt mining in
2012 employed about 33 per cent of the labour force where the non-mining jobs in the Copperbelt accounted for
about 24 per cent. Mining in North Western province, where new mines were opened, showed an increase in mining
employment from 5 per cent in 1998 to 20 per cent in 2010. The evidence shows that mining contributes significantly
to the employment of Zambians, although, unemployment remains high in urban areas at about 33.3 per cent for
those aged 15 to 19, and 37.8 per cent for those aged 20 to 24.
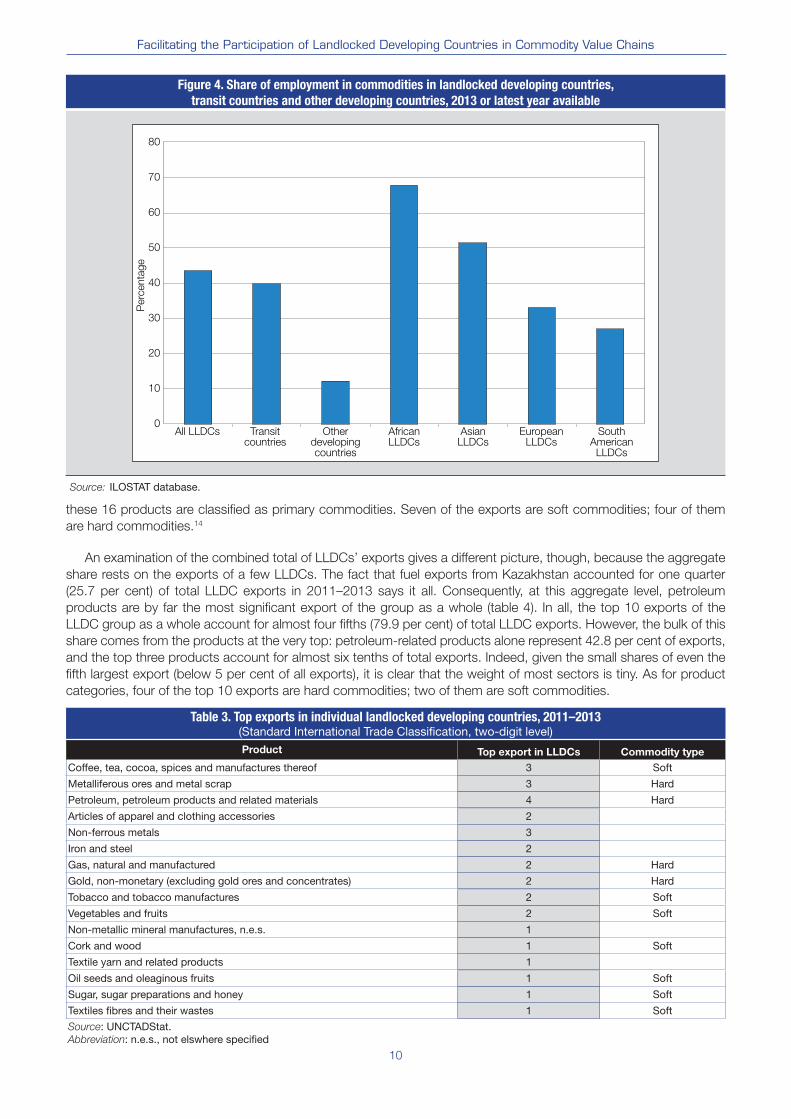
Employment in commodities is, in general, higher in LLDCs than in transit countries and, especially, other
developing countries (figure 4). The median share of transit countries is somewhat lower at 39.8 per cent. While that
of developing countries is considerably lower, at 12.3 per cent. Among the LLDCs, the African ones that stand out
with a significant proportion of its population engaged in commodities, that is to say, agriculture, in view of the small
share of the workforce employed in mining and quarrying. No less than 67.8 per cent of the workforce is employed in
a commodities sector in the median African LLDC. The median share is 51.4 per cent in Asian LLDCs, 33.1 per cent
in European LLDCs and 27 per cent in South American LLDCs.
A final remark on the employment data is in order. The estimates described here are assembled from different years
and from a variety of sources such as labour force surveys, official estimates and population censuses. There is, as a
result, nothing definite about the employment estimates and, although they provide a fairly accurate representation,
the figures must be treated as approximations.
B. DOES THE TYPE OF COMMODITIES EXPORTED MATTER?
A review of the top products at the individual country level reinforces the impression of a high degree of commodity
dependence among the LLDCs, as shown in figure 1 and the related discussion. But what are the types of commodity
that matter the most? Looking at a disaggregated level that distinguishes between 65 product categories (SITC two-
digit level), it can be seen that the top export in each LLDC falls into one of 16 categories (table 3). Tellingly, 11 of
10
Facilitating the Participation of Landlocked Developing Countries in Commodity Value Chains
Table 3. Top exports in individual landlocked developing countries, 2011–2013 (Standard International Trade Classification, two-digit level)
Product Top export in LLDCs Commodity type
Coffee, tea, cocoa, spices and manufactures thereof 3 Soft
Metalliferous ores and metal scrap 3 Hard
Petroleum, petroleum products and related materials 4 Hard
Articles of apparel and clothing accessories 2
Non-ferrous metals 3
Iron and steel 2
Gas, natural and manufactured 2 Hard
Gold, non-monetary (excluding gold ores and concentrates) 2 Hard
Tobacco and tobacco manufactures 2 Soft
Vegetables and fruits 2 Soft
Non-metallic mineral manufactures, n.e.s. 1
Cork and wood 1 Soft
Textile yarn and related products 1
Oil seeds and oleaginous fruits 1 Soft
Sugar, sugar preparations and honey 1 Soft
Textiles fibres and their wastes 1 Soft
Source: UNCTADStat.Abbreviation: n.e.s., not elswhere specified
these 16 products are classified as primary commodities. Seven of the exports are soft commodities; four of them
are hard commodities.14
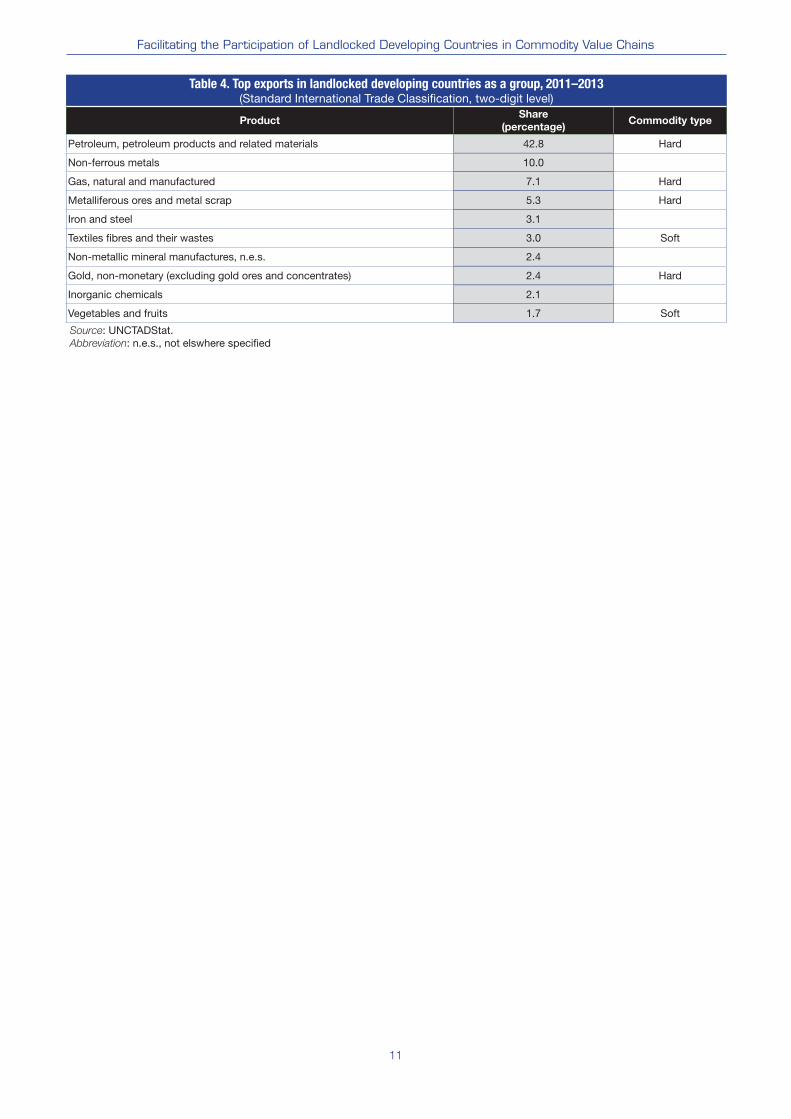
An examination of the combined total of LLDCs’ exports gives a different picture, though, because the aggregate
share rests on the exports of a few LLDCs. The fact that fuel exports from Kazakhstan accounted for one quarter
(25.7 per cent) of total LLDC exports in 2011–2013 says it all. Consequently, at this aggregate level, petroleum
products are by far the most significant export of the group as a whole (table 4). In all, the top 10 exports of the
LLDC group as a whole account for almost four fifths (79.9 per cent) of total LLDC exports. However, the bulk of this
share comes from the products at the very top: petroleum-related products alone represent 42.8 per cent of exports,
and the top three products account for almost six tenths of total exports. Indeed, given the small shares of even the
fifth largest export (below 5 per cent of all exports), it is clear that the weight of most sectors is tiny. As for product
categories, four of the top 10 exports are hard commodities; two of them are soft commodities.
Figure 4. Share of employment in commodities in landlocked developing countries,
transit countries and other developing countries, 2013 or latest year available
Perc
enta
ge
0
10
20
30
40
50
60
70
80
All LLDCs Transitcountries
Otherdevelopingcountries
AfricanLLDCs
AsianLLDCs
EuropeanLLDCs
SouthAmerican
LLDCs
Source: ILOSTAT database.
11
Facilitating the Participation of Landlocked Developing Countries in Commodity Value Chains
Table 4. Top exports in landlocked developing countries as a group, 2011–2013 (Standard International Trade Classification, two-digit level)
ProductShare
(percentage)Commodity type
Petroleum, petroleum products and related materials 42.8 Hard
Non-ferrous metals 10.0
Gas, natural and manufactured 7.1 Hard
Metalliferous ores and metal scrap 5.3 Hard
Iron and steel 3.1
Textiles fibres and their wastes 3.0 Soft
Non-metallic mineral manufactures, n.e.s. 2.4
Gold, non-monetary (excluding gold ores and concentrates) 2.4 Hard
Inorganic chemicals 2.1
Vegetables and fruits 1.7 Soft
Source: UNCTADStat.Abbreviation: n.e.s., not elswhere specified
12
Facilitating the Participation of Landlocked Developing Countries in Commodity Value Chains
III. The Global Value Chain Perspective
Global value chains have been receiving increasing attention by analysts in recent years. There has been a
veritable explosion of articles and reports devoted to the implications of global value chains for trade, investment
and development. This literature describes and analyses the features of today’s international production networks
and how their fragmented nature differs from before. Whereas previously the various activities in a value chain would
primarily be carried out within one country, the information technology revolution and falling trade costs have led to
task dispersion on a global scale. This rise of global value chains has been referred to as the “second unbundling” (for
example, Baldwin, 2011), where the first unbundling was the geographical separation of production and consumption
that began with the advent of steam power. The second unbundling relates to the geographical breaking up of
production that has taken place since the mid-1980s. Thus, the international production networks of today are
characterized by a worldwide web of value chains, each of which contains activities that are carved up and linked
together as if in a global factory. Small wonder, then, that the World Trade Organization has called its initiative dealing
with trade in value added “Made in the World”.15 The global dimension of global value chains needs to be qualified,
though, since some industries are by their very nature more conducive to global fragmentation, while others are more
likely to give rise to regional value chains (the electronics and automotive industries are often seen as two contrasting
examples). As it is beyond the scope of this report to provide a comprehensive literature review on global value
chains, a summary treatment of the most relevant issues for commodity-dependent LLDCs is given below.
Global value chain analysis is based on the notion that “[f]irms, not nations, compete in international markets”,
as Porter (1998) put it in his seminal book, The Competitive Advantage of Nations. This is obviously not to say that
countries and national policies are irrelevant. Rather, the growth of global value chains implies a paradigm shift
that renders obsolete some – but emphatically not all – aspects of yesteryear’s approach to trade, investment and
development issues, and zooms in on other supportive policies. Cattaneo and Miroudot (2013) (cited in Cattaneo et
al., 2013) distinguish four major changes:
• A shift in the levels of analysis from countries to firms and global value chains, which implies a greater focus on
business and on adopting regional and global perspectives;
• A shift from trade in goods to trade in tasks or functions;
• A shift from endowments and stocks to flows, where a country’s integration with world markets – and its ability
to draw on the concomitant flows of know-how, capital, services and so on – matters more than fixed home-
based assets;
• A shift from primarily public at-the-border barriers to private behind-the-border barriers.
Several policy-related implications follow from these changes. First, global value chains bring the role of imports to
the fore, since the fragmented nature of global value chains means that imports are vital inputs for a country’s firms
to become and stay competitive. Barriers to imports have the effect of boosting the chances of rival firms in other
more open countries to position themselves in global value chains. Second, trade and investment are closely linked in
global value chains and can mutually reinforce each other, but also pull in different directions. It is therefore important
that trade and investment policies be coherent, so as to maximize their potential of supporting the positioning of
firms in global value chains. Third, because involvement in global value chains is based on tasks or functions, the
focus of policymakers should not be on supporting entire industries – and their respective value chains – within
the country, but on increasing the competitiveness of national firms by facilitating their participation and upgrading
in certain activities within global value chains. Fourth, global value chains put the private sector squarely in the
limelight, which makes it necessary for policymakers to engage in sincere dialogues with firms to work out solutions
to strengthen their competitiveness. The point that working with the private sector is in a country’s national interest
is thus even more accentuated in a world of global value chains. Finally, with globalization, the liberalization of trade-
related policies and increasing competition, the fragmentation of production enabled global firms to source inputs
from low-cost countries.
Importantly, participation in global value chain is not only about trade and investment but also about building
productive capacities and promoting structural economic transformation. The development of productive capacities
occurs through investment that is necessary to build domestic capital stock (financial and physical capital, human
capital, and so forth), that is to say, capital accumulation; structural change or transformation; and building the
capabilities of the domestic enterprise sector.16 Therefore, it is critically important that trade, investment and overall
development policies should work in harmony and in consortium with other domestic sectoral policies and institutions,
13
Facilitating the Participation of Landlocked Developing Countries in Commodity Value Chains
such as agriculture, industry, environment, education, to build productive capacities and enhance innovation,
technological learning and upgrading in LLDCs so that they can participate effectively and benefit from regional value
chains and global value chains.
How are global value chains structured? The governance of global value chains – that is, the relationships among
firms – can be analysed according to the complexity of information exchanged, how information for production is
codified and the level of supplier competence (Gereffi and Fernandez-Stark, 2011). This analysis has resulted in
observers framing a classification of five types of governance,17 with increasing degree of integration and coordination
between and among the firms.
The five types of governance can be further divided into buyer-driven and producer-driven networks. For instance,
in the context of commodities, the governance of agricultural global value chains can be buyer driven, with large
retailers placing high demands on suppliers to meet stringent standards; the governance of extractive industry
global value chains can be producer driven, characterized by the ownership or extraction rights of large transnational
corporations (Bamber et al, 2014). It is, however, important to be wary of overly categorical statements about the
governance of value chains. First, it is by no means fixed; one type of governance may well evolve into another with
an accompanying shift in roles. Second, the actors and permutations of different value chains can vary considerably
(African Development Bank, Organization for Economic Cooperation and Development, and United Nations
Development Programme, 2014; Humphrey and Memedovic, 2006). Finally, in addition to governance structures, the
power relationship within the value chains plays an equally important role in determining how benefits are distributed.
Given that global value chains change the landscape of trade, investment and development, what are the
implications for developing countries? A change always presents opportunities and threats. On the positive side, it
has already been said that a world of global value chains implies that countries do not need to engage in decades-long
building of vertically integrated industries. Instead, global value chains provide developing countries with shortcuts to
integrate with the world economy by capturing beneficial segments of the value chains that can be built upon through
upgrading. Indeed, Baldwin (2011) argues that it was precisely this joining of supply chains that “transmuted East
Asian industries from uncompetitive, tariff-sheltered relics into world-class exporters” in less than a decade. As pointed
out in Cattaneo et al. (2013), joining supply provide opportunities for all parties concerned to develop capacities to
capture certain activities within global value chains – not just transnational corporations, but also small- and medium-
sized enterprises in small developing countries. However, this should not be interpreted to mean that joining supply
chains is the sole condition that determines economic transformation. The key to taking full advantage of regional
and global value chains is to build requisite productive capacities and capacity to transform productive resources
from low- to high-productivity sectors and from low value added to high value added exports. As consistently argued
by UNCTAD, the development of productive capacities is necessary for economic transformation and sophistication
of exports as well as for participation in regional and global value chains. Developing or building productive capacities
depends on domestic institutional set-ups and the capacity to formulate and implement development policies and
strategies that put such capacities at their centre. Making State institutions capable and effective in formulating and
implementing development policies centred on the development and expansion of productive capacities is critical for
LLDCs to effectively participate in and benefit from regional and global value chains.
A disadvantage of global value chains is its footloose nature, for they make it easier for lead firms to cut their
linkages with certain suppliers in preference to others. Such cut-throat competition is positive in that it can keep firms
and countries on their toes and constantly on the lookout for means to move beyond the status quo and improve
competitiveness. However, it can cause detrimental effects by exposing developing country firms to increased
uncertainty about the future, stimulating race-to-the-bottom policies among developing country Governments and
facilitating predatory behaviour by transnational corporations. Another adverse consequence of global value chains
is that the greater world integration they induce increases the vulnerability of economies to shocks and ripple effects.
The repercussions of the global financial crisis are a prime example of how such effects can be felt in all parts of the
world economy – and belie the arguments put forward in the decoupling debate that preceded the financial crisis.
Another example is the disruptions in supply chains caused by the earthquake, tsunami, and subsequent nuclear
disaster in Japan in 2011 (Cattaneo et al., 2013). There is, of course, another side of the coin, since good times in the
core areas of global value chains transmit positive vibrations throughout the system.
In sum, LLDC’s need to take into account changes in international production and supply systems brought about
by the increasing intensity of global value chains. But how? Or, more specifically, how can LLDCs improve their
prospects for carving out niches in global value chains? Useful guidance is provided in Bamber et al. (2014), which
distinguishes five broad categories containing 14 factors that affect the competitiveness of developing countries in
global value chains. The five categories are as follows:
14
Facilitating the Participation of Landlocked Developing Countries in Commodity Value Chains
• Productive capacity;
• Infrastructure and services;
• Business environment;
• Trade and investment policy;
• Industry institutionalization.
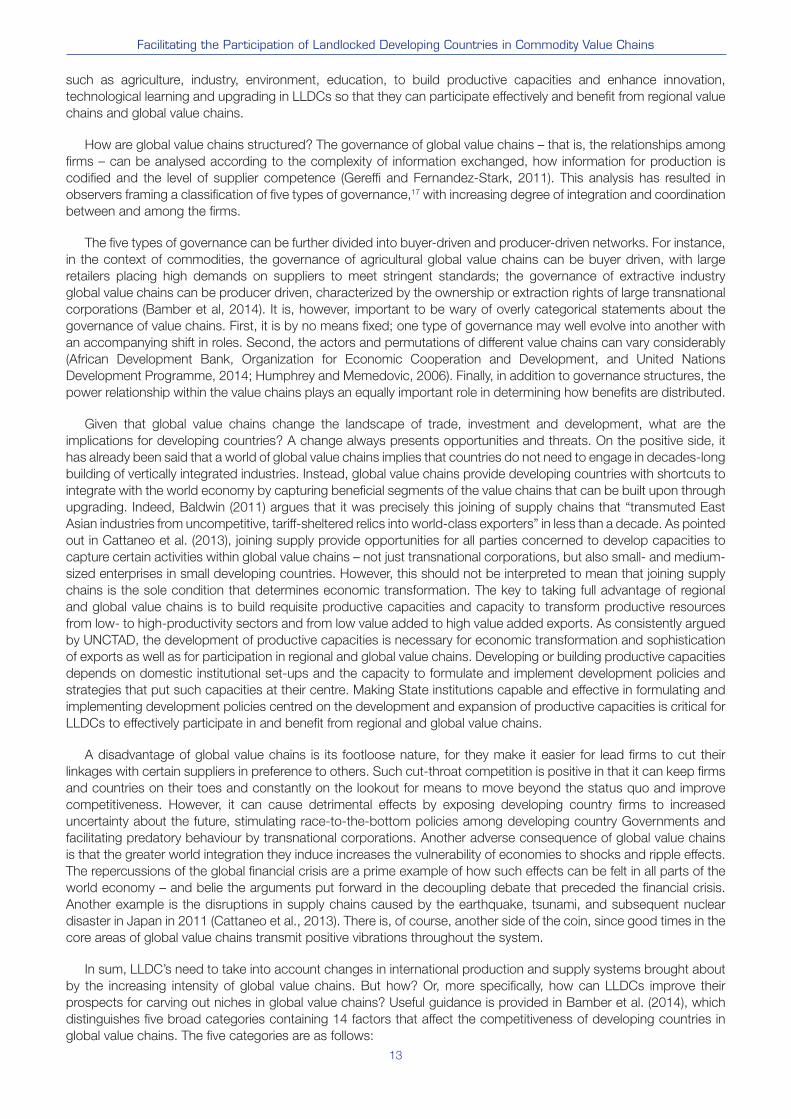
The authors apply this general template to the global value chains of specific sectors to identify the most compelling
reasons for developing countries to participate and upgrade in global value chains for the participation and upgrading
of developing countries in global value chains. Their analysis of two of these sectors – agriculture and the extractive
industries – is particularly pertinent for the purposes of this paper and highlights the factors described in table 5:
Clearly, the five broad categories and 14 factors summarized in table 5 are critical to building competitiveness
in developing countries and hence determine whether or not countries are in a position to participate in and benefit
from global value chains. Therefore, it is indispensable for LLDCs to acquire capabilities in these areas in order to join
regional and global value chains.
Table 5. Key factors for competitiveness in global value chains in agriculture and the extractive industries
Agriculture Extractive industries
Productive capacity
Human capital
New technical and business administration skills required to meet quality and on-time delivery needs of buyers. Specific skills for upgrading.
Knowledge and capital intensity: fewer but more highly trained technical and professional staff are required.
National innovation systems
Innovation needed in various stages such as seedling production, advances in irrigation and greenhouse productivity, processing and marketing.
Technology-intensive sector; domestic firms must be on cutting edge.
Standards and certification
Requirements for entry to high-value markets, for example GlobalGap (production) and hazard analysis and critical control point, or. HAACP (packing and processing). Buyers also have own standards, such as Tesco’s Nature’s Choice.
Less emphasis, but emerging in areas of social and environmental protection, for example, Kimberley process certification of blood diamonds.
Infrastructure
Transportation and water Transportation and waterQuality of perishable goods is time sensitive. Commodities require bulk transportation. Water is essential for irrigation.
EnergyEnergyOperating costs for extraction and processing; transportation infrastructure usually built by firm.
Business environment
Access to finance
Vital for investments to meet standards; agriculture in developing countries has large proportion of small and medium-sized producers; heightened difficulty accessing credit due to information asymmetry.
Capital and technology intensity and economies of scale require vast financial commitments.
Public governance
Corruption affects permit processes and can result in significant operational delays. Rent-seeking is common in resource-rich countries.
Trade and investment
policy
Trade policy and trade facilitationTrade policy and trade facilitation
Trade facilitation: Trade facilitation:important for exports of perishables; products cannot be delayed in customs.
Trade policy: Trade policy:mostly problematic on upgrading with tariff escalation.
Domestic firms often do not have access to tariff-free imports secured by foreign firms. Equal treatment in trade policy is required to support development of local firms.
Investment policyInvestment policy
Sector generally defined by domestic firms due to land policy. FDI growing in importance. Example: Starbucks’ recent purchase of a coffee farm in Costa Rica for research and development .
Sector dominated by FDI, but growing presence of national producers, processors and suppliers in developing world. More emphasis needed on domestic linkages.
Institutionalization
Presence of input suppliers and certified testing laboratories depends on scale economies; often beyond developing country producer size. Associations and cooperatives can help meet supply needs.
Weak local institutions and industry replaced easily by vertical integration or foreign companies, which limits ability of developing countries to capture higher value from natural resources.
Source: Bamber et al., 2014.
15
Facilitating the Participation of Landlocked Developing Countries in Commodity Value Chains
IV. Improving the Participation of Landlocked Developing Countries in Commodity Value Chains: Focus Areas
The country case studies reveal that there is vast potential for LLDCs to join regional and global value chains in
the sectors where they enjoy comparative and competitive advantages. However, with the exception of Botswana,
case studies on Mongolia, Paraguay, Uzbekistan and Zambia show that their participation in commodity value chains
remains in preliminary or upstream18 production stages. For instance, Zambia exports up to 95 per cent refined
copper in the form of copper cathodes. This process represents a number of value added stages after mining (Morris,
et al. 2012) but is still considered to be an upstream activity. To that end, significant investments have been made,
including the construction of two new smelters and the expansion of an existing one to 850,000 tons per annum (the
biggest copper smelter in Africa and the fifth largest in the world). Consequently, further processing along the value
chains (downstream), which produces semi-fabricates, including copper plates, sheets and strips, and copper wire,
is growing over time, albeit at a relatively slow pace. Tellingly, the production of high-end semi-fabricates is almost
exclusively undertaken by a single company.
Mongolia’s participation in coal and copper value chains is even more troubling. As one of the world’s top
producers and exporters of coal, the country suffers from shortages of electricity supply. Such a paradox undermines
its potential in beneficiation and its participation in regional and global mining value chains. For instance, Oyu Tolgoi,
one of the largest Mongolian copper mines, has not yet been supplied with electricity from domestic sources.
Currently, the Government of Mongolia imports electric power from China at tariffs more than double the domestic
energy price and uses expensive imported fuels. Mongolia could not enter regional value chains, for example in
copper, despite the location of its copper mining sites on the border with China, the largest consumer and exporter
of finished copper products. Copper concentrates from Oyu Tolgoi are transported to China by truck since a railway
project has not yet been completed. In addition to the shortage of physical infrastructure, notably railroad and energy
supply from domestic sources, the development of the mining sector is hampered by inconsistent polices and
ineffective institutions. Overall, Mongolia could not take advantage of its natural resources wealth, owing largely to a
lack of infrastructure, a shortage of electricity supply, relatively low participation of the private sector in the extractive
industry and slow processing of investment licences in the mining and other manufacturing sectors. There is growing
hope that the Mongolian copper sector can bring more value addition by manufacturing finished copper products,
provided that the Government facilitates the participation of the private sector. The new mining law and policy, which
relaxes conditions for private ownership in mining, is expected to enhance the role of the private sector and public–
private partnerships, which is now covered by the new concession law of the country.
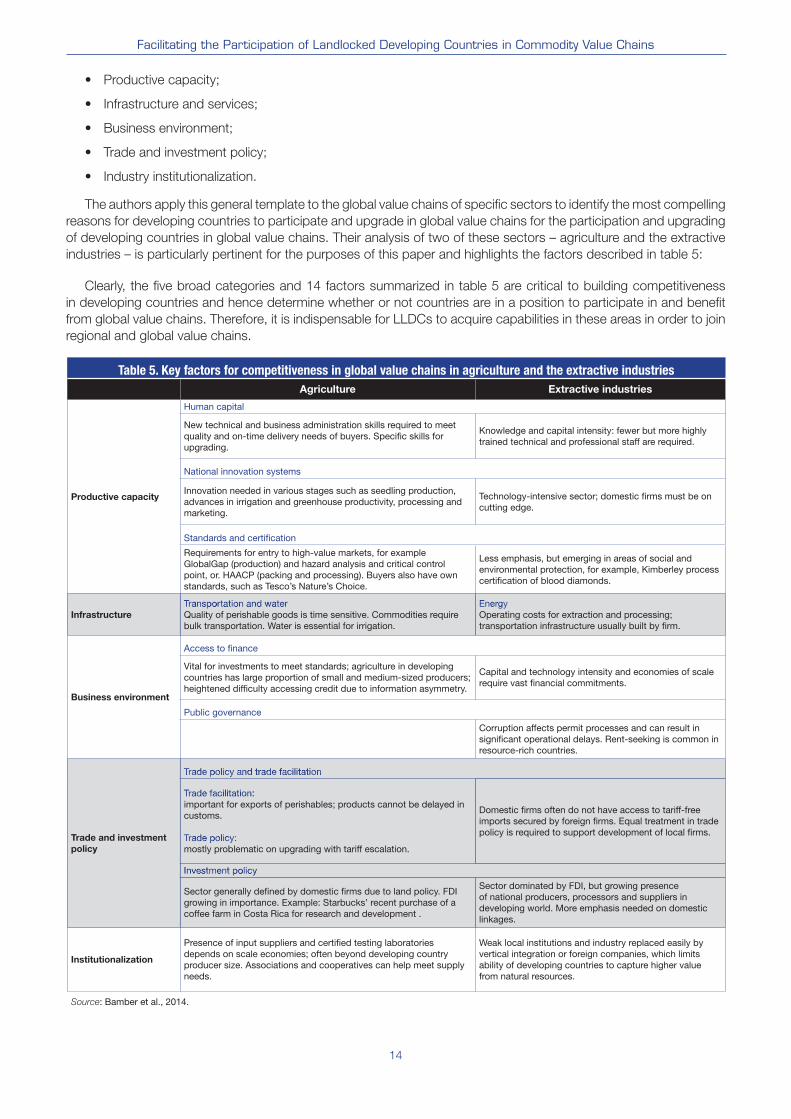
The following figure shows a generic mining value chain.
Figure 5. Generic mining value chain
Enabling environment
Macroeconomic climate – policies and regulation
Facilitating services
Transport, storage, processing, packaging, imports, exports, dealers
Incentive: value added by every function for each participant
Facilitating institutions
Policy, commercial laws, finance, market information, standards, markets,
technology, innovation, property rights
Upstream Downstream
Licensing and
exploration
Sale or export
of commodity
Mine/capital
development
Mining/
productionSmeltingProcessing
Source: L.Ndlovu, 2014, Identifying growth opportunities and supporting measures to facilitate investment in commodity value chains inlandlocked developing countries: The case of Botswana and Zambia.
16
Facilitating the Participation of Landlocked Developing Countries in Commodity Value Chains
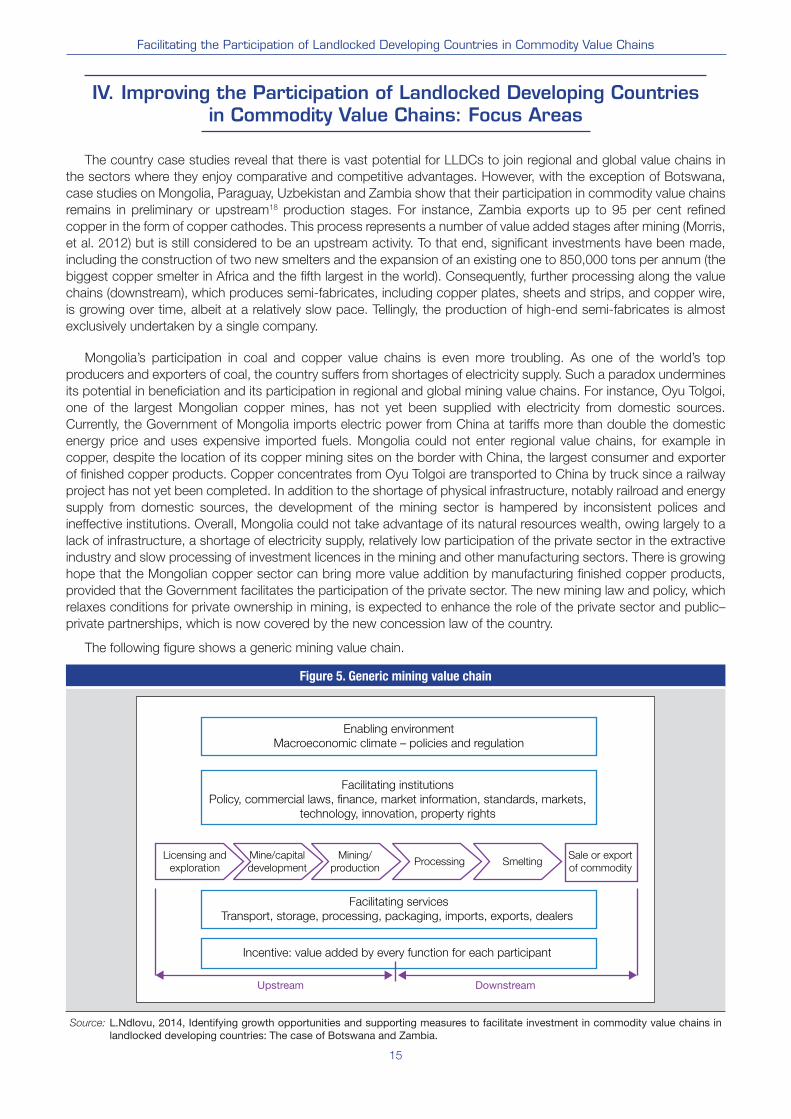
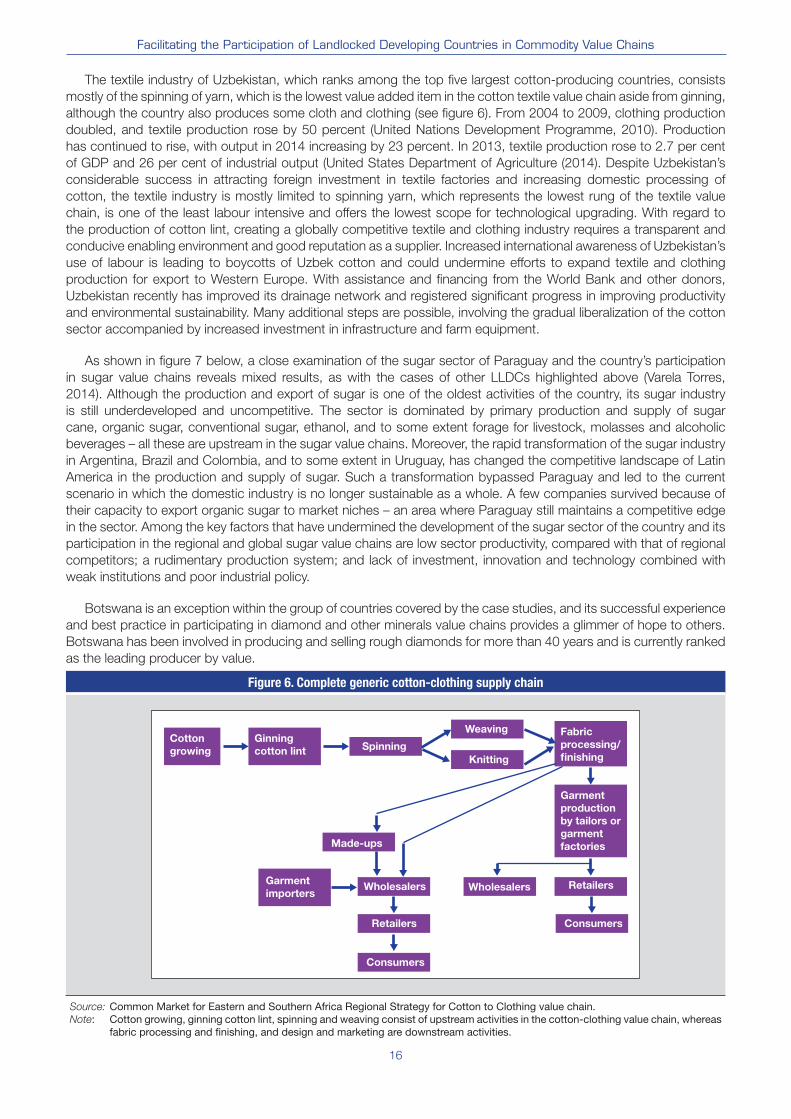
The textile industry of Uzbekistan, which ranks among the top five largest cotton-producing countries, consists
mostly of the spinning of yarn, which is the lowest value added item in the cotton textile value chain aside from ginning,
although the country also produces some cloth and clothing (see figure 6). From 2004 to 2009, clothing production
doubled, and textile production rose by 50 percent (United Nations Development Programme, 2010). Production
has continued to rise, with output in 2014 increasing by 23 percent. In 2013, textile production rose to 2.7 per cent
of GDP and 26 per cent of industrial output (United States Department of Agriculture (2014). Despite Uzbekistan’s
considerable success in attracting foreign investment in textile factories and increasing domestic processing of
cotton, the textile industry is mostly limited to spinning yarn, which represents the lowest rung of the textile value
chain, is one of the least labour intensive and offers the lowest scope for technological upgrading. With regard to
the production of cotton lint, creating a globally competitive textile and clothing industry requires a transparent and
conducive enabling environment and good reputation as a supplier. Increased international awareness of Uzbekistan’s
use of labour is leading to boycotts of Uzbek cotton and could undermine efforts to expand textile and clothing
production for export to Western Europe. With assistance and financing from the World Bank and other donors,
Uzbekistan recently has improved its drainage network and registered significant progress in improving productivity
and environmental sustainability. Many additional steps are possible, involving the gradual liberalization of the cotton
sector accompanied by increased investment in infrastructure and farm equipment.
As shown in figure 7 below, a close examination of the sugar sector of Paraguay and the country’s participation
in sugar value chains reveals mixed results, as with the cases of other LLDCs highlighted above (Varela Torres,
2014). Although the production and export of sugar is one of the oldest activities of the country, its sugar industry
is still underdeveloped and uncompetitive. The sector is dominated by primary production and supply of sugar
cane, organic sugar, conventional sugar, ethanol, and to some extent forage for livestock, molasses and alcoholic
beverages – all these are upstream in the sugar value chains. Moreover, the rapid transformation of the sugar industry
in Argentina, Brazil and Colombia, and to some extent in Uruguay, has changed the competitive landscape of Latin
America in the production and supply of sugar. Such a transformation bypassed Paraguay and led to the current
scenario in which the domestic industry is no longer sustainable as a whole. A few companies survived because of
their capacity to export organic sugar to market niches – an area where Paraguay still maintains a competitive edge
in the sector. Among the key factors that have undermined the development of the sugar sector of the country and its
participation in the regional and global sugar value chains are low sector productivity, compared with that of regional
competitors; a rudimentary production system; and lack of investment, innovation and technology combined with
weak institutions and poor industrial policy.
Botswana is an exception within the group of countries covered by the case studies, and its successful experience
and best practice in participating in diamond and other minerals value chains provides a glimmer of hope to others.
Botswana has been involved in producing and selling rough diamonds for more than 40 years and is currently ranked
as the leading producer by value.
Figure 6. Complete generic cotton-clothing supply chain
Cotton
growing
Ginning
cotton lint
Garment
importers
Fabric
processing/
finishing
Garment
production
by tailors or
garment
factories
Spinning
Made-ups
Wholesalers Wholesalers Retailers
Retailers
Consumers
Consumers
Weaving
Knitting
Source: Common Market for Eastern and Southern Africa Regional Strategy for Cotton to Clothing value chain.Note: Cotton growing, ginning cotton lint, spinning and weaving consist of upstream activities in the cotton-clothing value chain, whereas
fabric processing and finishing, and design and marketing are downstream activities.
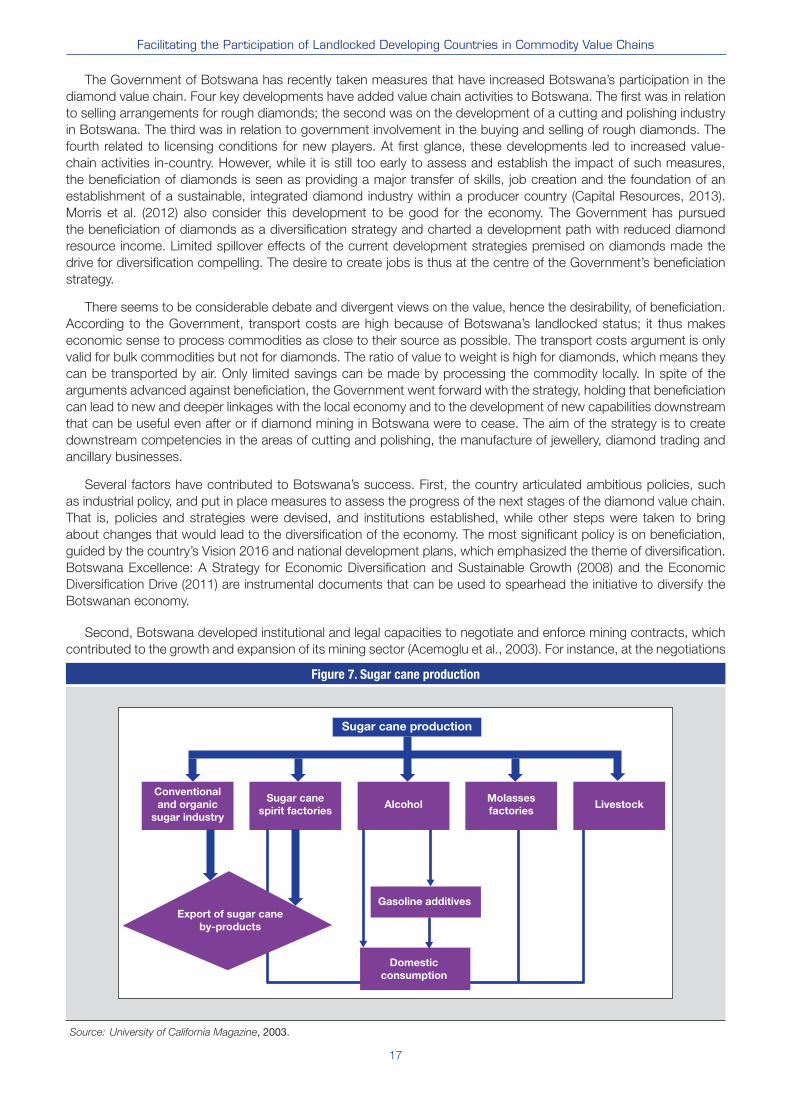
17
Facilitating the Participation of Landlocked Developing Countries in Commodity Value Chains
The Government of Botswana has recently taken measures that have increased Botswana’s participation in the
diamond value chain. Four key developments have added value chain activities to Botswana. The first was in relation
to selling arrangements for rough diamonds; the second was on the development of a cutting and polishing industry
in Botswana. The third was in relation to government involvement in the buying and selling of rough diamonds. The
fourth related to licensing conditions for new players. At first glance, these developments led to increased value-
chain activities in-country. However, while it is still too early to assess and establish the impact of such measures,
the beneficiation of diamonds is seen as providing a major transfer of skills, job creation and the foundation of an
establishment of a sustainable, integrated diamond industry within a producer country (Capital Resources, 2013).
Morris et al. (2012) also consider this development to be good for the economy. The Government has pursued
the beneficiation of diamonds as a diversification strategy and charted a development path with reduced diamond
resource income. Limited spillover effects of the current development strategies premised on diamonds made the
drive for diversification compelling. The desire to create jobs is thus at the centre of the Government’s beneficiation
strategy.
There seems to be considerable debate and divergent views on the value, hence the desirability, of beneficiation.
According to the Government, transport costs are high because of Botswana’s landlocked status; it thus makes
economic sense to process commodities as close to their source as possible. The transport costs argument is only
valid for bulk commodities but not for diamonds. The ratio of value to weight is high for diamonds, which means they
can be transported by air. Only limited savings can be made by processing the commodity locally. In spite of the
arguments advanced against beneficiation, the Government went forward with the strategy, holding that beneficiation
can lead to new and deeper linkages with the local economy and to the development of new capabilities downstream
that can be useful even after or if diamond mining in Botswana were to cease. The aim of the strategy is to create
downstream competencies in the areas of cutting and polishing, the manufacture of jewellery, diamond trading and
ancillary businesses.
Several factors have contributed to Botswana’s success. First, the country articulated ambitious policies, such
as industrial policy, and put in place measures to assess the progress of the next stages of the diamond value chain.
That is, policies and strategies were devised, and institutions established, while other steps were taken to bring
about changes that would lead to the diversification of the economy. The most significant policy is on beneficiation,
guided by the country’s Vision 2016 and national development plans, which emphasized the theme of diversification.
Botswana Excellence: A Strategy for Economic Diversification and Sustainable Growth (2008) and the Economic
Diversification Drive (2011) are instrumental documents that can be used to spearhead the initiative to diversify the
Botswanan economy.
Second, Botswana developed institutional and legal capacities to negotiate and enforce mining contracts, which
contributed to the growth and expansion of its mining sector (Acemoglu et al., 2003). For instance, at the negotiations
Figure 7. Sugar cane production
Conventional
and organic
sugar industry
Sugar cane
spirit factoriesLivestockAlcohol
Gasoline additives
Domestic
consumption
Molasses
factories
Sugar cane production
Export of sugar cane
by-products
Source: University of California Magazine, 2003.

18
Facilitating the Participation of Landlocked Developing Countries in Commodity Value Chains
for renewal of Debswana’s mining licence in 2005, the Government persuaded DeBeers to recognize and embrace
the importance of beneficiation downstream the diamond value chain. It also succeeded in its negotiations with
DeBotswana to move the Sights and Sales group of the Diamond Trading Company, based in London, to Gaborone.
Third, the Government’s involvement in buying and selling rough diamonds, combined with licensing conditions
for new players, contributed to Botswana’s increased participation in the diamonds value chain. On the face of it,
these developments increased value chain activities within the country.
Fourth, besides the drive to increase the discovery and exploitation of new mineral findings, the Government of
Botswana embarked on a beneficiation strategy to diversify its economy to reduce the risks posed by the dominance
of the mining sector. The beneficiation strategy is aligned with the country’s economic development policy and
advocates the local cutting and polishing of diamonds to further local economic development (Mbayi, 2013). This is
based on the premise that Botswana would capture and retain a greater proportion of value derived from diamond
exploitation, and the benefits would be channelled to local communities through increased skills and employment.
This strategy stemmed from the realization that diamonds have served Botswana well.
Lastly, the Government put in place a comprehensive economic diversification strategy beyond beneficiation. The
strategy for economic diversification and sustainable growth identifies a number of related actions and instruments to
achieve economic diversification and sustainable growth. These are grouped into five sets of interventions:
• Creating an enabling environment;
• Fostering a mind-set change, openness and empowerment;
• Realigning polices and institutions with the country’s Vision 2016;
• Putting in place instruments in support of diversification initiatives;
• Focusing on projects to drive diversification.
Although the above policies and institutional framework were relatively successful, this does not mean that
Botswana has a fully diversified economy. Nor does it mean that Botswana is fully and effectively participating in
and benefiting from commodity value chains. There are still serious development challenges and constraints to be
addressed. The major ones include the narrow economic structure and the economy’s overdependence on mining,
particularly on diamonds; the high incidence of poverty, with more than 18.4 per cent of the population living below
the poverty line; high unemployment estimated at between 17.8 per cent and 20 per cent; a low human development
index ranking and high incidence and prevalence of HIV/AIDS (African Development Bank, 2014). In this regard, the
gap between the distribution of resources and level of development are areas of major concern. The fact that that
diamonds are a finite resource that will be eventually depleted makes diversification a key imperative for economic
development in Botswana. In sum, while it is still too early to assess and establish the impact on the country’s
socioeconomic progress, the beneficiation of diamonds is considered to provide a major transfer of skills and job
creation and to lay the foundation for a sustainable, integrated diamond industry within a producer country (Capital
Resources, 2013). Morris et al. (2012) also views this development as good for the economy of Botswana.
Building on the experience of Botswana, how can LLDCs increase their participation in commodity value chains?
In addition to putting in place sound polices and capable institutions to implement such policies and taking the key
factors summarized in table 5 as the point of departure, this section addresses this question by examining five areas
from the perspective of commodity-dependent LLDCs: trade facilitation, infrastructure, trade and investment policies,
productive capacities and institutions. The key issues of each area are discussed, the performance of LLDCs is
quantitatively assessed, and best practices and lessons learned are highlighted to provide some practical policy
insights.
A. TRADE FACILITATION
Key issues
The Vienna Programme of Action lists six priorities to achieve its objectives as outlined in section IV: fundamental
transit policy issues, infrastructure development and maintenance, international trade and trade facilitation, regional
integration and cooperation, structural economic transformation and means of implementation. The first four priorities
are directly or indirectly related to the greater-than-average transportation costs often suffered by LLDCs, and their
significance is reflected below in a discussion on trade facilitation and transit costs, followed by that of infrastructure
issues.
19
Facilitating the Participation of Landlocked Developing Countries in Commodity Value Chains
From a supply chain perspective, the potentially high transportation costs in LLDCs, which can be attributed to
their landlocked status and heavy dependence on primary commodity exports, take on increased significance in an
era of internationally fragmented production networks. This is due to the importance of imports as inputs to those
developing country firms that participate in, or seek entry to, global value chains. Any geographical disadvantage
can, however, be offset by improved transportation infrastructure and network, streamlined customs procedures,
transparent inspection activities, efficient logistics services and other factors. Ultimately, high transportation costs
can be addressed to a certain extent, and trade facilitation, combined with improved transport and communications
infrastructure, is an essential ingredient in the abilities of LLDCs to participate and upgrade in global value chains.
Understandably, transit arrangements take on particular significance in the case of LLDCs. It is clearly not enough
for LLDCs to have superior trade facilitation and infrastructure in their own countries, since by definition they rely on
their neighbours for access to the sea. And access to the sea certainly matters. One estimate puts global seaborne
trade at 75 per cent of world merchandise trade in terms of volume and 59 per cent in terms of value (Lloyd’s
Marine Intelligence Unit, 2009). What is more, the bulk of seaborne trade is in hard commodities (Lloyd’s Marine
Intelligence Unit, 2009; UNCTAD, 2013a). The role of the sea in international trade means that high transit costs
can have a significant negative impact on the imports and exports of LLDCs.19 Those LLDCs that are dependent on
commodities with high weight–value ratios are particularly vulnerable. The importance of transit arrangements and
the role of coastal neighbours are points that have been driven home repeatedly in the past decade. Encouragingly,
the increased involvement of transit developing countries in working towards the greater integration of LLDCs with the
world economy is one of the positive developments that has taken place since the launch of the Almaty Programme
of Action20 (Weisskopf, 2013). It successor – the Vienna Programme of Action – also called for greater engagement of
transit developing countries, including in the context of South–South cooperation, in the implementation of priorities
agreed therein (Vienna Programme of Action, paras. 66 and 75).
Another recent positive development in the sphere of trade facilitation is the Agreement on Trade Facilitation
concluded by members of the World Trade Organization in December 2013. It will enter into force upon ratification
by two thirds of its members. It consists of two basic sections, a set of final provisions and an annex (Torres, 2014;
World Trade Organization, 2013). The first section contains 10 articles on trade facilitation disciplines,21 one article on
customs cooperation and one on institutional arrangements. The second section deals with special and differential
treatment for developing countries and least developed countries. A review (Erdenebileg, 2014) of the Agreement
from the LLDC perspective summarizes the benefits as follows:
• Speeds up customs procedures;
• Makes trade easier, faster and cheaper;
• Provides clarity, efficiency and transparency;
• Reduces bureaucracy and corruption;
• Promotes use of technological advances;
• Improves movement of goods in transit;
• Promotes technical assistance to update the infrastructure of LLDCs, train customs officials or to cover any
other costs associated with implementation of the Agreement.
It is too early to tell to what extent the presumed benefits will materialize, given the large investment gap in hard
and soft infrastructure, poor transportation networks and complex administrative barriers such as the number of
checkpoints on cargos or consignments destined for LLDCs. That said, if the Agreement were to trigger sharp
reductions in transit and transportation costs and make both importing and exporting with LLDCs cheaper and more
reliable, it is reasonable to assume that the lower costs and greater certainty would induce investors and trading
partners to step up their activities. This scenario could thus conceivably lead to increased participation of LLDCs
in regional and global value chains. In this context, it is urgent for LLDCs to assess their trade facilitation needs
by clearly defining domestic opportunities, limitations and areas where they have the capacity to implement the
Agreement on their own and by identifying areas where additional international support is required.
Performance of landlocked developing countries
Clearly, landlocked countries are generally at a disadvantage compared with other countries concerning the
cost of and time required for international trade. This is also verified when comparing countries’ performance with
regard to relevant indicators. For instance, a comparison of the average logistics performance index (LPI) scores22 of
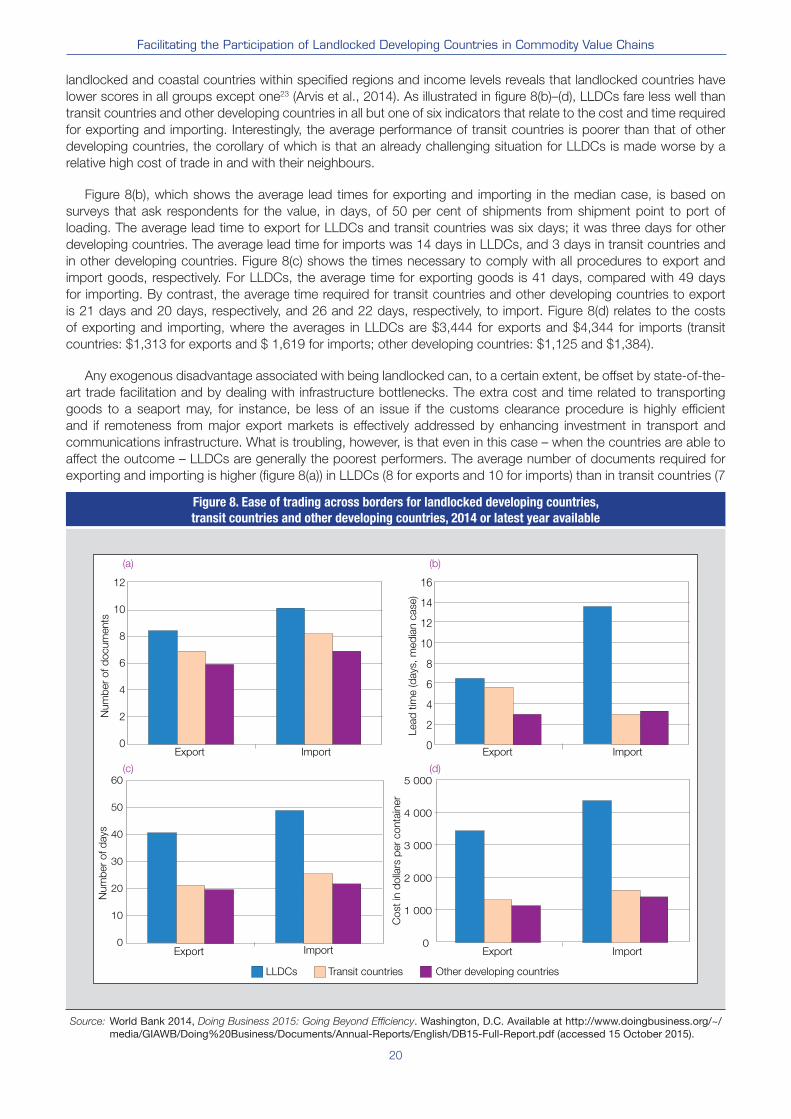
20
Facilitating the Participation of Landlocked Developing Countries in Commodity Value Chains
Figure 8. Ease of trading across borders for landlocked developing countries,
transit countries and other developing countries, 2014 or latest year available
Num
ber
of d
ocum
ents
Co
st
in d
olla
rs p
er
co
nta
iner
Lead
tim
e (d
ays,
med
ian c
ase)
Num
ber
of d
ays
0
2
4
6
8
10
12
Export Import
(a)
0
2
4
6
8
10
12
14
16
Export Import
(b)
(c) (d)
0
10
20
30
40
50
60
Export Import0
1 000
2 000
3 000
4 000
5 000
Export Import
LLDCs Transit countries Other developing countries
Source: World Bank 2014, Doing Business 2015: Going Beyond Efficiency. Washington, D.C. Available at http://www.doingbusiness.org/~/media/GIAWB/Doing%20Business/Documents/Annual-Reports/English/DB15-Full-Report.pdf (accessed 15 October 2015).
landlocked and coastal countries within specified regions and income levels reveals that landlocked countries have
lower scores in all groups except one23 (Arvis et al., 2014). As illustrated in figure 8(b)–(d), LLDCs fare less well than
transit countries and other developing countries in all but one of six indicators that relate to the cost and time required
for exporting and importing. Interestingly, the average performance of transit countries is poorer than that of other
developing countries, the corollary of which is that an already challenging situation for LLDCs is made worse by a
relative high cost of trade in and with their neighbours.
Figure 8(b), which shows the average lead times for exporting and importing in the median case, is based on
surveys that ask respondents for the value, in days, of 50 per cent of shipments from shipment point to port of
loading. The average lead time to export for LLDCs and transit countries was six days; it was three days for other
developing countries. The average lead time for imports was 14 days in LLDCs, and 3 days in transit countries and
in other developing countries. Figure 8(c) shows the times necessary to comply with all procedures to export and
import goods, respectively. For LLDCs, the average time for exporting goods is 41 days, compared with 49 days
for importing. By contrast, the average time required for transit countries and other developing countries to export
is 21 days and 20 days, respectively, and 26 and 22 days, respectively, to import. Figure 8(d) relates to the costs
of exporting and importing, where the averages in LLDCs are $3,444 for exports and $4,344 for imports (transit
countries: $1,313 for exports and $ 1,619 for imports; other developing countries: $1,125 and $1,384).
Any exogenous disadvantage associated with being landlocked can, to a certain extent, be offset by state-of-the-
art trade facilitation and by dealing with infrastructure bottlenecks. The extra cost and time related to transporting
goods to a seaport may, for instance, be less of an issue if the customs clearance procedure is highly efficient
and if remoteness from major export markets is effectively addressed by enhancing investment in transport and
communications infrastructure. What is troubling, however, is that even in this case – when the countries are able to
affect the outcome – LLDCs are generally the poorest performers. The average number of documents required for
exporting and importing is higher (figure 8(a)) in LLDCs (8 for exports and 10 for imports) than in transit countries (7
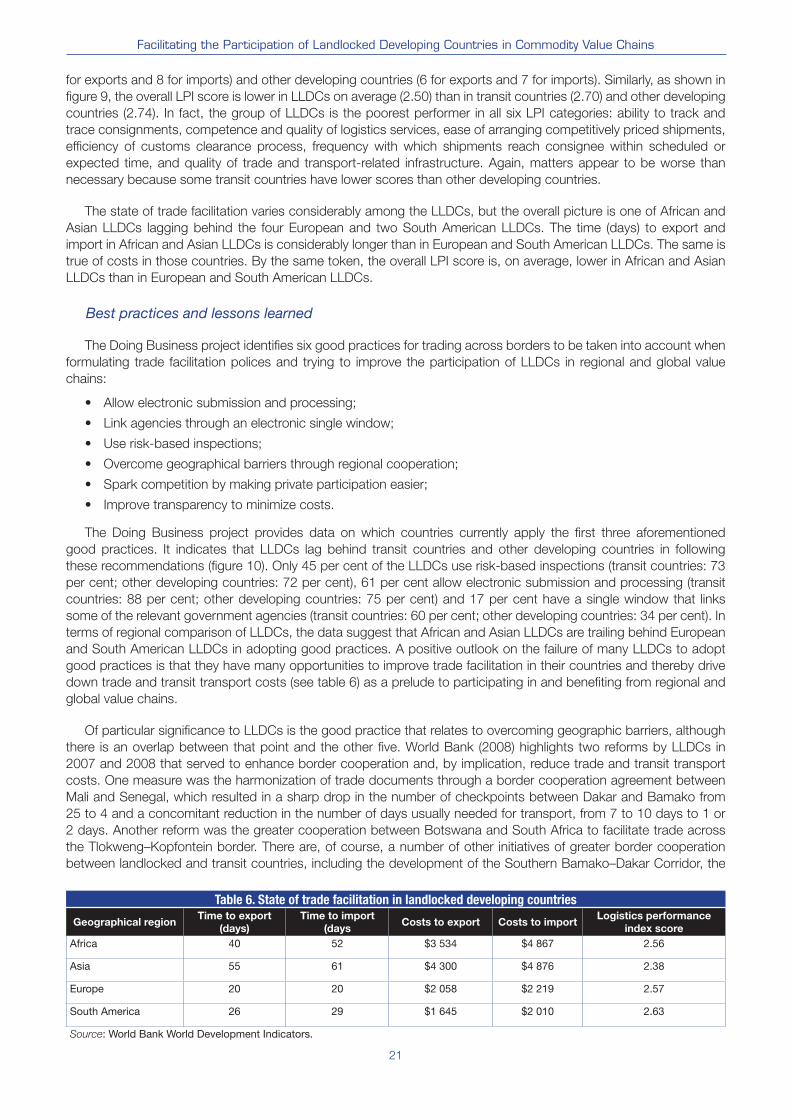
21
Facilitating the Participation of Landlocked Developing Countries in Commodity Value Chains
for exports and 8 for imports) and other developing countries (6 for exports and 7 for imports). Similarly, as shown in
figure 9, the overall LPI score is lower in LLDCs on average (2.50) than in transit countries (2.70) and other developing
countries (2.74). In fact, the group of LLDCs is the poorest performer in all six LPI categories: ability to track and
trace consignments, competence and quality of logistics services, ease of arranging competitively priced shipments,
efficiency of customs clearance process, frequency with which shipments reach consignee within scheduled or
expected time, and quality of trade and transport-related infrastructure. Again, matters appear to be worse than
necessary because some transit countries have lower scores than other developing countries.
The state of trade facilitation varies considerably among the LLDCs, but the overall picture is one of African and
Asian LLDCs lagging behind the four European and two South American LLDCs. The time (days) to export and
import in African and Asian LLDCs is considerably longer than in European and South American LLDCs. The same is
true of costs in those countries. By the same token, the overall LPI score is, on average, lower in African and Asian
LLDCs than in European and South American LLDCs.
Best practices and lessons learned
The Doing Business project identifies six good practices for trading across borders to be taken into account when
formulating trade facilitation polices and trying to improve the participation of LLDCs in regional and global value
chains:
• Allow electronic submission and processing;
• Link agencies through an electronic single window;
• Use risk-based inspections;
• Overcome geographical barriers through regional cooperation;
• Spark competition by making private participation easier;
• Improve transparency to minimize costs.
The Doing Business project provides data on which countries currently apply the first three aforementioned
good practices. It indicates that LLDCs lag behind transit countries and other developing countries in following
these recommendations (figure 10). Only 45 per cent of the LLDCs use risk-based inspections (transit countries: 73
per cent; other developing countries: 72 per cent), 61 per cent allow electronic submission and processing (transit
countries: 88 per cent; other developing countries: 75 per cent) and 17 per cent have a single window that links
some of the relevant government agencies (transit countries: 60 per cent; other developing countries: 34 per cent). In
terms of regional comparison of LLDCs, the data suggest that African and Asian LLDCs are trailing behind European
and South American LLDCs in adopting good practices. A positive outlook on the failure of many LLDCs to adopt
good practices is that they have many opportunities to improve trade facilitation in their countries and thereby drive
down trade and transit transport costs (see table 6) as a prelude to participating in and benefiting from regional and
global value chains.
Of particular significance to LLDCs is the good practice that relates to overcoming geographic barriers, although
there is an overlap between that point and the other five. World Bank (2008) highlights two reforms by LLDCs in
2007 and 2008 that served to enhance border cooperation and, by implication, reduce trade and transit transport
costs. One measure was the harmonization of trade documents through a border cooperation agreement between
Mali and Senegal, which resulted in a sharp drop in the number of checkpoints between Dakar and Bamako from
25 to 4 and a concomitant reduction in the number of days usually needed for transport, from 7 to 10 days to 1 or
2 days. Another reform was the greater cooperation between Botswana and South Africa to facilitate trade across
the Tlokweng–Kopfontein border. There are, of course, a number of other initiatives of greater border cooperation
between landlocked and transit countries, including the development of the Southern Bamako–Dakar Corridor, the
Table 6. State of trade facilitation in landlocked developing countries
Geographical regionTime to export
(days)
Time to import
(daysCosts to export Costs to import
Logistics performance
index score
Africa 40 52 $3 534 $4 867 2.56
Asia 55 61 $4 300 $4 876 2.38
Europe 20 20 $2 058 $2 219 2.57
South America 26 29 $1 645 $2 010 2.63
Source: World Bank World Development Indicators.
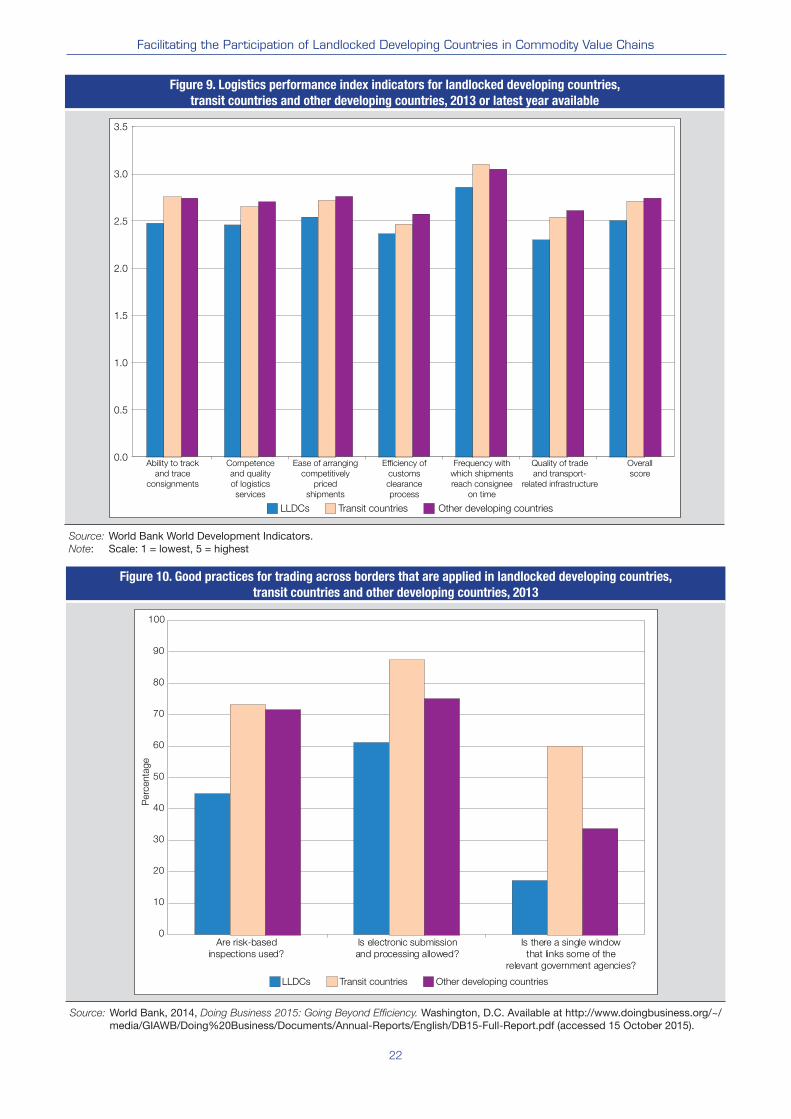
22
Facilitating the Participation of Landlocked Developing Countries in Commodity Value Chains
Figure 10. Good practices for trading across borders that are applied in landlocked developing countries,
transit countries and other developing countries, 2013
LLDCs Transit countries Other developing countries
0
10
20
30
40
50
60
70
80
90
100
Are risk-based
inspections used?
Perc
enta
ge
Is electronic submission
and processing allowed?
Is there a single window
that links some of the
relevant government agencies?
Source: World Bank, 2014, Doing Business 2015: Going Beyond Efficiency. Washington, D.C. Available at http://www.doingbusiness.org/~/media/GIAWB/Doing%20Business/Documents/Annual-Reports/English/DB15-Full-Report.pdf (accessed 15 October 2015).
Figure 9. Logistics performance index indicators for landlocked developing countries,
transit countries and other developing countries, 2013 or latest year available
LLDCs Transit countries Other developing countries
0.0
0.5
1.0
1.5
2.0
2.5
3.0
3.5
Ability to track
and trace
consignments
Competence
and quality
of logistics
services
Ease of arranging
competitively
priced
shipments
Efficiency of
customs
clearance
process
Frequency with
which shipments
reach consignee
on time
Quality of trade
and transport-
related infrastructure
Overall
score
Source: World Bank World Development Indicators.Note: Scale: 1 = lowest, 5 = highest
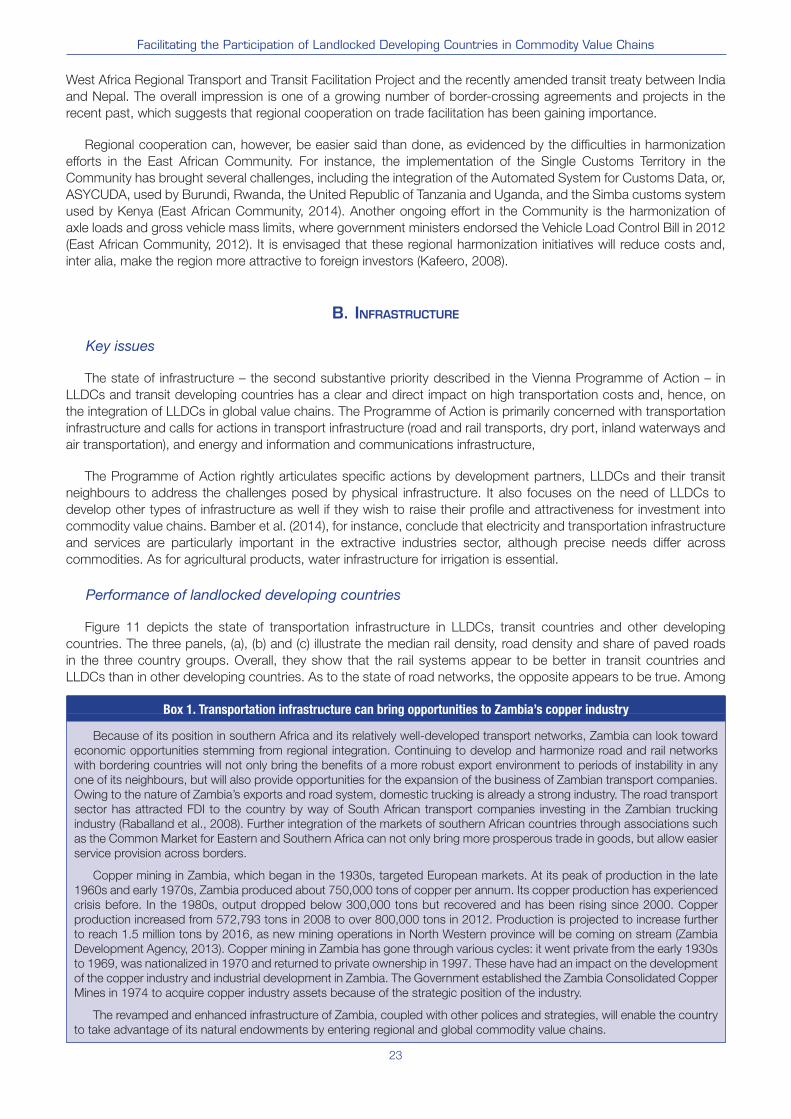
23
Facilitating the Participation of Landlocked Developing Countries in Commodity Value Chains
West Africa Regional Transport and Transit Facilitation Project and the recently amended transit treaty between India
and Nepal. The overall impression is one of a growing number of border-crossing agreements and projects in the
recent past, which suggests that regional cooperation on trade facilitation has been gaining importance.
Regional cooperation can, however, be easier said than done, as evidenced by the difficulties in harmonization
efforts in the East African Community. For instance, the implementation of the Single Customs Territory in the
Community has brought several challenges, including the integration of the Automated System for Customs Data, or,
ASYCUDA, used by Burundi, Rwanda, the United Republic of Tanzania and Uganda, and the Simba customs system
used by Kenya (East African Community, 2014). Another ongoing effort in the Community is the harmonization of
axle loads and gross vehicle mass limits, where government ministers endorsed the Vehicle Load Control Bill in 2012
(East African Community, 2012). It is envisaged that these regional harmonization initiatives will reduce costs and,
inter alia, make the region more attractive to foreign investors (Kafeero, 2008).
B. INFRASTRUCTURE
Key issues
The state of infrastructure – the second substantive priority described in the Vienna Programme of Action – in
LLDCs and transit developing countries has a clear and direct impact on high transportation costs and, hence, on
the integration of LLDCs in global value chains. The Programme of Action is primarily concerned with transportation
infrastructure and calls for actions in transport infrastructure (road and rail transports, dry port, inland waterways and
air transportation), and energy and information and communications infrastructure,
The Programme of Action rightly articulates specific actions by development partners, LLDCs and their transit
neighbours to address the challenges posed by physical infrastructure. It also focuses on the need of LLDCs to
develop other types of infrastructure as well if they wish to raise their profile and attractiveness for investment into
commodity value chains. Bamber et al. (2014), for instance, conclude that electricity and transportation infrastructure
and services are particularly important in the extractive industries sector, although precise needs differ across
commodities. As for agricultural products, water infrastructure for irrigation is essential.
Performance of landlocked developing countries
Figure 11 depicts the state of transportation infrastructure in LLDCs, transit countries and other developing
countries. The three panels, (a), (b) and (c) illustrate the median rail density, road density and share of paved roads
in the three country groups. Overall, they show that the rail systems appear to be better in transit countries and
LLDCs than in other developing countries. As to the state of road networks, the opposite appears to be true. Among
Box 1. Transportation infrastructure can bring opportunities to Zambia’s copper industry
Because of its position in southern Africa and its relatively well-developed transport networks, Zambia can look toward
economic opportunities stemming from regional integration. Continuing to develop and harmonize road and rail networks
with bordering countries will not only bring the benefits of a more robust export environment to periods of instability in any
one of its neighbours, but will also provide opportunities for the expansion of the business of Zambian transport companies.
Owing to the nature of Zambia’s exports and road system, domestic trucking is already a strong industry. The road transport
sector has attracted FDI to the country by way of South African transport companies investing in the Zambian trucking
industry (Raballand et al., 2008). Further integration of the markets of southern African countries through associations such
as the Common Market for Eastern and Southern Africa can not only bring more prosperous trade in goods, but allow easier
service provision across borders.
Copper mining in Zambia, which began in the 1930s, targeted European markets. At its peak of production in the late
1960s and early 1970s, Zambia produced about 750,000 tons of copper per annum. Its copper production has experienced
crisis before. In the 1980s, output dropped below 300,000 tons but recovered and has been rising since 2000. Copper
production increased from 572,793 tons in 2008 to over 800,000 tons in 2012. Production is projected to increase further
to reach 1.5 million tons by 2016, as new mining operations in North Western province will be coming on stream (Zambia
Development Agency, 2013). Copper mining in Zambia has gone through various cycles: it went private from the early 1930s
to 1969, was nationalized in 1970 and returned to private ownership in 1997. These have had an impact on the development
of the copper industry and industrial development in Zambia. The Government established the Zambia Consolidated Copper
Mines in 1974 to acquire copper industry assets because of the strategic position of the industry.
The revamped and enhanced infrastructure of Zambia, coupled with other polices and strategies, will enable the country
to take advantage of its natural endowments by entering regional and global commodity value chains.

24
Facilitating the Participation of Landlocked Developing Countries in Commodity Value Chains
LLDCs, the transportation infrastructure in the European LLDCs is far more advanced than in the other LLDCs. The
rail densities of the African, Asian and South American LLDCs are similar, but the Asian countries appear to have a
more developed road network than the other two regions.
Best practices and lessons learned
Regional cooperation is a recurring theme in the development of infrastructure and is now one of the six priority
areas of the Vienna Programme of Action. Corridors have received particular attention in this regard and there are now
many – existing and planned – on all continents. Examples include the Central Asia Regional Economic Cooperation24
programme, which supports the development of six corridors: the Transport Corridor Europe–Caucasus–Asia,25 which
aims to develop the silk road of the twenty-first century; the Paraguay–Parana Waterway Hub26 linking Argentina, the
Plurinational State of Bolivia, Brazil and Paraguay; and the network of three corridors in Southern and Eastern Africa
that form part of the Walvis Bay Corridors.27 The most advanced corridors are those that have moved from the initial
Figure 11. Median state of road and rail systems in landlocked developing countries, transit countries
and other developing countries, 2012 or latest year available P
erc
enta
ge
Km
0
10
20
30
40
50
60
70
80
LLDCs Transit
countries
Other developing
countries
LLDCs Transit
countries
Other developing
countries
LLDCs Transit
countries
Other developing
countries
(a) Paved roads as a percentage of total roads
0.0
0.1
0.2
0.3
0.4
0.5
0.6
0.7
0.8
(c) Rail density
(Rail lines per 100 km2)
0
5
10
15
20
25
30
35
40
(b) Road density
(Km of road per 100 km2 of land area)
Source: World Bank World Development Indicators.
Box 2. Creating links between coal production and power generation in Mongolia
Mongolia is a country with significant natural resource wealth in coal and copper. Adequate energy infrastructure to provide
heating in a very cold climate is a basic human necessity. Despite its access to abundant coal reserves, it is unlikely that
Mongolia can generate enough electricity to meet demand in 2015 (Dalrai, 2014). Some segments of the population resort
to burning natural fuels, including dung and lignite, to keep warm in the winter. The use of these types of fuels, and in old-
fashioned stoves, leads to poor air quality and health risks. Although burning coal is not environmentally friendly, centralizing
the burning of coal in more efficient power plants may improve air quality in parts of the country.
In addition, Mongolia imports power from China, to which it also exports coal, mainly through Chinese trucking companies.
Pursuing opportunities to generate more of its power internally will return a dividend not just from the increased economic
opportunities that low-cost, reliable energy brings, but will remove the extensive costs of moving coal across the border and
pay for the infrastructure that returns it in the form of power (Dalrai 2015).
25
Facilitating the Participation of Landlocked Developing Countries in Commodity Value Chains
stage of a transport corridor focusing on the improvement and integration of transportation infrastructure to a fully
fledged economic or trade corridor that features harmonized trade facilitation measures and upgraded non-transport
infrastructure and is actively engaged in attracting trade and investment to further socioeconomic development in the
region.28 Thus, a successful economic corridor is one that combines infrastructure development and trade facilitation,
as described herein.
Arnold (2006) identifies three main sources of inefficiency in economic corridors: poor interconnections, especially
difficulties at border crossings; lack of interoperability, that is, lack of harmonization for transport infrastructure and
transport units; and limited market access for transport providers, for example requiring transhipment or cargo at the
border. He also distinguishes between four institutional formats for corridor development: the legislative development
model, the project coordination model, the consensus-building model and the public–private partnership model.
Since each contains benefits and drawbacks, the model that should be adopted is therefore contingent on case-
specific circumstances. That said, some cross-cutting best practices that recur again and again in studies on corridor
development are as follows:
• Strong ownership among all participating countries;
• Extensive involvement of relevant stakeholders, including private actors;
• Sustainable financing for all phases of the project, including for corridor management and maintenance;
• Proper preparation and design before the project, including an institutional set-up with clear allocation and
coordination of roles, supported by an instituted coordination body.
• Established monitoring practices that evaluate the performance of the corridor against well-designed
performance indicators.29
C. TRADE AND INVESTMENT POLICIES
Key issues
Trade facilitation has already been treated separately because of its special significance for LLDCs. However,
other trade policy issues should also be high on policymakers’ agendas because of their potential impact on firms’
competitiveness and, by extension, countries’ integration with the world economy. Beyond the obvious need to
ensure that trade policy does not inhibit competitiveness through high tariffs on imported inputs, one of the most
urgent issues is that of complying with technical regulations and standards, which have become a significant barrier
to developing country exports. These can be public standards imposed by developed countries, but the requirements
made by standard-setting bodies or leading transnational corporations form the greatest challenge, for example,
private standards for agricultural processes and products imposed by large retailers. LLDC Governments have a
role to play in supporting their firms to meet such regulations and standards. Another high priority is services trade.
The significance of services trade to LLDCs is twofold. First, there are the global value chains in services, notably
the offshore services industry, whereby the fragmentation results in services being traded as tasks (see, for example,
Stephenson (2012), National Board of Trade (2013) and Bamber et al., 2014). Second, services are seen as enablers
of global value chains because services inputs “provide the ‘link’ or the ‘glue’ at each point of the value chain, without
which it could not happen” (Stephenson, 2012). In natural resource-rich LLDCs, services related to machinery and
equipment are believed to be significant due to the capital intensity of the mining sector in particular. Therefore, in
view of the strategic importance of services exports to their economic development through economic diversification,
LLDCs need to carry out further policy, regulatory and institutional reforms and related measures to improve the
delivery and competitiveness of their services sector.
Investment policy plays a crucial role for the participation of LLDCs in global value chains. Like international trade,
FDI is a vital channel for resources to flow to LLDCs and is a key element in building productive capacities, such as
developing human capital or improving infrastructure. It offers countries a means to acquire capital and technology
as well as to provide employment and export opportunities. In fact, it is one of the important elements of the global
value chain approach used by firms to gain competitiveness and capture niches by drawing on the knowledge,
technology and capital available in other countries (Waglé, 2011). In this context, an important task for policymakers
in LLDCs is to ensure coherence between trade investment and overall development policies. Global value chains
make such coherence all the more important because they add another dimension to the interlinkages between
trade and investment as well as productive capacities for structural economic transformation. For example, trade
policies that dampen the flow of imported inputs would have an adverse effect on export-oriented investment, and
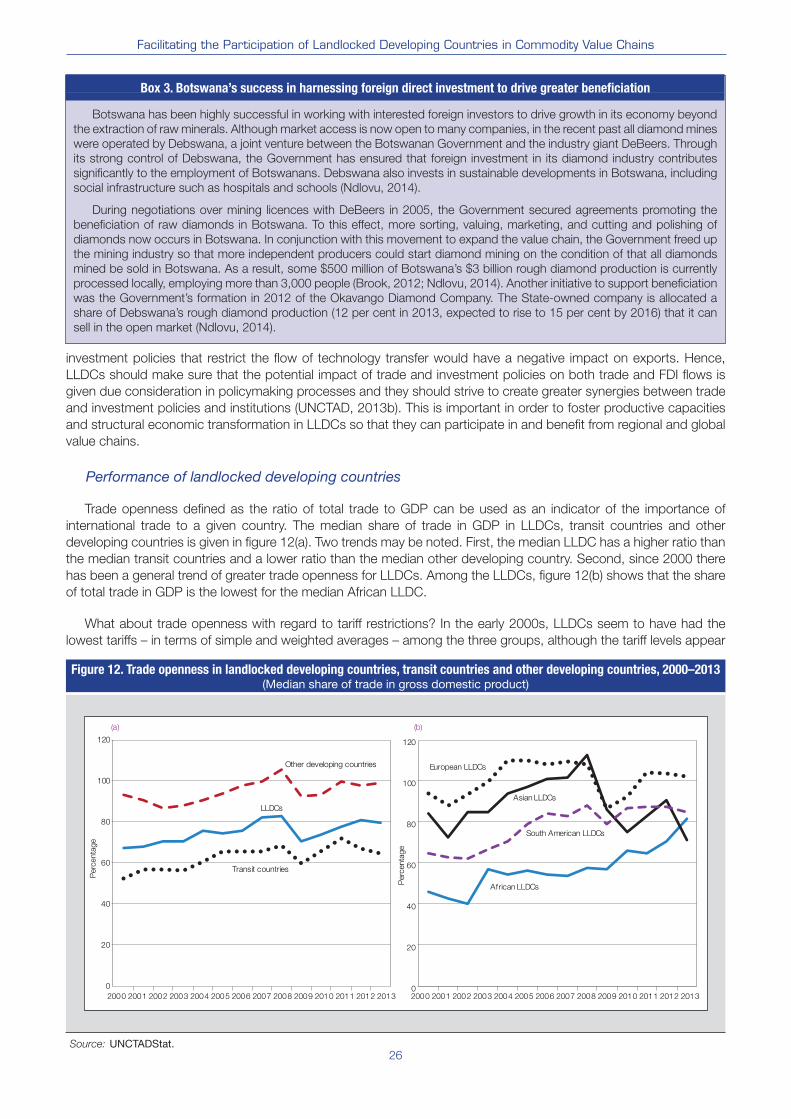
26
Facilitating the Participation of Landlocked Developing Countries in Commodity Value Chains
investment policies that restrict the flow of technology transfer would have a negative impact on exports. Hence,
LLDCs should make sure that the potential impact of trade and investment policies on both trade and FDI flows is
given due consideration in policymaking processes and they should strive to create greater synergies between trade
and investment policies and institutions (UNCTAD, 2013b). This is important in order to foster productive capacities
and structural economic transformation in LLDCs so that they can participate in and benefit from regional and global
value chains.
Performance of landlocked developing countries
Trade openness defined as the ratio of total trade to GDP can be used as an indicator of the importance of
international trade to a given country. The median share of trade in GDP in LLDCs, transit countries and other
developing countries is given in figure 12(a). Two trends may be noted. First, the median LLDC has a higher ratio than
the median transit countries and a lower ratio than the median other developing country. Second, since 2000 there
has been a general trend of greater trade openness for LLDCs. Among the LLDCs, figure 12(b) shows that the share
of total trade in GDP is the lowest for the median African LLDC.
What about trade openness with regard to tariff restrictions? In the early 2000s, LLDCs seem to have had the
lowest tariffs – in terms of simple and weighted averages – among the three groups, although the tariff levels appear
Figure 12. Trade openness in landlocked developing countries, transit countries and other developing countries, 2000–2013(Median share of trade in gross domestic product)
Perc
enta
ge
Perc
enta
ge
0
20
40
60
80
100
120
2000 2001 2002 2003 2004 2005 2006 2007 2008 2009 2010 2011 2012 2013 2000 2001 2002 2003 2004 2005 2006 2007 2008 2009 2010 2011 2012 2013
(a)
Other developing countries
LLDCs
Transit countries
0
20
40
60
80
100
120
(b)
African LLDCs
South American LLDCs
European LLDCs
Asian LLDCs
Source: UNCTADStat.
Box 3. Botswana’s success in harnessing foreign direct investment to drive greater beneficiation
Botswana has been highly successful in working with interested foreign investors to drive growth in its economy beyond
the extraction of raw minerals. Although market access is now open to many companies, in the recent past all diamond mines
were operated by Debswana, a joint venture between the Botswanan Government and the industry giant DeBeers. Through
its strong control of Debswana, the Government has ensured that foreign investment in its diamond industry contributes
significantly to the employment of Botswanans. Debswana also invests in sustainable developments in Botswana, including
social infrastructure such as hospitals and schools (Ndlovu, 2014).
During negotiations over mining licences with DeBeers in 2005, the Government secured agreements promoting the
beneficiation of raw diamonds in Botswana. To this effect, more sorting, valuing, marketing, and cutting and polishing of
diamonds now occurs in Botswana. In conjunction with this movement to expand the value chain, the Government freed up
the mining industry so that more independent producers could start diamond mining on the condition of that all diamonds
mined be sold in Botswana. As a result, some $500 million of Botswana’s $3 billion rough diamond production is currently
processed locally, employing more than 3,000 people (Brook, 2012; Ndlovu, 2014). Another initiative to support beneficiation
was the Government’s formation in 2012 of the Okavango Diamond Company. The State-owned company is allocated a
share of Debswana’s rough diamond production (12 per cent in 2013, expected to rise to 15 per cent by 2016) that it can
sell in the open market (Ndlovu, 2014).
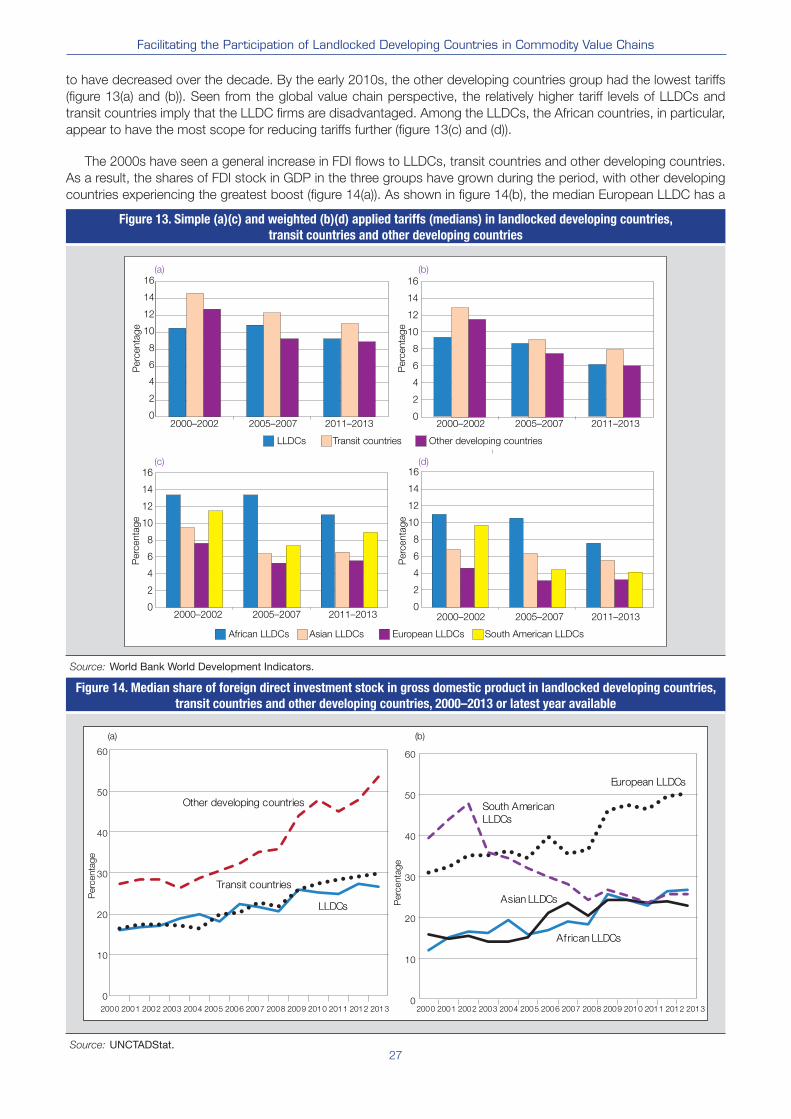
27
Facilitating the Participation of Landlocked Developing Countries in Commodity Value Chains
Figure 13. Simple (a)(c) and weighted (b)(d) applied tariffs (medians) in landlocked developing countries,
transit countries and other developing countries
Perc
enta
ge
Perc
enta
ge
Perc
enta
ge
Perc
enta
ge
0
2
4
6
8
10
12
14
16
2000–2002 2005–2007 2011–2013 2000–2002 2005–2007 2011–2013
2000–2002 2005–2007 2011–2013 2000–2002 2005–2007 2011–2013
(a)
0
2
4
6
8
10
12
14
16
(b)
0
2
4
6
8
10
12
14
16(d)
0
2
4
6
8
10
12
14
16(c)
LLDCs Transit countries Other developing countries
African LLDCs Asian LLDCs European LLDCs South American LLDCs
Source: World Bank World Development Indicators.
Figure 14. Median share of foreign direct investment stock in gross domestic product in landlocked developing countries,
transit countries and other developing countries, 2000–2013 or latest year available
Perc
enta
ge
Perc
enta
ge
2000 2001 2002 2003 2004 2005 2006 2007 2008 2009 2010 2011 2012 2013 2000 2001 2002 2003 2004 2005 2006 2007 2008 2009 2010 2011 2012 2013
Other developing countries
Transit countries
South American
LLDCs
0
10
20
30
40
50
60
(b)
Asian LLDCs
African LLDCs
European LLDCs
0
10
20
30
40
50
60
(a)
LLDCs
Source: UNCTADStat.
to have decreased over the decade. By the early 2010s, the other developing countries group had the lowest tariffs
(figure 13(a) and (b)). Seen from the global value chain perspective, the relatively higher tariff levels of LLDCs and
transit countries imply that the LLDC firms are disadvantaged. Among the LLDCs, the African countries, in particular,
appear to have the most scope for reducing tariffs further (figure 13(c) and (d)).
The 2000s have seen a general increase in FDI flows to LLDCs, transit countries and other developing countries.
As a result, the shares of FDI stock in GDP in the three groups have grown during the period, with other developing
countries experiencing the greatest boost (figure 14(a)). As shown in figure 14(b), the median European LLDC has a
28
Facilitating the Participation of Landlocked Developing Countries in Commodity Value Chains
share of almost 50 per cent, which is on a par with the median of other developing countries. The other three LLDC
groups have shares of about 22–27 per cent, with growing shares for African and Asian countries. The downward
trend seen in South America is due to a declining ratio in the Plurinational State of Bolivia.30
As for participation in the global value chain, UNCTAD (2014) reports that 49 per cent of all LLDCs’ exports are
part of a trade process of multiple stages. This is only slightly below the developing country average of 52 per cent.
However, the annual growth of global value chain participation in LLDCs has, on average, been faster than the
developing country growth rate – 18 per cent, compared with 12 per cent. Consistent with the high reliance on
commodities in LLDCs, the average LLDC share in the upstream component of global value chain participation in
2011 was relatively low: 18 per cent. The corresponding average share of other developing countries was
25 per cent.
With respect to investment policy, the World Bank’s Investing Across Borders project provides relevant data on
indicators that are grouped into four areas:
• Investing across sectors;
• Starting a foreign business;
• Accessing industrial land;
• Arbitrating commercial disputes.
Figure 15(a) shows that the median scores of LLDCs are higher than those of transit countries and other developing
countries for the first two indicators and that those of the three groups of countries are fairly similar for the other two
indicators.
Best practices and lessons learned
World Bank (2010) identifies the following good practices for the four indicators on investing across borders:
• Investing across sectors;
- Allowing foreign ownership in the primary, manufacturing and service sectors;
• Starting a foreign business;
- Equal treatment of foreign and domestic investors;
- Simple and transparent establishment process;
• Accessing industrial land;
- Clear laws which provide fair and equal treatment for foreign and domestic companies;
- Accessible land information;
- Efficient land acquisition procedures;
• Arbitrating commercial disputes;
- Strong arbitration laws in line with arbitration practice;
- Autonomy to tailor arbitration proceedings;
- Supportive local courts;
- Adherence to international conventions.
Promoting FDI should not, of course, come at the expense of socioeconomic development, and it is important to
engage with foreign investors to boost national competitiveness. Botswana, for instance, has recently made progress
in moving up the diamond value chain (Ndlovu, 2014). Botswana set up the Diamond Trading Company Botswana,
which sorts, values, markets and sells all in-country production by Debswana (the joint venture of the Government
and De Beers diamond producer). The Government also reached an agreement with De Beers to move the London
office that deals with aggregation, quality assurance and sight preparation functions to Gaborone; a relocation that
took place in 2013.
Many studies on global value chains point to the vital role that can be played by regional value chains. For
instance, Arvis et al. (2011) mention that the main exporters in the Lao People’s Democratic Republic are Thai
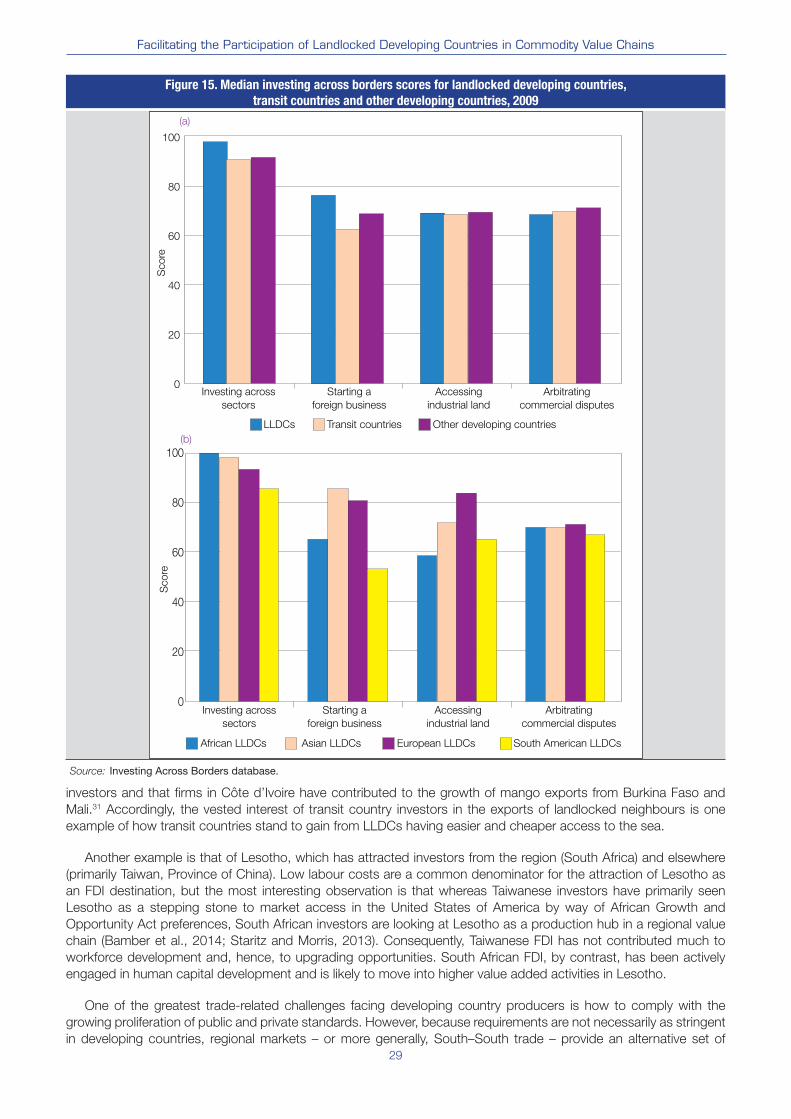
29
Facilitating the Participation of Landlocked Developing Countries in Commodity Value Chains
investors and that firms in Côte d’Ivoire have contributed to the growth of mango exports from Burkina Faso and
Mali.31 Accordingly, the vested interest of transit country investors in the exports of landlocked neighbours is one
example of how transit countries stand to gain from LLDCs having easier and cheaper access to the sea.
Another example is that of Lesotho, which has attracted investors from the region (South Africa) and elsewhere
(primarily Taiwan, Province of China). Low labour costs are a common denominator for the attraction of Lesotho as
an FDI destination, but the most interesting observation is that whereas Taiwanese investors have primarily seen
Lesotho as a stepping stone to market access in the United States of America by way of African Growth and
Opportunity Act preferences, South African investors are looking at Lesotho as a production hub in a regional value
chain (Bamber et al., 2014; Staritz and Morris, 2013). Consequently, Taiwanese FDI has not contributed much to
workforce development and, hence, to upgrading opportunities. South African FDI, by contrast, has been actively
engaged in human capital development and is likely to move into higher value added activities in Lesotho.
One of the greatest trade-related challenges facing developing country producers is how to comply with the
growing proliferation of public and private standards. However, because requirements are not necessarily as stringent
in developing countries, regional markets – or more generally, South–South trade – provide an alternative set of
Figure 15. Median investing across borders scores for landlocked developing countries,
transit countries and other developing countries, 2009
LLDCs Transit countries Other developing countries
Sco
reS
co
re
0
20
40
60
80
100
(a)
0
20
40
60
80
100
Investing across
sectors
Starting a
foreign business
Accessing
industrial land
Arbitrating
commercial disputes
Investing across
sectors
Starting a
foreign business
Accessing
industrial land
Arbitrating
commercial disputes
(b)
African LLDCs Asian LLDCs European LLDCs South American LLDCs
Source: Investing Across Borders database.
30
Facilitating the Participation of Landlocked Developing Countries in Commodity Value Chains
value chains that producers can take part in. Moreover, these regional value chains offer producers opportunities to
upgrade their activities and can therefore serve as catalysts and stepping stones towards meeting the more stringent
standards typically imposed in developed countries (African Development Bank et al., 2014; Bamber et al., 2014;
Evers et al., 2014).
Recognizing the importance of the regional dimension of global value chains, UNCTAD (2013b) advocates
regional industrial development compacts as a means to synergize trade and investment policies and, ultimately, to
optimize regional cooperation efforts. The compacts would build on four set of partnerships: between Governments
in the region, between the public and private sectors, between governments and international organizations, and
between trade and investment promotion agencies. Such compacts would take a holistic approach to enabling
regional partners to use the compact as a springboard for greater participation and upgrading in global value chains.
Among the initiatives suggested is that the compacts “could aim to create cross-border industrial clusters through
joint investments in global value chain-enabling infrastructure and productive capacity-building” (UNCTAD, 2013b).
The idea of creating industrial clusters is in line with Porter’s (1998) emphasis on the importance of clusters in gaining
competitive advantage, whereby a “nation’s successful industries are usually linked through vertical (buyer/supplier)
or horizontal (common customers, technology, channels, etc.) relationships”. Policymakers should, however, ensure
that the development of regional clusters does not stymie efforts to foster industrialization by limiting backward and
forward linkages at the domestic level.
D. PRODUCTIVE CAPACITIES: HUMAN CAPITAL, PRIVATE SECTOR DEVELOPMENT
AND NATIONAL SYSTEMS OF INNOVATION
Key issues
Productive capacity is an umbrella term that can be used more or less broadly, depending on the context. It
can encompass many issues. Here, the focus is on three aspects: human capital, private sector development and
national systems of innovation, whereas other issues, such as infrastructure and standards, are discussed in other
subsections.
It is difficult to understate the importance of human capital in a world of global value chains. After all, labour is
one of the main production factors; hence, the cost and quality of the labour force are key determinants in capturing
niches in any value chain – be it in agriculture, the extractive industries, manufactures or services (Bamber et al.,
2014). Clearly, investments in human capital, through education and workforce development, are crucial for increasing
participation and upgrading in global value chains. In the case of commodity-dependent LLDCs, the challenge is to
improve the capabilities of agricultural workers to deal with the requirements set by developed country Governments
and firms in the form of standards, stringent delivery terms and so on. In the hard commodities sectors, meanwhile,
there is a need for LLDCs to help domestic workers enhance their technical skills so as to improve their chances
of securing jobs in higher-value functions; positions that are usually filled by expatriates. This is not to suggest that
LLDCs are on their own in addressing these issues. Developed countries and other trading partners in a position to
do so also have an important role to play in building the capacity of LLDCs to meet international public and industry
standards.
The global value chain approach puts firms centre stage. A direct consequence of this is that private sector
development in LLDCs takes on increased significance. For instance, access to finance or rather lack thereof – is
a prevalent constraint for the development of the agricultural sector in developing countries. More broadly, value
chain finance, defined as “the flows of funds to and among the various links within a value chain” (Miller and Jones,
2010), is a crucial element in the competitiveness of farmers and agribusinesses. Another example of a barrier to
private sector development with considerable relevance to global value chains is the formalization of businesses, that
is to say, the shift of employment from the informal sector to the formal sector in developing economies, as it can
have positive implications on investor confidence and access to business services, formal markets and productive
resources. Although the transformation is neither easy nor swift, the Organization for Economic Cooperation and
Development (OECD) (2006) identifies the following best practices to remove barriers to formalization:
• Support broad programmes of regulatory reform and introduce regulatory impact assessments;
• Design measures to create a business-friendly culture in government and to improve service provision;
• Simplify official administration for businesses;
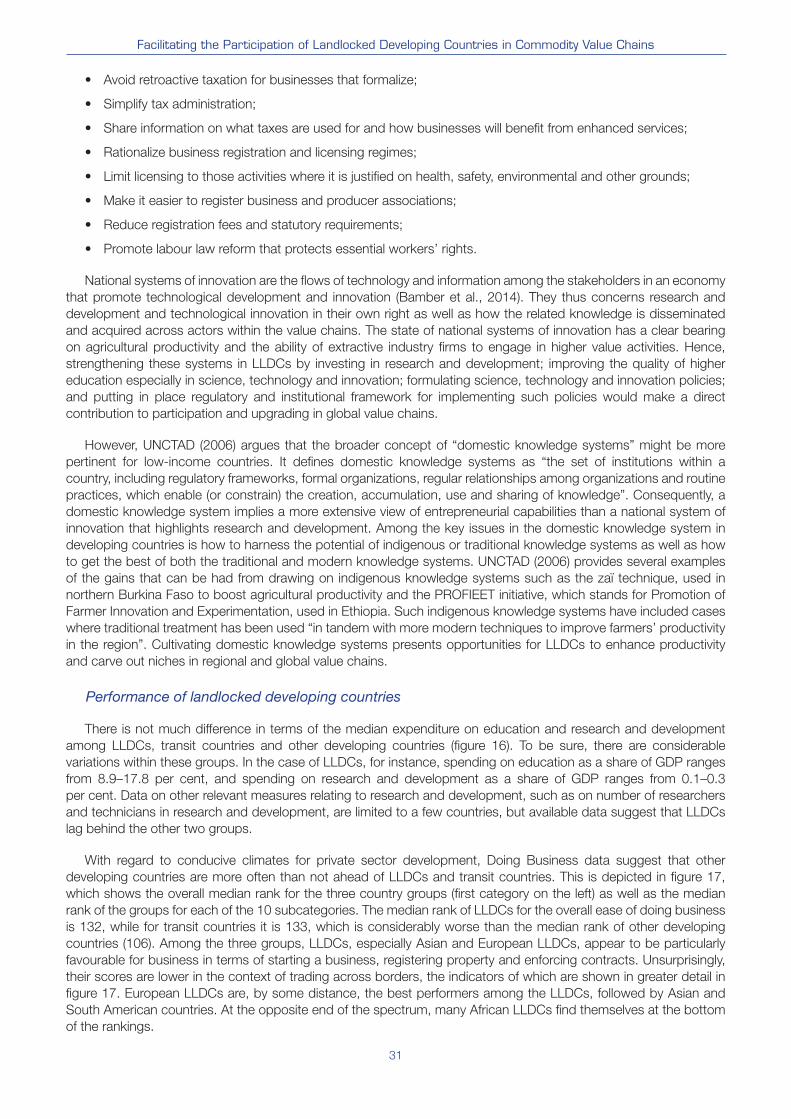
31
Facilitating the Participation of Landlocked Developing Countries in Commodity Value Chains
• Avoid retroactive taxation for businesses that formalize;
• Simplify tax administration;
• Share information on what taxes are used for and how businesses will benefit from enhanced services;
• Rationalize business registration and licensing regimes;
• Limit licensing to those activities where it is justified on health, safety, environmental and other grounds;
• Make it easier to register business and producer associations;
• Reduce registration fees and statutory requirements;
• Promote labour law reform that protects essential workers’ rights.
National systems of innovation are the flows of technology and information among the stakeholders in an economy
that promote technological development and innovation (Bamber et al., 2014). They thus concerns research and
development and technological innovation in their own right as well as how the related knowledge is disseminated
and acquired across actors within the value chains. The state of national systems of innovation has a clear bearing
on agricultural productivity and the ability of extractive industry firms to engage in higher value activities. Hence,
strengthening these systems in LLDCs by investing in research and development; improving the quality of higher
education especially in science, technology and innovation; formulating science, technology and innovation policies;
and putting in place regulatory and institutional framework for implementing such policies would make a direct
contribution to participation and upgrading in global value chains.
However, UNCTAD (2006) argues that the broader concept of “domestic knowledge systems” might be more
pertinent for low-income countries. It defines domestic knowledge systems as “the set of institutions within a
country, including regulatory frameworks, formal organizations, regular relationships among organizations and routine
practices, which enable (or constrain) the creation, accumulation, use and sharing of knowledge”. Consequently, a
domestic knowledge system implies a more extensive view of entrepreneurial capabilities than a national system of
innovation that highlights research and development. Among the key issues in the domestic knowledge system in
developing countries is how to harness the potential of indigenous or traditional knowledge systems as well as how
to get the best of both the traditional and modern knowledge systems. UNCTAD (2006) provides several examples
of the gains that can be had from drawing on indigenous knowledge systems such as the zaï technique, used in
northern Burkina Faso to boost agricultural productivity and the PROFIEET initiative, which stands for Promotion of
Farmer Innovation and Experimentation, used in Ethiopia. Such indigenous knowledge systems have included cases
where traditional treatment has been used “in tandem with more modern techniques to improve farmers’ productivity
in the region”. Cultivating domestic knowledge systems presents opportunities for LLDCs to enhance productivity
and carve out niches in regional and global value chains.
Performance of landlocked developing countries
There is not much difference in terms of the median expenditure on education and research and development
among LLDCs, transit countries and other developing countries (figure 16). To be sure, there are considerable
variations within these groups. In the case of LLDCs, for instance, spending on education as a share of GDP ranges
from 8.9–17.8 per cent, and spending on research and development as a share of GDP ranges from 0.1–0.3
per cent. Data on other relevant measures relating to research and development, such as on number of researchers
and technicians in research and development, are limited to a few countries, but available data suggest that LLDCs
lag behind the other two groups.
With regard to conducive climates for private sector development, Doing Business data suggest that other
developing countries are more often than not ahead of LLDCs and transit countries. This is depicted in figure 17,
which shows the overall median rank for the three country groups (first category on the left) as well as the median
rank of the groups for each of the 10 subcategories. The median rank of LLDCs for the overall ease of doing business
is 132, while for transit countries it is 133, which is considerably worse than the median rank of other developing
countries (106). Among the three groups, LLDCs, especially Asian and European LLDCs, appear to be particularly
favourable for business in terms of starting a business, registering property and enforcing contracts. Unsurprisingly,
their scores are lower in the context of trading across borders, the indicators of which are shown in greater detail in
figure 17. European LLDCs are, by some distance, the best performers among the LLDCs, followed by Asian and
South American countries. At the opposite end of the spectrum, many African LLDCs find themselves at the bottom
of the rankings.
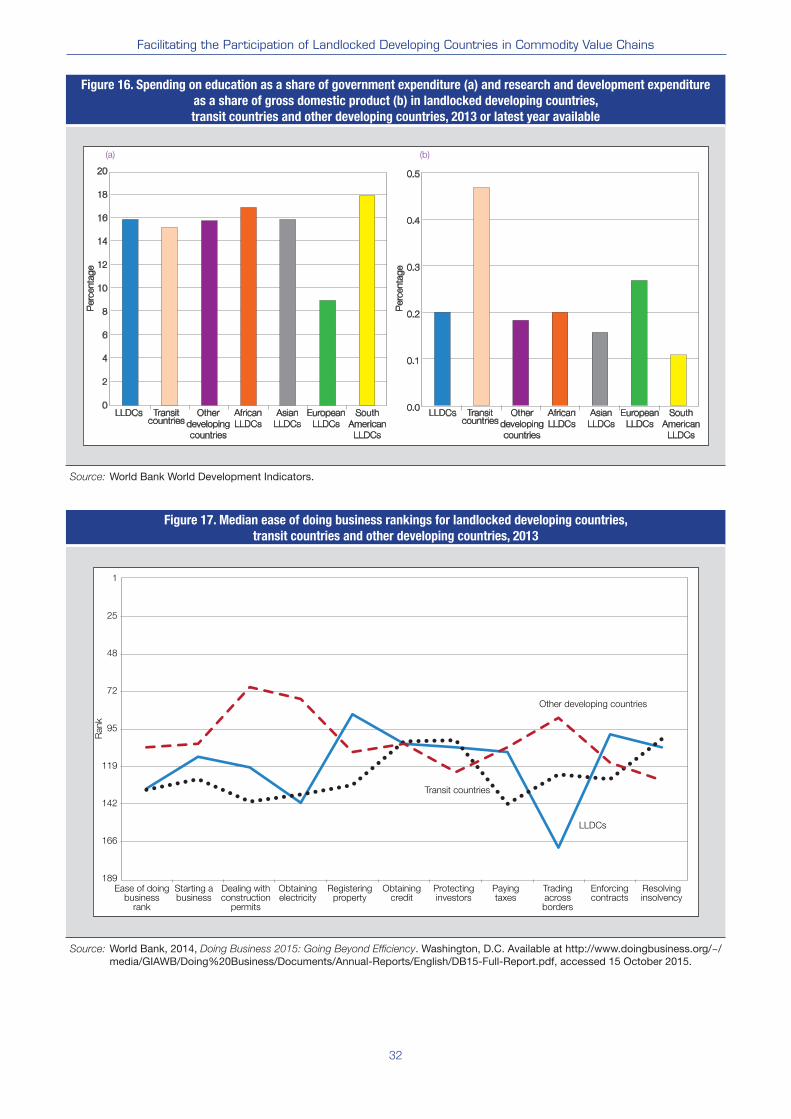
32
Facilitating the Participation of Landlocked Developing Countries in Commodity Value Chains
Figure 16. Spending on education as a share of government expenditure (a) and research and development expenditure
as a share of gross domestic product (b) in landlocked developing countries,
transit countries and other developing countries, 2013 or latest year available
Perc
enta
ge
Perc
enta
ge
0
2
4
6
8
10
12
14
16
18
20
LLDCs Transitcountries
Other
developing
countries
African
LLDCs
Asian
LLDCs
European
LLDCs
South
American
LLDCs
LLDCs Transitcountries
Other
developing
countries
African
LLDCs
Asian
LLDCs
European
LLDCs
South
American
LLDCs
0.0
0.1
0.2
0.3
0.4
0.5
(a) (b)
Source: World Bank World Development Indicators.
Figure 17. Median ease of doing business rankings for landlocked developing countries,
transit countries and other developing countries, 2013
Rank
1
25
48
72
95
119
142
166
189Ease of doing
businessrank
Starting abusiness
Dealing withconstruction
permits
Obtainingelectricity
Registeringproperty
Obtainingcredit
Protectinginvestors
Payingtaxes
Tradingacrossborders
Enforcingcontracts
Resolvinginsolvency
Other developing countries
LLDCs
Transit countries
Source: World Bank, 2014, Doing Business 2015: Going Beyond Efficiency. Washington, D.C. Available at http://www.doingbusiness.org/~/media/GIAWB/Doing%20Business/Documents/Annual-Reports/English/DB15-Full-Report.pdf, accessed 15 October 2015.
33
Facilitating the Participation of Landlocked Developing Countries in Commodity Value Chains
Best practices and lessons learned
It is clear that LLDCs should make broad-based investments and reforms in human capital, business environment
and innovation systems. One of the advantages of adopting a global value chain approach – in addition to engaging
in broad-based investments and reforms – is the development of more targeted programmes. These programmes
should be holistic in the sense that they are inclusive, involve all relevant stakeholders and analyse the entire value
chain of a sector. Proper analysis of the value chain is essential to identify opportunities and uncover the bottlenecks
and weaknesses that block those opportunities. For instance, global value chain analysis supported by functioning
economic zones (see box 4) can be a valuable tool to determine what technical skills are lacking for successful
upgrading (Fernandez-Stark et al., 2012) and to support value chain finance.
The prominent role of private sector actors is a given from a global value chain perspective; cooperation and
collaboration with firms is therefore key to develop productive capacities. At the same time, it is important to ensure
a competitive environment and limit protectionism lest the measures result in failed industrial policies such as
never-ending support and capture by incumbents (OECD et al., 2014). Indeed, a high level of competition is widely
recognized as an efficient tool for private sector development.
The vital importance of domestic competition cannot be underlined enough and is one of the points most
emphatically stressed in Porter (1998), who writes that “[a]mong the strongest empirical findings from our research
is the association between vigorous domestic rivalry and the creation and persistence of competitive advantage in
an industry”. More broadly, he identifies firm strategy, structure and rivalry as one of four key determinants of national
advantage. An interesting example of the role of domestic competition in upgrading in global value chains is the
organic and fair trade sugar industry in Paraguay (box 5).
A word of caution with respect to the global value chain approach is also in order. The fact that a country
participates in a value chain segment does not necessarily mean that upgrading is always the optimal policy.
Hausmann et al. (2008) go so far as to decry beneficiation (that is to say, moving downstream) as “a bad policy
paradigm”. Instead, they emphasize that countries should build on their existing capabilities and focus on sectors
with similar technological requirements, factor intensities and the like. This is the underlying rationale for developing
the economic complexity index discussed in section II.A. The argument does not, however, invalidate the global value
chain approach, as there are many examples of countries successfully climbing the value chains. Still, the authors’
key message is well taken: LLDCs must take into account their capabilities when designing policies to encourage
global value chain participation and upgrading.
Box 4. Economic zones to boost participation of Zambia in global value chains
Copper mining is the major mining activity in Zambia, and the mining value chain extends well beyond its borders. An
important point is that Zambia is one of the top 20 mining countries where copper mining contributes more than 2 per cent to
global production. Zambia is Africa’s largest producer of copper and cobalt and the world’s seventh largest copper producer
and the third largest producer of cobalt (2010) (Zambia Development Agency, 2013). It is home to Africa’s largest known
copper reserves, which account for 6 per cent of the world’s copper reserves. Existing mines hold resources estimated
at 2.8 billion tons of copper ores of varying quality. Although copper prices have somewhat declined, the global demand for
copper and cobalt is generally strong and expected to grow by 3 per cent annually to reach 25 million tons by 2020 .
One of Zambia’s main policy measures to facilitate participation and upgrading in global value chains is to develop industrial
parks and multi-facility economic zones (Ndlovu, 2014). These zones are expected to have well-developed communications
and transportation networks in order to overcome infrastructure bottlenecks, thereby attracting FDI that can spur industrial
development. To date, five multi-facility economic zones and one industrial park have been identified. One, developed by a
Chinese investor, is operational: the Chambishi multi-facility economic zone. The full effects of the policy are yet to be seen,
but the Chambishi one currently hosts 37 companies in both light and heavy industries, including copper smelting, agro-
processing, manufacturing of copper cable, household appliances, bars, wires and motor parts (Ndlovu, 2014). Moreover,
in addition to the improvement of infrastructure within the Chambishi multi-facility economic zone, there are indications of a
spillover effect, as infrastructure has gradually become better in the surrounding area as well (Moody, 2011).
34
Facilitating the Participation of Landlocked Developing Countries in Commodity Value Chains
E. INSTITUTIONS
Key issues
Strong institutions are one of the fundamental drivers of socioeconomic development and can play a key role in
facilitating investment in commodity value chains. In simple terms, good governance and effective institutions are
likely to have a positive impact on FDI inflows because of the certain investment climate that it provides investors. The
relationship is, however, less straightforward than might be expected, as various studies have produced different,
contradictory results (Bounoua and Maatallah, 2014). Moreover, while some governance indicators such as regulatory
quality seem to encourage FDI, others for example voice and accountability for citizens, appear to discourage it.
Some, such as government effectiveness, seem not have any significant impact at all (Berden et al., 2014). These
reservations aside, the overall impression is that strong, high-quality institutions help foster FDI inflows (World Bank,
2010) and, more importantly, that they are essential for long-term socioeconomic development.
Institutions can also take on particular relevance in the case of commodity-dependent LLDCs, especially those
that have significant reserves of hard commodities. The argument is often made that the rule of law, strong property
rights, transparent and accountable institutions and so on – what Acemoglu and Robinson (2012) lump together
in the catch-all term “inclusive institutions”– are an ultimate source of a country’s long-term growth. This theory is
certainly of relevance to commodity-dependent countries such as Botswana (box 3) and is behind initiatives such as
the Extractive Industries Transparency Initiative32 and the open data movement. In this context, Torvik (2009) presents
a simple analysis that suggests that resource abundance is associated with negative growth in an environment of
weak institutions, while the relationship is positive when the quality of institutions is good. These effects are even
stronger when only an abundance in oil and minerals is considered. Even though the analysis is limited in several
ways, the policy implications suggested are clear enough: developing good institutions is likely to diminish rent-
seeking behaviour and any associated resource curse and, as a result, have a positive impact on the economy.
Comprehensive institutions that are horizontal in their impact – in that they address broad issues such as
corruption and the rule of law that affect all spheres of political, economic and social life – may well have a positive
impact on increasing integration with the world economy, but multi-stakeholder institutions that foster cooperation
and collaboration among various actors are arguably the most directly relevant for boosting a country’s position
in global value chains. This is also what Bamber et al. (2014) have in mind when listing industry institutionalization
among the key factors affecting developing country competitiveness. The institutions in question are, first and
foremost, those that promote private sector and public sector linkages, but also initiatives to improve coordination
Box 5. Paraguay’s organic sugar industry
The genesis of the organic sugar industry in Paraguay was the production of certified organic sugar in 1994. Some 20
years later the country became the largest producer and exporter of organic and Fairtrade-certified sugar. Although these
niche markets together represent less than one per cent of the world’s entire sugar market, this is a significant achievement
that can be attributed in part to the traditional nature of the Paraguayan sugar industry – which facilitated the conversion to
organic sugar production – and the assistance of organic and fair trade sugar companies from developed countries.
In terms of upgrading in global value chains, Setrini (2011) contrasts the structures of two farmer associations: Asociación
Cañeros Orgánicos de Iturbe and Cooperativa Manduvirá. Whereas the former is typified as representing monopolistic clientelism
with many smallholder farmers dependent on a single broker and a single patron, the latter is a case of what he refers to
as “pluralistic clientelism” that has a higher degree of competition among multiple brokers and patrons. The monopolistic
clientelism model results in a top-down approach of upgrading that is characterized as dependent on upgrading and is
based on little input from farmers. The pluralistic clientelism model, by contrast, favours a more bottom-up approach that
has brought about an autonomous upgrading process that has “forged new institutional and economic ties to government
agencies, non-governmental organizations, and Fairtrade organizations and sugar buyers abroad” that “has provided the
cooperative’s growers with new market information, production knowledge, and material resources – better equipping them
to benefit from their participation in global value chains” (Setrini, 2011).
Setrini (2011) highlights the degree of competition among brokers and patrons as a key factor in determining power
relations in the two contrasting structures. He shows that the greater competition among brokers and patrons curbed the
mills’ monopsony power and leads to pluralistic clientelism, which encourages cooperation among smallholder farmers to
increase their share of value added in global value chains. The overall impression is that fostering domestic competition
among brokers and patrons, empowering weaker parties (in this case, smallholder farmers) and striving towards equality
of influence of stakeholders have long-term benefits for global value chain participation and upgrading and, more broadly,
socioeconomic development.
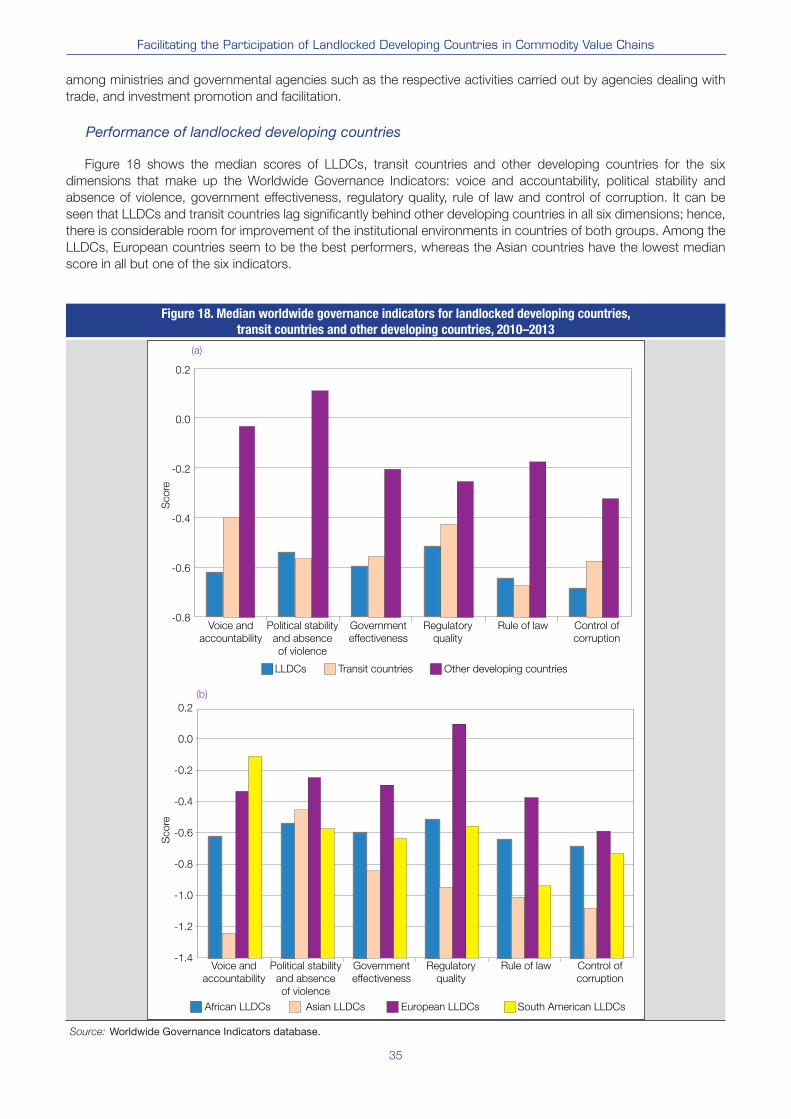
35
Facilitating the Participation of Landlocked Developing Countries in Commodity Value Chains
among ministries and governmental agencies such as the respective activities carried out by agencies dealing with
trade, and investment promotion and facilitation.
Performance of landlocked developing countries
Figure 18 shows the median scores of LLDCs, transit countries and other developing countries for the six
dimensions that make up the Worldwide Governance Indicators: voice and accountability, political stability and
absence of violence, government effectiveness, regulatory quality, rule of law and control of corruption. It can be
seen that LLDCs and transit countries lag significantly behind other developing countries in all six dimensions; hence,
there is considerable room for improvement of the institutional environments in countries of both groups. Among the
LLDCs, European countries seem to be the best performers, whereas the Asian countries have the lowest median
score in all but one of the six indicators.
Figure 18. Median worldwide governance indicators for landlocked developing countries,
transit countries and other developing countries, 2010–2013
LLDCs Transit countries Other developing countries
Sco
reS
co
re
African LLDCs Asian LLDCs European LLDCs South American LLDCs
-0.8
-0.6
-0.4
-0.2
0.0
0.2
Voice and
accountability
Political stability
and absence
of violence
Government
effectiveness
Regulatory
quality
Rule of law Control of
corruption
Voice and
accountability
Political stability
and absence
of violence
Government
effectiveness
Regulatory
quality
Rule of law Control of
corruption
(a)
-1.4
-1.2
-1.0
-0.8
-0.6
-0.4
-0.2
0.0
0.2
(b)
Source: Worldwide Governance Indicators database.
36
Facilitating the Participation of Landlocked Developing Countries in Commodity Value Chains
Best practices and lessons learned
The subsection on trade and investment policy listed the best practices that emerged from the World Bank’s
project on investing across borders, as reported in World Bank (2010). The same report highlights several measures
of how better institutions can facilitate FDI inflows. One such action is providing foreign investors with electronic
services and online access to laws and regulations, which “can make administrative processes more efficient and
transparent and do not necessarily require costly or complex technological solutions” (World Bank, 2010). Another
type of measure relates to arbitration, for example, setting up a functioning arbitral institution or requiring domestic
courts to assist arbitration procedures.
Supporting efficient investment promotion agencies is another institutional measure that can lead to higher
FDI inflows (Harding and Javorcik, 2011). Higher FDI inflows can, in turn, facilitate participation and upgrading in
regional and global value chains by building productive capacities, providing knowledge and technology transfer,
and encouraging export opportunities, as discussed in section IV.C on trade and investment policies. More efficient
investment promotion agencies can, therefore, have a positive, if indirect, impact on LLDCs’ positions in global value
chains. One of the more tangible suggestions for successful investment promotion is developed in Ortega and Griffin
(2009), who propose 14 steps that countries can take to champion a first-rate investment promotion agency. World
Bank (2012) provides additional examples of best practices in investment promotion, including attracting FDI into the
agribusiness sector.
In the context of global value chains and industry institutionalization, Bamber et al. (2014) draw attention to how
strategic public and private councils for selected industries and industry associations can promote coordination
and collaboration among multiple stakeholders. Uzbekistan is one of several LLDCs that recognize the importance
of promoting cooperation among stakeholders. Although it is too early to evaluate the initiative, it is encouraging
that it has set up an interdepartmental steering committee to oversee coordination activities related to the Welfare
Improvement Strategy of Uzbekistan for 2012–2015 (Government of Uzbekistan, 2013).
Box 6. Institutions and economic management :The cotton sector of Uzbekistan
Cotton has a long history in Uzbekistan. Its role expanded greatly in the Soviet Union era and remained so after national
independence in 1991. During the time of centralized economic systems, Uzbekistan specialized in cotton production, which
was bartered for food and other products manufactured in other parts of the former Soviet Union and other countries of the
then Council for Mutual Economic Assistance.
Uzbekistan still has a long way to go to become a fully functioning market-based or mixed economic system, although some
elements of private enterprise have been introduced. The strong role of the State provides structure to the cotton value chain
and stabilizes producer prices. There are significant downsides, however. Producer prices are low, and the highly centralized
control of the system reduces incentives for productivity improvement, sometimes at high environmental cost. As the capital
equipment used for harvesting has deteriorated, the Uzbek Government has resorted to an elaborate system of relying heavily
on labour force at harvest time that has led to spreading boycotts of products using Uzbek cotton, imperilling Uzbekistan’s
increasingly successful efforts to process more of its cotton locally into textiles and clothing. Although their economic role
has declined in recent years, cotton and cotton products still account for 20 per cent of GDP and 11 per cent of exports
(Responsible Sourcing Network, 2012). Uzbekistan has recently made progress in addressing productivity, environmental
and labour challenges as well as boosting textile and clothing production.
However, a lack of effective institutions and centralized economic management in Uzbekistan has undermined the potential
of its cotton sector. The culture of exercising strong and far-reaching control throughout the industry by the Government
makes the cotton sector less competitive. From farming methods to the ginning and selling of cotton, the centralized nature of
control allows little space for innovation or flexibility available to Uzbek cotton producers to deal with changing circumstances.
(Golub and Kestelman, 2015).
At the start of the growing season, the Uzbek Government determines a quota of cotton that is to be produced and
allocates the quota to the various administrative districts. At the district level, local bureaucrats assign quotas to local farmers,
which means they have no choice in deciding whether to plant a different crop.
Many inputs necessary for farming are provided through government or government-connected monopolies or oligopolies.
Such inputs include fertilizers, pesticides, seeds and some mechanical equipment. This market structure is conducive to
market power and is likely to raise the costs of farmers. At the end of the season, farmers are reimbursed for their cotton
based on the State procurement price, which is set by the Government in the local currency, the sum. However, owing to the
overvalued official exchange rate for the Uzbek sum, this acts as a tax on farmers’ production.
The lack of reform of these institutions has led to falling yields and production in cotton in Uzbekistan. There is substantial
room for policies that could improve the incentives for farmers to raise production levels.
37
Facilitating the Participation of Landlocked Developing Countries in Commodity Value Chains
V. Conclusion
Commodities dependence is highest in LLDCs, compared with transit developing countries and least developed
countries. A country’s landlocked status may act as a barrier for diversification as transit transport costs are relatively
higher in LLDCs, putting them in a disadvantaged position to achieve export competitiveness in manufacturing
activities. Hence, as shown in section II.A, directly or indirectly, geography dictates the choice of export structure
and performance by making export diversification, particularly into manufactures, more challenging for LLDCs.
Nevertheless, the case for diversification and structural economic transformation remains persuasive for several
reasons:
• To hedge countries against the risks of continued volatility of commodity prices and minimize the detrimental
impact of such phenomena on the trade and development prospects of commodity-dependent LLDCs;
• To minimize uncertainties in long-term global commodity price trends and the risk that specializing in exports
of primary commodities poses to the development of LLDCs;
• To minimize the high cost of transit transport resulting from a low-value high-volume export structure.
Successful and less successful experiences as well as best practices drawn from country case studies reveal
that sound policies and capable institutions are critical to enable commodity-dependent countries to transform
their natural resources wealth into sustained growth and sustainable development. In essence, countries that have
managed to register and sustain higher economic growth with substantial poverty reduction are the ones that have
broken away from the vicious circle of commodity dependence and underdevelopment. This means that LLDCs
should diversify their economic basis by fostering productive capacities and structural economic transformation,
including producing and exporting higher value added goods and services.
Linked to the above is the critical need for physical infrastructure. Infrastructure is an important productive capacity
enhancing factor and trade facilitation input that can improve business competitiveness in LLDCs. Therefore, it
is important to build or develop infrastructure, especially transport (roads and railways) in conjunction with transit
countries and neighbours to overcome the challenges of geography and remoteness from international markets.
Power (electricity) generation is another vital element in fostering productive capacities and structural economic
transformation and should be made available at affordable costs that do not undermine the competitiveness of
producers and exporters. LLDCs should also consider effective options for financing infrastructure projects, including
variations of private sector provision allowing a period for investors to recoup their investment over an agreed period
before handing back to the respective governments.
Global value chains can provide opportunities for LLDCs to take advantage of their commodities sector and are
a feature of today’s international production networks. This should be taken into account in their policymaking. This
report has examined the challenges facing commodity-dependent LLDCs in particular and discussed some of the
most pressing issues that need to be addressed to facilitate greater investment into commodity value chains. To be
sure, the issues are manifold and overlapping, but by drawing on the best practices and lessons learned (section IV),
LLDCs can strengthen their position in the global value chain.
The report has focused on what the global value chain tool brings to commodity-dependent LLDCs and their
development. Critically, it stresses that today’s international production networks are increasingly fragmented, which
entails both opportunities and challenges for LLDCs. It means that there is no need for countries to establish and
nurture entire industries, with all activities in the value chain performed in-country. Instead, LLDCs should aim to
capture certain segments of global value chains and continuously strive to upgrade their positions in them. Because
commodity-dependent LLDCs are overwhelmingly positioned towards the lower end of global value chains, such a
goal takes on increased significance. This has implications for policymaking because it stresses, for instance, the
importance of easing access to imports to support LLDC exports and the essence of engaging sincerely with private
sector actors to boost national competitiveness.
Eleven years after the ministerial conference in Almaty, a second United Nations conference on LLDCs took
place in Vienna from 3 to 5 November 2014. At the conference, participants reviewed the implementation of the
Almaty Programme of Action and forged a new development agenda for LLDCs for the next decade.33 Encouraging
progress in LLDCs was made in the past decade: the median LLDC had an annual average growth rate of 6.2
per cent (the median developing country (excluding LLDCs) had an annual average growth rate of 4.3 per cent).
The past decade also saw the LLDCs – and their specific challenges – gain greater visibility and priority. The greater
38
Facilitating the Participation of Landlocked Developing Countries in Commodity Value Chains
involvement of transit developing countries in supporting LLDCs’ integration with the world economy was mentioned
in the Vienna Programme of Action. Another case in point is the establishment of the International Think Tank for
Landlocked Developing Countries in Ulaanbaatar.34 Notwithstanding the progress made, many challenges lie ahead,
and LLDCs, like other countries, must constantly strive for improvement and seek solutions.
For sure, most of the best practices and lessons learned highlighted in this report are broad and are beyond
individual country cases. As such they do not exclusively concern commodity-dependent LLDCs per se. The main
two exceptions are policies on trade facilitation and infrastructure insofar as they concern transit, and measures to
diversify their economies. Beyond that, it is clear that all countries, developing and developed alike, need to address
issues related to trade facilitation, infrastructure, trade and investment policies, productive capacities and institutions.
Notwithstanding this, these issues are crucial and should be viewed as more pressing priorities in LLDCs than,
for instance, in transit developing countries. In this sense, therefore, the challenges facing countries vary more by
degree than by kind. The broad actions needed to tackle them are, in the main, familiar: investing in education and
human capital, developing high-quality institutions, cultivating transparent and accountable regimes and encouraging
healthy competition.
Development advice in a study like this one can only be broad and all encompassing. Therefore, policies for specific
countries need to be based on an individual country’s specific circumstances such as initial conditions, resource
base, and cultural and institutional set-up. For example, efforts to improve institutions in any one country must
inevitably take into account existing institutions in that particular country. Still, four broad policy recommendations
can be distinguished from the preceding discussions on commodity-dependent LLDCs and global value chains:
Think globally, focus regionally
Even though the concept of global value chains makes an explicit reference to the adjective global, the relevant
literature makes it clear that many value chains are more regional in nature. In fact, the overall impression is that
a stronger focus on regional value chains can bring with it greater benefits than a concern with participating and
upgrading in global value chains. Being embedded in regional production networks seems, in general, to be more
likely to encourage diversification and upgrading. Consequently, developing industrial regional clusters and regional
economic corridors should be given high priority. Moreover, favouring a regional perspective is arguably particularly
relevant for commodity-dependent LLDCs in view of their dependence on transit countries for integration with the
world economy. All of this is not, of course, to dismiss the importance of truly global value chains; some industries are
intrinsically global, and regional value chains may, in turn, be connected to global value chains. But, as the somewhat
tongue-in-cheek recommendation suggests, commodity-dependent LLDCs would do well to set their sights primarily
on participating and upgrading in regional value chains.
Engaging with all stakeholders on an equal basis
Admittedly, a recommendation to engage with multiple stakeholders is not particularly original and is not even
specific to global value chains. However, as has been seen, global value chains enhance by their very nature the role
of the private sector in developing national competitiveness. Promoting industry institutionalization through greater
dialogue and collaboration among and between public and private sector actors is therefore essential. But engaging
stakeholders does go beyond including businesses in developing policy, and commodity-dependent LLDCs need
to ensure that all relevant stakeholders are consulted: women, civil society, indigenous peoples, non-governmental
organizations and so on.
Climbing commodity value chains is important, but not an end in itself
Global value chains are not a panacea for all development challenges facing LLDCs, although global value chain
analysis is undoubtedly a powerful tool to identify opportunities to integrate more fully with the world economy.
But simply looking at a country’s current position in a given global value chain and seeking to upgrade to a higher
segment within it, may not always be the optimal strategy. As discussed earlier, Hausmann et al. (2008) instead
advocate that countries should focus on their capabilities, for example as identified in Hausmann et al. (2011).
Manufactured exports have, at least historically, been behind most successful development stories (Rodrik, 2013).
The key message is that commodity-dependent LLDCs should certainly make use of global value chain analysis in
formulating policies, but should also consider diversification strategies based on other types of analysis. In sum, in
parallel with improving their participation in regional and global commodity value chains, it is crucial for LLDCs to
39
Facilitating the Participation of Landlocked Developing Countries in Commodity Value Chains
foster industrialization and technological upgrading to build their productive capacities and accelerate structural
transformation, including economy-wide diversification.
The experiences of developed countries, advanced developing countries or emerging economies indicate that
governments have an important role to play in inducing industrialization and structural economic transformation.
Therefore, it is crucial for LLDC Governments to take a more proactive and catalytic function to stimulate productive
activities, including by creating enabling environments for business and investment. As with other developing
countries, there is a strong case for industrial policies in LLDCs. This implies that there have to be deliberate policies
by national governments of LLDCs to promote industrialization through a carefully designed industrial policy. This
can be done on the basis of principles that support and at the same time challenge firms, and contribute to building
effective and mutually supportive public–private partnerships through constructive public–private sector relationships.
In fact, such efforts would create more opportunities for LLDCs to participate and benefit from regional and global
commodity value chains.
Enhanced development partnership
National policies and strategies alone may not lead to successful socioeconomic transformation in LLDCs. There
should be a supportive and development-friendly international environment. International support measures that
effectively address the development challenges facing these countries are critical to enable them to successfully
integrate into the global economy and take advantages of regional and global commodities value chains. Such support
measures in favour of LLDCs should combine well-targeted, effective development aid, improved market access
and robust investment in hard and soft infrastructure. In this context, it is critical for LLDCs and their development
partners to develop country-specific programmes aimed at fostering productive capacities and structural economic
transformation. This can entail a paradigm shift in development partnership, including efforts to link development aid in
support of LLDCs with national priorities of recipient countries by providing direct budgetary support and establishing
monitoring mechanisms for donors’ performances at the national level. Development partners of LLDCs are also
encouraged to pursue trade policies that are conducive to the development of LLDCs, including the elimination of
market entry barriers such as non-tariff measures and other barriers to trade. Enhanced development partnerships
and effective support mechanisms are key, including in the context of the post-2015 development architecture, to
enable LLDCs to achieve the Sustainable Development Goals along with the goals and targets contained in the
Vienna Programme of Action.
40
Facilitating the Participation of Landlocked Developing Countries in Commodity Value Chains
Notes
1 Africa: Botswana, Burkina Faso, Burundi, the Central African Republic, Chad, Ethiopia, Lesotho, Malawi, Mali, the Niger,
Rwanda, South Sudan, Swaziland, Uganda, Zambia and Zimbabwe; Asia: Afghanistan, Bhutan, Kazakhstan, Kyrgyzstan, the
Lao People’s Democratic Republic, Mongolia, Nepal, Tajikistan, Turkmenistan and Uzbekistan; Europe: Armenia, Azerbaijan,
the Republic of Moldova and the former Yugoslav Republic of Macedonia; Latin America: the Plurinational State of Bolivia,
Paraguay.
2 According to Faye et al. (2004), dependence can take the following forms: dependence on transit infrastructure, dependence
on political relations with neighbours, dependence on peace and stability within transit neighbours and dependence on
administrative processes in transit.
3 See UNCTAD, 2013a, chapter 1, for a discussion on the commodity problem.
4 To be sure, several LLDCs are also caught in the other two traps: the conflict trap (armed conflict) and poor governance in a
small country.
5 The official Bolivian view, however, is “that [the Plurinational State of] Bolivia is not a landlocked State but a nation which is
deprived by temporary circumstances of access to the sea across its own coast” (Declaration made by the Plurinational State
of Bolivia upon the signature of the Convention on Transit Trade of Land-Locked States, New York, United States, on
8 July 1965). Moreover, at the time of writing, the Plurinational State of Bolivia was in a dispute with Chile at the International
Court of Justice concerning the obligation to negotiate access to the Pacific Ocean ([Plurinational State of] Bolivia v. Chile)
(see http://www.icj-cij.org/docket/index.php?p1=3&p2=3&case=153 for details, accessed 10 October 2015).
6 Defined as primary commodities, precious stones and non-monetary gold (Standard International Trade Classification (SITC)
0, 1, 2, 3, 4, 68, 667 and 971).
7 To be sure, South Sudan (which is excluded from much of the analysis due to a lack of available data) is also highly commodity
dependent. In fact, it “is the most oil dependent country in the world, with oil exports accounting for almost the totality of
exports, and for around 80 per cent of GDP” (World Bank, 2014a).
8 Transit countries are those identified as such in UN-OHRLLS, 2013: Algeria, Angola, Argentina, Bangladesh, Benin, Brazil,
Cambodia, Cameroon, Chile, China, Côte d’Ivoire, the Democratic Republic of the Congo, Djibouti, Ghana, Guinea, India, the
Islamic Republic of Iran, Kenya, Mozambique, Myanmar, Namibia, Nigeria, Pakistan, Peru, Senegal, Somalia, South Africa,
Thailand, Togo, Turkey, the United Republic of Tanzania, Uruguay and Viet Nam. Other developing countries are developing
countries that are neither LLDCs nor transit developing countries. The classification of developing countries is taken from
UNCTADStat.
9 HHIs measure the degree of product concentration on a scale from 0 to 1 (maximum concentration).
10 An additional difference with respect to the resource-based activities as defined in this report is that they include the product
gold, non-monetary (excluding gold ores and concentrates) (code 971 of SITC, Rev. 3. Lall (2000), however, excludes this
product category from the classification.
11 Armenia, Botswana and the Republic of Moldova.
12 Utilities are included in the shares because the original data lump mining and utilities together.
13 Armenia, Azerbaijan, Bhutan, the Plurinational State of Bolivia, Botswana, Burkina Faso, Ethiopia, the former Yugoslav Republic
of Macedonia, Kazakhstan, Kyrgyzstan, Lesotho, Mali, Mongolia, Nepal, Paraguay, Rwanda, the Republic of Moldova, Tajikistan,
Uganda, Uzbekistan, Zambia and Zimbabwe.
14 Soft commodities are, essentially, agricultural products; hard commodities are metals, minerals and fuels. See UNCTAD, 2013a
for more details.
15 See http://www.wto.org/english/res_e/statis_e/miwi_e/miwi_e.htm, accessed 10 October 2015.
16 See UNCTAD, 2006.
17 (a) Market governance: Arms-length simple transactions with little or no formal cooperation among firms, for example,
commodities and commoditized products (for more details see UNCTAD, 2013b); (b) modular governance: somewhat more
complex transactions where independent supplier firms make products to customers’ specifications, for example, turnkey
supplier relationships in electronics industries; (c) relational governance: complex transactions among firms, which necessitate
deeper relationships between firms and involve frequent interactions and knowledge sharing, for example, relationships between
suppliers and buyers of retailers or major apparel brands; (d) captive governance: buyer-driven transactions that are highly
controlled by lead firms, for example, tiered supplier structures in the automotive industry; and (e) hierarchical governance:
vertically integrated lead firms that have managerial control over all activities of the value chain, for example, products with
high intellectual property content, high quality risks and high brand value.
18 In mining, upstream activities comprise exploration, development and production, whereas downstream activities include the
manufacturing of value added products and the selling of these products to consumer markets. For other sectors, such as
textiles and sugar, upstream activities are those at the preliminary stages of production or processing, whereas downstream
activities include researching, processing into finished products, branding or rebranding, and selling those products to consumers,
especially at high-end markets.
19 See Arvis et al., 2010 for estimates.
20 A/CONF.202/3, annex I.
21 These include, for example, publication of information, fees and charges related to exportation and importation, release and
clearance of goods, and freedom of transit.
41
Facilitating the Participation of Landlocked Developing Countries in Commodity Value Chains
22 The LPI seeks to measure the performance of trade logistics in 160 countries and provides scores along six dimensions:
customs, infrastructure, ease of arranging shipments, quality of logistics services, tracking and tracing, and timeliness. See
http://lpi.worldbank.org/ for details (accessed 11 November 2015).
23 The average scores of landlocked and coastal low-income countries in sub-Saharan Africa are similar.
24 See www.carecprogram.org, accessed 16 October 2015.
25 See www.traceca-org.org, accessed 16 October 2015.
26 See www.iirsa.org/Page/PageDetail?Id=118 (in Spanish).
27 See www.wbcg.com.na, accessed 16 October 2015.
28 See G Mulenga, 2013.
29 In addition to Arnold, 2006, see Arvis et al., 2011; Japan International Cooperation Agency et al., 2013; Kunaka and Carruthers,
2014 and UNCTAD, 2013c.
30 For more details on FDI in LLDCs, see UNCTAD (2014).
31 For the case of mangoes from Mali, see Sangho et al., 2011.
32 See http://eiti.org, accessed 22 October 2015.
33 See http://www.lldc2conference.org, accessed 22 October 2015.
34 See http://land-locked.org/, accessed 22 October 2015.
Bibliography
Acemoglu D and Robinson JA (2012). Why Nations Fail: The Origins of Power, Prosperity and Poverty, Profile Books. London.
Acemoglu D, Johnson S and Robinson JA (2003). An African success story: Botswana. In: Rodrik D, ed. In Search of Prosperity:
Analytical Narratives on Economic Growth. Princeton University Press. Princeton, New Jersey, United States.
African Development Bank, Organization for Economic and Cooperation and Development, and United Nations Development
Programme (2014). African Economic Outlook 2014: Global Value Chains and Africa’s Industrialization. OECD Publishing.
Paris. Available at http://www.africaneconomicoutlook.org/fileadmin/uploads/aeo/2014/PDF/E-Book_African_Economic_
Outlook_2014.pdf (accessed 23 October 2015).
Arnold J (2006). Best practices in management of international trade corridors. Transport Papers. TP-13. No. 38459. December.
World Bank. Washington, D.C.
Arvis JF, Raballand G and Marteau J-F (2010). The Cost of Being Landlocked: Logistics Costs and Supply Chain Reliability. World
Bank. Washington, D.C.
Arvis JF, Carruthers R, Smith G and Willoughby C (2011). Connecting Landlocked Developing Countries to Markets: Trade Corridors
in the 21st Century. World Bank. Washington, D.C.
Baldwin R (2011). Trade and industrialization after globalization’s 2nd unbundling: How building and joining a supply chain are
different and why it matters. NBER Working Paper Series, Working Paper 17716. National Bureau of Economic Research.
Cambridge, Massachusetts, United States.
Bamber P, Fernandez-Stark K, Gereffi G and Guinn A (2014). Connecting local producers in developing countries to regional and
global value chains: Update. OECD Trade Policy Papers. No. 160. OECD Publishing.
Berden K, Bergstrand JH and van Etten E (2014). Governance and globalization. The World Economy. 37(3):353–386.
Bounoua C and Maatallah S (2014). The impact of institutional quality in attracting foreign direct investment in Algeria. Topics in
Middle Eastern and African Economies. September. 16(2):142–163.
Brook MC (2012). The Journey of Botswana’s Diamonds. Diamond Trading Company. Gaborone.
Capital Resources (2013). Botswana Resource Sector Overview 2013/14. Available at http://www.capconferences.com/files/2013/06/
BOTSWANA-RESOURCE-SECTOR-OVERVIEW-2013.pdf (accessed 22 October 2015).
Cattaneo O and Miroudot S (2013). From global value chains to global development chains: An analysis of recent changes in trade
patterns and development paradigms. In: Zedillo E and Hoekman B, eds. 21st Century Trade Policy: Back to the Past? Yale
University. New Haven, Connecticut, United States.
Cattaneo O, Gereffi G, Miroudot S and Taglioni D (2013). Joining, upgrading and being competitive in global value chains: A strategic
framework. World Bank Policy Research Working Paper. No. 6406. World Bank. Washington, D.C.
Collier P (2007). The Bottom Billion: Why the Poorest Countries Are Failing and What Can Be Done About It. Oxford University
Press. Oxford, United Kingdom of Great Britain and Northern Ireland.
Dalrai D (2014). Turning commodity dependence into sustainable, inclusive and equitable economic growth for landlocked developing
countries: The case of Mongolia. Unpublished background paper prepared for UNCTAD.
East African Community (2012). Ministers endorse EAC [East African Community] vehicle load control bill. Press release.
18 February 2012. Arusha, United Republic of Tanzania.
East African Community and East African Legislative Assembly (2014). Report of the Committee on Communication, Trade and
Investments on the On-spot Assessment of the EAC [East African Community] Single Customs Territory (EAC SCT). East
African Community Headquarters. Arusha, United Republic of Tanzania.
Erdenebileg S (2014). WTO [World Trade Organization] Agreement on Trade Facilitation: Implications for the LLDCs. Slide
presentation given at Glen Cove, New York, United States. 10 May. Available at http://www.lldc2conference.org/custom-content/
uploads/2014/05/WTO-Agreement-on-Trade-Facilitation-Mr.-Erdenebileg1.pdf (accessed 23 October 2015).
42
Facilitating the Participation of Landlocked Developing Countries in Commodity Value Chains
Evers B, Opondo M, Barrientos S, Krishnan A, Amoding F and Ndlovu L (2014). Global and regional supermarkets: Implications for
producers and workers in Kenyan and Ugandan horticulture. Capturing the Gains Working Paper 2014/39.
Faye ML, McArthur JW, Sachs JD and Snow T (2004). The challenges facing landlocked developing countries. Journal of Human
Development and Capacities. 5(1): 31–68.
Fernandez-Stark K, Bamber P and Gereffi G (2012). Upgrading in global value chains: Addressing the skills challenge in developing
countries. OECD Background Paper. Center on Globalization, Governance and Competitiveness, Duke University. Durham,
North Carolina, United States.
Gereffi G and Fernandez-Stark K (2011). Global Value Chain Analysis: A Primer. Center on Globalization, Governance and
Competitiveness. Duke University. Durham, North Carolina, United States. Available at http://www.cggc.duke.edu/pdfs/2011-
05-31_global value chain_analysis_a_primer.pdf (accessed 23 October 2015).
Golub S and Kestelman S (2015). Uzbekistan’s cotton value chain: Report to UNCTAD. Unpublished background paper prepared for
UNCTAD. Available at http://www.slideshare.net/StephanieKestelman/lldcsuzbekistancottonfinal (accessed 23 October 2015).
Government of Botswana (2008). Botswana Excellence: A Strategy for Economic Diversification and Sustainable Growth. November.
Gaborone.
Government of Botswana (2011). Economic Diversification Drive: Medium to Long-Term Strategy (2011–2016). Ministry of Trade
and Industry.
Government of Uzbekistan (2013). Welfare Improvement Strategy of the Republic of Uzbekistan for 2013–2015. Tashkent.
Harding T and Javorcik BS (2011). Roll out the red carpet and they will come: Investment promotion and FDI inflows. The Economic
Journal. 121(557): 1445–1476.
Hausmann R, Klinger B and Lawrence R (2008). Examining beneficiation. Center for International Development Working Paper
No. 162. Harvard University.
Hausmann R, Hidalgo CA, Bustos S, Coscia M, Chung S, Jimenez J, Simoes A and Yildirim M (2011). The Atlas of Economic
Complexity. Puritan Press. Cambridge, Massachusetts, United States.
Humphrey J and Memedovic O (2006). Global value chains in the agrifood sector. United Nations Industrial Development Organization
Working Paper. Vienna. United Nations Industrial Development Organization.
Japan International Cooperation Agency, PADECO Co., Ltd. and Nippon Koei Co., Ltd. (2013) Data Collection Survey for Economic
and Industrial Development along Economic Corridors in Southern Africa. Final Report. Tokyo. Japan International Cooperation
Agency,
Kafeero E (2008). Customs and trade facilitation in the East African Community (EAC). World Customs Journal. 2(1): 63–71.
Kunaka C and Carruthers R (2014). Trade and Transport Management Toolkit. Washington, D.C.
Lall S (2000). The technological structure and performance of developing country manufactured exports, 1985–1998. Queen
Elizabeth House Working Paper Series. No. 44. Oxford University. Oxford, United Kingdom.
Lederman D and Maloney WF, eds. (2007). Natural Resources: Neither Curse Nor Destiny. World Bank and Stanford University
Press. Washington, D.C. and Palo Alto, California, United States.
Lewin M (2011). Botswana’s success: Good governance, good policies and good luck. In: Chuhan-Pole P and Angwafo M, eds.
Yes Africa Can: Success Stories from a Dynamic Continent. World Bank:81–90. Washington, D.C.
Lloyd’s Marine Intelligence Unit (2009). Measuring Global Seaborne Trade. Slide presentation by Mandryk W. International Maritime
Statistics Forum, New Orleans, 4–6 May.
Mbayi L (2013). Turning rough dreams into a polished reality? Investigating the formation of human capital in Botswana’s diamond
cutting and polishing industry. PhD thesis. The Open University. Milton Keynes, United Kingdom.
Miller C and Jones L (2010). Agricultural Value Chain Finance: Tools and Lessons. Food and Agriculture Organization of the United
Nations and Practical Action Publishing. Rome and Rugby, United Kingdom.
Moody T (2011). Are special economic zones the way forward in Zambia? Think Africa Press. 22 August.
Available at http://thinkafricapress.com/zambia/are-special-economic-zones-way-forward-zambia.
Morris M, Kaplinsky R and Kaplan D (2012). One Thing Leads to Another: Promoting Industrialization by Making the Most of the
Commodity Boom in sub-Saharan Africa. Available at http://www.prism.uct.ac.za/Downloads/MMCP%20Book.pdf (accessed
11 November 2015).
National Board of Trade of Sweden (2013). Global Value Chains and Services: An Introduction. Stockholm.
Mulenga G (2013). Developing economic corridors in Africa: Rationale for the participation of the African Development Bank.
African Development Bank Group Regional Integration Brief. No. 1. April. New Partnership for Africa’s Development. Regional
Integration and Trade Department.
Ndlovu L (2014). Identifying growth opportunities and supporting measures to facilitate investment in commodity value chains in
landlocked developing countries: The case of Botswana and Zambia. Unpublished background paper prepared for UNCTAD.
Organization for Economic Cooperation and Development (2006). Promoting Pro-Poor Growth: Private Sector Development.
OECD Publishing. Paris.
Organization for Economic Cooperation and Development, World Trade Organization and World Bank Group (2014). Global Value
Chains: Challenges, Opportunities and Implications for Policy. Report prepared for submission to the Group of 20 Trade
Ministers Meeting, Sydney, Australia, 19 July.
Ortega C and Griffin C (2009). Investment promotion essentials: What sets the world’s best investment facilitators apart from the
rest. Investment Climate in Practice. No. 6. Investment Climate Advisory Services. World Bank Group. Washington, D.C.
Osakwe P (2007). Export diversification and the dilemma of African development. Applied Econometrics and International
Development. 7(2).
Porter ME (1998). The Competitive Advantage of Nations. Palgrave. Hampshire and New York.

43
Facilitating the Participation of Landlocked Developing Countries in Commodity Value Chains
Raballand G, Kunaka C and Giersing B (2008). The impact of regional liberalization and harmonization in road transport services: A
focus on Zambia and lessons for landlocked countries. Policy Research Working Paper 4482. World Bank. Washington, D.C.
Radelet S and Sachs J (1998). Shipping Costs, Manufacturing Exports and Economic Growth. Paper presented at the Annual
Meeting of the American Economic Association.
Redding S and Venables A (2003). Geography and export performance: External market access and internal supply capacity.
National Bureau of Economic Research Working Paper No. 9637. Cambridge, Massachusetts, United States.
Responsible Sourcing Network (2012). From the Field: Travels of Uzbek Cotton through the Value Chain. San Francisco, California,
United States.
Rodrik D (2013). The past, present and future of economic growth. Working Paper, No. 1. Global Citizen Foundation. June. Geneva,
Switzerland.
Sangho Y, Labaste P and Ravry C (2011). Growing Mali’s mango exports: Linking farmers to market through innovations in the
value chain. In: Chuhan-Pole P and Angwafo M, eds. Yes Africa Can: Success Stories from a Dynamic Continent. World Bank:
167–184. Washington, D.C.
Setrini G (2011). Global Niche Markets and Local Development: Clientelism and Fairtrade Farmer Organizations in Paraguay’s
Sugar Industry. PhD thesis. Massachusetts Institute of Technology. Available at http://dspace.mit.edu/handle/1721.1/68941
(accessed 11 November 2015).
Smith A (1904). An Inquiry into the Nature and Causes of the Wealth of Nations. London. Methuen and Co., Ltd. Available at http://
www.econlib.org/library/Smith/smWN.html (accessed 11 November 2015).
Staritz C and Morris M (2013). Local embeddedness, upgrading and skill development: Global value chains and foreign direct
investment in Lesotho’s apparel industry. Capturing the Gains Working Paper 20. University of Manchester. Manchester, United
Kingdom. Available at http://www.capturingthegains.org/pdf/ctg-wp-2013-20.pdf (accessed 11 November 2015).
Stephenson S (2012). Services and global value chains. In: The Shifting Geography of Global Value Chains: Implications for
Developing Countries and Trade Policy. Global Agenda Council on the Global Trade System. World Economic Forum: 18–23.
Geneva, Switzerland.
Torres R (2014). Introduction of the WTO [World Trade Organization] Agreement on Trade Facilitation and its implications for LLDCs.
Slide presentation. High-level International Workshop. Mongolia. 2–3 June. Available at http://www.lldc2conference.org/
custom-content/uploads/2014/06/Raul-Intro-to-TFA-WTO.pdf (accessed 11 November 2015).
Torvik R (2009). “Why do some resource-abundant countries succeed while others do not?” Oxford Review of Economic Policy.
25(2): 241–256.
UNCTAD (2006). The Least Developed Countries Report 2006: Developing Productive Capacities. United Nations publication. Sales
No. E.06.II.D.9. New York and Geneva.
UNCTAD (2013a). Commodities and Development Report: Perennial Problems, New Challenges and Evolving Perspectives. United
Nations publication. New York and Geneva.
UNCTAD (2013b). World Investment Report 2013. Global Value Chains: Investment and Trade for Development. United Nations
publication. Sales No. E.13.II.D.5. New York and Geneva.
UNCTAD (2013c). The Way to the Ocean: Transit Corridors Servicing the Trade of Landlocked Developing Countries. United Nations
publication. New York and Geneva.
UNCTAD (2014). World Investment Report 2014: Investing in the SDGs – An Action Plan. United Nations publication. Sales
No. E.14.II.D.1. New York and Geneva.
United Nations Development Programme (2010). Uzbekistan’s textile industry: How to implement development potential. Policy
Brief No. 1 (14).
United Nations (2003). Report of the International Ministerial Conference of Landlocked and Transit Developing Countries and donor
countries and International Financial and Development Institutions on Transit Transport Cooperation. Annex I. A/CONF.202/3.
United Nations Office of the High Representative for the Least Developed Countries, Landlocked Developing Countries and Small
Island Developing States (2013). The Development Economics of Landlockedness: Understanding the Development Costs of
Being Landlocked. United Nations publication. New York.
United States Department of Agriculture (2012). International Agriculture Trade Report: Cotton Losing Share to Man-Made Fibers.
BiblioGov.
United States Department of Agriculture (2014). GAIN report. 11 November. BiblioGov.
United States Department of Agriculture (2014). 2014 Exporter Guide. BiblioGov.
University of California (2003). California Magazine.
Varela Torres E (2014). Identifying growth opportunities and supporting measures to facilitate investment in commodity value chains
in landlocked developing countries, case study of the sugar sector of Paraguay. Unpublished background paper prepared for
UNCTAD.
Waglé S (2011). Investing across borders with heterogeneous firms: Do FDI-specific regulations matter? World Bank Policy Research
Working Paper No. 5914.
Weisskopf N, Juhel M and Tanase V (2013). Improving connectivity for landlocked developing countries: Preparing the comprehensive
10-year review of the Almaty Programme of Action. 18 June. Available at http://blogs.worldbank.org/transport/improving-
connectivity-landlocked-developing-countries-preparing-comprehensive-10-year-review-almaty (accessed 23 October 2015).
World Bank (2008). Improving Trade and Transport for Landlocked Developing Countries: World Bank Contributions to Implementing
the Almaty Programme of Action – A Report for the Mid-term Review. International Bank for Reconstruction and Development/
World Bank. Washington, D.C.
44
Facilitating the Participation of Landlocked Developing Countries in Commodity Value Chains
World Bank (2010). Investing Across Borders 2010: Indicators of foreign direct investment regulation in 87 economies. World Bank
Group. Washington, D.C.
World Bank (2012). Global Investment Promotion Best Practices 2012. World Bank Group. Washington, D.C.
World Bank (2014a). Overview: South Sudan. Available at http://www.worldbank.org/en/country/southsudan/overview (accessed
26 May 2014).
World Bank (2014b). Doing Business 2015: Going Beyond Efficiency. Washington, D.C. Available at http://www.doingbusiness.org/~/
media/GIAWB/Doing%20Business/Documents/Annual-Reports/English/DB15-Full-Report.pdf (accessed 15 October 2015)
World Trade Organization (2013). Agreement on trade facilitation. Ministerial decision of 7 December 2013. WT/MIN(13)/36,
WT/L/911. Bali. 11 December.
Zambia Development Agency (2013). Sub-Sector Profile: Mineral Beneficiation – Industrial Minerals, Lusaka.