
SarkariBook · PDF fileSarkariBook.Com Join Our Facebook Page :- Facebook Group :- Twitter :- https

Facebook Q1 2019 Results
investor.fb.com
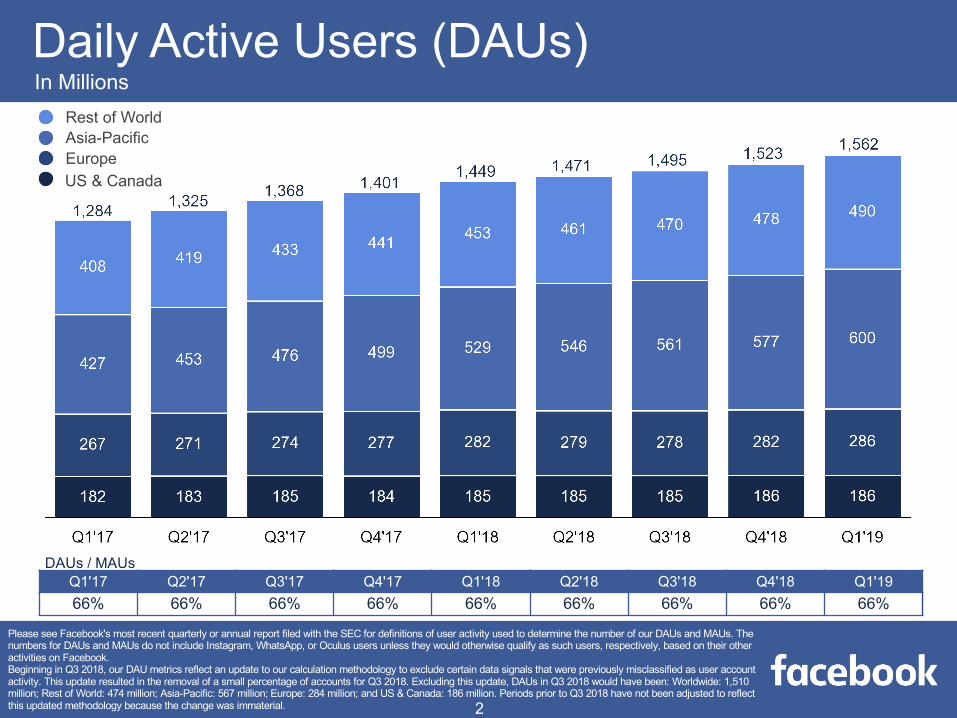
Daily Active Users (DAUs)In Millions
Rest of WorldAsia-PacificEuropeUS & Canada
DAUs / MAUsQ1'17 Q2'17 Q3'17 Q4'17 Q1'18 Q2'18 Q3'18 Q4'18 Q1'1966% 66% 66% 66% 66% 66% 66% 66% 66%
Please see Facebook's most recent quarterly or annual report filed with the SEC for definitions of user activity used to determine the number of our DAUs and MAUs. The numbers for DAUs and MAUs do not include Instagram, WhatsApp, or Oculus users unless they would otherwise qualify as such users, respectively, based on their other activities on Facebook.Beginning in Q3 2018, our DAU metrics reflect an update to our calculation methodology to exclude certain data signals that were previously misclassified as user account activity. This update resulted in the removal of a small percentage of accounts for Q3 2018. Excluding this update, DAUs in Q3 2018 would have been: Worldwide: 1,510 million; Rest of World: 474 million; Asia-Pacific: 567 million; Europe: 284 million; and US & Canada: 186 million. Periods prior to Q3 2018 have not been adjusted to reflect this updated methodology because the change was immaterial. 2
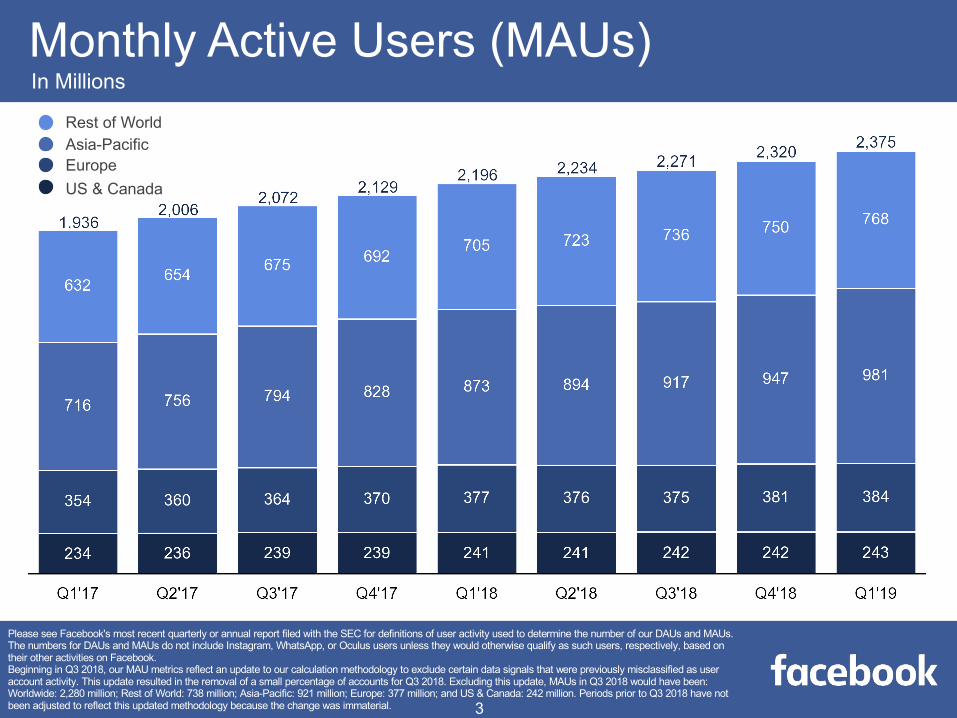
Monthly Active Users (MAUs)In Millions
3
Rest of WorldAsia-PacificEuropeUS & Canada
Please see Facebook's most recent quarterly or annual report filed with the SEC for definitions of user activity used to determine the number of our DAUs and MAUs. The numbers for DAUs and MAUs do not include Instagram, WhatsApp, or Oculus users unless they would otherwise qualify as such users, respectively, based on their other activities on Facebook.Beginning in Q3 2018, our MAU metrics reflect an update to our calculation methodology to exclude certain data signals that were previously misclassified as user account activity. This update resulted in the removal of a small percentage of accounts for Q3 2018. Excluding this update, MAUs in Q3 2018 would have been: Worldwide: 2,280 million; Rest of World: 738 million; Asia-Pacific: 921 million; Europe: 377 million; and US & Canada: 242 million. Periods prior to Q3 2018 have not been adjusted to reflect this updated methodology because the change was immaterial.
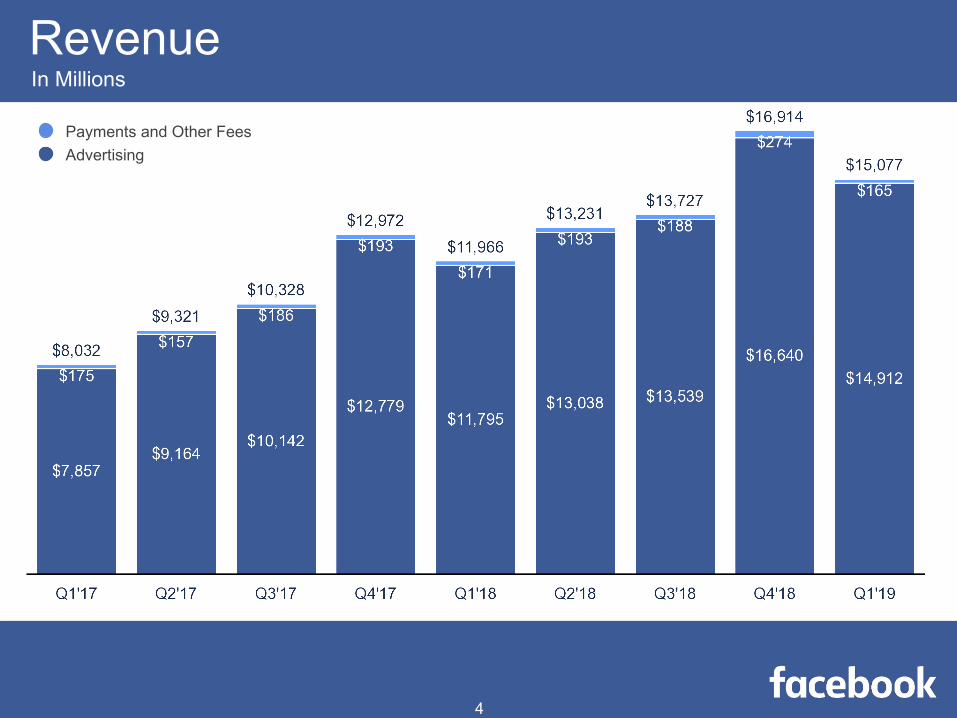
RevenueIn Millions
Payments and Other FeesAdvertising
4
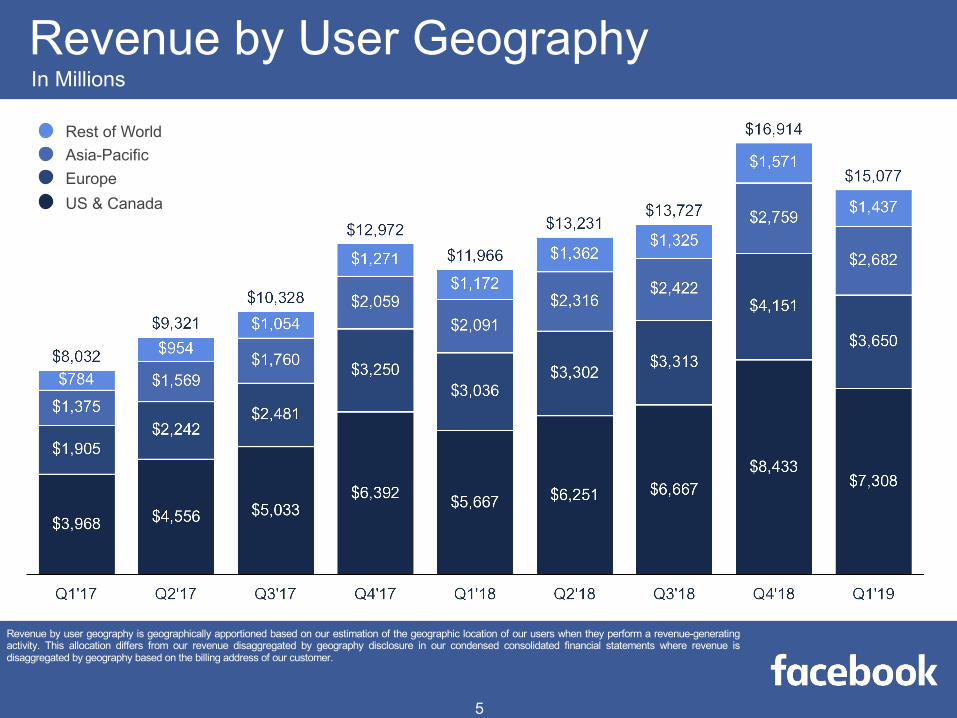
Revenue by User GeographyIn Millions
Rest of WorldAsia-PacificEuropeUS & Canada
Revenue by user geography is geographically apportioned based on our estimation of the geographic location of our users when they perform a revenue-generatingactivity. This allocation differs from our revenue disaggregated by geography disclosure in our condensed consolidated financial statements where revenue isdisaggregated by geography based on the billing address of our customer.
5
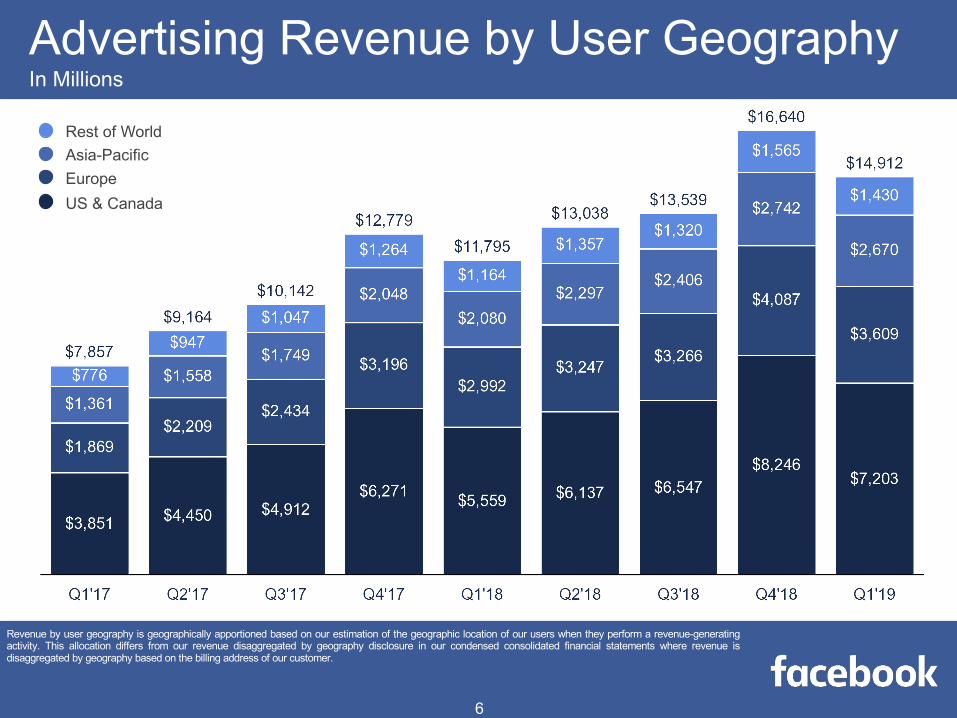
Advertising Revenue by User GeographyIn Millions
Rest of WorldAsia-PacificEuropeUS & Canada
6
Revenue by user geography is geographically apportioned based on our estimation of the geographic location of our users when they perform a revenue-generatingactivity. This allocation differs from our revenue disaggregated by geography disclosure in our condensed consolidated financial statements where revenue isdisaggregated by geography based on the billing address of our customer.
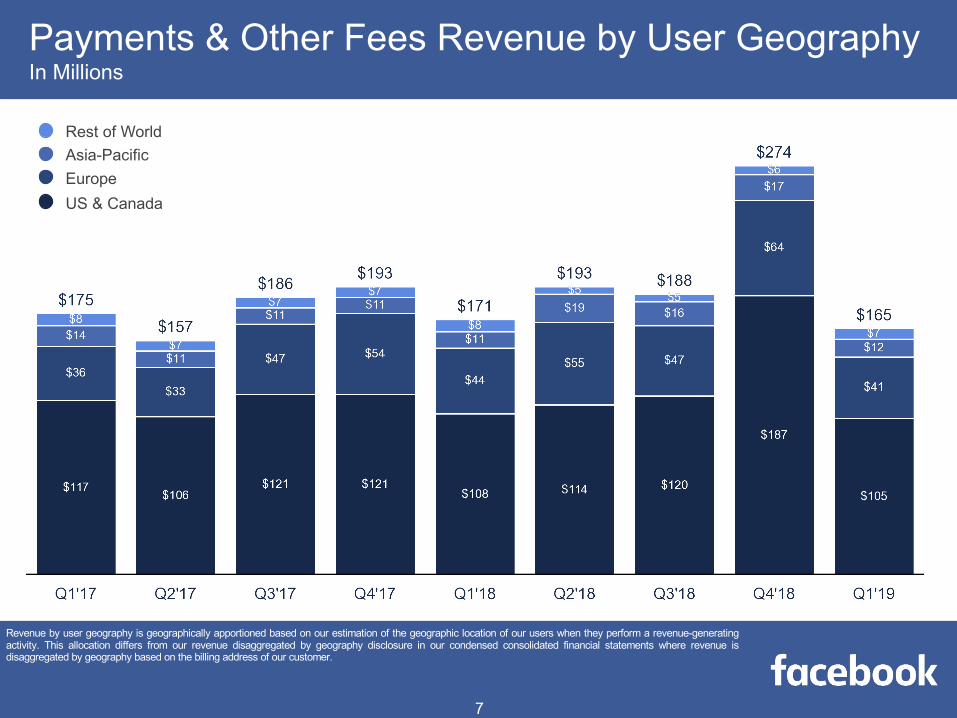
Payments & Other Fees Revenue by User GeographyIn Millions
Rest of WorldAsia-PacificEuropeUS & Canada
7
Revenue by user geography is geographically apportioned based on our estimation of the geographic location of our users when they perform a revenue-generatingactivity. This allocation differs from our revenue disaggregated by geography disclosure in our condensed consolidated financial statements where revenue isdisaggregated by geography based on the billing address of our customer.
Europe
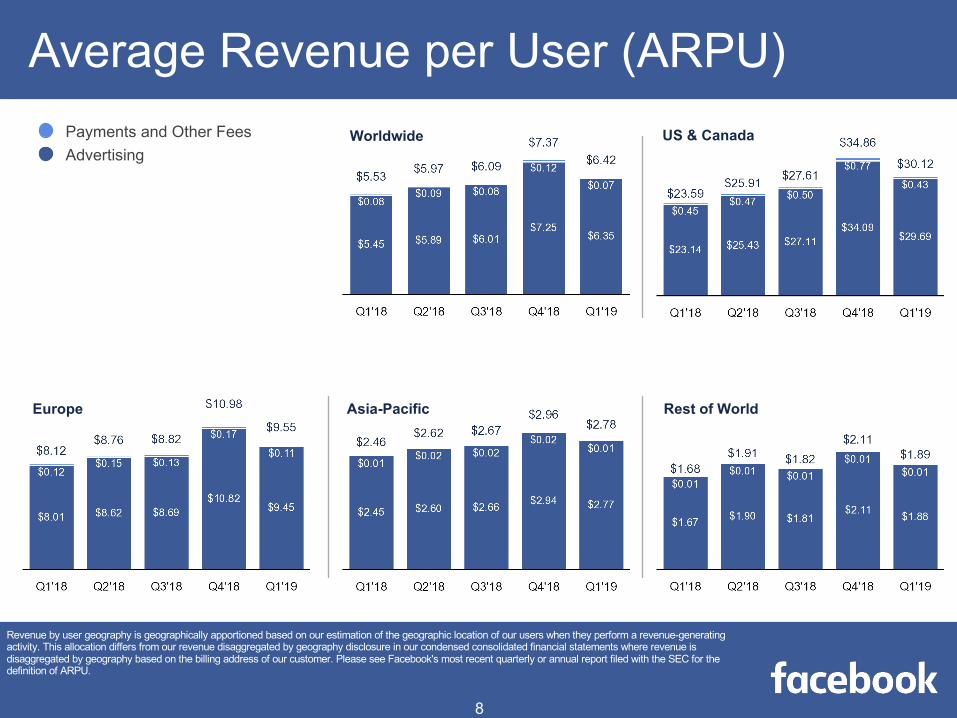
Average Revenue per User (ARPU)Worldwide US & Canada
Asia-Pacific Rest of World
Payments and Other FeesAdvertising
8
Revenue by user geography is geographically apportioned based on our estimation of the geographic location of our users when they perform a revenue-generating activity. This allocation differs from our revenue disaggregated by geography disclosure in our condensed consolidated financial statements where revenue is disaggregated by geography based on the billing address of our customer. Please see Facebook's most recent quarterly or annual report filed with the SEC for the definition of ARPU.
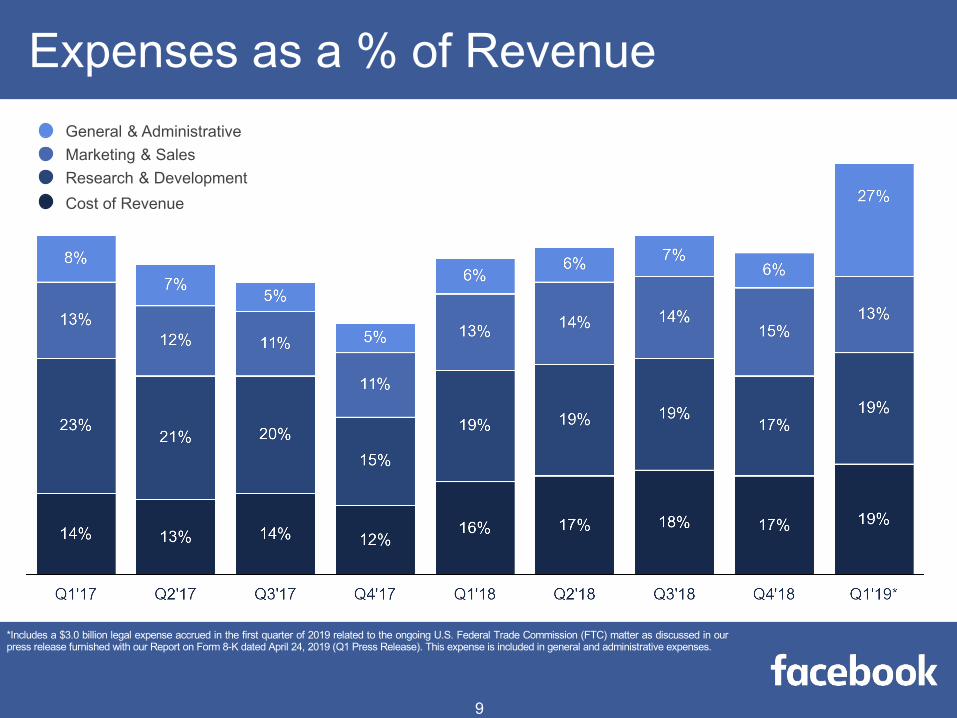
General & AdministrativeMarketing & SalesResearch & DevelopmentCost of Revenue
9
Expenses as a % of Revenue
*Includes a $3.0 billion legal expense accrued in the first quarter of 2019 related to the ongoing U.S. Federal Trade Commission (FTC) matter as discussed in ourpress release furnished with our Report on Form 8-K dated April 24, 2019 (Q1 Press Release). This expense is included in general and administrative expenses.
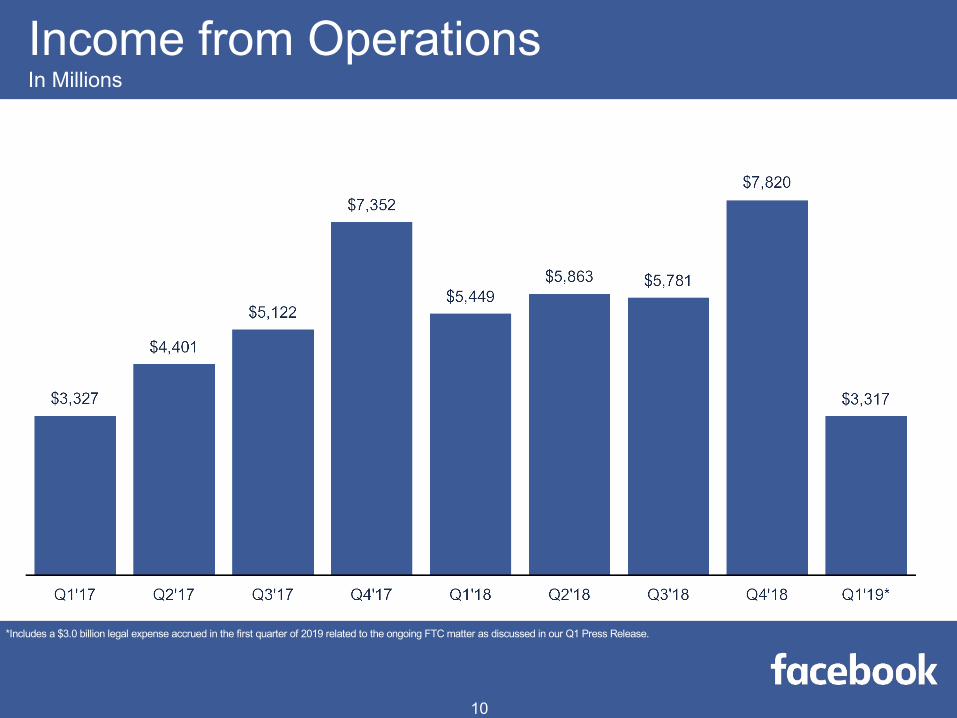
*Includes a $3.0 billion legal expense accrued in the first quarter of 2019 related to the ongoing FTC matter as discussed in our Q1 Press Release.
Income from OperationsIn Millions
10
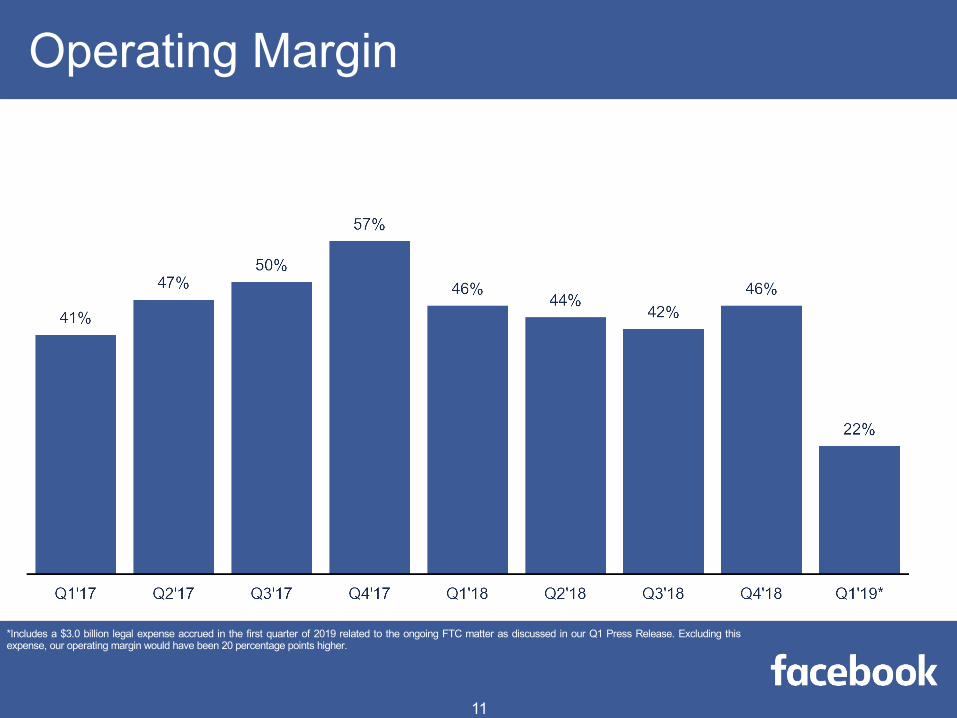
Operating Margin
*Includes a $3.0 billion legal expense accrued in the first quarter of 2019 related to the ongoing FTC matter as discussed in our Q1 Press Release. Excluding thisexpense, our operating margin would have been 20 percentage points higher.
11
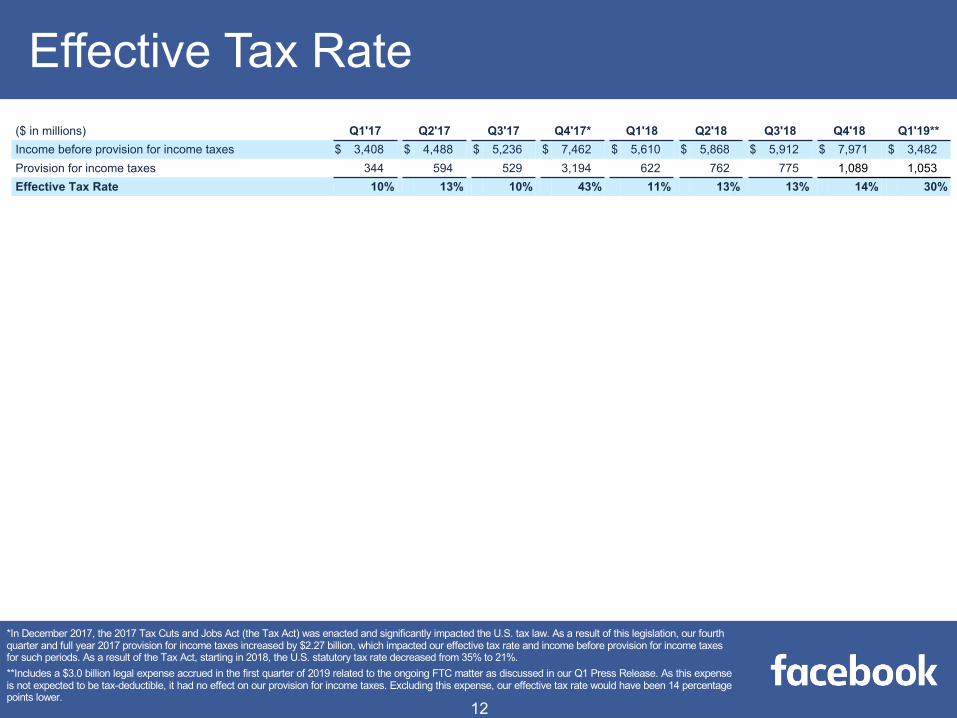
($ in millions) Q1'17 Q2'17 Q3'17 Q4'17* Q1'18 Q2'18 Q3'18 Q4'18 Q1'19**Income before provision for income taxes $ 3,408 $ 4,488 $ 5,236 $ 7,462 $ 5,610 $ 5,868 $ 5,912 $ 7,971 $ 3,482Provision for income taxes 344 594 529 3,194 622 762 775 1,089 1,053Effective Tax Rate 10% 13% 10% 43% 11% 13% 13% 14% 30%
Effective Tax Rate
12
*In December 2017, the 2017 Tax Cuts and Jobs Act (the Tax Act) was enacted and significantly impacted the U.S. tax law. As a result of this legislation, our fourth quarter and full year 2017 provision for income taxes increased by $2.27 billion, which impacted our effective tax rate and income before provision for income taxes for such periods. As a result of the Tax Act, starting in 2018, the U.S. statutory tax rate decreased from 35% to 21%.**Includes a $3.0 billion legal expense accrued in the first quarter of 2019 related to the ongoing FTC matter as discussed in our Q1 Press Release. As this expenseis not expected to be tax-deductible, it had no effect on our provision for income taxes. Excluding this expense, our effective tax rate would have been 14 percentagepoints lower.
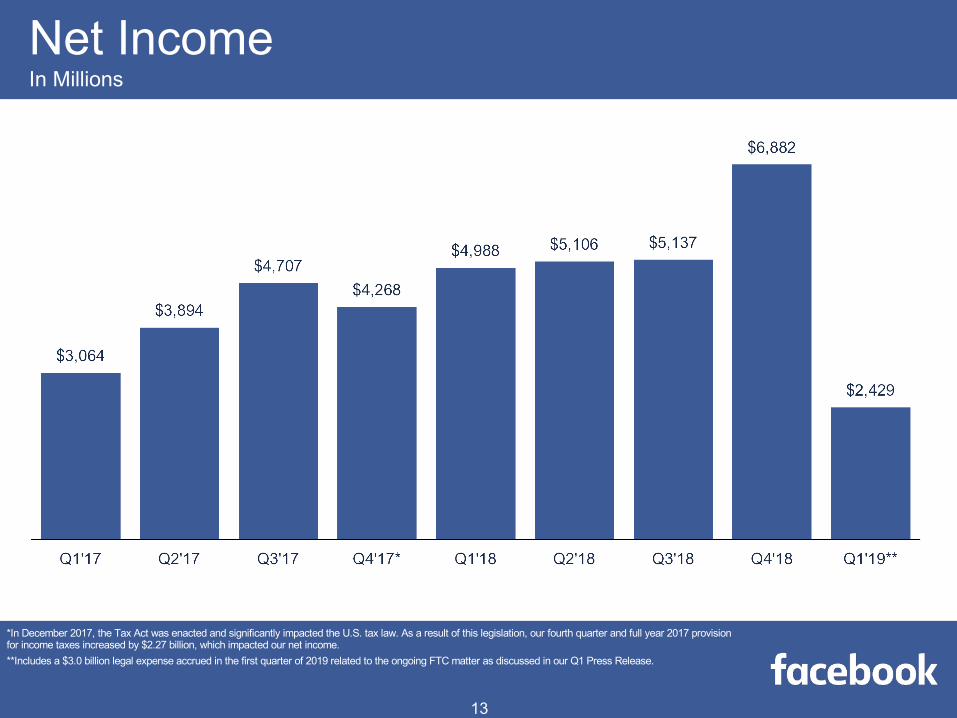
*In December 2017, the Tax Act was enacted and significantly impacted the U.S. tax law. As a result of this legislation, our fourth quarter and full year 2017 provision for income taxes increased by $2.27 billion, which impacted our net income.**Includes a $3.0 billion legal expense accrued in the first quarter of 2019 related to the ongoing FTC matter as discussed in our Q1 Press Release.
Net IncomeIn Millions
13
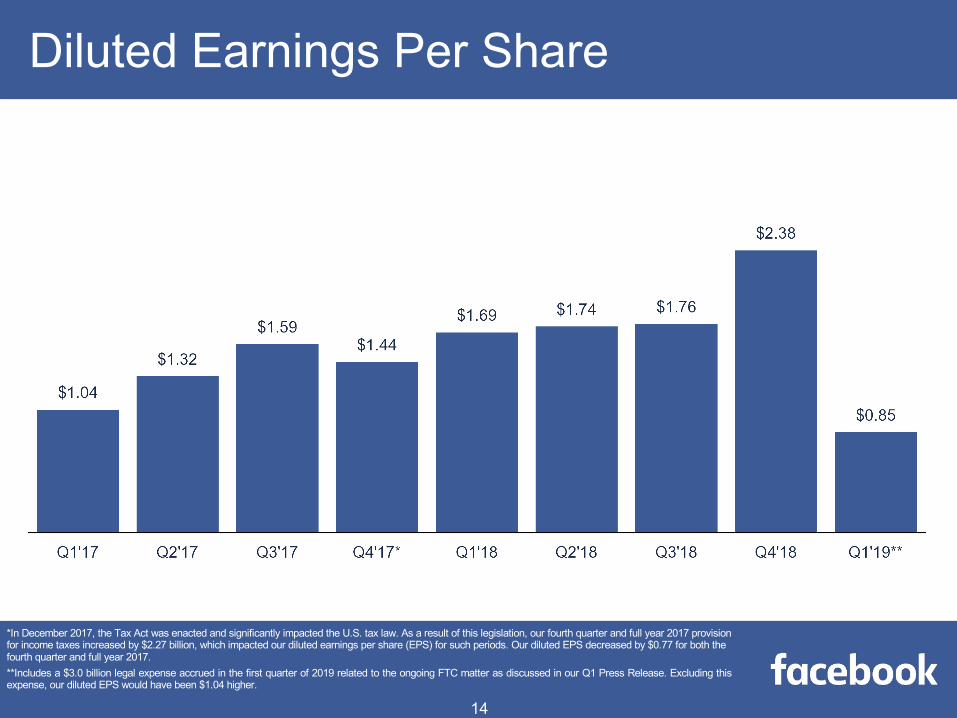
Diluted Earnings Per Share
*In December 2017, the Tax Act was enacted and significantly impacted the U.S. tax law. As a result of this legislation, our fourth quarter and full year 2017 provision for income taxes increased by $2.27 billion, which impacted our diluted earnings per share (EPS) for such periods. Our diluted EPS decreased by $0.77 for both the fourth quarter and full year 2017. **Includes a $3.0 billion legal expense accrued in the first quarter of 2019 related to the ongoing FTC matter as discussed in our Q1 Press Release. Excluding thisexpense, our diluted EPS would have been $1.04 higher.
14
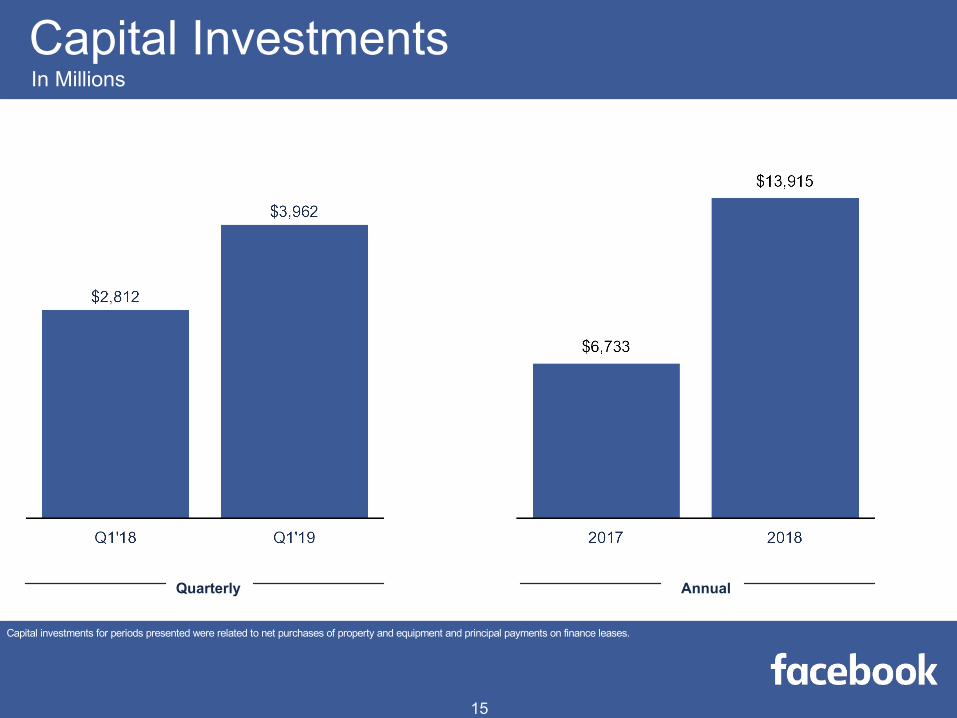
Capital InvestmentsIn Millions
Quarterly Annual
15
Capital investments for periods presented were related to net purchases of property and equipment and principal payments on finance leases.

Appendix
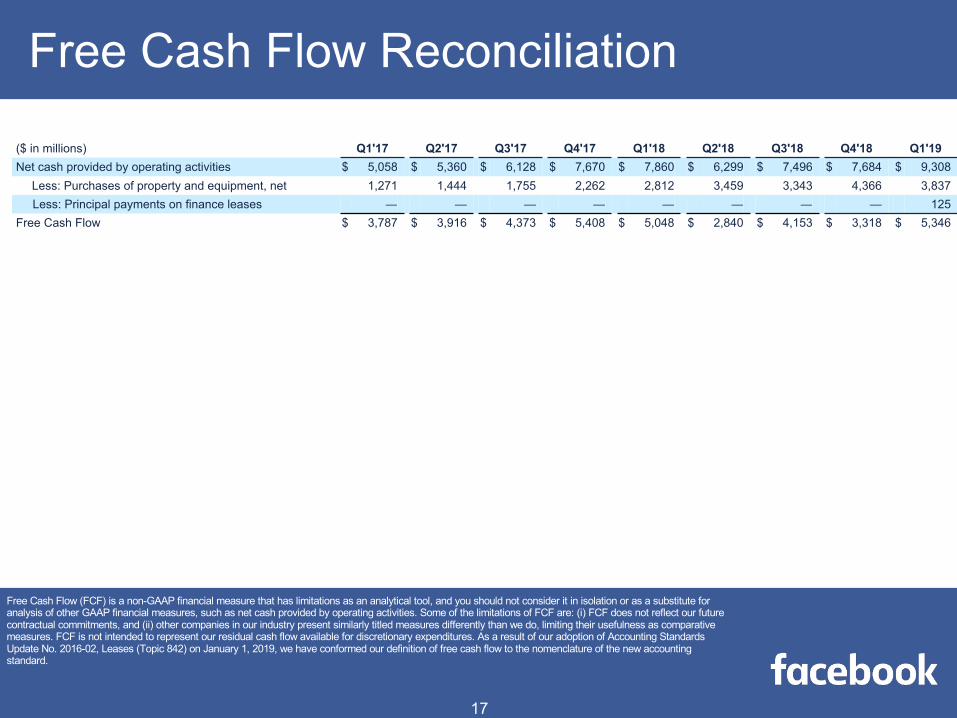
($ in millions) Q1'17 Q2'17 Q3'17 Q4'17 Q1'18 Q2'18 Q3'18 Q4'18 Q1'19Net cash provided by operating activities $ 5,058 $ 5,360 $ 6,128 $ 7,670 $ 7,860 $ 6,299 $ 7,496 $ 7,684 $ 9,308
Less: Purchases of property and equipment, net 1,271 1,444 1,755 2,262 2,812 3,459 3,343 4,366 3,837Less: Principal payments on finance leases — — — — — — — — 125
Free Cash Flow $ 3,787 $ 3,916 $ 4,373 $ 5,408 $ 5,048 $ 2,840 $ 4,153 $ 3,318 $ 5,346
Free Cash Flow Reconciliation
17
Free Cash Flow (FCF) is a non-GAAP financial measure that has limitations as an analytical tool, and you should not consider it in isolation or as a substitute for analysis of other GAAP financial measures, such as net cash provided by operating activities. Some of the limitations of FCF are: (i) FCF does not reflect our future contractual commitments, and (ii) other companies in our industry present similarly titled measures differently than we do, limiting their usefulness as comparative measures. FCF is not intended to represent our residual cash flow available for discretionary expenditures. As a result of our adoption of Accounting Standards Update No. 2016-02, Leases (Topic 842) on January 1, 2019, we have conformed our definition of free cash flow to the nomenclature of the new accounting standard.

Limitations of Key Metrics and Other DataThe numbers for our key metrics, which include our daily active users (DAUs), monthly active users (MAUs), and average revenue per user (ARPU), are calculated using internal companydata based on the activity of user accounts. While these numbers are based on what we believe to be reasonable estimates of our user base for the applicable period of measurement,there are inherent challenges in measuring usage of our products across large online and mobile populations around the world. In addition, we are continually seeking to improve ourestimates of our user base, and such estimates may change due to improvements or changes in our methodology.
We regularly evaluate these metrics to estimate the number of "duplicate" and "false" accounts among our MAUs. A duplicate account is one that a user maintains in addition to his or herprincipal account. We divide "false" accounts into two categories: (1) user-misclassified accounts, where users have created personal profiles for a business, organization, or non-humanentity such as a pet (such entities are permitted on Facebook using a Page rather than a personal profile under our terms of service); and (2) undesirable accounts, which represent userprofiles that we determine are intended to be used for purposes that violate our terms of service, such as spamming. The estimates of duplicate and false accounts are based on an internalreview of a limited sample of accounts, and we apply significant judgment in making this determination. For example, to identify duplicate accounts we use data signals such as similar IPaddresses or user names, and to identify false accounts we look for names that appear to be fake or other behavior that appears inauthentic to the reviewers. Our estimates may changeas our methodologies evolve, including through the application of new data signals or technologies, which may allow us to identify previously undetected duplicate or false accounts andmay improve our ability to evaluate a broader population of our users. Duplicate and false accounts are very difficult to measure at our scale, and it is possible that the actual number ofduplicate and false accounts may vary significantly from our estimates.
In the fourth quarter of 2018, we estimated that duplicate accounts may have represented approximately 11% of our worldwide MAUs. We believe the percentage of duplicate accounts ismeaningfully higher in developing markets such as the Philippines and Vietnam, as compared to more developed markets. In the fourth quarter of 2018, we estimated that false accountsmay have represented approximately 5% of our worldwide MAUs. Our estimation of false accounts can vary as a result of episodic spikes in the creation of such accounts, which we haveseen originate more frequently in specific countries such as Indonesia and Vietnam. From time to time, we may make product changes or take other actions to reduce the number ofduplicate or false accounts among our users, which may also reduce our DAU and MAU estimates in a particular period.
Our data limitations may affect our understanding of certain details of our business. For example, while user-provided data indicates a decline in usage among younger users, this age datais unreliable because a disproportionate number of our younger users register with an inaccurate age. Accordingly, our understanding of usage by age group may not be complete.
In addition, our data regarding the geographic location of our users is estimated based on a number of factors, such as the user's IP address and self-disclosed location. These factors maynot always accurately reflect the user's actual location. For example, a user may appear to be accessing Facebook from the location of the proxy server that the user connects to ratherthan from the user's actual location. The methodologies used to measure user metrics may also be susceptible to algorithm or other technical errors. Our estimates for revenue by userlocation and revenue by user device are also affected by these factors.
We regularly review our processes for calculating these metrics, and from time to time we may discover inaccuracies in our metrics or make adjustments to improve their accuracy, includingadjustments that may result in the recalculation of our historical metrics. We believe that any such inaccuracies or adjustments are immaterial unless otherwise stated. We intend to discloseour estimates of the number of duplicate and false accounts among our MAUs on an annual basis. In addition, our DAU and MAU estimates will differ from estimates published by thirdparties due to differences in methodology.
The numbers of DAUs and MAUs discussed in this presentation, as well as ARPU, do not include Instagram, WhatsApp, or Oculus users unless they would otherwise qualify as such users,respectively, based on their other activities on Facebook
In addition, other user engagement metrics included herein do not include Instagram, WhatsApp, or Oculus unless otherwise specifically stated.
18

Facebook Q1 2019 Results
investor.fb.com