
Facebook Earnings slides
27
Quarterly Earning s Slides Q4 2013
Transcript of Facebook Earnings slides

8/13/2019 Facebook Earnings slides
http://slidepdf.com/reader/full/facebook-earnings-slides 1/27
Quarterly Earnings SlidesQ4 2013

8/13/2019 Facebook Earnings slides
http://slidepdf.com/reader/full/facebook-earnings-slides 2/27
Non-GAAP Measures
In addition to U.S. GAAP financials, this presentation includes certain non-GAAP financial measures. Thesenon-GAAP measures are in addition to, not a substitute for or superior to, measures of financial performance
prepared in accordance with U.S. GAAP. A reconciliation of non-GAAP financial measures to the corresponding
GAAP measures is provided in the appendix to this presentation.
2

8/13/2019 Facebook Earnings slides
http://slidepdf.com/reader/full/facebook-earnings-slides 3/27
126 129 130 132 135 139 142 144 147
143 152 154 160 169 179 182 188 195
105 119 129 141 153167 181 189 200109
126 139152 161
180195
208216
483526
552584
618
665699
728 757
Q4'11 Q1'12 Q2'12 Q3'12 Q4'12 Q1'13 Q2'13 Q3'13 Q4'13
3
Daily Active Users (DAUs)
DAUs / MAUs
Q4'11 Q1'12 Q2'12 Q3'12 Q4'12 Q1'13 Q2'13 Q3’13 Q4'13
57% 58% 58% 58% 59% 60% 61% 61% 62%
Rest of World
Asia
Europe
US & Canada
Please see Facebook's most recent quarterly or annual report filed with the SEC for definitions of user activity used to determine the number of our DAUs, mobileDAUs, MAUs, and mobile MAUs. The number of DAUs, mobile DAUs, MAUs, and mobile MAUs do not include Instagram users unless they would otherwise qualifyas such users, respectively, based on their other activities on Facebook.
In Millions

8/13/2019 Facebook Earnings slides
http://slidepdf.com/reader/full/facebook-earnings-slides 4/274
Mobile Daily Active Users (Mobile DAUs)
In Millions
266293
329
374
425
469507
556
Q1'12 Q2'12 Q3'12 Q4'12 Q1'13 Q2'13 Q3'13 Q4'13
Please see Facebook's most recent quarterly or annual report filed with the SEC for definitions of user activity used to determine the number of our DAUs, mobileDAUs, MAUs, and mobile MAUs. The number of DAUs, mobile DAUs, MAUs, and mobile MAUs do not include Instagram users unless they would otherwise qualifyas such users, respectively, based on their other activities on Facebook.

8/13/2019 Facebook Earnings slides
http://slidepdf.com/reader/full/facebook-earnings-slides 5/27
179 183 186 189 193 195 198 199 201
229 239 246 253 261 269 272 276 282
212 234 255 277 298 319 339 351 368
225245
268288
304327
346 362 376
845901
9551,007
1,0561,110
1,155 1,1891,228
Q4'11 Q1'12 Q2'12 Q3'12 Q4'12 Q1'13 Q2'13 Q3'13 Q4'13
5
Monthly Active Users (MAUs)
In MillionsRest of World
Asia
Europe
US & Canada
Please see Facebook's most recent quarterly or annual report filed with the SEC for definitions of user activity used to determine the number of our DAUs, mobileDAUs, MAUs, and mobile MAUs. The number of DAUs, mobile DAUs, MAUs, and mobile MAUs do not include Instagram users unless they would otherwise qualifyas such users, respectively, based on their other activities on Facebook.

8/13/2019 Facebook Earnings slides
http://slidepdf.com/reader/full/facebook-earnings-slides 6/276
Mobile Monthly Active Users (Mobile MAUs)
In Millions
432488
543604
680
751
819874
945
Q4'11 Q1'12 Q2'12 Q3'12 Q4'12 Q1'13 Q2'13 Q3'13 Q4'13
Please see Facebook's most recent quarterly or annual report filed with the SEC for definitions of user activity used to determine the number of our DAUs, mobileDAUs, MAUs, and mobile MAUs. The number of DAUs, mobile DAUs, MAUs, and mobile MAUs do not include Instagram users unless they would otherwise qualifyas such users, respectively, based on their other activities on Facebook.

8/13/2019 Facebook Earnings slides
http://slidepdf.com/reader/full/facebook-earnings-slides 7/277
Mobile-Only Monthly Active Users (Mobile-Only MAUs)
In Millions
157
189
219
254
296
Q4'12 Q1'13 Q2'13 Q3'13 Q4'13
Mobile-only MAUs are defined as users who accessed Facebook solely through mobile apps or our mobile website in the last 30 days of the given quarter. Thenumber of mobile-only MAUs do not include Instagram users unless they would otherwise qualify as such users based on their other activities on Facebook.

8/13/2019 Facebook Earnings slides
http://slidepdf.com/reader/full/facebook-earnings-slides 8/27
$943 $872$992
$1,086
$1,329 $1,245
$1,599$1,798
$2,344$188
$186$192 $176
$256$213
$214
$218
$241
$1,131 $1,058
$1,184$1,262
$1,585
$1,458
$1,813
$2,016
$2,585
Q4'11 Q1'12 Q2'12 Q3'12 Q4'12 Q1'13 Q2'13 Q3'13 Q4'13
Payments and other fees
Advertising
Revenue
In Millions
8
*In the fourth quarter of 2012 we recognized revenue from four months of Payments transactions for accounting reasons detailed on pages 47 and 48 of ourForm 10-K filed on February 1, 2013.
*

8/13/2019 Facebook Earnings slides
http://slidepdf.com/reader/full/facebook-earnings-slides 9/27
$567 $525 $590 $637$780
$679
$848$962
$1,206
$361$328
$346 $341
$440$423
$505$538
$727
$115$118
$135 $154
$198
$197
$247
$278
$341
$87$87
$113 $130
$167$159
$213
$238
$311
$1,131$1,058
$1,184$1,262
$1,585$1,458
$1,813
$2,016
$2,585
Q4'11 Q1'12 Q2'12 Q3'12 Q4'12 Q1'13 Q2'13 Q3'13 Q4'13
Rest of World
Asia
Europe
US & Canada
9
Revenue by User Geography
Revenue by user geography is geographically apportioned based on our estimation of the geographic location of our users when they perform a revenue-generating activity. This allocation differs from our revenue by geography disclosure in our consolidated financial statements where revenue is geographicallyapportioned based on the location of the marketer or developer.
In Millions

8/13/2019 Facebook Earnings slides
http://slidepdf.com/reader/full/facebook-earnings-slides 10/27
Rest of World
Asia
Europe
US & Canada
10
Advertising Revenue by User Geography
Revenue by user geography is geographically apportioned based on our estimation of the geographic location of our users when they perform a revenue-generating activity. This allocation differs from our revenue by geography disclosure in our consolidated financial statements where revenue is geographicallyapportioned based on the location of the marketer or developer.
$462 $419 $479 $538 $631 $552$721
$832$1,068
$306$274
$294$295
$374$367
$451$482
$658
$95$99
$115$133
$168
$176
$225
$255
$318
$79$79
$104 $120
$156$150
$202
$229
$300
$943 $872
$992$1,086
$1,329$1,245
$1,599
$1,798
$2,344
Q4'11 Q1'12 Q2'12 Q3'12 Q4'12 Q1'13 Q2'13 Q3'13 Q4'13
In Millions

8/13/2019 Facebook Earnings slides
http://slidepdf.com/reader/full/facebook-earnings-slides 11/27
Rest of World
Asia
Europe
US & Canada
$105 $106 $111 $99
$149$127 $127 $130 $138
$55 $54 $52 $46
$66
$56 $54 $56$69$20 $19 $20
$21
$30
$21 $22 $23$23
$8 $8 $9
$10
$11
$9 $11 $9
$11
$188 $186 $192
$176
$256
$213 $214$218
$241
Q4'11 Q1'12 Q2'12 Q3'12 Q4'12 Q1'13 Q2'13 Q3'13 Q4'13
11
Payments & Other Fees Revenue by User Geography
Revenue by user geography is geographically apportioned based on our estimation of the geographic location of our users when they perform arevenue-generating activity. This allocation differs from our revenue by geography disclosure in our consolidated financial statements whererevenue is geographically apportioned based on the location of the marketer or developer.
*In the fourth quarter of 2012 we recognized revenue from four months of Payments transactions for accounting reasons detailed on pages 47and 48 of our Form 10-K filed on February 1, 2013.
In Millions
*
8/13/2019 Facebook Earnings slides
http://slidepdf.com/reader/full/facebook-earnings-slides 12/27
12
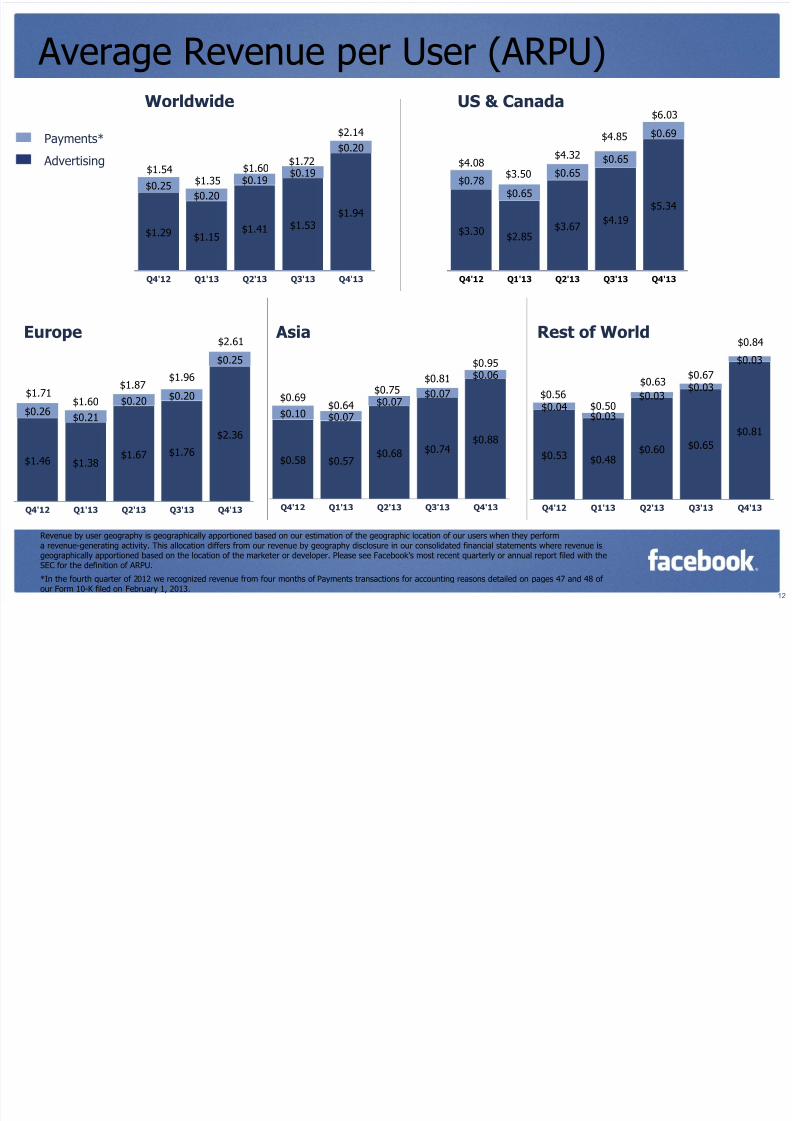
Average Revenue per User (ARPU)
$1.46 $1.38$1.67 $1.76
$2.36
$0.26$0.21
$0.20$0.20
$0.25
$1.71$1.60
$1.87$1.96
$2.61
Q4'12 Q1'13 Q2'13 Q3'13 Q4'13
Europe
$0.58 $0.57$0.68 $0.74
$0.88
$0.10 $0.07
$0.07$0.07
$0.06
$0.69$0.64
$0.75$0.81
$0.95
Q4'12 Q1'13 Q2'13 Q3'13 Q4'13
Asia
Revenue by user geography is geographically apportioned based on our estimation of the geographic location of our users when they performa revenue-generating activity. This allocation differs from our revenue by geography disclosure in our consolidated financial statements where revenue isgeographically apportioned based on the location of the marketer or developer. Please see Facebook’s most recent quarterly or annual report filed with theSEC for the definition of ARPU.
*In the fourth quarter of 2012 we recognized revenue from four months of Payments transactions for accounting reasons detailed on pages 47 and 48 ofour Form 10-K filed on February 1, 2013.
$0.53 $0.48$0.60 $0.65
$0.81
$0.04$0.03
$0.03$0.03
$0.03
$0.56$0.50
$0.63$0.67
$0.84
Q4'12 Q1'13 Q2'13 Q3'13 Q4'13
Rest of World
$1.29 $1.15$1.41 $1.53 $1.94
$0.25$0.20
$0.19$0.19
$0.20
$1.54$1.35
$1.60$1.72
$2.14
Q4'12 Q1'13 Q2'13 Q3'13 Q4'13
Worldwide
$3.30$2.85
$3.67$4.19
$5.34
$0.78
$0.65
$0.65
$0.65
$0.69
$4.08$3.50
$4.32
$4.85
$6.03
Q4'12 Q1'13 Q2'13 Q3'13 Q4'13
US & Canada
Payments*
Advertising

8/13/2019 Facebook Earnings slides
http://slidepdf.com/reader/full/facebook-earnings-slides 13/27
Share-Based Compensation Expense
13
$74 $97 $113 $138 $137 $135$175 $193 $228
$986
$28 $24 $9$17 $14
$11
$76$103
$1,106
$179 $184 $170
$224 $239
$273
Q4'11 Q1'12 Q2'12 Q3'12 Q4'12 Q1'13 Q2'13 Q3'13 Q4'13
In MillionsPre-2011 RSUs
Post-2011 RSUs
Options & Other

8/13/2019 Facebook Earnings slides
http://slidepdf.com/reader/full/facebook-earnings-slides 14/27
8/13/2019 Facebook Earnings slides
http://slidepdf.com/reader/full/facebook-earnings-slides 15/27
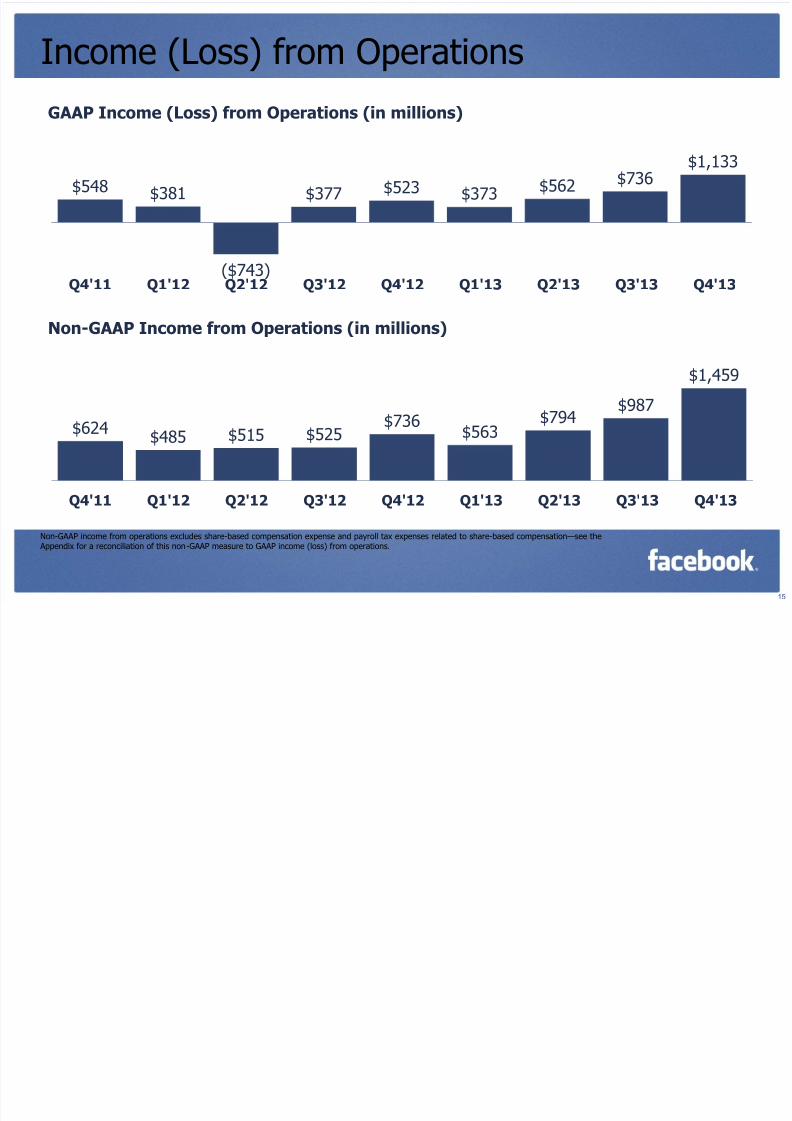
Income (Loss) from Operations
$548 $381
($743)
$377 $523 $373 $562 $736$1,133
Q4'11 Q1'12 Q2'12 Q3'12 Q4'12 Q1'13 Q2'13 Q3'13 Q4'13
GAAP Income (Loss) from Operations (in millions)
$624 $485 $515 $525$736
$563$794
$987
$1,459
Q4'11 Q1'12 Q2'12 Q3'12 Q4'12 Q1'13 Q2'13 Q3'13 Q4'13
Non-GAAP Income from Operations (in millions)
15
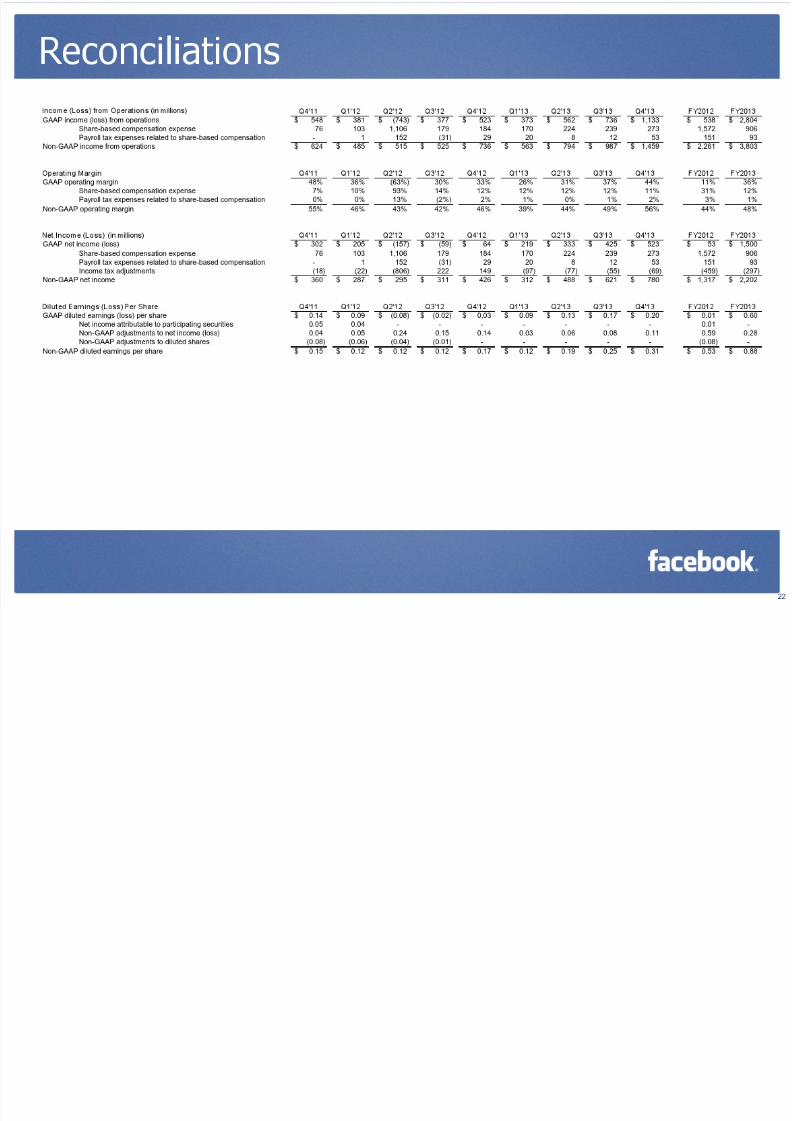
Non-GAAP income from operations excludes share-based compensation expense and payroll tax expenses related to share-based compensation—see the Appendix for a reconciliation of this non-GAAP measure to GAAP income (loss) from operations.
8/13/2019 Facebook Earnings slides
http://slidepdf.com/reader/full/facebook-earnings-slides 16/27
16
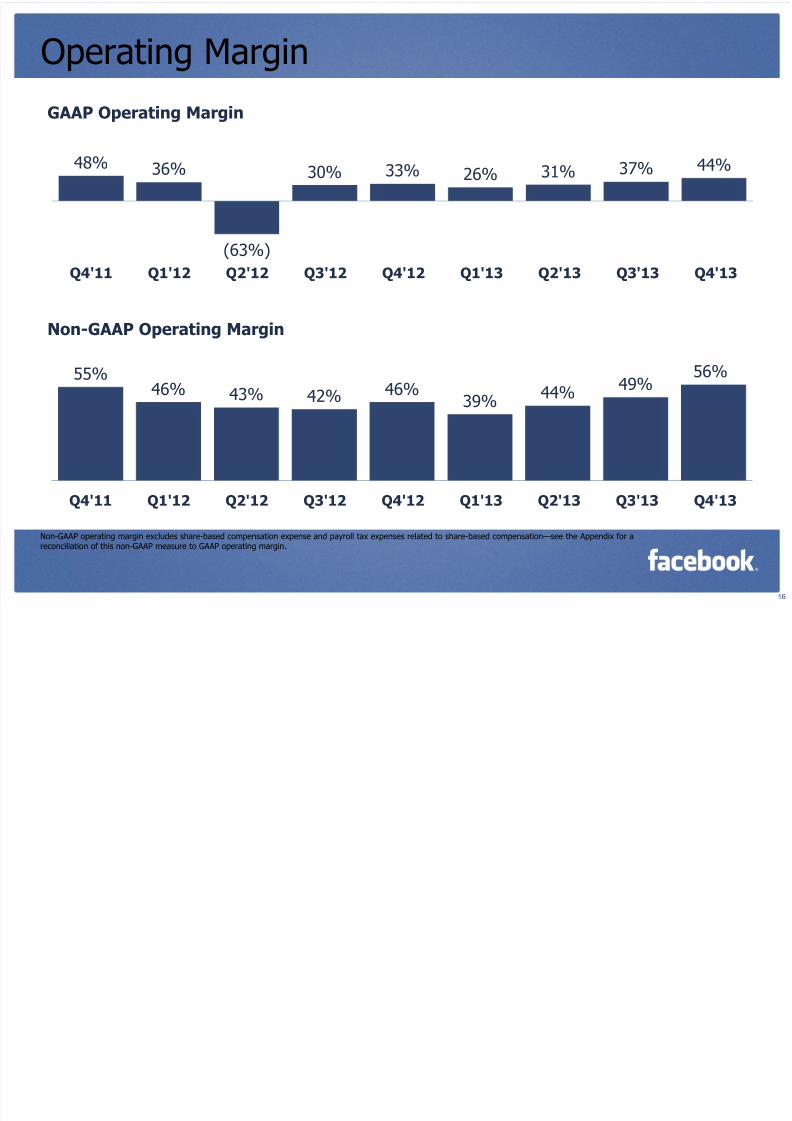
Operating Margin
55%46% 43% 42% 46%
39%44%
49%56%
Q4'11 Q1'12 Q2'12 Q3'12 Q4'12 Q1'13 Q2'13 Q3'13 Q4'13
Non-GAAP Operating Margin
48% 36%
(63%)
30% 33% 26% 31% 37% 44%
Q4'11 Q1'12 Q2'12 Q3'12 Q4'12 Q1'13 Q2'13 Q3'13 Q4'13
GAAP Operating Margin
Non-GAAP operating margin excludes share-based compensation expense and payroll tax expenses related to share-based compensation—see the Appendix for areconciliation of this non-GAAP measure to GAAP operating margin.
8/13/2019 Facebook Earnings slides
http://slidepdf.com/reader/full/facebook-earnings-slides 17/27
17
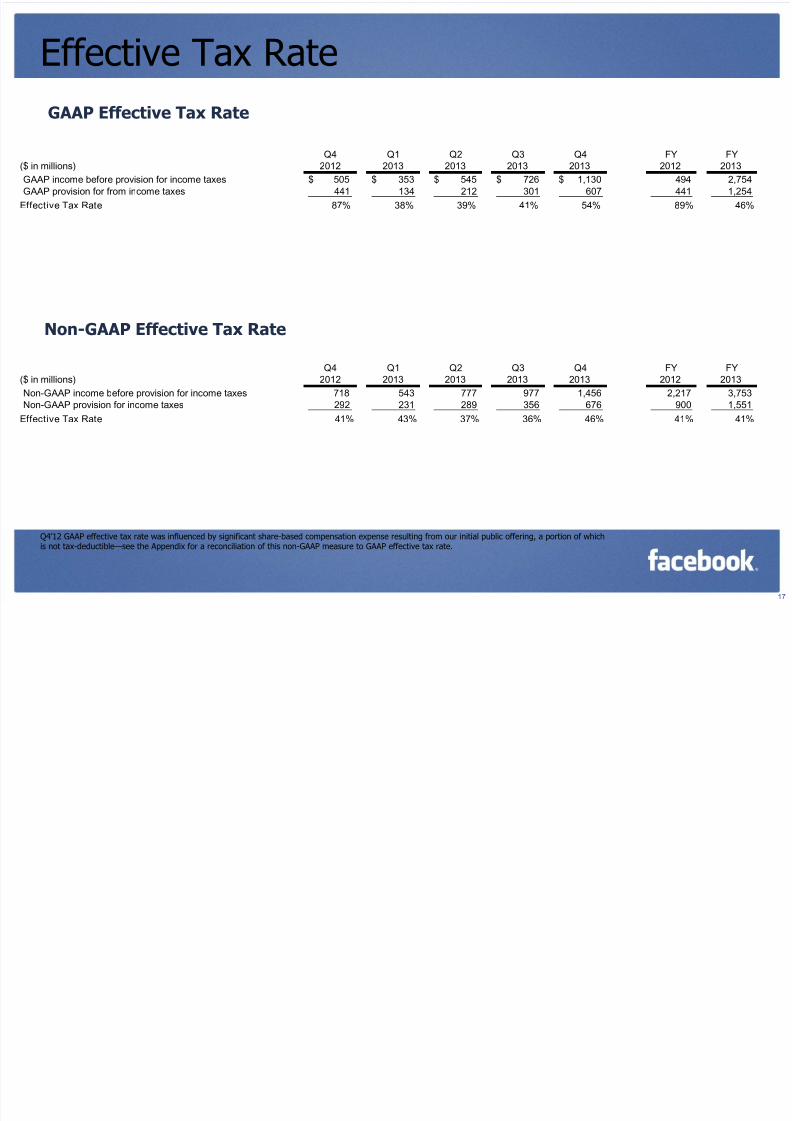
Effective Tax Rate
Q4’12 GAAP effective tax rate was influenced by significant share-based compensation expense resulting from our initial public offering, a portion of whichis not tax-deductible—see the Appendix for a reconciliation of this non-GAAP measure to GAAP effective tax rate.
GAAP Effective Tax Rate
Non-GAAP Effective Tax Rate
Q4 Q1 Q2 Q3 Q4 FY FY
($ in millions) 2012 2013 2013 2013 2013 2012 2013
GAAP income before provision for income taxes 505$ 353$ 545$ 726$ 1,130$ 494 2,754 GAAP provision for from income taxes 441 134 212 301 607 441 1,254
Effective Tax Rate 87% 38% 39% 41% 54% 89% 46%
Q4 Q1 Q2 Q3 Q4 FY FY
($ in millions) 2012 2013 2013 2013 2013 2012 2013
Non-GAAP income before provision for income taxes 718 543 777 977 1,456 2,217 3,753 Non-GAAP provision for income taxes 292 231 289 356 676 900 1,551
Effective Tax Rate 41% 43% 37% 36% 46% 41% 41%

8/13/2019 Facebook Earnings slides
http://slidepdf.com/reader/full/facebook-earnings-slides 18/27
18
Net Income (Loss)
$302 $205
($157) ($59)
$64$219 $333 $425 $523
Q4'11 Q1'12 Q2'12 Q3'12 Q4'12 Q1'13 Q2'13 Q3'13 Q4'13
Non-GAAP net income excludes share-based compensation expense, payroll tax expenses related to share-based compensation, and relatedincome tax adjustments—see the Appendix for a reconciliation of this non-GAAP measure to GAAP net income (loss).
$360 $287 $295 $311 $426 $312$488
$621$780
Q4'11 Q1'12 Q2'12 Q3'12 Q4'12 Q1'13 Q2'13 Q3'13 Q4'13
GAAP Net Income (Loss) (in millions)
Non-GAAP Net Income (in millions)

8/13/2019 Facebook Earnings slides
http://slidepdf.com/reader/full/facebook-earnings-slides 19/27

8/13/2019 Facebook Earnings slides
http://slidepdf.com/reader/full/facebook-earnings-slides 20/27
20
Capital Investments
In MillionsProperty and equipment acquired
under capital leases
Purchases of property
and equipment
$606
$1,235 $1,362
$473
$340
$1,079
$1,575
$1,373
2011 2012 2013
Annual
$198
$483$89
$287
$483
Q4'12 Q4'13
Quarterly

8/13/2019 Facebook Earnings slides
http://slidepdf.com/reader/full/facebook-earnings-slides 21/27
Appendix
8/13/2019 Facebook Earnings slides
http://slidepdf.com/reader/full/facebook-earnings-slides 22/27

8/13/2019 Facebook Earnings slides
http://slidepdf.com/reader/full/facebook-earnings-slides 23/27
23
Reconciliations (continued)
Effective Tax Rate (in millions) Q4'12 Q1'13 Q2'13 Q3'13 Q4'13 FY2012 FY2013GAAP income before provision for income taxes 505$ 353$ 545$ 726$ 1,130$ 494$ 2,754$GAAP provision for income taxes 441 134 212 301 607 441 1,254 GAAP effective tax rate 87% 38% 39% 41% 54% 89% 46%
GAAP income before provision for income taxes 505$ 353$ 545$ 726$ 1,130$ 494$ 2,754$Share-based compensation and related payroll tax expenses 213 190 232 251 326 1,723 999 Non-GAAP income before provision for income taxes 718$ 543$ 777$ 977$ 1,456$ 2,217$ 3,753$
Non-GAAP provision for income taxes 292 231 289 356 676 900 1,551 Non-GAAP effective tax rate 41% 43% 37% 36% 46% 41% 41%

8/13/2019 Facebook Earnings slides
http://slidepdf.com/reader/full/facebook-earnings-slides 24/27
24
Reconciliations (continued)
Free Cash Flow (in millions) Q4'11 Q1'12 Q2'12 Q3'12 Q4'12 Q1'13 Q2'13 Q3'13 Q4'13 FY2012 FY2013Net cash provided by operating activities 510$ 441$ 240$ 250$ 681$ 719$ 1,322$ 950$ 1,231$ 1,612$ 4,222$
Purchases of property and equipment 185 453 413 171 198 327 268 284 483 1,235 1,362
Property and equpiment acquired under capital leases 80 38 52 161 89 11 - - - 340 11
Free Cash Flow 245$ (50)$ (225)$ (82)$ 394$ 381$ 1,054$ 666$ 748$ 37$ 2,849$
8/13/2019 Facebook Earnings slides
http://slidepdf.com/reader/full/facebook-earnings-slides 25/27

8/13/2019 Facebook Earnings slides
http://slidepdf.com/reader/full/facebook-earnings-slides 26/27

8/13/2019 Facebook Earnings slides
http://slidepdf.com/reader/full/facebook-earnings-slides 27/27


