![DOSIMETRIC EVALUATION OF FABRICATED RHIZOPHORA SPP ... · Phantom is the material that simulates the absorption and scattering properties of human soft tissues [1]. Phantom material](https://static.fdocuments.net/doc/165x107/5e34759aa5a3d45eeb3bde96/dosimetric-evaluation-of-fabricated-rhizophora-spp-phantom-is-the-material-that.jpg)
Fabrication and Characterisations of Rhizophora spp ...
25
Journal of Physical Science, Vol. 30(3), 131–155, 2019 © Penerbit Universiti Sains Malaysia, 2019. This work is licensed under the terms of the Creative Commons Attribution (CC BY) (http://creativecommons.org/licenses/by/4.0/). Fabrication and Characterisations of Rhizophora spp. Particleboards Bonded with Corn Starch as Water Equivalent Phantoms for Diagnostic Photon Energy Ranges Puteri Nor Khatijah Abd Hamid, 1 Abd Aziz Tajuddin, 1 Rokiah Hashim 2 and Mohd Fahmi Mohd Yusof 3* 1 School of Physics, Universiti Sains Malaysia, 11800 USM Pulau Pinang, Malaysia 2 Division of Bioresource, Paper and Coatings Technology, School of Industrial Technologies, Universiti Sains Malaysia, 11800 USM Pulau Pinang, Malaysia 3 School of Health Sciences, Universiti Sains Malaysia, 16150 Kota Bharu, Kelantan, Malaysia * Corresponding author: [email protected] Published online: 25 November 2019 To cite this article: Abd Hamid, P. N. K. et al. (2019). Fabrication and characterisations of Rhizophora spp. particleboards bonded with corn starch as water equivalent phantoms for diagnostic photon energy ranges. J. Phys. Sci., 30(3), 131–155, https://doi.org/10.21315/ jps2019.30.3.9 To link to this article: https://doi.org/10.21315/jps2019.30.3.9 ABSTRACT: Studies had been carried out to look for new phantom materials in medical physics that can provide better dose accuracy in comparison to water. This study focused on the fabrication and characterisations and of particleboards made of Rhizophora spp. as phantom for low and diagnostic photon energies. Rhizophora spp. particleboards were fabricated at different particle size ranges of 104–210 µm, 74–104 µm and ≤ 74 µm. Corn starch was used as adhesive at 5% and 10% percentage levels as well as the binderless particleboards. All particleboards were fabricated with density similar to water at 1.0 g cm –3 . The physical and mechanical properties of the particleboards were evaluated based on the Japanese Industrial Standards (JIS A 5908:2003). The elemental compositions and the effective atomic number of corn starch bonded Rhizophora spp. were determined based on the energy dispersive X-ray analysis (EDXA). The mass attenuation coefficients were measured by using X-ray fluorescence (XRF) photons between 16.59 keV and 25.26 keV. The computed tomography (CT) numbers, electron density and density profiles were investigated by using the CT scanner and compared to water. The Rhizophora spp. particleboard with highest percentage level of corn starch (10%) and smallest particle size (≤74 µm) showed the highest physical and mechanical properties shown by the average internal bond (IB) strength and modulus of rupture (MOR). The calculated effective atomic
Transcript of Fabrication and Characterisations of Rhizophora spp ...

Journal of Physical Science, Vol. 30(3), 131–155, 2019
© Penerbit Universiti Sains Malaysia, 2019. This work is licensed under the terms of the Creative Commons Attribution (CC BY) (http://creativecommons.org/licenses/by/4.0/).
Fabrication and Characterisations of Rhizophora spp. Particleboards Bonded with Corn Starch as Water Equivalent Phantoms for
Diagnostic Photon Energy Ranges
Puteri Nor Khatijah Abd Hamid,1 Abd Aziz Tajuddin,1 Rokiah Hashim2 and Mohd Fahmi Mohd Yusof3*
1School of Physics, Universiti Sains Malaysia, 11800 USM Pulau Pinang, Malaysia
2Division of Bioresource, Paper and Coatings Technology, School of Industrial Technologies, Universiti Sains Malaysia,
11800 USM Pulau Pinang, Malaysia3School of Health Sciences, Universiti Sains Malaysia,
16150 Kota Bharu, Kelantan, Malaysia
*Corresponding author: [email protected]
Published online: 25 November 2019
To cite this article: Abd Hamid, P. N. K. et al. (2019). Fabrication and characterisations of Rhizophora spp. particleboards bonded with corn starch as water equivalent phantoms for diagnostic photon energy ranges. J. Phys. Sci., 30(3), 131–155, https://doi.org/10.21315/jps2019.30.3.9
To link to this article: https://doi.org/10.21315/jps2019.30.3.9
ABSTRACT: Studies had been carried out to look for new phantom materials in medical physics that can provide better dose accuracy in comparison to water. This study focused on the fabrication and characterisations and of particleboards made of Rhizophora spp. as phantom for low and diagnostic photon energies. Rhizophora spp. particleboards were fabricated at different particle size ranges of 104–210 µm, 74–104 µm and ≤ 74 µm. Corn starch was used as adhesive at 5% and 10% percentage levels as well as the binderless particleboards. All particleboards were fabricated with density similar to water at 1.0 g cm–3. The physical and mechanical properties of the particleboards were evaluated based on the Japanese Industrial Standards (JIS A 5908:2003). The elemental compositions and the effective atomic number of corn starch bonded Rhizophora spp. were determined based on the energy dispersive X-ray analysis (EDXA). The mass attenuation coefficients were measured by using X-ray fluorescence (XRF) photons between 16.59 keV and 25.26 keV. The computed tomography (CT) numbers, electron density and density profiles were investigated by using the CT scanner and compared to water. The Rhizophora spp. particleboard with highest percentage level of corn starch (10%) and smallest particle size (≤74 µm) showed the highest physical and mechanical properties shown by the average internal bond (IB) strength and modulus of rupture (MOR). The calculated effective atomic

Fabrication and Characterisations of Rhizophora spp. 132
number of the corn starch bonded Rhizophora spp. particleboard was closer to water compared to the binderless particleboards. All particleboards showed close values of mass attenuation coefficients to water at all experimented photon energies. All Rhizophora spp. particleboards also showed CT number close to water within 5.4% percentage of difference. The results showed that the addition of corn starch improved the physical properties of Rhizophora spp. particleboards and can be potentially used as phantom material for low and diagnostic photon energies.
Keywords: Rhizophora spp. particleboard, phantom material, effective atomic number, mass attenuation coefficient, CT number
1. INTRODUCTION
Earlier studies identified Rhizophora spp. as potential water and tissue equivalent phantom material for dosimetry works involving ionising radiations. Rhizophora spp. is one of the most abundant types of tropical mangrove trees that grows mainly in salt water environment in the coastal area of tropical regions such as Malaysia.1
An earlier study by Che Wan Sudin and Bradley et al. found that Rhizophora spp. having mass density and attenuation coefficient close to the value of water indicating its water equivalent properties.2,3 Another study by Tajuddin et al. indicated the similarities of attenuation properties of Rhizophora spp. in comparison to Perspex shown by the optical density and scattering properties towards low energy X-rays.4 A study by Banjade et al. have indicated the similarities of dosimetric properties by Rhizophora spp. to water at high energy photons and electrons shown by the percentage depth dose at 6 MV photon and 5 MeV electrons.5 The typical Rhizophora spp. wood consists of high carbon content followed by oxygen and hydrogen similar to the elemental composition of human tissue make it suitable to be used as phantom material.6
Phantom materials are important tools for dosimetric evaluations and quality assurance in medical physics works involving various ranges of photon energies.7 Water has been used as common phantom material due to its radiation absorption and scattering properties near to the human soft tissue. However, the use of water is not always possible due to its liquidity and compatibility of some radiation dosimeters to be used in water. Several solid dry phantoms such as Perspex, polystyrene and solid water (epoxy resin-based) made water equivalent materials have been introduced to replace water.7 The use of these water equivalent materials however still failed to provide accurate dosimetry at various photon energies.
The use of solid and untreated raw wood of Rhizophora spp. as phantom material have several limitations including lack of density uniformity, limited size for full phantom dimension and tendency to crack and bend over period of time.

Journal of Physical Science, Vol. 30(3), 131–155, 2019 133
Marashdeh et al. studied the fabrication of binderless particleboards made of Rhizophora spp. as phantom with several advantages including better density control and enable to be fabricated at various size and shapes.9,24 The fabricated Rhizophora spp. binderless particleboards retained their mass density and attenuation properties towards photons at mammographic and diagnostic energy ranges.9 However, the fabricated Rhizophora spp. binderless particleboards suffered the significant reduction of physical and mechanical properties to the particleboards in comparison to the solid untreated raw wood. Studies are carried out to improve the physical and mechanical properties of Rhizophora spp. particleboards while retaining its attenuation properties towards ionising radiations.
Previous work by Ngu et al. found that the synthetic formaldehyde-based adhesive materials commonly used in particleboard manufacturing industries such as urea-formaldehyde (UF) failed to provide Rhizophora spp. particleboards with density and attenuation properties comparable to water.10 The biological based adhesive or bio-adhesive materials have been identified as potential adhesive materials to improve the physical and mechanical properties of Rhizophora spp. particleboards and to retain its attenuation properties towards photons. Previous studies reported that the mass attenuation coefficients of bio-adhesive bonded Rhizophora spp. particleboards were in good agreement to water (XCOM) at low energies photons and physical properties of particleboards were also improved.11–14
The use of bio-adhesive materials showed significant improvement of physical and mechanical properties of Rhizophora spp. particleboards but still did not satisfy several readily available industrial standards such as the Japanese Industrial Standards (JIS).15 Although it is not necessary for the fabricated particleboards as phantoms to meet the industrial standards, it is important that the fabricated particleboard phantoms to have certain level of physical and mechanical properties to withstand the rigid use and heavy workload in dosimetric studies and quality control works in medical physics. The bio-adhesives such as blood, collagen, soy protein, cellulose, gum and starch have been used to replace the formaldehyde-based adhesives in particleboards industries. Starches including corn starch have been widely used as an alternative wood adhesive in industrial application due to its characteristics including biodegradable, renewable, economic and ready to use.16–19 The typical commercialised corn starch is highly oxygenated carbon compounds made it suitable to be used for fabrication of tissue and water equivalent phantom materials. Corn starch is a mixture of two highly polymeric and isotactic molecules which are amylase and amylopectin.20 Starch adhesive wet the polar surface of cellulose, penetrate the crevices and pores and form the strong adhesive bond. The adhesive bonding is the result of Van der Waals and mechanical interlocking forces.21

Fabrication and Characterisations of Rhizophora spp. 134
Corn starch can be used as adhesive either with modification or without modification of fortification. Fortification of starch is usually used the sodium sulphate or sodium chloride as addition to restrict swelling of the starch granules during reaction.22 Therefore, the corn starch in this study was used as adhesive without treatment and addition of hardener to retain its elemental compositions. The objectives of the present study are to fabricate and characterise Rhizophora spp. particleboards bonded with corn starch as water equivalent phantom material. The characterisations of the particleboards included the evaluation of physical and mechanical properties, and the elemental compositions. The effective atomic number, mass attenuation coefficient, computed tomography (CT) number and electron density of the particleboards were also evaluated to determine their water equivalent properties.
2. EXPERIMENTAL
2.1 Sample Preparation
The Rhizophora spp. wood trunks were obtained from a mangrove reserved forest in Perak, Malaysia. Rhizophora spp. trunks with the middle part were chosen as it contains elemental compositions similar to the human soft tissues based on the study by Shakhreet et al.8 The Rhizophora spp. trunks were planed and ground into wood particles before being segregated into different wood particle size ranges by using a horizontal screening machine. Three ranges of wood particles size of 104–210 µm, 74–104 µm and ≤ 74 µm were obtained based on the available mesh size of the screening machine. The wood particles were dried in air and the moisture content of the wood particles was measured. The moisture content of the wood particles was kept below 10% before the fabrication process.12,24 Higher moisture content would cause accumulation of water that resulted to blistering and swelling on the particleboards. The commercialised corn starch obtained from the Sigma-Aldrich Corp. was used as adhesive for the Rhizophora spp. particleboards fabrication. The corn starch used was in the form of fine white powder, with 692.661 g mol–1 of molecular weight and 1.45 g cm–3 of density. The corn starch having a molecular formula of C27H48O20.23
2.2 Fabrication of the Particleboards
Nine types of Rhizophora spp. particleboards that consist of three binderless particleboards and six particleboards with different percentage level of corn starch (5% and 10%) were fabricated at different wood particle size ranges. All particleboards were fabricated at target density similar to water of 1.0 g cm–3 and coded as in Table 1. The dried mass of Rhizophora spp. wood particles were
Journal of Physical Science, Vol. 30(3), 131–155, 2019 135
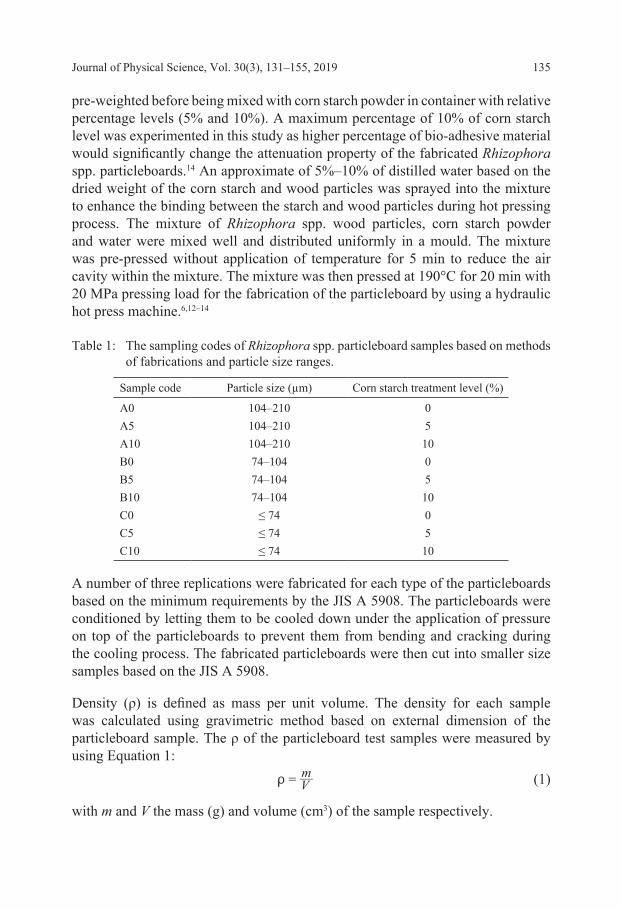
pre-weighted before being mixed with corn starch powder in container with relative percentage levels (5% and 10%). A maximum percentage of 10% of corn starch level was experimented in this study as higher percentage of bio-adhesive material would significantly change the attenuation property of the fabricated Rhizophora spp. particleboards.14 An approximate of 5%–10% of distilled water based on the dried weight of the corn starch and wood particles was sprayed into the mixture to enhance the binding between the starch and wood particles during hot pressing process. The mixture of Rhizophora spp. wood particles, corn starch powder and water were mixed well and distributed uniformly in a mould. The mixture was pre-pressed without application of temperature for 5 min to reduce the air cavity within the mixture. The mixture was then pressed at 190°C for 20 min with 20 MPa pressing load for the fabrication of the particleboard by using a hydraulic hot press machine.6,12–14
Table 1: The sampling codes of Rhizophora spp. particleboard samples based on methods of fabrications and particle size ranges.
Sample code Particle size (µm) Corn starch treatment level (%)
A0 104–210 0A5 104–210 5A10 104–210 10B0 74–104 0B5 74–104 5B10 74–104 10C0 ≤ 74 0C5 ≤ 74 5C10 ≤ 74 10
A number of three replications were fabricated for each type of the particleboards based on the minimum requirements by the JIS A 5908. The particleboards were conditioned by letting them to be cooled down under the application of pressure on top of the particleboards to prevent them from bending and cracking during the cooling process. The fabricated particleboards were then cut into smaller size samples based on the JIS A 5908.
Density (ρ) is defined as mass per unit volume. The density for each sample was calculated using gravimetric method based on external dimension of the particleboard sample. The ρ of the particleboard test samples were measured by using Equation 1:
Vmt = (1)
with m and V the mass (g) and volume (cm3) of the sample respectively.

Fabrication and Characterisations of Rhizophora spp. 136
2.3 Evaluation of Physical and Mechanical Properties
The internal bonding (IB) strength and modulus of rupture (MOR) tests were carried out according to JIS A 5908 to evaluate the physical and mechanical properties of Rhizophora spp. particleboards.15 Test samples with external dimensions of 5.0 cm × 5.0 cm size were prepared for IB strength test and 5 cm × 20 cm size were prepared for MOR test. The IB strength and MOR tests were carried out by the using Instron Testing System to determine the maximum load of the test samples. The IB strength of the particleboards was calculated by using Equation 2:
IB strength wlP2max= (2)
where Pmax is maximum load (N), w is width of sample (cm) and l is length of sample (cm). The MOR of the test samples was calculated by using Equation 3:
MOR wtP L2
3 max2= (3)
with Pmax the maximum load (N), L the span length (cm), w width of sample (cm), and t thickness of sample (cm).
2.4 Evaluation of Elemental Composition and Effective Atomic Number
The sample was mounted on a metal strap holder and coated with gold using ion sputter coater to prevent charging of the sample with electron beam during scanning process. The elemental compositions of Rhizophora spp. particleboards were determined using energy dispersive X-ray spectroscopy (EDX) coupled with the scanning electron microscope (SEM). The X-ray spectrum resulted from the interaction of between the particleboard sample and electrons were obtained for chemical analysis. The elemental compositions were displayed as percentage of mass within the samples.
The effective atomic numbers (Zeff) is a photon interaction parameter which is important for dosimetric studies. The Zeff of the particleboards were calculated based on the percentage of elemental compositions of the particleboards according to the study by Duvauchelle et al.25 The Zeff of the particleboards were calculated by using Equation 4:
Z Zeff i im
i
N
1
m1
a==] g/ (4)
with αi and Zi the electronic fraction and atomic number of the ith element in the compound respectively. The experimental coefficient (m) for biological material

Journal of Physical Science, Vol. 30(3), 131–155, 2019 137
such as water, wood or human organs has been evaluated to be equal to 3.4.25 The electronic fraction of the ith element was calculated by using Equation 5:
ww
ii A
Zi A
Z
i
i
i
i
a =^^hh/ (5)
with wi and Ai the fractional weight and atomic mass of the ith element, respectively. The calculated value of Zeff for corn starch bonded Rhizophora spp. particleboard was compared to that in water and Perspex standard phantom materials for diagnostic imaging.
2.5 Measurement of Mass Attenuation Coefficients
The mass attenuation coefficients of the Rhizophora spp. particleboards at low energy photons were measured using an X-ray fluorescence (XRF) technique based on the study by Marashdeh et al. as shown in Figure 1.9 An annular source of 241Am with activity of 100 mCi and gamma peak energy of 59.54 keV was used in conjunction with niobium, molybdenum, palladium and tin plates that provided Kα1 X-ray energies of 16.59 keV, 17.46 keV, 21.21 keV and 25.26 keV, respectively. These X-ray energies ranges represented the low effective photon energies used in diagnostic radiography including mammography, CT and general radiography. The detail of the metal plates used in the XRF technique is summarised in Table 2. The transmitted photons through the particleboards samples was detected and measured by a low energy Germanium (LEGe) detector connected to a Single Channel Analyzer (SCA). The LEGe detector was calibrated by using the low photon energy emitted from the metal plates.
Figure 1: The schematic diagram of XRF technique used to measure the mass attenuation coefficients at 16.59–25.26 keV photon energies.

Fabrication and Characterisations of Rhizophora spp. 138
Table 2: The metal plates and respective Kα1 X-rays used in XRF technique.
Plate Atomic number, Z Thickness (mm)
Purity (%)
Kα1 energy (keV)
Niobium (Nb) 41 0.14 99.8 16.59Molybdenum (Mo) 42 0.11 99.9 17.46Palladium (Pd) 46 0.10 99.9 21.21Tin (Sn) 50 0.28 99.999 25.26
The percentage of energy resolutions of the XRF photons were measured based on the recent calibration of the XRF configuration given by Equation 6:
% Energy resolution photo peakFWHM 100#
= (6)
where FWHM is the full width of half maximum of the photon peak measured by using the Maestro software of the XRF configuration. Table 3 shows the energy resolution data of LEGe detector at Kα1 energies of the metal plates used in the XRF configuration.
Table 3: The energy resolution of LEGe detector at all Kα1 energies of the metal plates.
Kα1 X-ray energy FWHM Resolution (%)
16.59 4.721 1.71117.46 4.928 1.61521.21 5.332 1.18325.26 5.858 0.914
The mass attenuation coefficients of the particleboard were determined based on the transmission of the collimated monoenergetic beam based on previous studies.11–14 The fraction of photons removed from a monoenergetic beam of X or gamma rays as it passes through matter per unit thickness of material is called linear attenuation coefficient and denoted by µ.26 The µ of samples was calculated from the attenuation of photons with samples based on the Beer-Lambert calculation given by using Equation 7:
I I e xo� n� (7)
where Io is the initial intensity of photons, µ is the linear attenuation coefficient of the sample, and x is the thickness of the particleboard samples. The value of µ was calculated using the Equation 8:
lnx II1 o��= b l (8)

Journal of Physical Science, Vol. 30(3), 131–155, 2019 139
The attenuation process is dependent on the number of atoms per volume. Therefore, the linear attenuation coefficient is normalised to unit density called mass attenuation coefficient and denoted as µ/ρ. The µ/ρ value was obtained by dividing the value of the linear attenuation coefficient (Equation 7) by the density of the particleboard as shown in Equation 9:
lnx II1 on t t= b l (9)
2.6 Computed Tomography Analysis of the Particleboards
Particleboard plugs from each type of Rhizophora spp. particleboards were constructed compatible to be used with the electron density phantom (Model 062M) as shown in Figure 2.27 The fabricated particleboards were sawn circularly to obtain the disc-shaped particleboards. The sawn particleboards were then stacked and glued together by using polyvinyl acetate (PVA) adhesive to obtain density plug phantoms of approximate length and diameter of 7.0 and 3.0 cm respectively. The densities of the particleboard plugs were calculated by using gravimetric method based on the external dimensions given by the Equation 1. The particleboard plugs and several electron density plugs with known densities and electron density were inserted into the electron density phantom inserts. The electron density phantom was scanned using Somatom Definition AS Siemens computed tomography (CT) scanner at X-ray CT energy of 120 kVp with 250 mAs of effective current-time based on the standard abdominal scanning protocol. The CT number represents the intensity of the transmitted X-ray beam that expressed in Hounsfield Units (HU). The CT number is a linear transformation of the original linear attenuation coefficient measurement into one where water is assigned a value of zero and air is assigned a value of –1000. CT number is defined by Equation 10:
CT number HU 1000w
m w
#nn n
=-] g (10)
where µm and µw are the linear attenuation coefficients of the material and water, respectively. The CT number for each Rhizophora spp. particleboard plug was determined from the average of 15 slices of the CT images with 0.1 cm intervals between the image slices.

Fabrication and Characterisations of Rhizophora spp. 140
Figure 2: Illustrations of (a) plug phantoms made of Rhizophora spp. particleboards, and (b) CT electron density phantom model CIRS 062M, used for CT imaging study.
2.6.1 Measurement of density by using CT method
A calibration curve between CT numbers and densities was plotted using tissue equivalent electron density plugs of water, liver, lung, muscle, bone, breast and adipose phantom with known density as shown in Figure 3 based on the studies by Marashdeh et al. and Mohd Yusof et al.9,13 The calibration curve showed good linearity between the physical density and CT number of the tissue equivalent density plug phantom indicated by the R2 value of 0.996.
Therefore, the density of the particleboard plugs can be calculated using CT numbers method by using Equation 11:
.
.
975 26
976 29CTt = (11)
where ρCT is density measured using CT method and CT is the CT number of the particleboards. The values of ρCT of the Rhizophora spp. plugs were compared with the density measured using gravimetric method.

Journal of Physical Science, Vol. 30(3), 131–155, 2019 141C
T nu
mbe
r (H
U)
−1000
−800
−600
−400
−200
0
200
R2 = 0.9959
0.8 1 1.2 1.40.60.40.20
a
b
d
e f g h i
cy = 975.26x − 976.29
Physical density (g cm−3)
Figure 3: The calibration curve between the CT numbers and known density of (a) air, (b) lung (inhale), (c) lung (exhale), (d) adipose, (e) breast, (f) water, (g) muscle, (h) liver, and (i) trabecular bone tissue equivalent plug phantoms.
2.6.2 Measurement of electron density of the particleboards
the electron density of a material is one of the parameters that can be used to determine the attenuation property of a material towards ionising radiations.28,29 The similarity of electron density between two materials would indicate similar attenuation properties of the materials. Therefore, the electron density values of the Rhizophora spp. particleboards were measured in this study and compared to water as standard phantom material. The electron density of water is known to be 3.341 × 10²³ electrons cm–3. Stoichiometric calibration of the CT number with the electron density (or proton stopping power for proton radiotherapy) was established by Schneider et al. to determine their relationship.30 A calibration curve was plotted between the CT numbers and electron density values of the tissue equivalent plugs with known electron density values as shown in Figure 4. The electron density curve showed an excellent linearity between the CT number and electron density values of the plugs phantom shown by the linear regression, R2 value of 0.9997. The electron density of the Rhizophora spp. particleboards were calculated based on the relationship between the CT number and electron density given by Equation 12:
. .CT0 0035 3 3539et = + (12)
where ρe is electron density and CT is the CT number of the Rhizophora spp. particleboards. The density profile was plotted based on measured CT numbers across the lateral distance of the samples in the CT images. The density distribution at each point 0.135 mm across the lateral distance was calculated by using Equation 10.13

Fabrication and Characterisations of Rhizophora spp. 142
The density profile for each Rhizophora spp. particleboard and water plugs were plotted to determine the density uniformity of particleboard plugs phantom. The flatness of density profile for each sample was calculated to determine the density uniformity within the volume of the sample using Equation 9:
%Flatness 100max min
max min#t t
t t= +
- (13)
where ρmax and ρmin are the maximum and minimum densities along the profile within the volume 80% of the lateral distance.
Elec
tron
dens
ity (×
1023
ele
ctro
ns c
m−3
) 3.5
3
a
b
c
de
f
g
2.5
1.5
0.5
0
2
1
3.5
−800 −700 −600 −500 −400 −300 −200 100−100 0
CT number (HU)
y = 0.0035x + 303539R2 = 0.9997
Figure 4: The calibration curve between the electron density values and CT numbers of (a) lung (inhale), (b) lung (exhale), (c) adipose, (d) breast, (e) water, (f) muscle, and (g) liver tissue equivalent plug phantoms.
3. RESULTS AND DISCUSSIONS
3.1 Measurement of Average Density of the Particleboards
The densities of fabricated particleboards were compared to density of water as standard phantom. The average densities of the Rizhophora spp. particleboards using gravimetric method and percentage errors compared to density of water are presented in Table 4. The average densities of particleboard samples were ranged from 1.001 g cm–3 to 1.054 g cm–3 which are close to density of water (1.0 g cm–3).
Journal of Physical Science, Vol. 30(3), 131–155, 2019 143
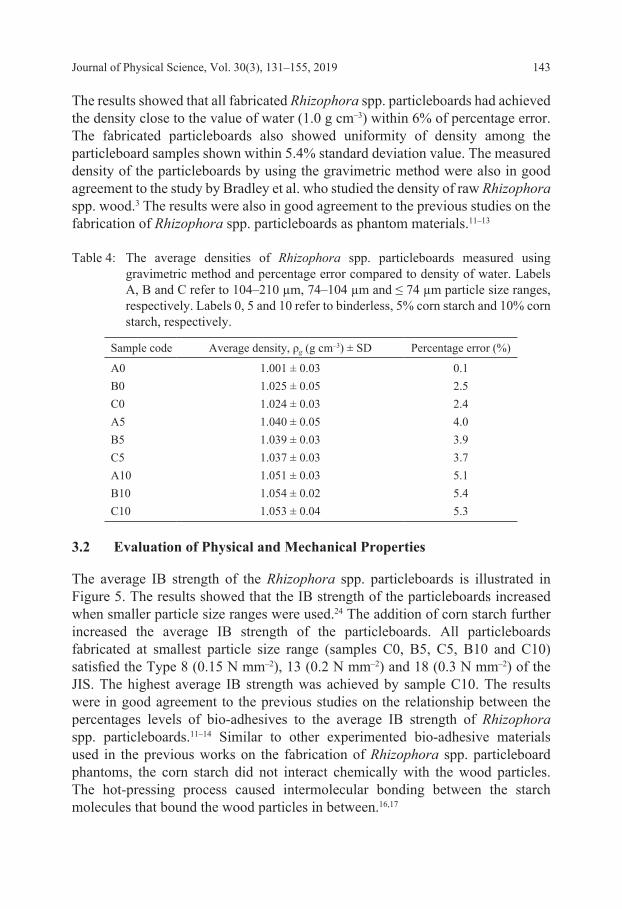
The results showed that all fabricated Rhizophora spp. particleboards had achieved the density close to the value of water (1.0 g cm–3) within 6% of percentage error. The fabricated particleboards also showed uniformity of density among the particleboard samples shown within 5.4% standard deviation value. The measured density of the particleboards by using the gravimetric method were also in good agreement to the study by Bradley et al. who studied the density of raw Rhizophora spp. wood.3 The results were also in good agreement to the previous studies on the fabrication of Rhizophora spp. particleboards as phantom materials.11–13
Table 4: The average densities of Rhizophora spp. particleboards measured using gravimetric method and percentage error compared to density of water. Labels A, B and C refer to 104–210 µm, 74–104 µm and ≤ 74 µm particle size ranges, respectively. Labels 0, 5 and 10 refer to binderless, 5% corn starch and 10% corn starch, respectively.
Sample code Average density, ρg (g cm–3) ± SD Percentage error (%)
A0 1.001 ± 0.03 0.1B0 1.025 ± 0.05 2.5C0 1.024 ± 0.03 2.4A5 1.040 ± 0.05 4.0B5 1.039 ± 0.03 3.9C5 1.037 ± 0.03 3.7A10 1.051 ± 0.03 5.1B10 1.054 ± 0.02 5.4C10 1.053 ± 0.04 5.3
3.2 Evaluation of Physical and Mechanical Properties
The average IB strength of the Rhizophora spp. particleboards is illustrated in Figure 5. The results showed that the IB strength of the particleboards increased when smaller particle size ranges were used.24 The addition of corn starch further increased the average IB strength of the particleboards. All particleboards fabricated at smallest particle size range (samples C0, B5, C5, B10 and C10) satisfied the Type 8 (0.15 N mm–2), 13 (0.2 N mm–2) and 18 (0.3 N mm–2) of the JIS. The highest average IB strength was achieved by sample C10. The results were in good agreement to the previous studies on the relationship between the percentages levels of bio-adhesives to the average IB strength of Rhizophora spp. particleboards.11–14 Similar to other experimented bio-adhesive materials used in the previous works on the fabrication of Rhizophora spp. particleboard phantoms, the corn starch did not interact chemically with the wood particles. The hot-pressing process caused intermolecular bonding between the starch molecules that bound the wood particles in between.16,17

Fabrication and Characterisations of Rhizophora spp. 144IB
Stre
ngth
(N m
m−2
)
Sample type
JIS A 5908 Type 18
JIS A 5908 Type 13
JIS A 5908 Type 8
C10B10A10 B0 B5 C5C0A0 A5
0.6
0.5
0.4
0
0.1
0.2
0.3
Figure 5: The average IB strength of Rhizophora spp. particleboards. Labels A, B and C refer to 104–210 µm, 74–104 µm and ≤ 74 µm particle size ranges respectively. Labels 0, 5 and 10 refer to binderless, 5% corn starch and 10% corn starch, respectively.
Similar results were also observed on the average MOR of the particleboards as shown in Figure 6. The MOR of the particleboards increased when smaller wood particle size ranges were used and corn starch was added into the particleboards. All Rhizophora spp. particleboards satisfied the JIS A 5908 (2003) for particleboard Type 8 (8.0 N mm–2) except for sample A0. Smaller particles size particleboard with addition of corn starch (samples B5, C5, B10 and C10) also satisfied the Type 13 (13 N mm–2) of the JIS. The highest MOR value was achieved by Rhizophora spp. particleboards at the smallest wood particle size range bonded with 10% corn starch (sample C10). The MOR results consistent with the previous study by Mohd Yusof et al.13

Journal of Physical Science, Vol. 30(3), 131–155, 2019 145M
OR
(N m
m−2
)
Sample type
JIS A 5908 Type 18
JIS A 5908 Type 13
JIS A 5908 Type 8
C10B10A10 B0 B5 C5C0A0 A5
25
20
0
5
10
15
Figure 6: The average MOR of Rhizophora spp. particleboards. Labels A, B and C refer to 104–210 µm, 74–104 µm and ≤ 74 µm particle size ranges, respectively. Labels 0, 5 and 10 refer to binderless, 5% corn starch and 10% corn starch, respectively.
3.3 Elemental Compositions and Effective Atomic Number of the Particleboards
The percentage of elemental compositions of the Rhizophora spp. particleboards measured by using EDXA method is presented in Table 5. The results showed that the corn starch bonded Rhizophora spp. particleboards consisted of relatively high percentage of carbon and oxygen similar to the compositions of human tissue. A calculation of Zeff showed that the value of corn-starch bonded Rhizophora spp. particleboard was close to the value of water.31 The calculation of Zeff on the corn starch used as the binder also showed close value to that with water. The addition of corn starch as binder improved the Zeff of Rhizophora spp. particleboards nearer to the value of water. The results were in good agreement to the previous studies on the effective atomic number of Rhizophora spp. particleboards bonded with bio-adhesive materials.11–13 Duvauchelle et al. and Saito suggested that two materials are said to have similar attenuation properties when the values Zeff are similar.25,28 Therefore, it is postulated that the corn starch bonded Rhizophora spp. particleboards would have similar attenuation properties to that in water towards ionising radiation based on the near value of Zeff.

Fabrication and Characterisations of Rhizophora spp. 146
Table 5: The calculated effective numbers Zeff of Rhizophora spp. particleboards in comparison to water, Perspex and previous studies.
Sample (and reference)Percentage of elemental composition (%)
ZeffCarbon(C)
Hydrogen(H)
Oxygen(O)
Nitrogen(N)
Fluorin(F)
Water31 – 11.11 88.89 – – 7.50
Perspex31 59.98 31.97 8.05 – – 5.21
Binderless Rhizophora spp.13
32.93 – 38.98 28.08 – 7.19
Corn Starchc* 46.82 6.94 46.24 – – 6.88
Corn starch bonded Rhizophora spp.c*
27.20 – 72.55 0.25 – 7.587
Tannin-basedRhizophora spp.13
51.25 – 43.11 – 5.64 7.22
Arabic gum –Rhizophora spp.6
42.1 5.25 – 0.65 – 7.18
Almond gum – Rhizophora spp.13
41.72 6.03 51.98 0.27 – 7.15
Notes: *Current study
3.4 Analysis of Mass Attenuation Coefficients
The mass attenuation coefficients of the Rhizophora spp. particleboards at 16.59–25.26 keV photon energies measured using XRF technique is presented in Table 6. The results showed that the mass attenuation coefficients of all Rhizophora spp. particleboards were close to the XCOM values of water. The paired sample t-test was calculated to determine the influence of the wood particle size ranges and percentage of corn starch treatment level to the attenuation properties of Rhizophora spp. particleboards as shown in Table 7. The p-value was determined between the mass attenuation coefficients of water to each variation of Rhizophora spp. particleboards. The results showed that there was no significant difference of mass attenuation coefficients of Rhizophora spp. fabricated at different wood particle size ranges, addition of corn starch and the percentage of corn starch treatment level indicated by the calculated p-values. The results were in good agreement to the study of the effects of wood particle size ranges and the percentage of the bio-adhesive materials to the mass attenuation coefficients of the fabricated Rhizophora spp. particleboards by Ababneh et al. and Abuarra et al.11,12 This study focused on the use of corn starch not exceeding 10% treatment level as higher percentage of adhesive material could significantly modify the compositions and attenuation properties of the particleboards.14 Therefore, a phantom material can

Journal of Physical Science, Vol. 30(3), 131–155, 2019 147
be constructed from the fabricated Rhizophora spp. particleboards at any wood particle size and percentage of corn starch treatment level as experimented in this study.
Table 6: The linear and mass attenuation coefficients of Rhizophora spp. particleboards at 16.59–25.26 keV photons using XRF technique. Labels A, B and C refers to 104–210 µm, 74–104 µm and ≤ 74 µm particle size ranges respectively. Labels 0, 5 and 10 refer to binderless, 5% corn starch and 10% corn starch, respectively.
SampleNb (16.59 keV) Mo (17.46 keV) Pd (21.21 keV) Sn (25.26 keV)
µ µ/ρ µ µ/ρ µ µ/ρ µ µ/ρ
A0 1.079 1.076 0.947 0.944 0.667 0.665 0.494 0.493A5 1.002 1.001 1.008 1.007 0.698 0.697 0.453 0.453A10 1.070 1.063 1.037 1.030 0.749 0.744 0.459 0.456B0 1.176 1.175 1.031 1.030 0.695 0.694 0.526 0.488B5 1.069 1.059 0.986 0.977 0.714 0.708 0.545 0.540B10 1.100 1.092 0.993 0.986 0.712 0.707 0.595 0.591C0 1.164 1.165 1.066 1.067 0.655 0.656 0.467 0.467C5 1.286 1.282 1.126 1.123 0.720 0.718 0.479 0.478C10 1.228 1.217 1.110 1.100 0.741 0.734 0.485 0.481Water (XCOM) – 1.103 – 1.095 – 0.755 – 0.506
3.4.3 Analysis of Computed Tomography Study
Figure 7 shows the CT images of Rhizophora spp. particleboard plugs phantom inserted in the electron density phantom scanned at 120 kVp CT X-ray energy. The average CT numbers of the particleboards in comparison to water are presented in Table 8. The results showed that the average CT numbers of Rhizophora spp. particleboards were between –26.46 and 20.15 HU, close to the value of water (–0.34 HU). The use of smaller Rhizophora spp. particle size and addition of corn starch had lowered the average CT numbers of the fabricated particleboard and closer to value of water. The results are in good agreement with the previous studies on the CT numbers of Rhizophora spp. particleboards as phantom materials by Marashdeh et al. and Mohd Yusof et al.11,13 Saito and Kurudirek suggested the CT number of a material is very much related to its attenuation properties.28,29 The smallest particle size of Rhizophora spp. particleboard bonded with 10% corn starch (C10) was found to have the closest CT number to the value of water. The value of standard deviation (SD) of CT number measured from water however was significantly lower than those measured in particleboards. This indicated better uniformity of density in water as standard phantom material in comparison to the fabricated Rhizophora spp. particleboards.

Fabrication and Characterisations of Rhizophora spp. 148
Figure 7: The CT images of Rhizophora spp. particleboard plug phantoms of (a) 104–210 µm, (b) 74–104 µm, and (c) ≤74 µm particle size ranges at CT X-ray energy of 120 kVp. Labels A, B and C refer to 104–210 µm, 74–104 µm and ≤ 74 µm particle size ranges, respectively. Labels 0, 5 and 10 refer to binderless, 5% corn starch and 10% corn starch, respectively.
The Hounsfield Unit (HU) scale generally ranges between –1000 and +1000 with lower density tissues having lower HU values and displayed as darker shades of grey. The higher density tissues will have higher HU values and displayed as lighter shades of grey. Water has the HU value of zero while the soft tissues having HU values ranging between –200 and +200.32 Therefore, all the particleboards samples were within the CT number ranges for water and soft tissue.
A comparison between the densities of Rhizophora spp. particleboards measured using gravimetric and CT methods are illustrated in Table 9. The densities of the Rhizophora spp. particleboards calculated using conventional gravimetric method ranged between 0.995 g cm–3 and 1.107 g cm–3. The densities of the fabricated particleboards calculated from the CT number based on the Equation 10 obtained from the calibration curve ranged from 0.973 g cm–3 to 1.021 g cm–3. The density

Journal of Physical Science, Vol. 30(3), 131–155, 2019 149
values of fabricated particleboards measured using CT method were closer to density of water (1.0 g cm–3) compared to the gravimetric method. The measured densities of the Rhizophora spp. particleboards using CT method were in good agreement to the conventional gravimetric method within 9% of percentage difference. The variation of density of the particleboards within the volume can also be observed based on the variation of greyscale of the CT image. The result showed good agreement of density between the CT and gravimetric methods. Tanaka et al. suggested CT imaging as an accurate method for bulk density measurements which is better than conventional gravimetric methods since CT methods offers a three dimensional distribution of the scanned sample.33 The process of the density conversion from the CT number could eliminate the possibilities of measurement errors in the conventional gravimetric method.
Table 9: The measured density of Rhizophora spp. particleboards using gravimetric and CT methods. Labels A, B and C refer to 104–210 µm, 74–104 µm and ≤ 74 µm particle size ranges, respectively. Labels 0, 5 and 10 refer to binderless, 5% corn starch and 10% corn starch, respectively.
Samples Gravimetric density, ρg
(g cm–3)CT density, ρCT
(g cm–3)Percentage difference
(%)
A0 0.995 0.973 2.24A5 1.067 1.021 4.41A10 1.107 1.019 8.28B0 1.012 1.018 0.59B5 1.104 1.016 8.20B10 1.099 1.011 8.34C0 1.034 1.009 2.45C5 1.062 1.008 5.22C10 1.011 0.999 1.19
Table 10 showed the electron density of Rhizophora spp. particleboards measured from the CT number in comparison to water. The results showed that all Rhizophora spp. particleboards having electron density close to the value of water within 2.52% of percentage error. The interaction of photons towards a medium is greatly influenced by its electron density. The radiation interaction through photoelectric effects and Compton scattering are predominant at low and diagnostic range of photon energy which is resulted by the interaction of photons with the electrons of the medium. Therefore, two mediums are said to have similar attenuation property towards photons when the electron densities are equal.28 The CT method was chosen in this study to determine the relative electron density of the particleboards as it provides thorough attenuation per unit volume of the particleboards.

Fabrication and Characterisations of Rhizophora spp. 150
Table 10: The electron density values of Rhizophora spp. particleboards and percentages of error in comparison to value of water. Labels A, B and C refers to 104–210 µm, 74–104 µm and ≤ 74 µm particle size ranges, respectively. Labels 0, 5 and 10 refer to binderless, 5% corn starch and 10% corn starch, respectively.
Samples Electron density (×1023 electrons cm–3) Percentage error to water (%)
A0 3.261 2.37A5 3.424 2.52A10 3.417 2.31B0 3.411 2.10B5 3.404 1.92B10 3.389 1.47C0 3.380 1.19C5 3.377 1.11C10 3.347 0.21Water 3.340 –
The density profiles were plotted based on the density of particleboards measured using the CT information as illustrated in Figure 8. The dramatic increase and decline of the density profile is due to the presence of air between the particleboard plug phantoms and the insert holes of the CT electron density phantom. The flatness of density profile was used to clarify the variation of density distribution within the volume of sample. The calculation of flatness of density profile along the lateral distance of sample with maximum and minimum density values are presented in Table 11. The results showed that smaller wood particle size ranges gave better density uniformity of the fabricated Rizhophora spp. particleboards indicated by the flatness values.11 The addition of corn starch into the particleboards further improved the density uniformity of the particleboards.13 The percentage of corn starch levels used however did not significantly affects the density uniformity of the wood particles. The variation of density profile flatness for all samples of Rhizophora spp. particleboards were within 3% except for A0 sample. The density profiles of the corn starch-bonded particleboards fabricated with the smallest particle size (C5 and C10) have lower flatness values (0.89% and 0.86%) and closer to flatness of water density (0.61%). It shows the corn starch-bonded Rhizophora spp. particleboards fabricated using the smallest particle size ranges (C5 and C10) have better density uniformity than those in samples A0, B0, C0, A5, B5, A10 and B10. The Rhizophora spp. binderless particleboard using largest particle size ranges (sample A0) has flatness value of 3.16%, which referred as large variation of density distribution than other particleboard samples. Fromm et al. suggested CT imaging as a non-destructive method to determine the internal structure and morphology of woods.34 The uniformity of density is important to provide uniform attenuation level when a material interacts with ionising radiations.

Journal of Physical Science, Vol. 30(3), 131–155, 2019 151
An ideal phantom material shall have good density uniformity for better accuracy of dosimetry works involving ionising radiations.
(a) Target density
WaterC0B0A0
0.9
0.8
0.20 5 10 15 20 25 30 35
0.3
0.4
0.5
0.6
0.7
1
1.1
Den
sity
(g c
m−3
)
Lateral distance (mm)
(b) Target density
Water
C5
B5
A50.9
0.8
0.20 5 10 15 20 25 30 35
0.30.4
0.50.6
0.7
11.1
1.2
Den
sity
(g c
m−3
)
Lateral distance (mm)
(c) Target density
Water
C10
B10
A10
0.9
0.8
0.2
0 5 10 15 20 25 30 35
0.30.4
0.50.6
0.7
11.1
Den
sity
(g c
m−3
)
Lateral distance (mm)
Figure 8: The density profiles of Rhizophora spp. for (a) binderless, (b) 5% corn starch, and (c) 10% corn starch particleboards in comparison to water based on the CT number at 120 kVp CT X-ray energy. Labels A, B and C refers to 104–210 µm, 74–104 µm and ≤ 74 µm particle size ranges, respectively. Labels 0, 5 and 10 refer to binderless, 5% corn starch and 10% corn starch, respectively.

Fabrication and Characterisations of Rhizophora spp. 152
Table 11: The maximum and minimum density values across lateral distance and the flatness of density profiles of the Rhizophora spp. particleboards in comparison to water. Labels A, B and C refer to 104–210 µm, 74–104 µm and ≤ 74 µm particle size ranges, respectively. Labels 0, 5 and 10 refer to binderless, 5% corn starch and 10% corn starch, respectively.
Plugs SampleDensity (g cm–3)
Flatness (%)Max Min
A0 1.039 0.975 3.16A5 1.042 0.996 2.26A10 1.034 0.984 2.49B0 1.021 0.970 2.51B5 1.047 1.000 2.33B10 1.022 0.984 1.9C0 1.021 0.991 1.48C5 1.023 1.005 0.89C10 1.021 1.003 0.86Water 1.007 0.995 0.61
4. CONCLUSION
The addition of corn starch increased the mechanical properties and of the particleboards indicated by the average IB strength and MOR of the particleboards based on the JIS. The evaluation of effective atomic number also had indicated the near value of corn starch bonded Rhizophora spp. particleboards to the value of water indicating similarity of attenuation properties towards ionising radiations. The CT analysis also indicated the near value of CT number and density of corn starch bonded Rhizophora spp. particleboards to those of water indicating the water equivalent properties of the particleboards. Smaller wood particle size ranges and the addition of corn starch adhesive resulted better density uniformity of the fabricated Rhizophora spp. particleboard across the volumes and the percentage of corn starch levels did not significantly influence the density uniformity of the particleboards. The overall results indicated the suitability of Rhizophora spp. particleboards to be potentially used as phantom material at low energy photons.

Journal of Physical Science, Vol. 30(3), 131–155, 2019 153
5. ACKNOWLEDGEMENTS
The authors would like to acknowledge the financial aid of Research University grant no. PSPTEKIND1000000004178 and Bridging Grant no. 304/PPSK/6316145 by Universiti Sains Malaysia. The authors also are grateful to the Advanced Medical and Dental Institute, Universiti Sains Malaysia for the use of CT scanner in the present study.
6. REFERENCES
1. Alias, S. A., Zainuddin, N. & Jones, E. (2010). Biodiversity of marine fungi in Malaysian mangroves. Bot. Mar., 53, 545–554, https://10.1515?BOT.2010.066.
2. Che Wan Sudin, C. W. A. (1993). Kayu tropika sebagai bahantara setaraan tisu untuk kajian dosimetri. MSc. diss., Universiti Sains Malaysia, Malaysia.
3. Bradley, D. A. et al. (1991). Photon attenuation studies on tropical hardwoods. Appl. Radiat. Isot., 42, 771–773.
4. Tajuddin, A. A., Che Wan Sudin, C. W. A. & Bradley, D. (1996). Radiographic and scattering investigation on the suitability of Rhizophora spp. as tissue-equivalent medium for dosimetric study. Radiat. Phys. Chem., 45(5), 739–740.
5. Banjade, D. P. et al. (2001). A study of Rhizophora spp. wood phantom for dosimetric purposes using high energy photon and electron beams. Appl. Radiat. Isot., 55(3), 297–302.
6. Abuarra, A. et al. (2014). Microstructure examination, elemental composition analysis of gum Arabic bonded Rhizophora spp. particleboards and their potential as tissue equivalent material. Int. J. Chem. Environ. Biol. Sci., 2(1), 71–75, https://doi.org/10.1016/j.matdes.2014.03.032.
7. Khan, F. M. (2010). The physics of radiation therapy, 4th ed. Philadelphia: Lippincott Williams and Wilkins.
8. Shakhreet, B. Z. et al. (2009). Mass attenuation coefficients of natural Rhizophora spp. wood for X-rays in the 15. 77 to25.27 keV range. Radiat. Prot. Dosim., 135, 47–53, https://10.1093/rpd/ncp096.
9. Marashdeh, M. W. et al. (2012). Measurement of mass attenuation coefficients of Rhizophora spp. binderless particleboards in the 16.59–25.26 keV photon energy range and their density profile using X-ray computed tomography. Appl. Radiat. Isot., 70, 656–662, https:// 10.1016/j.apradiso.2012.01.008.
10. Ngu, K. T. et al. (2015). Fabrication of formaldehyde-based Rhizophora spp. particleboards and their mass attenuation coefficients at 15.77, 17.48, 21.18 and 25.27 keV photon energies. J. Phys. Sci., 26(1), 27–33.
11. Ababneh, B. et al. (2016). Investigation of mass attenuation coefficient of almond gum bonded Rhizophora spp. particleboard as equivalent human tissue using XRF technique in the 16.6-25–25.23 keV photon energy. Aus. Phys. Eng. Sci. Med., 39(4), 871–876, https://10.1007/s13246-016-0482-6.

Fabrication and Characterisations of Rhizophora spp. 154
12. Abuarra, A. et al. (2014). Fabrication and characterization of gum Arabic bonded Rhizophora spp. particleboards. Mater. Des., 60, 108–115, http://doi.org/10.1016/j.matdes.2014.03.032.
13. Mohd Yusof, M. F. M. et al. (2017). Characterization of tannin-added Rhizophora spp. particleboards as phantom materials for photon beams. Ind. Crop. Prod., 95, 467–474, https://doi.org/10.1016/j.indcrop.2016.10.057.
14. Tousi, E. T. et al. (2014). Measurement of mass attenuation coefficients of Eremerus-Rhizophora spp. particleboards for X-ray in the 16.63–25.30 keV energy range. Radiat. Phys. Chem., 103, 119–125, http://doi.org/10.1016/j.radphyschem.2014.03.011.
15. Japanese Industrial Standard, JIS. (2003). Japanese Industrial Standard particleboards, JIS A 5908. Tokyo: JIS.
16. Liu, J., Jia, C. & He, C. (2012). Rice straw and corn starch biodegradable composites. AASRI Proced., 3, 83–88, https://10.1016/j.aasri.2012.11.015.
17. Moubarik, A. et al. (2010). Preparation and mechanical characterization of particleboard made from maritime pine and glued with bio-adhesives based on cornstarch and tannin. Maderas-Cienc. Technol., 12(3), 189–197, https://doi.org/10.4067/S0718-221X2010000300004.
18. Moubarik, A. et al. (2013). Mechanical characterization of industrial particleboard panels glued with corn starch-mimosa tannin-urea formaldehyde resins. J. Ad. Sci. Technol., 27(4), 423–429, https://doi.org/10.1080/01694243.2012.711739.
19. Richardson, S. & Gorton, L. (2003). Characterisation of the substituent distribution in starch and cellulose derivatives. Anal. Chim. Acta, 497, 27–65, https://doi.org/10.1016/j.aca.2003.08.005.
20. Van Steene, G. & Masschelein-Kleiner, L. (1980). Modified starch for conservation purposes. Stud. Conserv., 25(2), 64–70, https://doi.org/10.1007/s00107-009-0379-0.
21. Imam, S. H. et al. (1999). Wood adhesive from crosslinked poly (vinyl alcohol) and partially gelatinized starch: Preparation and properties. Starch-Starke, 51(6), 225–229.
22. Chiu, C. W. & Solarek, D. (2009). Modification of starches, 3rd ed. New York: Elsevier.
23. Sigma-Aldrich. (2015). Starch from corn: Practical grade. Retrieved 30 January 2018 from https://www.sigmaaldrich.com/catalog/product/sial/s4180?lang=en®ion=MY.
24. Marashdeh, M. W. et al. (2011). Effect of particle size on the characterization of binderless particleboard made from Rhizophora spp. mangrove wood for use as phantom material. Biores. Technol., 6, 4028–4044.
25. Duvauchelle, P. P. et al. (1999). Effective atomic number in the Rayleigh to Compton scattering ratio. Nucl. Instrum. Meth. B, 155, 221–228.
26. Jerrold, T. B. et al. (2002). The essential physics of medical imaging, 2nd ed. Philadelphia: Lippincott Williams and Wilkins.
27. CIRS. (2012). Electron density phantom, model 062M. Retrieved 30 July 2015 from http://cirsinc.com/product/all/24/electron-density-phantom/.

Journal of Physical Science, Vol. 30(3), 131–155, 2019 155
28. Saito, M. (2012). Potential of dual-energy subtraction for converting CT numbers to electron density based on a single linear relationship. Med. Phys., 39, 2021–2030, https://doi.org/10.1118/1.3694111.
29. Kurudirek, M. (2013). Water equivalent study of some phantom based on effective photon energy, effective atomic numbers and electron densities for clinical MV X-ray and Co-60 γ-ray beams. Nucl. Instrum. Meth., 701, 268–272, http://doi.org/10.1016/j.nima.2012.10.076.
30. Schneider, U., Pedroni, E. & Lomax, A. (1996). The calibration of CT Hounsfield units for radiotherapy treatment planning. Phys. Med. Biol., 41, 111–24, https://doi.org/10.1088/0031-9155/41/1/009/meta.
31. AAPM-21. (1983). Protocol for the determination of absorbed dose from high energy photon and electron beams: Task group 21. Med. Phys., 10, 741–771.
32. Sichel, J. Y. et al. (2000). Artifactual thickening of the sinus walls on computed tomography: A phantom model and clinical study. Ann. Otol. Rhinol. Laryngol., 109, 859–862.
33. Tanaka, A. et al. (2011). X-ray computerized tomography analysis and density estimation using a sediment core from the Challenger Mound area in the Porcupine Seabight, off Western Ireland. Earth Plan. Space, 63(2), 103–110, https://10.5047/eps.2010.12.006.
34. Fromm, J. H. et al. (2001). Xylem water content and wood density in spruce and oak trees detected by high-resolution computed tomography images. Plant Physiol., 127(2), 416–425, https://doi.org/10.1104/pp.010194.