Fabric Vision Technology - IBM Redbooks · 3 Product overview Fabric Vision technology with IO...
14
Product Guide Front cover Fabric Vision Technology Megan Gilge
Transcript of Fabric Vision Technology - IBM Redbooks · 3 Product overview Fabric Vision technology with IO...

Product Guide
Front cover
Fabric Vision Technology
Megan Gilge


Fabric Vision TechnologyThis IBM® Redbooks® product guide describes Fabric Vision technology.
The use of virtualization, flash storage, and automation tools has allowed applications and services to be deployed faster while shattering performance barriers. The unprecedented number of application and service interactions has also increased the complexity, risk, and instability of mission-critical operations. As a result, IT organizations need flexible storage networks that can adapt to dynamic environments and performance requirements for high-density virtualization, flash storage, and cloud infrastructures.
To achieve Service Level Agreement (SLA) objectives, IT administrators also need new tools that can help ensure non-stop operations, quickly identify potential points of congestion, and maximize application performance, while simplifying administration.
Fabric Vision technology for IBM b-type Gen 5 and 6 Fibre Channel (FC) products includes the IO Insight and VM Insight features that provide insight and visibility across the storage network along with powerful, integrated monitoring, management, and diagnostic tools that help organizations to simplify monitoring, increase operational stability, and reduce costs.
Did you know?
Fabric Vision technology delivers the following benefits:
� Provides powerful, integrated monitoring, management, and diagnostic tools to simplify administration, increase operational stability, and reduce costs
� Deploys 20 years of storage networking best practices in one click with predefined, threshold-based rules, actions, and policies
� Automatically detects degraded application or device performance with IO Insight, the industry’s first integrated device latency and input/output operations per second (IOPS) performance monitor
� Eliminates nearly 50 percent of maintenance costs and common network problems with proactive monitoring and advanced diagnostic tools
� Helps save up to millions of dollars on capital expenditure (CapEx) costs by eliminating the need for expensive third-party tools through integrated monitoring and diagnostics
Product highlights
Fabric Vision technology with IO Insight and VM Insight provides outstanding insight and visibility across the storage network with powerful, integrated monitoring, management, and diagnostic tools.
© Copyright IBM Corp. 2016. All rights reserved. ibm.com/redbooks 1

Simplify monitoring
Fabric Vision simplifies the monitoring of storage networking with integrated network sensors with Fabric OS features that provide the following capabilities:
� Deploy more than 20 years of storage networking best practices in predefined, threshold-based rules, actions, and policies with a single click
� Leverage non-intrusive, real-time monitoring and alerting while gaining visibility into storage IO health, performance, and latency metrics
� Leverage integrated network sensors to gain visibility into VM and storage IO health and performance metrics to maintain SLA compliance
� Gain comprehensive visibility into network health, performance, latency, and congestion issues in the fabric through browser-accessible dashboards with drill-down capabilities
Increase operational stability
The Fabric Vision tools increase operational stability of the storage network in the following ways:
� Avoid up to 50 percent of common network problems with proactive monitoring and advanced diagnostic tools that address problems before they impact operations
� Identify hot spots and automatically mitigate network problems (before they impact application performance) through intuitive reporting, trend analysis, and integrated actions
� Monitor and set baselines on IO latency for each VM, and identify performance anomalies to facilitate fault isolation and troubleshooting
� Pinpoint resource contention, congestion, and errant devices to resolve application performance problems
Help reduce costs
Fabric Vision reduces the cost of operating the storage network with the following savings:
� Eliminate nearly 50 percent of maintenance costs through automated testing and diagnostic tools that validate the health, reliability, and performance of the network prior to deployment
� Significantly reduce CapEx costs by eliminating the need for expensive third-party tools through integrated network sensors, monitoring, and diagnostics
� Leverage specialized tools for pretesting and validating IT infrastructure to accelerate deployment, simplify support, and reduce operational costs
� Tune device configurations with integrated I/O metrics to optimize storage performance and increase return on investment (ROI)
Gen 5 and Gen 6 Fibre Channel
Gen 5 and Gen 6 Fibre Channel create purpose-built network infrastructure for mission-critical storage, delivering breakthrough performance, increased business agility, and operational stability. Fabric Vision technology with IO Insight and VM Insight delivers a breakthrough solution that helps accelerate data access, adapt to evolving requirements, and drive always-on business operations for hyper-scale virtualization, larger cloud infrastructures, and growing flash-based storage environments.
2 Fabric Vision Technology
Product overview
Fabric Vision technology with IO Insight and VM Insight provides outstanding insight and visibility across the storage network with powerful, integrated monitoring, management, and diagnostic tools.
Simplify monitoring of mission-critical applications
Organizations face a constant struggle to both manage data growth and deliver actionable intelligence from raw data, all while meeting SLAs. As a result, even well-managed IT organizations must often make difficult choices about resource allocation, weighing the benefits of focusing more resources on monitoring, for instance, and fewer on planning or optimizing. With Fabric Vision technology, organizations can achieve unprecedented insight and visibility across the storage network through critical monitoring and diagnostic capabilities.
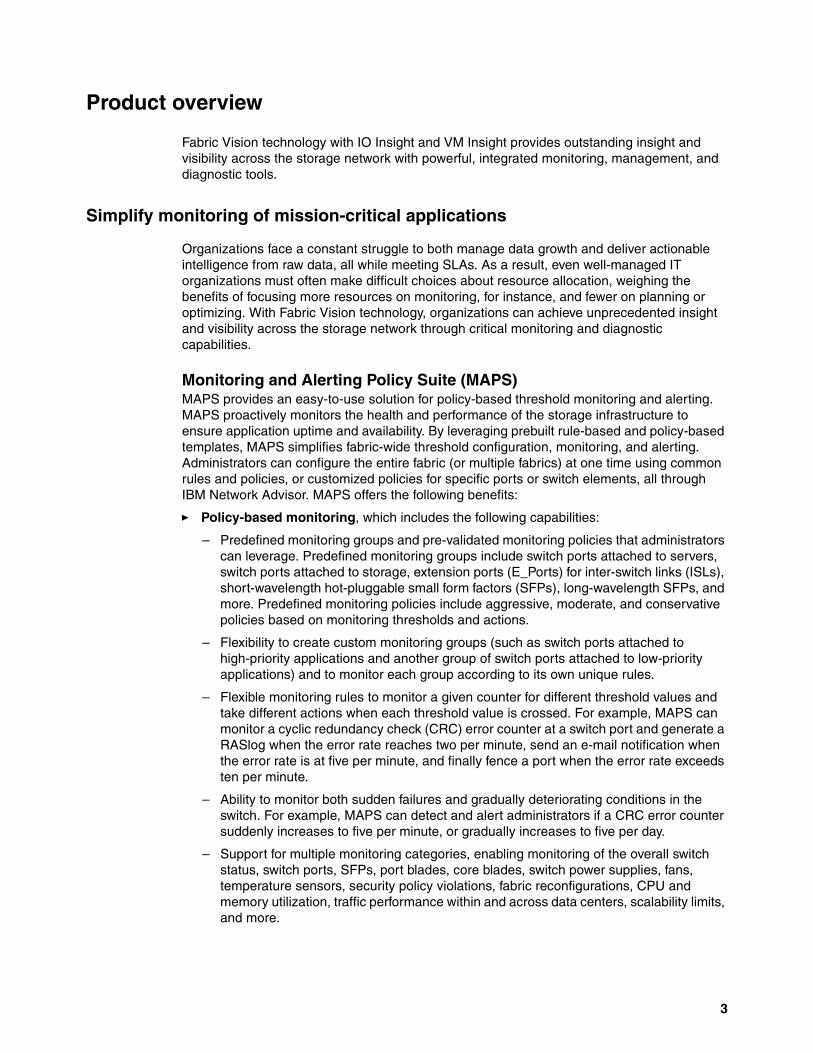
Monitoring and Alerting Policy Suite (MAPS)MAPS provides an easy-to-use solution for policy-based threshold monitoring and alerting. MAPS proactively monitors the health and performance of the storage infrastructure to ensure application uptime and availability. By leveraging prebuilt rule-based and policy-based templates, MAPS simplifies fabric-wide threshold configuration, monitoring, and alerting. Administrators can configure the entire fabric (or multiple fabrics) at one time using common rules and policies, or customized policies for specific ports or switch elements, all through IBM Network Advisor. MAPS offers the following benefits:
� Policy-based monitoring, which includes the following capabilities:
– Predefined monitoring groups and pre-validated monitoring policies that administrators can leverage. Predefined monitoring groups include switch ports attached to servers, switch ports attached to storage, extension ports (E_Ports) for inter-switch links (ISLs), short-wavelength hot-pluggable small form factors (SFPs), long-wavelength SFPs, and more. Predefined monitoring policies include aggressive, moderate, and conservative policies based on monitoring thresholds and actions.
– Flexibility to create custom monitoring groups (such as switch ports attached to high-priority applications and another group of switch ports attached to low-priority applications) and to monitor each group according to its own unique rules.
– Flexible monitoring rules to monitor a given counter for different threshold values and take different actions when each threshold value is crossed. For example, MAPS can monitor a cyclic redundancy check (CRC) error counter at a switch port and generate a RASlog when the error rate reaches two per minute, send an e-mail notification when the error rate is at five per minute, and finally fence a port when the error rate exceeds ten per minute.
– Ability to monitor both sudden failures and gradually deteriorating conditions in the switch. For example, MAPS can detect and alert administrators if a CRC error counter suddenly increases to five per minute, or gradually increases to five per day.
– Support for multiple monitoring categories, enabling monitoring of the overall switch status, switch ports, SFPs, port blades, core blades, switch power supplies, fans, temperature sensors, security policy violations, fabric reconfigurations, CPU and memory utilization, traffic performance within and across data centers, scalability limits, and more.
3

– Support for multiple alerting mechanisms (RASlogs, Simple Network Management Protocol (SNMP) traps, e-mail notifications) and actions, such as port decommissioning and port fencing, port toggling, and slow drain device quarantine, when errors exceed the specified threshold. Administrators can tailor the frequency of alert messages to reduce duplicate notifications.
– Ability to apply different notifications and actions based on the frequency of a violation with rule-on-rule monitoring. Administrators can define different actions as operational responses if a monitoring rule has been repeatedly violated.
� Dashboards provide at-a-glance views of switch status and various conditions that are contributing to performance issues, enabling administrators to get instant visibility into any hot spots at a switch level, and to take corrective actions. The following dashboard views are included:
– Overall status of the switch health and the status of each monitoring category, including any out-of-range conditions and the rules that were triggered.
– Historical information on the switch status for up to the last seven days; automatically provides raw counter information for a variety of error counters. This integrated dashboard view also provides a single collection point for all dashboard data from a fabric for a specific application traffic flow.
� IO Insight proactively monitors IO performance and behavior through integrated network sensors to gain deep insight into problems, and to ensure service levels. This capability non-disruptively and non-intrusively gathers IO statistics from any device port on a Gen 6 Fibre Channel platform, then applies this information within an intuitive, policy-based monitoring and alerting suite to configure thresholds and alarms.
Integrated application-level and device-level IO latency and IOPS monitoring provides the ability to baseline application performance and detect degraded performance. This enables administrators to proactively control performance and availability to ensure operational stability. This functionality includes the following key capabilities:
– Monitoring individual host or storage devices to gain deeper insight into the performance of the network to maintain SLA compliance.
– Obtaining total IOs, first response time maximum and average (max/average), IO latency (Exchange Completion Time, or ECT) max/average, and outstanding IOs max/average performance metrics for a specific host or storage device in order to diagnose IO operational issues.
– Enabling tuning of device configurations with integrated IO metrics to optimize storage performance.
� VM Insight seamlessly monitors VM performance throughout a storage fabric with standards-based, end-to-end VM tagging. Administrators can quickly determine the source of VM/application performance anomalies, as well as provision and fine-tune the infrastructure based on VM/application requirements to meet service-level objectives.
Dramatically streamline SAN administration
IT organizations with large, complex, or highly virtualized data center environments often require advanced tools to help them more effectively manage their storage infrastructures. Developed specifically with these IT organizations in mind, Fabric Vision technology also includes several breakthrough management capabilities that dramatically simplify day-to-day storage area network (SAN) administration, and provide unprecedented visibility across the storage network.
4 Fabric Vision Technology

These management capabilities include the following functions:
� Configuration and Operational Monitoring Policy Automation Services Suite (COMPASS) simplifies deployment, safeguards consistency, and increases operational efficiencies of larger environments by automating the switch and fabric configuration services. Administrators can configure a template, or adopt an existing configuration as a template, and then seamlessly deploy the configuration across the fabric. In addition, they can ensure that configuration settings do not drift over time with COMPASS configuration and policy violation monitoring within IBM Network Advisor dashboards.
� Fabric Performance Impact (FPI) Monitoring uses predefined MAPS policies to automatically detect and alert administrators to different latency severity levels, and to identify specific slow drain devices that could impact overall network performance. This feature identifies various latency severity levels, pinpointing exactly which devices are causing or are impacted by a bottle-necked port, and then automatically quarantines the slow drain devices to prevent buffer credit “starvation” and avoid degrading the performance of other traffic flows.
Increase storage fabric resiliency
Fabric Vision technology includes several critical troubleshooting and diagnostic capabilities that help increase storage fabric resiliency, reduce downtime, and optimize application performance:
� Flow Vision: Enables administrators to identify, monitor, and analyze specific application flows in order to simplify troubleshooting, maximize performance, avoid congestion, and optimize resources. Flow Vision includes the following components:
– Flow Monitor: Provides comprehensive visibility into traffic flows within the fabric, including the ability to automatically learn flows and non-disruptively monitor flow performance. Administrators can monitor all flows from a specific host to multiple storage targets/logical unit numbers (LUNs), from multiple hosts to a specific target/LUN, or across a specific inter-switch link (ISL) or inter-fabric link (IFL).
Additionally, they can perform LUN-level monitoring of specific frame types to identify resource contention or congestion that is impacting application performance. Flow Monitor provides the following capabilities:
• Comprehensive visibility into application flows in the fabric, including the ability to learn (discover) flows automatically.
• Monitoring of application flows within a fabric at a given port.
• Predefined flows to discover all application flows going through all device ports on a switch, for network provisioning and planning.
• Statistics associated with the specified flows to gain insights into application performance, such as transmit frame count, receive frame count, transmit throughput, receive throughput, SCSI Read frame count, SCSI Write frame count, number of SCSI Reads and Writes per second (IOPS), and more.
• IO Insight is a capability unique to b-type Gen 6 devices, and monitors device ports. It captures first IO response time, IO completion time, number of pending IOs, and IOPS metrics for a flow from a specific host to a target or LUN.
• VM Insight to monitor per Virtual Machine (VM) the network transmit and receive throughput metrics and IO Insight metrics for a VM flow.
5

• Monitoring of various frame types at a switch port to provide deeper insight into the storage IO access pattern at the LUN level, reservation conflicts, and IO errors. Examples of frame types include SCSI Read, SCSI Write, SCSI Reserve, Abort Sequence (ABTS), and Basic Accept (BA_ACC).
• Integration with MAPS to enable threshold-based monitoring and alerting of flows.
– Flow Learning: Enables administrators to non-disruptively discover all flows that go to or come from a specific host port or a storage port, or traverse ISLs/IFLs or FCIP tunnels to monitor fabric-wide application performance. In addition, administrators can discover top and bottom bandwidth-consuming devices and manage capacity planning.
– Flow Generator: A built-in traffic generator for pretesting and validating data center infrastructure (including route verification and integrity of optics, cables, ports, back-end connections, and ISLs) for robustness before deploying applications. Flow Generator enables users to peform the following tasks:
• Configure a Gen 5 and Gen 6 Fibre Channel-capable port as a simulated device that can transmit frames at a 16 gigabits (Gbps) or 32 Gbps line rate.
• Emulate a Gen 5 and Gen 6 Fibre Channel SAN without actually having any hosts or targets or SAN testers, and pretest the entire SAN fabric.
– Flow Mirroring: Enables administrators to non-disruptively create copies of specific application and data flows or frame types that can be captured for in-depth analysis.
� ClearLink Diagnostics helps ensure optical and signal integrity for Gen 5 and Gen 6 Fibre Channel ports, optics, and cables, simplifying the deployment and support of high-performance fabrics.
� Forward Error Correction (FEC) enables recovery from bit errors in Gen 5 and Gen 6 Fibre Channel links, enhancing transmission reliability and performance.
� Credit Loss Recovery automatically detects and recovers buffer credit loss, providing protection against performance degradation and enhancing application availability.
Simplified management and reporting
IBM Network Advisor storage networking management software simplifies Gen 6 Fibre Channel management and helps organizations dramatically reduce deployment and configuration times by enabling fabrics, switches, and ports to be managed as groups. Customizable dashboards graphically display performance and health indicators out of the box, including all data captured using Fabric Vision technology.
To accelerate troubleshooting, administrators can use dashboard playback to quickly review past events and identify problems in the fabric. Dashboards and reports also can be configured to show only the most relevant data, enabling administrators to more efficiently prioritize their actions and maintain network performance.
Superior investment protection
In Fabric OS (FOS) v7.2.0 Fabric Vision consolidated, enhanced, and replaced two features called Advanced Performance Monitoring and Fabric Watch. Organizations that have both of these features installed will automatically receive Fabric Vision technology capabilities when running Fabric OS (FOS) 7.2.0 or later, without having the Fabric Vision technology license installed. Organizations that have either Advanced Performance Monitoring or Fabric Watch (but not both) installed, and want Fabric Vision technology capabilities (including MAPS and Flow Vision), simply need to purchase and install the missing Advanced Performance Monitoring or Fabric Watch license.
6 Fabric Vision Technology

Related information
For more information, see the following documents:
IBM Redbooks:
� Fabric Vision Technology product page
http://www.ibm.com/systems/storage/san/b-type/fv/
� IBM Network Advisor, TIPS1124
https://www.ibm.com/common/ssi/cgi-bin/ssialias?htmlfid=TS012443USEN&
� IBM Storage Networking website
https://www.ibm.com/storage/san
� IBM Offering Information page (announcement letters and sales manuals)
http://www.ibm.com/common/ssi/index.wss?request_locale=en
On this page, enter Fabric Vision technology, select the information type, and then click Search. On the next page, narrow your search results by geography and language.
Authors
This Product Guide was produced by a team of specialists from around the world working at the International Technical Support Organization (ITSO), Poughkeepsie Center.
Megan Gilge is a Project Leader in the IBM International Technical Support Organization. Before joining the ITSO four years ago, she was an Information Developer in the IBM Semiconductor Solutions and IBM System i® areas.
\Now you can become a published author, too
Here's an opportunity to spotlight your skills, grow your career, and become a published author, all at the same time. Join an ITSO residency project and help write a book in your area of expertise, while honing your experience using leading-edge technologies. Your efforts will help to increase product acceptance and customer satisfaction, as you expand your network of technical contacts and relationships. Residencies run two - six weeks in length, and you can participate either in person or as a remote resident working from your home base.
Learn more about the residency program, browse the residency index, and apply online at:
ibm.com/redbooks/residencies.html
Stay connected to IBM Redbooks
� Find us on Facebook:
http://www.facebook.com/IBMRedbooks
� Follow us on Twitter:
http://twitter.com/ibmredbooks
7

� Look for us on LinkedIn:
http://www.linkedin.com/groups?home=&gid=2130806
� Explore new Redbooks publications, residencies, and workshops with the IBM Redbooks weekly newsletter:
https://www.redbooks.ibm.com/Redbooks.nsf/subscribe?OpenForm
� Stay current on recent Redbooks publications with RSS Feeds:
http://www.redbooks.ibm.com/rss.html
8 Fabric Vision Technology

Notices
This information was developed for products and services offered in the US. This material might be available from IBM in other languages. However, you may be required to own a copy of the product or product version in that language in order to access it.
IBM may not offer the products, services, or features discussed in this document in other countries. Consult your local IBM representative for information on the products and services currently available in your area. Any reference to an IBM product, program, or service is not intended to state or imply that only that IBM product, program, or service may be used. Any functionally equivalent product, program, or service that does not infringe any IBM intellectual property right may be used instead. However, it is the user’s responsibility to evaluate and verify the operation of any non-IBM product, program, or service.
IBM may have patents or pending patent applications covering subject matter described in this document. The furnishing of this document does not grant you any license to these patents. You can send license inquiries, in writing, to:IBM Director of Licensing, IBM Corporation, North Castle Drive, MD-NC119, Armonk, NY 10504-1785, US
INTERNATIONAL BUSINESS MACHINES CORPORATION PROVIDES THIS PUBLICATION “AS IS” WITHOUT WARRANTY OF ANY KIND, EITHER EXPRESS OR IMPLIED, INCLUDING, BUT NOT LIMITED TO, THE IMPLIED WARRANTIES OF NON-INFRINGEMENT, MERCHANTABILITY OR FITNESS FOR A PARTICULAR PURPOSE. Some jurisdictions do not allow disclaimer of express or implied warranties in certain transactions, therefore, this statement may not apply to you.
This information could include technical inaccuracies or typographical errors. Changes are periodically made to the information herein; these changes will be incorporated in new editions of the publication. IBM may make improvements and/or changes in the product(s) and/or the program(s) described in this publication at any time without notice.
Any references in this information to non-IBM websites are provided for convenience only and do not in any manner serve as an endorsement of those websites. The materials at those websites are not part of the materials for this IBM product and use of those websites is at your own risk.
IBM may use or distribute any of the information you provide in any way it believes appropriate without incurring any obligation to you.
The performance data and client examples cited are presented for illustrative purposes only. Actual performance results may vary depending on specific configurations and operating conditions.
Information concerning non-IBM products was obtained from the suppliers of those products, their published announcements or other publicly available sources. IBM has not tested those products and cannot confirm the accuracy of performance, compatibility or any other claims related to non-IBM products. Questions on the capabilities of non-IBM products should be addressed to the suppliers of those products.
Statements regarding IBM’s future direction or intent are subject to change or withdrawal without notice, and represent goals and objectives only.
This information contains examples of data and reports used in daily business operations. To illustrate them as completely as possible, the examples include the names of individuals, companies, brands, and products. All of these names are fictitious and any similarity to actual people or business enterprises is entirely coincidental.
COPYRIGHT LICENSE:
This information contains sample application programs in source language, which illustrate programming techniques on various operating platforms. You may copy, modify, and distribute these sample programs in any form without payment to IBM, for the purposes of developing, using, marketing or distributing application programs conforming to the application programming interface for the operating platform for which the sample programs are written. These examples have not been thoroughly tested under all conditions. IBM, therefore, cannot guarantee or imply reliability, serviceability, or function of these programs. The sample programs are provided “AS IS”, without warranty of any kind. IBM shall not be liable for any damages arising out of your use of the sample programs.
© Copyright IBM Corp. 2016. All rights reserved. 9

Trademarks
IBM, the IBM logo, and ibm.com are trademarks or registered trademarks of International Business Machines Corporation, registered in many jurisdictions worldwide. Other product and service names might be trademarks of IBM or other companies. A current list of IBM trademarks is available on the web at “Copyright and trademark information” at http://www.ibm.com/legal/copytrade.shtml
The following terms are trademarks or registered trademarks of International Business Machines Corporation, and might also be trademarks or registered trademarks in other countries.
IBM®Redbooks®
Redbooks (logo) ®System i®
The following terms are trademarks of other companies:
Other company, product, or service names may be trademarks or service marks of others.
10 Fabric Vision Technology


ibm.com/redbooks
Printed in U.S.A.
Back cover
ISBN 0738455652
REDP-5400-00
®


![INDEX [fluxconsole.com] Brochure... · 2. index. our story our vision. safety safety affiliates . fabric shelter 20’ w fabric shelter 30’ w . fabric shelter 40’ w end panels](https://static.fdocuments.net/doc/165x107/5f75bdc2db7d4171a8637625/index-brochure-2-index-our-story-our-vision-safety-safety-affiliates.jpg)