Fabric effect on hydraulic conductivity of kaolin under ... · suspension in contact with a wide...
12
Fabric effect on hydraulic conductivity of kaolin under different chemical and biochemical conditions Zhenze Li a,n , Takeshi Katsumi b , Toru Inui b , Atsushi Takai b a Department of Civil Engineering, University of Ottawa, Canada b GSGES, Kyoto University, Japan Received 9 December 2011; received in revised form 16 May 2013; accepted 18 June 2013 Available online 21 September 2013 Abstract A reasonably less permeable compacted clay liner (CCL) is critical to the long-term safety of waste containment facilities. This study experimentally investigates a variety of factors, including salinity, pH, fluctuation in permeant, permeation duration and presence of micro- organisms, that are found to influence the hydraulic conductivity (k) of consolidated kaolin and the fabrics of suspended kaolin. Amongst these factors, a reduction in hydraulic conductivity of up to 4 orders of magnitude is obtained from the modification of the microfabrics of kaolin; a reduction of 2 orders of magnitude is brought about by bioclogging; a reduction of 1 order of magnitude is related to the concentrated Ca solution ( 410 mM). The hydraulic conductivity of consolidated kaolin can obviously be changed by adjusting the fabrics of the kaolin particles, e.g., clogging the pore spaces with bioslurry, permeating them with alkaline solution, or transforming the kaolin into metakaolin. An effluent pH larger than the isoelectric point (pH IEP ) leads to a rapid reduction in k until 1 10 –11 m/s. A 3-dimensional fabric map was established for kaolin suspension in contact with a wide range of Ca concentrations and pH levels. The fabrics of kaolin suspension are predominated by a salt concentration (C 42.0 mM) and a pH solution (C o2.0 mM), respectively. & 2013 The Japanese Geotechnical Society. Production and hosting by Elsevier B.V. All rights reserved. Keywords: Kaolin; Hydraulic conductivity; Fabrics; CCL; Bioclogging 1. Introduction Landfills are an effective way of disposing of various solid wastes (Rowe, 2005). And a well-performing liner system is fundamental to the long-term safe containment of these hazardous contaminants. Compacted clay liners (CCLs) are usually designed to be located beneath the geomembranes and geosynthetic clay liners (GCLs) as a final barrier against the possible leakage of landfill leachate (Komine and Watanabe, 2010). Although the thickness of CCLs varies with the different legislative standards, it is generally required to be around 1 m. Different from GCLs, that specifically use smectite, a spectrum of clays has been successfully implemented in CCLs according to a field investigation (Benson et al., 1999). The failure of GCLs, in terms of thermal desiccation, cracks and mineral shrinkage, has been widely observed (Southen and Rowe, 2005). A thick layer of CCL can signi ficantly improve the performance of the barrier system by reducing the risk of toxicant leakage. The hydraulic conductivity (k) of a CCL is an important factor for the assessment of its applicability and durability, which has been discussed in numerous studies that have mainly focused on the clarification of possible influencing factors on the hydraulic conductivity (Barroso et al., 2006; Basheer and Najjar, 1995; Benson et al., 1999; Day and Daniel, 1985). As soil-chemical The Japanese Geotechnical Society www.sciencedirect.com journal homepage: www.elsevier.com/locate/sandf Soils and Foundations 0038-0806 & 2013 The Japanese Geotechnical Society. Production and hosting by Elsevier B.V. All rights reserved. http://dx.doi.org/10.1016/j.sandf.2013.08.006 n Corresponding author. E-mail address: [email protected] (Z. Li). Peer review under responsibility of The Japanese Geotechnical Society. Soils and Foundations 2013;53(5):680–691
Transcript of Fabric effect on hydraulic conductivity of kaolin under ... · suspension in contact with a wide...

The Japanese Geotechnical Society
Soils and Foundations
Soils and Foundations 2013;53(5):680–691
0038-0http://d
nCorE-mPeer
806 & 201x.doi.org/1
respondinail addrereview un
www.sciencedirect.comjournal homepage: www.elsevier.com/locate/sandf
Fabric effect on hydraulic conductivity of kaolin under different chemicaland biochemical conditions
Zhenze Lia,n, Takeshi Katsumib, Toru Inuib, Atsushi Takaib
aDepartment of Civil Engineering, University of Ottawa, CanadabGSGES, Kyoto University, Japan
Received 9 December 2011; received in revised form 16 May 2013; accepted 18 June 2013Available online 21 September 2013
Abstract
A reasonably less permeable compacted clay liner (CCL) is critical to the long-term safety of waste containment facilities. This studyexperimentally investigates a variety of factors, including salinity, pH, fluctuation in permeant, permeation duration and presence of micro-organisms, that are found to influence the hydraulic conductivity (k) of consolidated kaolin and the fabrics of suspended kaolin. Amongst thesefactors, a reduction in hydraulic conductivity of up to 4 orders of magnitude is obtained from the modification of the microfabrics of kaolin; areduction of 2 orders of magnitude is brought about by bioclogging; a reduction of 1 order of magnitude is related to the concentrated Ca solution(410 mM). The hydraulic conductivity of consolidated kaolin can obviously be changed by adjusting the fabrics of the kaolin particles, e.g.,clogging the pore spaces with bioslurry, permeating them with alkaline solution, or transforming the kaolin into metakaolin. An effluent pH largerthan the isoelectric point (pHIEP) leads to a rapid reduction in k until 1� 10–11 m/s. A 3-dimensional fabric map was established for kaolinsuspension in contact with a wide range of Ca concentrations and pH levels. The fabrics of kaolin suspension are predominated by a saltconcentration (C42.0 mM) and a pH solution (Co2.0 mM), respectively.& 2013 The Japanese Geotechnical Society. Production and hosting by Elsevier B.V. All rights reserved.
Keywords: Kaolin; Hydraulic conductivity; Fabrics; CCL; Bioclogging
1. Introduction
Landfills are an effective way of disposing of various solidwastes (Rowe, 2005). And a well-performing liner system isfundamental to the long-term safe containment of these hazardouscontaminants. Compacted clay liners (CCLs) are usually designedto be located beneath the geomembranes and geosynthetic clayliners (GCLs) as a final barrier against the possible leakage of
3 The Japanese Geotechnical Society. Production and hosting by0.1016/j.sandf.2013.08.006
g author.ss: [email protected] (Z. Li).der responsibility of The Japanese Geotechnical Society.
landfill leachate (Komine and Watanabe, 2010). Although thethickness of CCLs varies with the different legislative standards, itis generally required to be around 1 m. Different from GCLs, thatspecifically use smectite, a spectrum of clays has been successfullyimplemented in CCLs according to a field investigation (Bensonet al., 1999). The failure of GCLs, in terms of thermal desiccation,cracks and mineral shrinkage, has been widely observed (Southenand Rowe, 2005). A thick layer of CCL can significantly improvethe performance of the barrier system by reducing the risk oftoxicant leakage.The hydraulic conductivity (k) of a CCL is an important factor
for the assessment of its applicability and durability, which hasbeen discussed in numerous studies that have mainly focused onthe clarification of possible influencing factors on the hydraulicconductivity (Barroso et al., 2006; Basheer and Najjar, 1995;Benson et al., 1999; Day and Daniel, 1985). As soil-chemical
Elsevier B.V. All rights reserved.

Table 1Fundamental parameters of kaolin sample.
Element Amount Unit
Kaolin Metakaolin
SiO2 79.5 – %Al2O3 13.6 – %TiO2 3.1 – %SO3 1.2 – %K2O 0.9 – %Fe2O3 0.8 – %Others 0.8 – %pHna 5.3 4.1EC 10.1 14.1 mS/mGs 2.2 –
Loss on ignition 12.3 – %Mass percentage % Diameter Unit97.1 12.0 – μm2.9 0.7 – μmAtterberg limitPlastic limit 33.7 32.8 %Liquid limit 51.2 52.5 %Plastic index 17.5 19.7 %
Z. Li et al. / Soils and Foundations 53 (2013) 680–691 681
interactions may be active for clays, hydraulic conductivity testsshould be performed for a sufficient length of time in order toallow for ion exchanges (Shackelford et al., 2000). However, fewstudies have investigated the long-term performance of thehydraulic conductivity of CCLs.
Kaolin is a clay mineral that is stable in a wide range of solutionproperties. Kaolin is also a matured commercial product (Tanget al., 2009). The exploration of a new field of applications forkaolin might open opportunities for this whole industry. Kaolin hasbeen proposed and tested for application in CCLs (Altabbaa andWood, 1987; Boutin et al., 2010; Wang and Siu, 2006). Thephysical properties of kaolin, e.g., swelling and shrinkage, arenegligible in normal situations. However, the microfabric ofkaolinite suspension is reportedly influenced by the pore fluidcomposition (Chen et al., 2000). The fabric of compacted clay wasfound to affect its hydraulic conductivity (Acar and Olivieri, 1989)as well as its mechanical behavior (Anantanasakul et al., 2012).This provides an opportunity to control the hydraulic conductivitiesof CCLs by changing the microfabrics, which can be achieved viaan adjustment to the solution properties. Several works haveobserved the dependence of the fabrics of clay minerals on bothsalinity (Chen and Anandarajah, 1998) and pH (Palomino andSantamarina, 2005). The fabric orientation of sand was alsoobserved to determine the anisotropic permeability (Jeng et al.,2008). It remains unclear, however, just how these factors functiontogether to influence the permeability.
This aim of this study is to investigate the key factors thatgovern the hydraulic conductivity of kaolin. Soil treatment (thecalcination of kaolin and the activation with alkaline) andsolution properties (e.g., chemical concentration, pH, fluctua-tion and bioclogging) were experimentally evaluated. Theelectrical conductivity and pH of the outflow were analyzedto clarify the mechanism of the chemical–clay interaction. Soilfabrics were also studied to reveal the combined influences ofpH and ionic strength. Good agreements between the changesin fabric and the shifts in hydraulic conductivity of the kaolinsamples are reported for the first time in this study. Thesepositive results could mean our conclusions would be imple-mentable in the design and construction of CCLs.
2. Experiment and methods
2.1. Characterization of soil sample
Kaolin was purchased from a commercial clay supplier in Japan.The mineral and elemental constituents of the kaolin sample weredetermined by XRD and EDX, respectively, via a semi-quantitative analysis (Energy Dispersive X-Ray FluorescenceSpectrometer, Shimadzu, Japan). The mineral consists of kaolinite,quartz and albite. The main elemental components are silica,aluminum and titanium oxides, as shown in Table 1. Kaolin wasfurther calcinated at 750 1C for 4 h to become metakaolin.Metakaolin could form a gel-like cementitious body underextremely alkaline conditions (Granizo et al., 2002). The optimumwater content for the compaction of kaolin was determined to be19% by the standard Proctor test. Other fundamental parametersfor kaolin and metakaolin are also listed in Table 1.
Five series of settling tests were carried out in parallel to obtainthe average settling velocity of kaolin. The settling behavior ofkaolin slurry was studied by the image analysis system shown inFig. 1(a). A web camera was used to monitor the time-dependentvariation in the height of the deposited kaolin. Photos werefrequently taken and stored in a computer. The preparation of thetest sample includes sampling 4.00 g of kaolin powder andmixing it with 50.0 mL of a chemical solution, thoroughly stirred,and allowed to soak overnight before the settling test was started.The results are shown in Table 1. The majority of kaolin is sizedat 12.0 μm, with trace amounts of particles sized at 0.7 μm. Thisagrees well with one previous work (Michaels and Bolger, 1962),but is a bit larger than other similar studies (Palomino andSantamarina, 2005; Wang and Siu, 2006).
2.2. Permeation test for kaolin
The soil specimen was prepared by consolidating the kaolininto an oedometer cell. Moist kaolin with a water content of19% was weighed (equivalent dry weight of 50.0 g), trans-ferred into the consolidation ring and compressed under160 kPa for days until the differential strain was less than0.01 mm/day. Afterwards, the specimen was vacuum saturatedovernight and extruded out for subsequent processing.A flexible-wall permeameter (Fig. 1(b)) was applied to testthe hydraulic conductivity. Geotextile and filter paper (1/1,with filter paper placed in contact with the soil) were installedat the two ends of the soil specimen as a drainage layer. Theconfining pressure was maintained at 40 kPa with a constantwater head of 20 kPa for permeation. All the connections wereestablished using TYGON tubes (4� 3.5 mm2). Caution wastaken to remove the bubbles from the connection tubes andspaces between the sample and the support. The details foreach test case are shown in Table 2.

Fig. 1. Conceptual diagraph of (a) image analysis system for colloidal settling test and (b) flexible-wall permeameter (Katsumi et al., 2008).
Table 2Test conditions for each permeation-experiment case.
Case no Clay Additive (mM NaOH/g kaolin) Initial permeant liquid Consolidation period (day) Permeant
1 Kaolin – Distilled water (DW) – 1.0 M Ca2 Kaolin – DW – 0.1 M Ca3 Kaolin – DW – 20 mM Ca4 Kaolin – DW – 10 mM Ca5 Kaolin – DW – 5 mM Ca6 Kaolin – DW – 1.0 mM Ca7 Kaolin – DW – 8.9 mM Fe8 Kaolin – 6.3 mM Ca – DW9 Kaolin pH 1.0 – 4 DW10 Kaolin pH 7.0 – 4 DW11 Kaolin pH 12.0 – 4 DW12 Kaolin NaOH 1.0 – 4 DW13 Kaolin NaOH 0.2 – 4 DW14 Kaolin NaOH 0.04 – 4 DW15 Kaolin NaOH 0.02 – 4 DW16 Kaolin – – 4 DW17 Metakaolin NaOH 10.0 – 4a DW18 Metakaolin NaOH 10.0 – 10a DW19 Kaolin – pH 11.5 – DW20 Kaolin – Bioslurry – DW21 Kaolin – Bioslurry – 5 mM Ca22 Kaolin – Bioslurry – 20 mM Ca
aThis is also the curing date for metakaolin to react sufficiently with alkaline.
Z. Li et al. / Soils and Foundations 53 (2013) 680–691682
The soil specimens were first permeated with distilled water for3–5 days in order to flush out the dissolvable salts contained in thekaolin. Afterwards, CaCl2 solutions in various concentrations(1.0 mM, 5.0 mM, 10.0 mM, 20.0 mM, 0.1 M and 1.0 M) werepermeated through the kaolin specimens in parallel. The pH andelectrical conductivity (EC) of the effluent were measured atregular intervals. The permeation continued until the EC and thepH of the effluent became stabilized in order to avoid anunconservatively low prediction for the hydraulic conductivities(Shackelford et al., 2000).
The influence of the fluctuation in permeant property onk (case # 8) was examined by fluctuating the Ca concentration(0–6.3 mM) and the pH (7.0–11.5). The property of the permeantwas adjusted by replacing the stock solution with a fresh liquidthat has a required salt concentration or pH. A gradual change inthe salt concentration was achieved by injecting liquid with adifferent salt concentration into the source solution tank using aperistaltic pump. The permeation was temporarily paused to
replace the source solution with a liquid that has a slightlyreduced chemical concentration, and then restarted. This processwas repeated three times. Liquids were sampled at both the inletand the outlet of the test chamber for chemical analysis andelectrical conductivity (EC).Three cases (#9–11) tested the influence of the solution's pH on
the hydraulic conductivity of the kaolin specimens. The kaolinspecimens used in these tests were obtained by soaking the kaolinin chemical solutions with 0.1 M HCl (pH¼1), pH buffers(pH¼7) and 0.01 M NaOH (pH¼12), respectively. The obtainedkaolin slurry was formed into specimens using an oedometer. Allthe samples were permeated with distilled water.
2.3. Permeation test for alkaline-treated kaolinand metakaolin
Another seven cases (#12–18) were designed to study thehydraulic behaviors of the alkaline-treated kaolin and metakaolin.
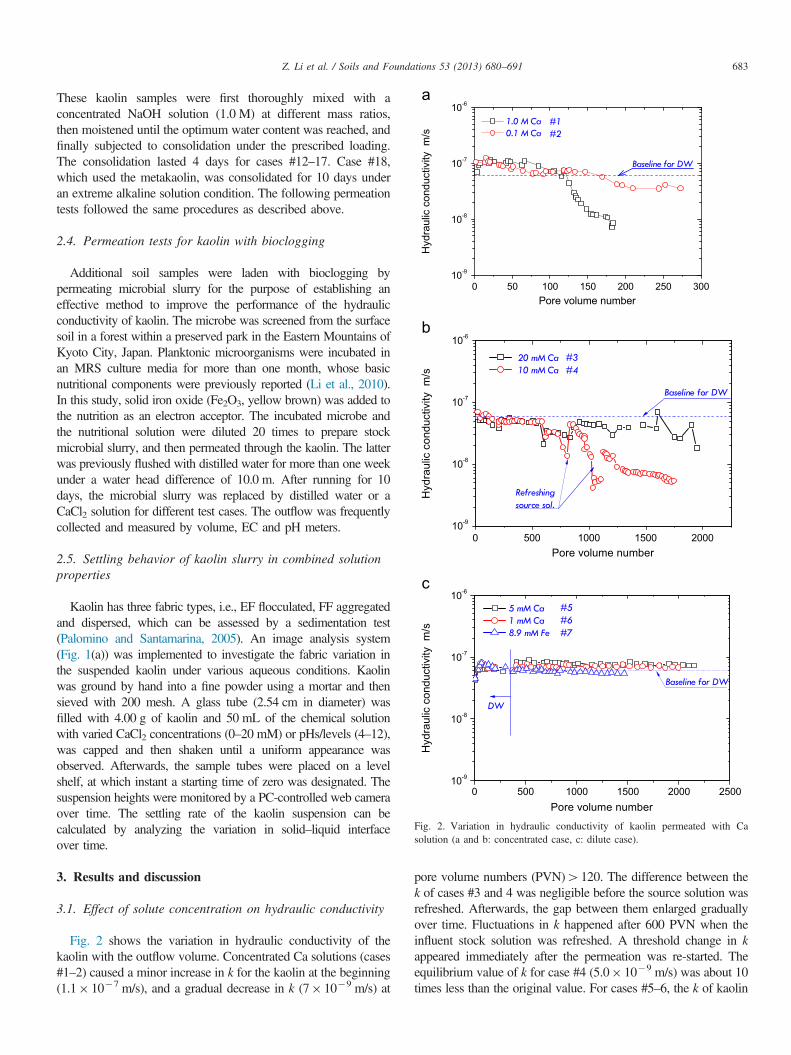
Fig. 2. Variation in hydraulic conductivity of kaolin permeated with Casolution (a and b: concentrated case, c: dilute case).
Z. Li et al. / Soils and Foundations 53 (2013) 680–691 683
These kaolin samples were first thoroughly mixed with aconcentrated NaOH solution (1.0 M) at different mass ratios,then moistened until the optimum water content was reached, andfinally subjected to consolidation under the prescribed loading.The consolidation lasted 4 days for cases #12–17. Case #18,which used the metakaolin, was consolidated for 10 days underan extreme alkaline solution condition. The following permeationtests followed the same procedures as described above.
2.4. Permeation tests for kaolin with bioclogging
Additional soil samples were laden with bioclogging bypermeating microbial slurry for the purpose of establishing aneffective method to improve the performance of the hydraulicconductivity of kaolin. The microbe was screened from the surfacesoil in a forest within a preserved park in the Eastern Mountains ofKyoto City, Japan. Planktonic microorganisms were incubated inan MRS culture media for more than one month, whose basicnutritional components were previously reported (Li et al., 2010).In this study, solid iron oxide (Fe2O3, yellow brown) was added tothe nutrition as an electron acceptor. The incubated microbe andthe nutritional solution were diluted 20 times to prepare stockmicrobial slurry, and then permeated through the kaolin. The latterwas previously flushed with distilled water for more than one weekunder a water head difference of 10.0 m. After running for 10days, the microbial slurry was replaced by distilled water or aCaCl2 solution for different test cases. The outflow was frequentlycollected and measured by volume, EC and pH meters.
2.5. Settling behavior of kaolin slurry in combined solutionproperties
Kaolin has three fabric types, i.e., EF flocculated, FF aggregatedand dispersed, which can be assessed by a sedimentation test(Palomino and Santamarina, 2005). An image analysis system(Fig. 1(a)) was implemented to investigate the fabric variation inthe suspended kaolin under various aqueous conditions. Kaolinwas ground by hand into a fine powder using a mortar and thensieved with 200 mesh. A glass tube (2.54 cm in diameter) wasfilled with 4.00 g of kaolin and 50 mL of the chemical solutionwith varied CaCl2 concentrations (0–20 mM) or pHs/levels (4–12),was capped and then shaken until a uniform appearance wasobserved. Afterwards, the sample tubes were placed on a levelshelf, at which instant a starting time of zero was designated. Thesuspension heights were monitored by a PC-controlled web cameraover time. The settling rate of the kaolin suspension can becalculated by analyzing the variation in solid–liquid interfaceover time.
3. Results and discussion
3.1. Effect of solute concentration on hydraulic conductivity
Fig. 2 shows the variation in hydraulic conductivity of thekaolin with the outflow volume. Concentrated Ca solutions (cases#1–2) caused a minor increase in k for the kaolin at the beginning(1.1� 10�7 m/s), and a gradual decrease in k (7� 10�9 m/s) at
pore volume numbers (PVN)4120. The difference between thek of cases #3 and 4 was negligible before the source solution wasrefreshed. Afterwards, the gap between them enlarged graduallyover time. Fluctuations in k happened after 600 PVN when theinfluent stock solution was refreshed. A threshold change in kappeared immediately after the permeation was re-started. Theequilibrium value of k for case #4 (5.0� 10�9 m/s) was about 10times less than the original value. For cases #5–6, the k of kaolin

Fig. 3. Variation in (a) EC and (b and c) pH of effluent with increasing porevolume number.
Z. Li et al. / Soils and Foundations 53 (2013) 680–691684
increased by 16.7% when permeated with less concentrated Casolutions (1 and 5 mM). The hydraulic conductivity was notaffected by the consistent permeation of the Ca solution or byrefreshing the source solution. The permeation of the FeSO4
solution that was employed in case #7 did not obviously affectthe k of the kaolin. Similar phenomena have been observed forthe hydraulic conductivity of GCLs, which show an increase of2.13 times when permeated with a weak electrolyte (r20.0 mMCa), but decrease to the original value (for water permeation)when permeated with a strong electrolyte (Z50.0 mM CaCl2)(Jo et al., 2005).
Fig. 3 shows the variations in EC and pH of the effluent withPVN. No obvious change in EC was observed for any of thespecimens. In pore spaces, ion exchanges are likely to happenbetween cations and hydroxyl functional groups, leading to areduced pH in equilibrium. As the surface charge of clay is nega-tive, anions are not likely to be adsorbed in the solid. Therefore, theeffluent EC, which mainly indicates the concentration of anion, isexpected to remain constant throughout the permeation process(Malusis and Shackelford, 2002). The pH of the influent containingCaCl2 is measured as 7.070.2. However, the pH of the effluentvaries from 4.0–5.0 to 6.0–7.0 within 50 PVN, indicating thegradual equilibration of the ion-exchange reaction between Ca andthe kaolin. The effluent pH decreases with an increasing Ca con-centration. The shift in pH is in good agreement with the change inhydraulic conductivity.
Fig. 4(a) compares the EC of the influent and the effluentduring the course of the permeation. The obvious discrepancy inEC implies the existence of interface polarization. Fig. 4(b)displays the molecular ratio of Ca/Cl in the effluent which wasdetermined by an EDX facility. The theoretical ratio is at 0.5,which coincides with the stock solution for CaCl2. For concen-trated Ca solutions at 1.0 and 0.1 M, the ratios are found to be0.45 and 0.3, respectively. This could be attributed to the saltrejection effect of the kaolin, which is regarded to be character-istic of microporous materials showing semi-permeable mem-brane behaviors. For compacted clays, the overlap of the surfacedouble-layer restrains the effective transport space available to thesolute migration, and thus, behaves such as to only permit part ofthe chemical species to pass through. Similar phenomena havepreviously been reported for kaolin (Hart et al., 2008; Heisteret al., 2006). Polarization could cause additional chemico-osmoticpressure across the soil–liquid interface and contribute further tothe reduction in permeant flux. This mechanism appears to be areasonable explanation for the observed permeability decline inkaolin after a certain period of permeation.
3.2. Effect of fluctuation in salt concentration on hydraulicconductivity
Under field conditions, the fluctuation in salt concentration insurface water systems is ubiquitous as the systems are stronglydependent on climatic factors. We investigated the effect of afluctuating salt concentration on the hydraulic conductivity ofkaolin. Fig. 5 plots the changes in k, EC and pH with the PVN ofthe effluent. The salt concentration varied from 0 to 6.3 mM, asreflected by the ECs in Fig. 5 (23.0 mS/m mM). The hydraulic
conductivity of the kaolin decreased from 6.0� 10�8 to2.0� 10�8 m/s, with repeated salt fluctuations; it finally fell to1.0� 10�9 m/s when permeated with distilled water. Thefluctuation in the solute concentration, for the first time, wasfound to be relevant to the change in hydraulic conductivity. Thechange in pH in the effluent was in the range of 6.5–8.6. Whenthe influent was replaced by distilled water, the pH first shifted to8.0–8.5, and then returned to neutral values near 7.0. The rapid

Fig. 4. Comparison of (a) EC in influent (EC0) and effluent (ECe) of kaolin atC0¼10 and 20 mM and (b) Ca/Cl molar ratio in effluent of Ca solution atC0¼0.1 and 1.0 M.
Fig. 5. Variation in hydraulic conductivity of kaolin permeated with Casolution (a) and EC and pH of outflow (EC0 and ECe are, respectively, influentand effluent EC) (b) with fluctuation in source concentration.
Z. Li et al. / Soils and Foundations 53 (2013) 680–691 685
decline in hydraulic conductivity happened spontaneously as thepH equilibrated.
3.3. Effect of pH on hydraulic conductivity
Fig. 6 shows the variation in hydraulic conductivity of thekaolin prepared at various pH conditions (from the slurry state).The hydraulic conductivity of the kaolin immersed at a pH of 1.0remained stable at 1� 10�7 m/s without any obvious variationover time. The other two samples that were saturated at pH levelsof 7.0 and 12.0 showed a gradual decrease in hydraulic conduc-tivities until 1� 10�9 m/s within 50 PVNs. The specimen pre-pared at a pH of 12.0 had a lower value for k than the others. ThepH of the effluent was found to finally equilibrate around the iso-electric point (pHIEP) of the kaolin. The rapid shift in pH respondedto a rapid reduction in hydraulic conductivity, indicating a possiblerelationship between these two factors.
Fig. 7 shows the results for test cases #12–18. Kaolin that istreated with a higher NaOH/soil ratio was found to have lowerinitial hydraulic conductivity. The minimum for k occurred as7.0� 10�11 m/s for kaolin with 1.0 mM NaOH/g soil, while themaximum for k was related to kaolin without alkaline treatment.
The continuous permeation of DW resulted in an equilibrium valuefor k of about 1.4� 10�10 m/s for the k1–k4 samples. The effluentpH equilibrated around 8.0, which is above the pHIEP of kaolin.The effect of curing on the hydraulic conductivity of meta-
kaolin is worth emphasizing. The MK specimen (case #17) hadan initial k of 7.0� 10�10 m/s, which was then decreased tovalues less than the equilibrium value of kaolin within 12 PVN.The sample cured for 10 days showed a stable value for k of1� 10�10 m/s. This behavior can be explained by the slowdevelopment of the Portland reaction between the metakaolin andNaOH (Granizo et al., 2002).
3.3.1. Changing pH of permeantShifting the pH of the influent could result in sharp reductions in
the hydraulic conductivity of kaolin, as shown in Fig. 8. Thisspecimen was first permeated with distilled water, and then with analkaline solution at pH0¼11.5. There was no obvious change inthe hydraulic conductivity before the pH reached the face charge(isoelectric point pHIEP¼7.2 (Palomino and Santamarina, 2005;Wang and Siu, 2006)). Even after being permeated with distilledwater, the k still kept decreasing by more than two orders ofmagnitude until very low values (5� 10�12
–3� 10�11 m/s), close

Fig. 6. Variation in hydraulic conductivity of kaolin (a) and pH of effluent (b)for samples prepared at various pH conditions and then permeated withdistilled water.
Fig. 7. Variation in (a) hydraulic conductivity of soil and (b) pH of effluentwith PVN.
Z. Li et al. / Soils and Foundations 53 (2013) 680–691686
to the reported data for geosynthetic clay liners (GCLs), werereached. The permeation of the alkaline solution resulted in acontinuous increase in EC, indicating the possible dissolution ofkaolin.
3.4. Effect of bioclogging on hydraulic conductivity of kaolinand its durability against salt solution
Fig. 9 shows the effect of bioclogging on the variation inhydraulic conductivity of the kaolin with PVN. The clogging ofthe kaolin with microbes obviously caused a decrease in itshydraulic conductivity. The k of the bioclogged kaolin appearedto decrease rapidly over time at the beginning and then to leveloff. The minimum was observed at 6� 10�10 m/s, 2 orders ofmagnitude lower than the original reading for kaolin. Prolongingthe pretreatment resulted in lower hydraulic conductivity, indicat-ing a higher degree of bioclogging in the specimen. This is in linewith the field observations: the development of bioclogging inlandfill leachate collection systems was observed after 10 years ofoperation (Rowe, 2005).
The permeation of the salt solutions, described next, led tosome deviations in the patterns of variation in k from the previous
stage. Differences in the Ca(II) concentrations did not lead tosignificant changes in k. A big shift in k occurs immediately afterswitching the permeant from bioslurry to a salt solution. Thefurther permeation of the Ca solution (5.0 and 20.0 mM) resultedin a sharp decline to the lowest value for k and a gradual increaseduring the following stages. The hydraulic conductivity becamestabilized after 200 PVN.Indications are that the bioclogged kaolin is resistant to the
influence of chemical solutions as the clogged biomass proved tobe stable. This phenomenon might be attributable to the specialsurvival mechanisms of the geobacteria. Even with a limited amo-unt of nutrition, the microbes can maintain their fundamentalmetabolism (Thullner et al., 2002). When permeated with con-centrated salt, the microbial cell might be lysed due to the chemo-osmotic effect on the cell membrane (Hand et al., 2008). We haveobserved increased turbidity in the outflow when the influent liquidwas replaced by a salt solution, indicating the lysis of the microbes.This could explain the gradual increase in k under the permeationof Ca solutions. However, the nutrition released from the cell lysiscould feed other microbes that are resistant to environmental stress(Bielefeldt et al., 2004; Hand et al., 2008).After all, bioclogging could be easily established in compacted
soils by simply permeating the suspension of the biomass, which
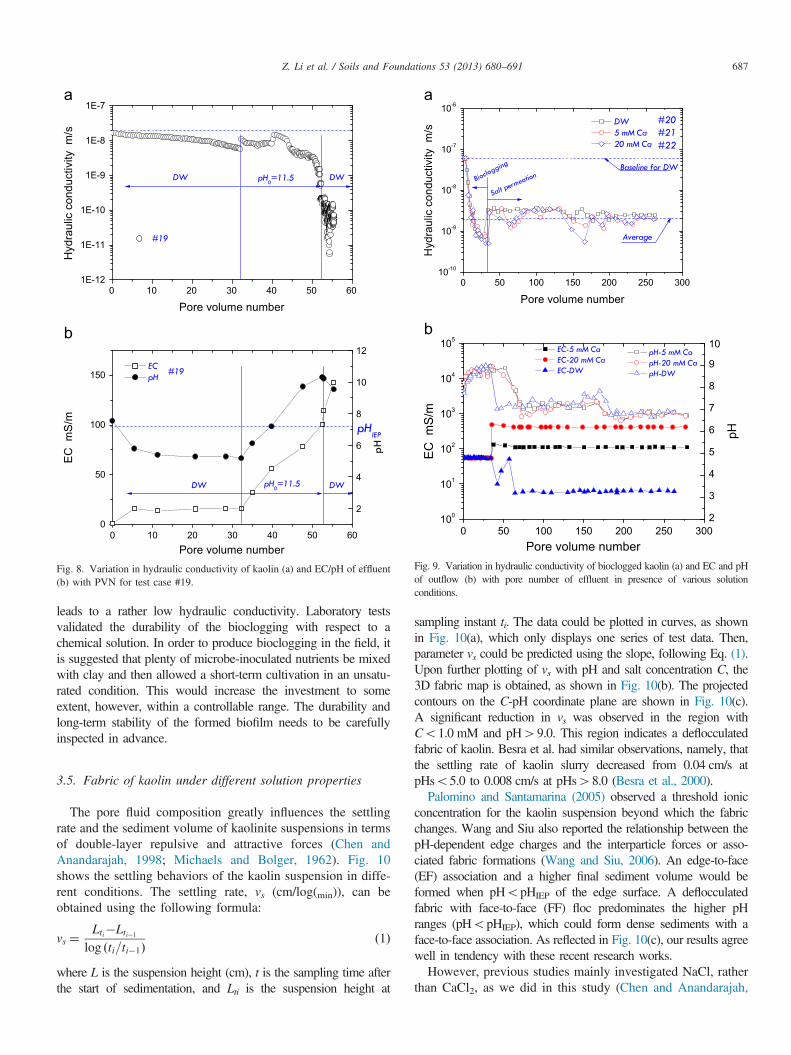
Fig. 8. Variation in hydraulic conductivity of kaolin (a) and EC/pH of effluent(b) with PVN for test case #19.
Fig. 9. Variation in hydraulic conductivity of bioclogged kaolin (a) and EC and pHof outflow (b) with pore number of effluent in presence of various solutionconditions.
Z. Li et al. / Soils and Foundations 53 (2013) 680–691 687
leads to a rather low hydraulic conductivity. Laboratory testsvalidated the durability of the bioclogging with respect to achemical solution. In order to produce bioclogging in the field, itis suggested that plenty of microbe-inoculated nutrients be mixedwith clay and then allowed a short-term cultivation in an unsatu-rated condition. This would increase the investment to someextent, however, within a controllable range. The durability andlong-term stability of the formed biofilm needs to be carefullyinspected in advance.
3.5. Fabric of kaolin under different solution properties
The pore fluid composition greatly influences the settlingrate and the sediment volume of kaolinite suspensions in termsof double-layer repulsive and attractive forces (Chen andAnandarajah, 1998; Michaels and Bolger, 1962). Fig. 10shows the settling behaviors of the kaolin suspension in diffe-rent conditions. The settling rate, vs (cm/log(min)), can beobtained using the following formula:
vs ¼Lti�Lti�1
log ðti=ti�1Þð1Þ
where L is the suspension height (cm), t is the sampling time afterthe start of sedimentation, and Lti is the suspension height at
sampling instant ti. The data could be plotted in curves, as shownin Fig. 10(a), which only displays one series of test data. Then,parameter vs could be predicted using the slope, following Eq. (1).Upon further plotting of vs with pH and salt concentration C, the3D fabric map is obtained, as shown in Fig. 10(b). The projectedcontours on the C-pH coordinate plane are shown in Fig. 10(c).A significant reduction in vs was observed in the region withCo1.0 mM and pH49.0. This region indicates a deflocculatedfabric of kaolin. Besra et al. had similar observations, namely, thatthe settling rate of kaolin slurry decreased from 0.04 cm/s atpHso5.0 to 0.008 cm/s at pHs48.0 (Besra et al., 2000).Palomino and Santamarina (2005) observed a threshold ionic
concentration for the kaolin suspension beyond which the fabricchanges. Wang and Siu also reported the relationship between thepH-dependent edge charges and the interparticle forces or asso-ciated fabric formations (Wang and Siu, 2006). An edge-to-face(EF) association and a higher final sediment volume would beformed when pHopHIEP of the edge surface. A deflocculatedfabric with face-to-face (FF) floc predominates the higher pHranges (pHopHIEP), which could form dense sediments with aface-to-face association. As reflected in Fig. 10(c), our results agreewell in tendency with these recent research works.However, previous studies mainly investigated NaCl, rather
than CaCl2, as we did in this study (Chen and Anandarajah,

Fig. 10. Variation in (a) settling rate of kaolin suspension with Ca concentra-tion and pH: time dependent behavior, (b) 3D fabric map, and (c) the projectedcontour in C-pH plane (pH0 and pHe are, respectively, the initial andequilibrium pH in clay slurry).
Fig. 11. Adsorption isotherm of Ca on Kaolin at various equilibrationdurations and temperatures.
Fig. 12. Ionic species of CaCl2 in aqueous solution at various pH levels andvariation in pH with Ca/Cl ratio (Calculated by Visual MINTEQ, a chemicalsoftware based on thermodynamic principle; 0.10 M CaCl2, 25 1C).
Z. Li et al. / Soils and Foundations 53 (2013) 680–691688
1998; Michaels and Bolger, 1962; Palomino and Santamarina,2005; Wang and Siu, 2006). Our results indicate that thethreshold value for the ionic strength, through which the fabricof the kaolin suspension was switched from FF to EF, deviatesfrom previously reported values. For the kaolin sample used inthis study, the value is determined at 2.0 mM for the CaCl2solution. Palomino and Santamarina (2005) reported a thresh-old value for NaCl of around 100–150 mM, which is within
the range of data (50–150 mM NaCl) reported by Wang andSiu (2006). The calcium proved to give rise to a tendency ofthe kaolin to get flocculated despite the pH being higher thanthe edge isoelectric potential.
3.6. Discussion
3.6.1. Sorption of Ca on kaolinFig. 11 shows the isotherms of the Ca adsorption on kaolin. The
adsorption was found to reach equilibrium within 24 h. Sorptionamounts between 1 and 14 days do not vary from each other atlow concentration ranges (Ceo400 mg/L). At a higher tempera-ture (100 1C), however, the sorption was obviously enhanced. Thesorption of Ca on the edge of the kaolin particles providesadditional positive charges to attract the adjacent layered kaolinunder an electro-static force. This is likely to explain the thresholdvalue of the Ca concentration in the fabric map of the kaolinsuspension.Fig. 12 shows the theoretical distribution of ionic species of
CaCl2 in the aquous solution. It is found that Ca2þ is stable in abroad range of pH. The variation in pH is predicted to range from

Fig. 14. Variation in hydraulic conductivity with void ratio for various kaolinsamples observed in previous reports.
Z. Li et al. / Soils and Foundations 53 (2013) 680–691 689
2.0 to 7.0 when the Ca/Cl2 ratio increases from 0.90 to 1.0. This isin agreement with the observed effluent pHs, which were as low as4.0 at the beginning of the Ca permeation. From Fig. 4(b), we seethat the Ca/Cl2 ratio stabalizes at 0.90, but the pH is equilibratedaround 6.0, deviating from the predicted one (2.0). This is likely tobe because the exchanged cations from the kaolin, like Mg and Na,can largely supplement the charge balance, and therefore, lead toan increase in the equilibrium pH.
3.6.2. Clogging on drainage layerFig. 13 shows the SEM images of the filter paper before and
after permeation test case #16. After weeks of permeation withDW, the filter paper in contact with the kaolin specimen wasfound to be clogged with fine particles. The clogging mass hasdiameters less than the pore size of the filter paper. This clogging,which gives rise to the permeation resistance for kaolin (Li et al.,2011), could be related to the change in microfabric of the kaolinwhen pH4pHIEP (Fig. 7). The fine particles are supposed to bemovable in soil through the macropores, and finally depositedonto the filter paper.
3.6.3. Role of deflocculationKaolin is most likely to become deflocculated due to its low
plasticity index compared to other clay minerals. For poorly gradedsoils, e.g., kaolin-sand mixtures (clay fraction of 5.0%), the claydispersion was found to increase the hydraulic conductivity(Frenkel et al., 1992). However, the reverse was observed in thisstudy. Due to the absence of skeleton grains (sand) in the kaolinspecimens used in this study, the erosion of fine particles appearsto be impossible. The deflocculated portion of kaolin, possessing asmaller grain size than the clay aggregate (Michaels and Bolger,1962), would result in the clogging of the pore spaces (Hand et al.,2008). The deflocculated portion of kaolin could be preciselydetermined by measuring the respective weight of the soil insuspension and the sediment in the settling test. We found that3.0% of the kaolin can be deflocculated, which is a limited amountcompared to a multi-swellable kaolin (Palomino and Santamarina,2005). However, it is these fine grains that play a vital role in theadjustment of the hydraulic conductivity.
The importance of the microfabric has been recognized inprevious studies, indicating that the most important variableinfluencing the permeability of clays is the flocculation of the
Fig. 13. SEM photos of filter paper (a) before and (b) after b
clay particles, which influences the distribution of the void sizesand shapes (Mesri and Olson, 1971). The mechanical variablesgoverning the permeability of clay are believed to include thesize, the shape and the geometrical arrangement of the clayparticles. This study expands this view by examining the effect ofthe chemical concentration, the pH and their variation on the re-arrangement of the deflocculated fine particles. For kaolin, thedeflocculated fabric helps maintain a very low hydraulic con-ductivity. We showed that the fabric change for kaolin is notrecoverable if modified by chemicals or microbial activities,which partly addresses concerns about the reliability of kaolin forimplementation in landfill liners.Fig. 14 shows the relationship between the hydraulic conduc-
tivity of kaolin and its void ratio. These data are selected fromseveral previous studies on compacted kaolin (Abdul et al., 1990;Boynton and Daniel, 1985; Mesri and Olson, 1971; Michaels andLin, 1954; Shackelford and Redmond, 1995) and sand-kaolinmixed soil (Aringhieri and Giachetti, 2001; Chiu and Shackelford,1998). The sand-kaolin mixed soil samples generally have higher kthan kaolin, regardless of their void ratios. We note that differentkaolin samples can have different conductivity performances, e.g.,the Georgia kaolin appears to have much less conductivity(Boynton and Daniel, 1985; Mesri and Olson, 1971; Shackelfordand Redmond, 1995) by two orders of magnitude compared withthe others (Abdul et al., 1990; Michaels and Lin, 1954). Mesri and
eing used as porous drainage layer for kaolin specimen.

Z. Li et al. / Soils and Foundations 53 (2013) 680–691690
Olson (1971) found that the void ratio can control the hydraulicconductivity, with a reduction in k of 1–2 orders of magnitudewhen e deceases from 1.6 to 0.8. However, our results show thatreductions in k of 3–4 orders of magnitude are achievable by anadjustment to the microfabrics, which is of greater significancecompared to the effect of compaction.
4. Conclusions
(1)
Permeation tests indicated that the hydraulic conductivityof kaolin was decreased by 1 order of magnitude forconcentrated Ca solutions (C0Z0.01 M), but tended toincrease by 16.7% for dilute Ca solutions (C0r5.0 mM).Salt filtration across the soil specimen was confirmed bythe difference in ECs in the influent and the effluent, whichcould induce chemico-osmotic pressure, and thus, reducethe hydraulic conductivity.(2)
Fluctuation in the chemical concentration resulted in aconsistent decrease in the hydraulic conductivity of thekaolin from 6.0� 10�8 to 1.0� 10�9 m/s. The pH shift inthe influent resulted in a sharp reduction in k by more than2 orders of magnitude to 2� 10�11 m/s.(3)
Bioclogging could greatly improve the barring perfor-mance of kaolin by decreasing the k of natural kaolin bytwo orders of magnitude. Bioclogging also proved to bedurable against severe environmental conditions even withconcentrated salt solutions.(4)
Kaolin demonstrates low values of k under various fluidicconditions (broad range of EC and pH). Alkaline-treatedkaolin and metakaolin appear to have low hydraulicconductivity (1.5� 10�10 m/s) that satisfies the standardfor landfill liners.(5)
The influences of the pH and the Ca concentration on theflocculation of the kaolin suspension were systematicallyinvestigated, and a 3-D fabric map for kaolin slurry wasobtained. The deflocculated fabric is responsible for thereduction in hydraulic conductivity of the kaolin; therefore,the conductivity variation in kaolin can be assessed by afabric map.Acknowledgments
This research was financially supported by the Japan Society forthe Promotion of Science through a JSPS Postdoctoral Fellowship.Qiang Tang helped to test the metakaolin at GSGES, KyotoUniversity. Proofreading by John Poland of Carleton Universityhas significantly improved the quality of this paper.
References
Abdul, A.S., Gibson, T.L., Rai, D.N., 1990. Laboratory studies of the flow ofsome organic-solvents and their aqueous-solutions through bentonite andkaolin clays. Ground Water 28, 524–533.
Acar, Y.B., Olivieri, I., 1989. Pore fluid effects on the fabric and hydraulicconductivity of laboratory-compacted clay. Transportation ResearchRecord, Geotechnical Engineering 1219, 144–159.
Altabbaa, A., Wood, D.M., 1987. Some measurements of the permeability ofkaolin. Geotech 37, 499–503.
Anantanasakul, P., Yamamuro, J.A., Lade, P.V., 2012. Three-dimensionaldrained behavior of normally consolidated anisotropic kaolin clay. Soilsand Foundations 52, 146–159.
Aringhieri, R., Giachetti, M., 2001. Effect of sodium adsorption ratio andelectrolyte concentrations on the saturated hydraulic conductivity of clay-sand mixtures. European Journal of Soil Science 52, 449–458.
Barroso, M., Touze-Foltz, N., von Maubeuge, K., Pierson, P., 2006.Laboratory investigation of flow rate through composite liners consistingof a geomembrane, a GCL and a soil liner. Geotextiles and Geomembranes24, 139–155.
Basheer, I.A., Najjar, Y., 1995. Estimating hydraulic conductivity of com-pacted clay liners. Journal of Geotechnical Engineering 121, 675–678.
Benson, C.H., Daniel, D.E., Boutwell, G.P., 1999. Field performance ofcompacted clay liners. Journal of Geotechnical and GeoenvironmentalEngineering 125, 390–403.
Besra, L., Sengupta, D.K., Roy, S.K., 2000. Particle characteristics and theirinfluence on dewatering of kaolin, calcite and quartz suspensions. Interna-tional Journal of Mineral Processing 59, 89–112.
Bielefeldt, A.R., Illangasekare, T., LaPante, R., 2004. Bioclogging of sand dueto biodegradation of aircraft deicing fluid. Journal of EnvironmentalEngineering, ASCE 130, 1147–1153.
Boutin, C., Kacprzak, G., Doanh, T., 2010. Interpretation of the stiffness andpermeability of Sand-Kaolin mixtures in the framework of homogenization.Anais da Academia Brasileira de Ciências 82, 243–260.
Boynton, S.S., Daniel, D.E., 1985. Hydraulic conductivity tests on compactedclay. Journal of Geotechnical Engineering, ASCE 111, 465–478.
Chen, J., Anandarajah, A., 1998. Influence of pore fluid composition onvolume of sediments in kaolinite suspensions. Clays and Clay Minerals 46,145–152.
Chen, J., Anandarajah, A., Inyang, H., 2000. Pore fluid properties andcompressibility of kaolinite. Journal of Geotechnical and Geoenvironmen-tal Engineering 126, 798–808.
Chiu, T.F., Shackelford, C.D., 1998. Unsaturated hydraulic conductivity ofcompacted sand-kaolin mixtures. Journal of Geotechnical and Geoenviron-mental Engineering 124, 160–170.
Day, S.R., Daniel, D.E., 1985. Hydraulic conductivity of two prototype clayliners. Journal of Geotechnical Engineering 111, 957–970.
Frenkel, H., Levy, G.J., Fey, M.V., 1992. Clay dispersion and hydraulicconductivity of clay-sand mixtures as affected by the addition of variousanions. Clays and Clay Minerals 40, 515–521.
Granizo, M.L., Alonso, S., Blanco-Varela, M.T., Palomo, A., 2002. Alkalineactivation of metakaolin: effect of calcium hydroxide in the products ofreaction. Journal of the American Ceramic Society 85, 225–231.
Hand, V.L., Lloyd, J.R., Vaughan, D.J., Wilkins, M.J., Boult, S., 2008.Experimental studies of the influence of grain size, oxygen availability andorganic carbon availability on bioclogging in porous media. EnvironmentalScience & Technology 42, 1485–1491.
Hart, M., Whitworth, T.M., Atekwana, E., 2008. Hyperfiltration of sodiumchloride through kaolinite membranes under relatively low-heads—impli-cations for groundwater assessment. Applied Geochemistry 23,1691–1702.
Heister, K., Kleingeld, P.J., Loch, J.P.G., 2006. Induced membrane potentialsin chemical osmosis across clay membranes. Geoderma 136, 1–10.
Jeng, C.J., Li, J.C., Liu, S.K., Tseng, C.S., Chung, Y.H., 2008. Influence offabric orientation to the permeability and dynamic characteristics ofhydraulic-filled sand. Soils and Foundations 48, 221–229.
Jo, H.Y., Benson, C.H., Shackelford, C.D., Lee, J.M., Edil, T.B., 2005. Long-term hydraulic conductivity of a geosynthetic clay liner permeated withinorganic salt solutions. Journal of Geotechnical and GeoenvironmentalEngineering 131, 405–417.
Katsumi, T., Ishimori, H., Ogawa, A., Maruyama, S., Fukagawa, R., 2008.Effects of water content distribution on hydraulic conductivity of prehy-drated GCLs against calcuium chloride solutions. Soils and Foundations48(3), 407–417.
Komine, H., Watanabe, Y., 2010. The past, present and future of the geo-environment in Japan. Soils and Foundations 50, 977–982.

Z. Li et al. / Soils and Foundations 53 (2013) 680–691 691
Li, Z., Inui, T., Katsumi, T. Effect of biofilm on Cd(II) adsorption by Kaolin.In: Proceedings of 45th Japan Geotechnical Society Research Seminar,Matsuyama, Japan. Aug. 18–21 2010, Japan Geotechnical Society,pp. 1909–1910.
Li, Z., Katsumi, T., Inui, T., 2011. Modeling cake filtration under coupledhydraulic, electric and osmotic effects. Journal of Membrane Science 378,485–494.
Malusis, M.A., Shackelford, C.D., 2002. Coupling effects during steady-statesolute diffusion through a semipermeable clay membrane. EnvironmentalScience & Technology 36, 1312–1319.
Mesri, G., Olson, R.E., 1971. Mechanisms controlling the permeability of clays.Clays and Clay Minerals 19, 151–158.
Michaels, A.S., Lin, C.S., 1954. Permeability of Kaolin. Industrial &Engineering Chemistry 46, 1239–1246.
Michaels, A.S., Bolger, J.C., 1962. Settling rates and sediment volumes offlocculated kaolin suspensions. Industrial & Engineering Chemistry Funda-mentals 1, 24–33.
Palomino, A.M., Santamarina, J.C., 2005. Fabric map for kaolinite: effects of phand ionic concentration on behavior. Clays and Clay Minerals 53, 211–223.
Rowe, R.K., 2005. Long-term performance of contaminant barrier systems.Geotechnique 55, 631–678.
Shackelford, C.D., Redmond, P.L., 1995. Solute breakthrough curves forprocessed kaolin at low-flow rates. Journal of Geotechnical Engineering,ASCE 121, 17–32.
Shackelford, C.D., Benson, C.H., Katsumi, T., Edil, T.B., Lin, L., 2000.Evaluating the hydraulic conductivity of GCLs permeated with non-standard liquids. Geotextiles and Geomembranes 18, 133–161.
Southen, J.M., Rowe, R.K., 2005. Laboratory investigation of geosyntheticclay liner desiccation in a composite liner subjected to thermal gradients.Journal of Geotechnical and Geoenvironmental Engineering 131, 925–935.
Tang, Q., Tang, X.W., Li, Z.Z., Chen, Y.M., Kou, N.Y., Sun, Z.F., 2009.Adsorption and desorption behaviour of Pb(II) on a natural kaolin:equilibrium, kinetic and thermodynamic studies. Journal of ChemicalTechnology and Biotechnology. 84, 1371–1380.
Thullner, M., Zeyer, J., Kinzelbach, W., 2002. Influence of microbial growth onhydraulic properties of pore networks. Transport in Porous Media 49, 99–122.
Wang, Y.H., Siu, W.K., 2006. Structure characteristics and mechanicalproperties of kaolinite soils. I. Surface charges and structural characteriza-tions. Canadian Geotechnical Journal 43, 587–600.