FAA AEROSPACE FORECASTS FISCAL YEARS 2007–2020
20
FAA AEROSPACE FORECASTS FISCAL YEARS 2007–2020 Developing forecasts of aviation demand and activity levels continues to be challenging as the uncer- tainties confronting the aviation industry have remained complex and difficult to quantify. Nevertheless, the FAA has developed a set of assumptions and forecasts consistent with the emerging trends and structural changes currently taking place within the aviation industry. The main assumption in developing this year’s forecasts continues to be that there will not be a suc- cessful terrorist incident against either U.S. or world aviation. Also, the forecasts do not assume further major contractions of the industry through bankruptcy, consolidation, or liquidation. The commercial aviation forecasts and assumptions are developed from econometric models that try to explain and incorporate emerging trends for three carrier groupings—legacy network carriers, low-cost carriers, and regionals. Strategies and success levels have historically differed for each carrier group- ing. The commercial aviation forecast methodology is a blended methodology. It relies on published sched- ule information and current monthly trends to drive the short-term (one year out) forecasts and then bases the medium and long-term (2008-2020) forecasts on the results of econometric models. The starting point for developing the commercial aviation forecasts (air carriers and regionals) continues to be the future schedules published in the Official Airline Guide (OAG). Using monthly schedules allows FAA forecasters to develop monthly capacity and demand forecasts for both mainline and regional carri- ers for fiscal and calendar year 2007. The general aviation forecasts rely heavily on the discussions with industry experts that occurred at the October 2006 FAA/Transportation Research Board (TRB) Workshop on General Aviation. The assump- tions have been updated by FAA analysts to reflect more recent data and developing trends, as well as further discussions with industry experts. FAA also presents the forecasts and assumptions to industry staff and aviation associations, who are asked to comment on the reasonableness of the assumptions and forecasts. Their comments and/or suggestions have been incorporated into the forecasts as appropriate. FAA Aerospace Forecast Fiscal Years 2007–2020 25
Transcript of FAA AEROSPACE FORECASTS FISCAL YEARS 2007–2020

������ FAA AEROSPACE FORECASTS FISCAL YEARS 2007–2020
Developing forecasts of aviation demand and activity levels continues to be challenging as the uncer-tainties confronting the aviation industry have remained complex and difficult to quantify. Nevertheless,the FAA has developed a set of assumptions and forecasts consistent with the emerging trends andstructural changes currently taking place within the aviation industry.
The main assumption in developing this year’s forecasts continues to be that there will not be a suc-cessful terrorist incident against either U.S. or world aviation. Also, the forecasts do not assume furthermajor contractions of the industry through bankruptcy, consolidation, or liquidation.
The commercial aviation forecasts and assumptions are developed from econometric models that try toexplain and incorporate emerging trends for three carrier groupings—legacy network carriers, low-costcarriers, and regionals. Strategies and success levels have historically differed for each carrier group-ing.
The commercial aviation forecast methodology is a blended methodology. It relies on published sched-ule information and current monthly trends to drive the short-term (one year out) forecasts and thenbases the medium and long-term (2008-2020) forecasts on the results of econometric models. Thestarting point for developing the commercial aviation forecasts (air carriers and regionals) continues tobe the future schedules published in the Official Airline Guide (OAG). Using monthly schedules allowsFAA forecasters to develop monthly capacity and demand forecasts for both mainline and regional carri-ers for fiscal and calendar year 2007.
The general aviation forecasts rely heavily on the discussions with industry experts that occurred at theOctober 2006 FAA/Transportation Research Board (TRB) Workshop on General Aviation. The assump-tions have been updated by FAA analysts to reflect more recent data and developing trends, as well asfurther discussions with industry experts.
FAA also presents the forecasts and assumptions to industry staff and aviation associations, who areasked to comment on the reasonableness of the assumptions and forecasts. Their comments and/orsuggestions have been incorporated into the forecasts as appropriate.
FAA Aerospace Forecast Fiscal Years 2007–2020
25
ECONOMIC FORECASTS
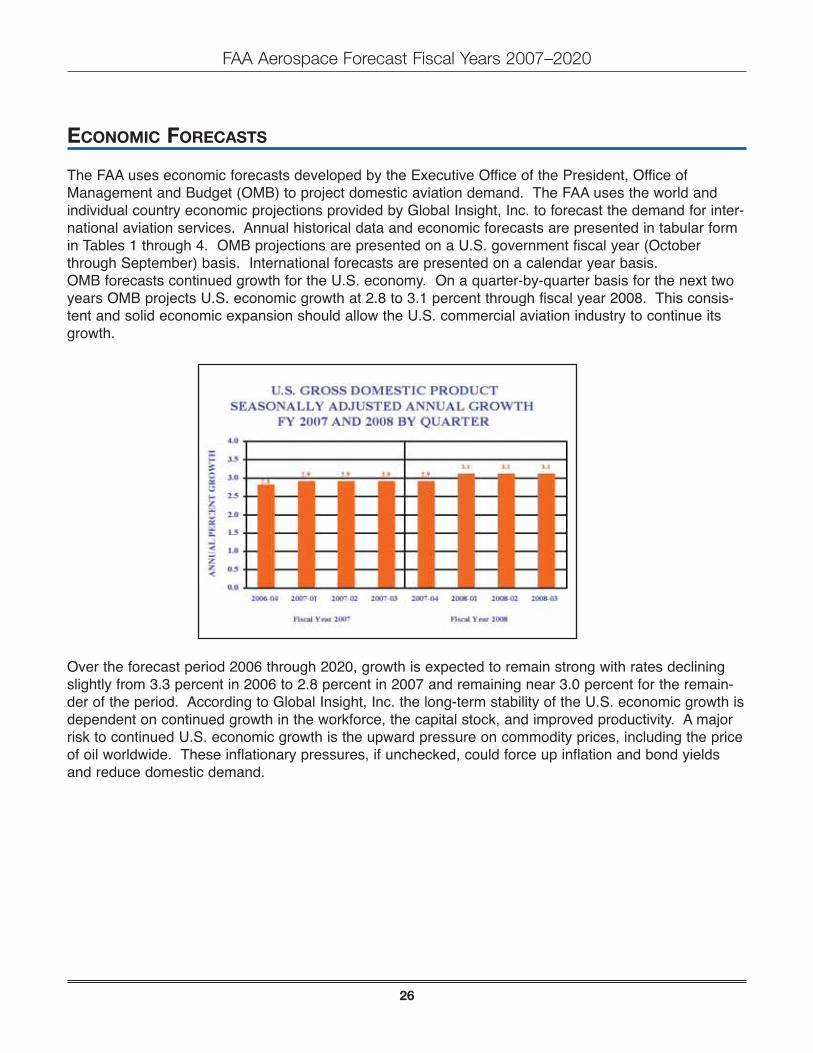
The FAA uses economic forecasts developed by the Executive Office of the President, Office ofManagement and Budget (OMB) to project domestic aviation demand. The FAA uses the world andindividual country economic projections provided by Global Insight, Inc. to forecast the demand for inter-national aviation services. Annual historical data and economic forecasts are presented in tabular formin Tables 1 through 4. OMB projections are presented on a U.S. government fiscal year (Octoberthrough September) basis. International forecasts are presented on a calendar year basis.OMB forecasts continued growth for the U.S. economy. On a quarter-by-quarter basis for the next twoyears OMB projects U.S. economic growth at 2.8 to 3.1 percent through fiscal year 2008. This consis-tent and solid economic expansion should allow the U.S. commercial aviation industry to continue itsgrowth.
Over the forecast period 2006 through 2020, growth is expected to remain strong with rates decliningslightly from 3.3 percent in 2006 to 2.8 percent in 2007 and remaining near 3.0 percent for the remain-der of the period. According to Global Insight, Inc. the long-term stability of the U.S. economic growth isdependent on continued growth in the workforce, the capital stock, and improved productivity. A majorrisk to continued U.S. economic growth is the upward pressure on commodity prices, including the priceof oil worldwide. These inflationary pressures, if unchecked, could force up inflation and bond yieldsand reduce domestic demand.
FAA Aerospace Forecast Fiscal Years 2007–2020
26

OMB projects the price of oil, as measured by Refiners’ Acquisition Cost, to fall by 4.8 percent in 2007after more than doubling over the past 3 years. The cost of oil is expected to rise again in 2008 (7.1percent) and become somewhat less volatile through the remainder of the forecast period.
The inflation rate (as measured by the CPI) is expected to be 2.0 percent in 2007, down substantiallyfrom the hefty rise of 3.7 percent in 2006. The slowdown in the rate of inflation in 2007 is attributed, inpart, to an expected slowdown in the rise of energy prices and a mild cooling in economic growth.Consumer price inflation is expected to rise in 2008 and 2009 to 2.6 percent and then level off to 2.3percent for the balance of the forecast.
FAA Aerospace Forecast Fiscal Years 2007–2020
27

World Economy
Worldwide economic activity is predicted by Global Insight to expand by 3.3 and 3.5 percent in 2007and 2008, respectively, and average 3.1 percent over the forecast period.
Latin America and the Asia/Pacific region will continue with the world’s highest economic growth rates.These regions are expected to expand their economic activity at annual rates of 3.9 and 3.8 percent,respectively over the period. In Asia, China, with a population of 1.3 billion, is forecast to expand by 7.1percent a year, while India, with a population of 1.1 billion, is projected to grow 6.2 percent a year overthe period 2006 through 2020. Canadian and European GDP growth is anticipated to rise at more mod-erate rates of 2.4 and 2.5 percent a year, respectively, over the forecast period.
AVIATION TRAFFIC AND ACTIVITY FORECASTS
Total traffic and activity forecasts for commercial air carriers (the sum of mainline and regional carriers)are contained in Tables 5 through 9. These tables contain year-to-year historical data and forecasts.
Mainline air carrier traffic and activity forecasts and the forecast assumptions are contained in Tables 10through 18, 20, and 22. These tables contain year-to-year historical data and forecasts.
Regional carrier forecasts and assumptions are found in Tables 23 through 26. These tables provideyear-to-year historical and forecast data.
Table 19 provides year-to-year historical and forecast data for cargo activity. Table 21 provides year-to-year historical and forecast data for the cargo jet fleet.
FAA Aerospace Forecast Fiscal Years 2007–2020
28

General aviation forecasts are found in Tables 27 through 30. These tables provide year-to-year histori-cal data and forecasts.
Tables 31 through 33 provide forecasts of aircraft activity at FAA and contract facilities.
Commercial Aviation Forecasts
After two years of strong growth, U.S. commercial air carriers in 2006 posted flat capacity and trafficresults. In 2006, system (the sum of domestic plus international) capacity fell by 0.2 percent to just overone trillion ASMs. Passenger demand, impacted by higher fares and a slowing economy, remained flat,with enplanements up just 0.4 percent to 741.1 million while RPMs increased 2.1 percent to 791.3 bil-lion. Demand remained healthy for regional carriers in 2006 but large domestic capacity cuts by legacycarriers dampened mainline carrier demand. While domestic markets remained basically flat, interna-tional markets saw 5 to 6 percent growth propelled by a double-digit increase in the Latin Americanregions.
System load factor and trip length climbed in 2006, while seats per aircraft mile increased for the firsttime since 1997. Load factor increased 1.8 points to an all-time high of 79.0 percent, and trip lengthgrew 17.9 miles to 1,067.8 miles. Reversing an 8-year downward trend, seats per aircraft mileincreased by 0.6 in 2006 to 135.6 seats per aircraft mile as network carriers shifted wide-body flyingfrom domestic to international markets.
Capacity and demand growth are forecast in 2007 to rebound from the slowdown in 2006. Capacity isprojected to grow 2.8 percent as the network carrier domestic market capacity stabilizes (after fallingalmost 6 percent in 2006) while low-cost carriers continue to add capacity in domestic markets and net-work carriers continue to grow in international markets. Mainline carrier system capacity is projected toincrease 2.8 percent while regional carrier capacity rises 3.0 percent. Passenger demand growth alsorebounds with RPMs forecast to increase 3.4 percent (up 3.2 percent and 5.2 percent for mainline andregional carriers, respectively) as passenger enplanements rise 3.7 percent. Growth is projected toaccelerate in 2008 as RPMs and passengers increase 4.2 and 3.4 percent, respectively, while capacityincreases slightly faster at 4.3 percent. For the balance of the forecast, system capacity is projected toincrease an average of 4.4 percent a year. Supported by solid economic growth and falling real yields,system RPMs are projected to increase 4.5 percent a year, with regional carriers (5.1 percent a year)growing faster than mainline carriers (4.4 percent a year). System passengers are projected to increasean average of 3.5 percent a year, with mainline carriers growing faster than regional carriers (3.7 vs. 3.0percent a year). By 2020, U.S. commercial air carriers are projected to fly 1.8 trillion ASMs and trans-port 1.2 billion enplaned passengers a total of 1.4 trillion passenger miles. Planes will become fuller, asload factor is projected to continue to increase to 80.3 percent by 2020. Passenger trip length is alsoforecast to increase by more than 130 miles over the forecast to 1,198.1 miles (up 9.3 miles annually).The growth in passenger trip length reflects the faster growth in the relatively longer international tripsand longer domestic trips resulting from increased point-to-point service.
FAA Aerospace Forecast Fiscal Years 2007–2020
29
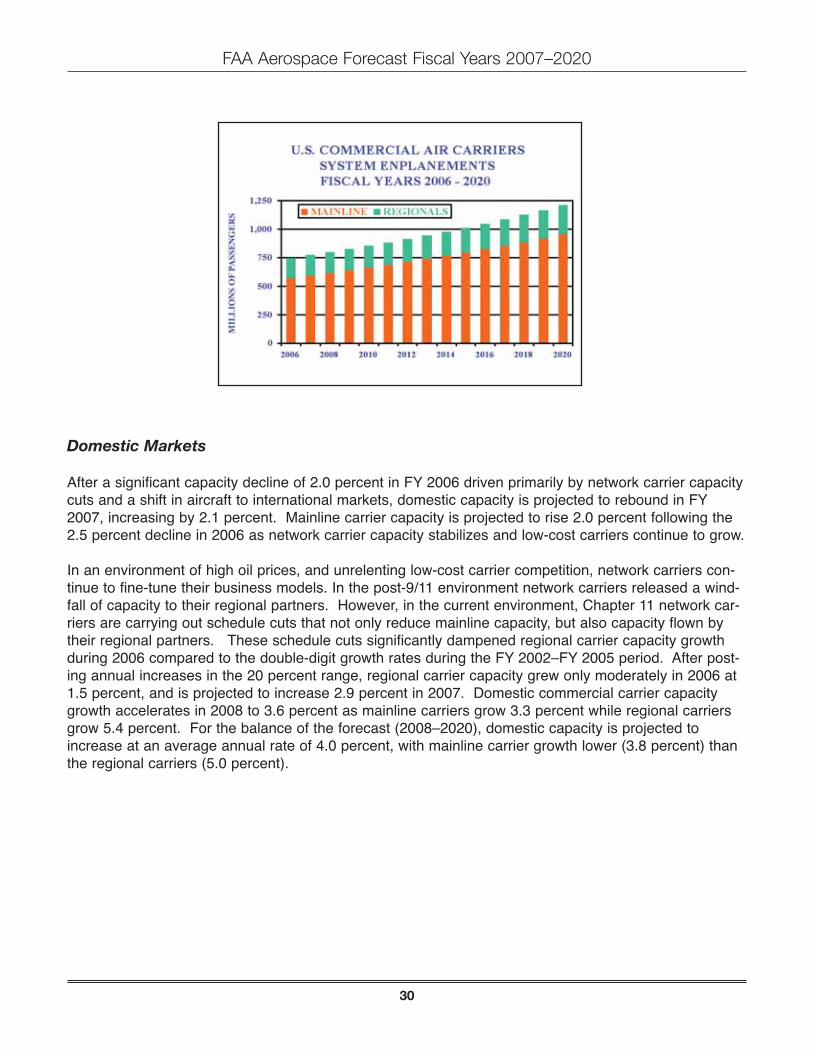
Domestic Markets
After a significant capacity decline of 2.0 percent in FY 2006 driven primarily by network carrier capacitycuts and a shift in aircraft to international markets, domestic capacity is projected to rebound in FY2007, increasing by 2.1 percent. Mainline carrier capacity is projected to rise 2.0 percent following the2.5 percent decline in 2006 as network carrier capacity stabilizes and low-cost carriers continue to grow.
In an environment of high oil prices, and unrelenting low-cost carrier competition, network carriers con-tinue to fine-tune their business models. In the post-9/11 environment network carriers released a wind-fall of capacity to their regional partners. However, in the current environment, Chapter 11 network car-riers are carrying out schedule cuts that not only reduce mainline capacity, but also capacity flown bytheir regional partners. These schedule cuts significantly dampened regional carrier capacity growthduring 2006 compared to the double-digit growth rates during the FY 2002–FY 2005 period. After post-ing annual increases in the 20 percent range, regional carrier capacity grew only moderately in 2006 at1.5 percent, and is projected to increase 2.9 percent in 2007. Domestic commercial carrier capacitygrowth accelerates in 2008 to 3.6 percent as mainline carriers grow 3.3 percent while regional carriersgrow 5.4 percent. For the balance of the forecast (2008–2020), domestic capacity is projected toincrease at an average annual rate of 4.0 percent, with mainline carrier growth lower (3.8 percent) thanthe regional carriers (5.0 percent).
FAA Aerospace Forecast Fiscal Years 2007–2020
30

Supported by a growing economy and moderating fare increases, domestic RPM growth returns in 2007(up 2.8 percent) as industry capacity and demand move more into balance. Mainline carrier RPMs areprojected to grow slightly slower (2.5 percent) than the overall industry. Growth picks up in 2008 (3.4percent) driven by consumer spending, and then for the balance of the forecast (2008-2020) domesticRPMs are projected to grow an average of 4.1 percent a year driven by continued growth in the econo-my and falling real yields. Mainline carriers are projected to grow more slowly than regional carriers(4.0 and 5.2 percent a year, respectively). Domestic passenger enplanements fell by 0.2 percent in2006 as carriers tried to shore up their profitability by raising fares. Passenger volumes are expected tobounce back in 2007 and 2008, growing 3.6 and 3.1 percent respectively. For the remainder of theforecast period, domestic enplanements are projected to grow at an average annual rate of 3.4 percentwith mainline carriers growing faster than regional carriers (3.5 and 3.0 percent a year, respectively).Although total domestic enplanements exceeded pre-9/11 levels in 2005, mainline carrier volumes donot return to pre-9/11 levels until 2009.
FAA Aerospace Forecast Fiscal Years 2007–2020
31

Following an 8.5 percent increase (4.7 percent in real terms) in 2006, nominal mainline carrier domesticpassenger yield, is projected to increase further in 2007 by 2.5 percent (0.4 percent in real terms) asindustry supply and demand move more into balance and oil price increases moderate. Beginning in2008 and continuing for the balance of the forecast period, increases in nominal yields are projected togrow at a rate of 1.4 percent a year, while in real terms they are projected to decline an average of 0.9percent a year. The decline in real yields over the forecast period is based on the assumption thatincreased competition from low-cost carriers will continue, and exert pressure on the network carriers tomatch the lower fares on competitive routes. Competition in domestic markets will come from estab-lished low-cost carriers such as Southwest, as well as smaller low-cost carriers such as AirTran,Frontier, and JetBlue. In addition, the newly formed US Airways (the result of the merger betweenAmerica West and US Airways) may be a catalyst for a broader application of simpler fare structures indomestic markets.
The slower growth in projected domestic commercial carrier activity (departures) at FAA air traffic facili-ties compared to passenger traffic growth (average annual growth during 2006–2020 of 2.3 percent fordepartures versus 3.4 percent for enplanements) reflects increased carrier efficiencies in three opera-tional measures—aircraft size, load factor, and trip length.
Domestic aircraft size9 declined in 2005 by 1.3 seats to 120.4, and remained essentially flat at 120.2seats in 2006, but is forecast to increase by 0.3 seats in 2007 to 120.5 seats. Aircraft size is projectedto increase through 2011 to 121.3 seats, then decline gradually through 2015 to 120.9 seats. Seatcapacity will start to recover in 2016 and rise to 121.4 seats by 2020.
The FAA’s projections of domestic carrier average aircraft size is greatly influenced by carrier fleetplans, publicly known aircraft order books and FAA’s expectations of the evolving domestic competitivelandscape. In the short-term timeframe (through 2011), the forecast incorporates several network carri-er assumptions: 1) network carrier desire to constrain ASM capacity growth; 2) network carrier “ownmetal” service on longer-haul routes; 3) the retirement of older inefficient aircraft (many of which arenarrow-body); 4) shifting wide-body and larger narrow-body aircraft to international services, and 5) thesignificant downsizing of Chapter 11 carriers during bankruptcy and its implications for aircraft retire-ments.
In the longer-term, network carriers will continue to replace their wide-body and larger narrow-body air-craft in their domestic route networks with smaller narrow-body aircraft. In addition, some carriers, suchas JetBlue, are turning to smaller aircraft, like the 100-seat Embraer 190, to supplement their networkstructure. The use of smaller narrow-body aircraft allows mainline carriers to better serve their cus-tomers by boosting frequency, as well as improve profitability by more closely matching supply (thenumber of seats) with demand (the number of passengers).
Mainline aircraft size increased in 2006 by 0.2 seats to 150.4 seats, but is projected to fall in 2007 by0.1 seats. The overall average for the mainline group will peak in 2010 at 151.2 seats and then gradu-ally decrease to 147.7 by 2020.
FAA Aerospace Forecast Fiscal Years 2007–2020
32
9 Defined as seats per mile flown and computed by dividing ASMs by miles flown

While mainline carriers have been reducing the size of aircraft flown domestically, regional carriers havebeen increasing the size of their aircraft. The most visible example of this trend is the wave of 70-90seat regional jet aircraft that are entering the fleet with the continuing relaxation of scope clauses.Regional carriers are better able to support operations of their mainline partners when they can providecapacity that complements market demand. The greater number of the larger 70 and 90 seat regionaljets in the fleet increases the average seating capacity of the regional fleet – from 50.0 seats in 2006 to50.8 seats in 2007 and 59.0 seats in 2020. The changing aircraft fleet mix is narrowing the gapbetween the size and aircraft types operated by the mainline and regional carriers.
Commercial carrier domestic load factor increased 2.3 points in 2006 to 78.7 percent. The increase inload factor was heavily weighted by the results of the network carriers whose load factor grew 2.3 pointsto a record 80.6 percent. In 2007, domestic load factor is expected to increase 0.5 points to 79.2 per-cent with increases for both mainline and regional carriers. After 2007 load factor is projected toincrease at an average of 0.1 points a year, reaching 80.3 percent in 2020.
Passenger trip length is also forecast to increase after 2007. In 2006, domestic passenger trip lengthincreased by a substantial margin of 9.6 miles to 871.4 miles with gains recorded by both mainline andregional carriers. A decline in mainline carrier trip length due to a fall in trip length in the growing low-cost carrier sector leads to a passenger trip length decrease of 6.7 miles in 2007. However, for the bal-ance of the forecast period, trip length is projected to increase an average of 6.5 miles a year, reflectinggains in both mainline carrier and regional carrier trip length. Mainline carrier trip lengths are increasingprimarily because shorter length routes are continuing to be transferred to regional partner carriers andbecause of increased point-to-point service. Regional carrier trip lengths increase because the introduc-tion and use of the larger 70 and 90 seat regional jets allow these carriers to service longer haulmarkets.
Another key factor in predicting aviation activity relative to passenger demand is the level of connectingversus non-stop (origin-destination) traffic. In the aggregate, it appears that the number of direct flightsby carriers (both network and low-cost) is increasing. However, as the current cycle of U.S. airlineindustry restructuring unfolds and hub structures change, the impact on local communities and airportactivity levels can fluctuate significantly.
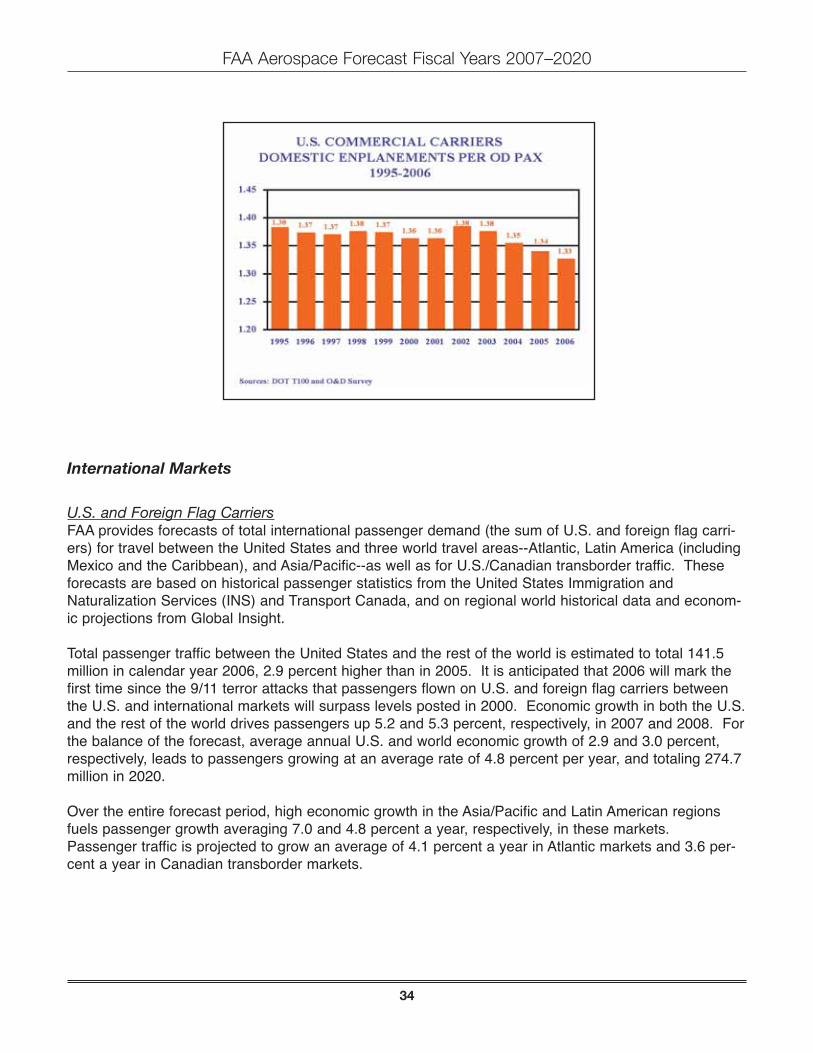
The FAA analyzes the ratio of passenger enplanements to origin-destination (O&D) passengers to shedlight on long-term trends. This ratio is an indicator of the tendency of the average passenger to connectduring a typical journey. The closer the ratio is to 1.0, the more passengers fly on a point-to-point rout-ing. As the chart on the next page demonstrates, the overall ratio for the U.S. domestic industry variedwithin a narrow band between 1995 and 2002, but has been decreasing since then. Disaggregating theindustry average into network and low-cost carrier components reveals that while the network carriertrend has mirrored the national average, the low-cost carrier sector has reversed its trend in 2004, andhas been increasing since. In fact, the respective connectivity ratios of the network and low-cost carri-ers were the closest to each other in FY 2006 than any time since FY 1999. The FAA’s forecast recog-nizes the changing pattern of domestic traffic connectivity, and the relative mix of network versus low-cost carrier traffic volumes. These trends are captured in the forecast’s passenger enplanement totals.
FAA Aerospace Forecast Fiscal Years 2007–2020
33
International Markets
U.S. and Foreign Flag CarriersFAA provides forecasts of total international passenger demand (the sum of U.S. and foreign flag carri-ers) for travel between the United States and three world travel areas--Atlantic, Latin America (includingMexico and the Caribbean), and Asia/Pacific--as well as for U.S./Canadian transborder traffic. Theseforecasts are based on historical passenger statistics from the United States Immigration andNaturalization Services (INS) and Transport Canada, and on regional world historical data and econom-ic projections from Global Insight.
Total passenger traffic between the United States and the rest of the world is estimated to total 141.5million in calendar year 2006, 2.9 percent higher than in 2005. It is anticipated that 2006 will mark thefirst time since the 9/11 terror attacks that passengers flown on U.S. and foreign flag carriers betweenthe U.S. and international markets will surpass levels posted in 2000. Economic growth in both the U.S.and the rest of the world drives passengers up 5.2 and 5.3 percent, respectively, in 2007 and 2008. Forthe balance of the forecast, average annual U.S. and world economic growth of 2.9 and 3.0 percent,respectively, leads to passengers growing at an average rate of 4.8 percent per year, and totaling 274.7million in 2020.
Over the entire forecast period, high economic growth in the Asia/Pacific and Latin American regionsfuels passenger growth averaging 7.0 and 4.8 percent a year, respectively, in these markets.Passenger traffic is projected to grow an average of 4.1 percent a year in Atlantic markets and 3.6 per-cent a year in Canadian transborder markets.
FAA Aerospace Forecast Fiscal Years 2007–2020
34

U.S. Flag Air CarriersIn 2006, U.S. commercial air carrier international capacity grew 5.1 percent. Capacity is forecast toincrease 4.8 percent in 2007, with the fastest growth in the Latin markets. Capacity growth remainsrobust at 6.3 percent in 2008, and averages 5.4 percent a year for the balance of the forecast. Stronggrowth throughout the forecast reflects favorable U.S. and world economic activity as well as the real-ization by U.S. mainline carriers that international markets are a source of profitable operations.
FAA Aerospace Forecast Fiscal Years 2007–2020
35

U.S. commercial air carrier international RPMs increased 5.6 percent in 2006 and enplanementsincreased 6.0 percent. RPM growth is projected to slow in 2007 to 5.1 percent reflecting slower growthin the Atlantic and Latin markets. In 2008, strong growth in the Pacific market results in total U.S. carri-er international RPMs growing 6.3 percent. For the balance of the forecast, RPM growth is forecast toaverage 5.4 percent a year with the fastest growth in the Pacific region. A similar pattern is forecast forenplanement growth. International enplanement growth is projected to slow in 2007, to 4.7 percent,then bounce back to 5.5 percent in 2008. Over the balance of the forecast period, enplanements areforecast to increase an average of 4.8 percent a year with the fastest growth in Pacific markets.
The similar growth in U.S. carrier international passengers compared to total international passengers(including foreign flag carrier traffic) over the forecast period (4.9 percent a year) reflects stabilization inmarket share for U.S. airlines. Forecasts of international demand assume U.S. carriers will benefit fromthe favorable economic activity in both the United States and world markets. Stronger growth in interna-tional travel relative to domestic markets is driven by growth in the Asia/Pacific and Latin America mar-kets.
International load factor for U.S. commercial carriers was 79.7 percent in 2006. Load factor is expectedto rise slightly in 2007 to 80.0 percent as capacity increases, especially in the Pacific and Latin markets,are surpassed by the growth in traffic. International load factor is then projected to hold steady at 80.0percent through 2009, and then increase by 0.1 percentage points to 80.1 percent in 2010 where itremains for the remainder of the forecast period.
International passenger real yields for mainline carriers were up 3.8 percent in 2006, led by growth inAtlantic (4.7 percent), and followed by Asia/Pacific (up 3.1 percent) and Latin markets (up 2.2 percent),reflecting strong demand for travel in the international regions. International yields are expected toincrease by 1.1 percent in 2007 and increase an average 1.3 percent a year over the balance of theforecast. In real terms, international yields are forecast to decline at an annual rate of 1.0 percent overthe forecast. The decline in real yields is based on the assumption that competitive pressures will con-tinue to exert pressure on carriers to hold the line on fare increases. In international markets, this takesthe form of expanded open sky agreements and new and existing global alliances.
FAA Aerospace Forecast Fiscal Years 2007–2020
36

Air Cargo
Historically, air cargo activity has moved in synch with GDP. Additional factors that have affected thegrowth in air cargo traffic include declining real yields, improved productivity, and globalization.Significant structural changes have occurred in the air cargo industry. Among these changes are thefollowing: air cargo security regulations by FAA and TSA; market maturation of the domestic expressmarket; modal shift from air to other modes (especially truck); increases in air fuel surcharges; growth ininternational trade from open skies agreements; use of all-cargo carriers (e.g., FedEx) by the U.S.Postal Service to transport mail; and increased use of mail substitutes (e.g., e-mail).
The forecasts of Revenue Ton Miles (RTMs) are based on several assumptions specific to the cargoindustry. First, security restrictions concerning air cargo transportation will remain in place. Second,most of the shift from air to ground transportation has occurred. Finally, long-term cargo activity will betied to economic growth.
The forecasts of RTMs were based mainly on models that relate cargo activity to GDP. Forecasts ofdomestic cargo RTMs were developed with real U.S. GDP as the primary driver. Projections of interna-tional cargo RTMs were based on growth in world GDP, adjusted for inflation. The distribution of RTMsbetween passenger carriers and all-cargo carriers was forecast based on an analysis of historic trendsin shares; changes in industry structure and market assumptions.
Total RTMs are forecast to increase 4.6 percent in 2007 and 6.1 percent in 2008. For the balance ofthe forecast period, total RTMs are forecast to increase at an average annual rate of 5.2 percent, basedmainly on economic growth. The forecast of 81.3 billion RTMs in 2020 represents an average annualincrease of 5.3 percent over the entire forecast period.
Domestic cargo RTMs are forecast to increase 2.7 percent in 2007 and 4.7 percent in 2008 driven bygrowth in the U.S. economy. Between 2008 and 2020, domestic cargo RTMs are forecast to increase atan average annual rate of 3.3 percent, based on projected U.S. economic growth. The forecast of 24.9billion RTMs in 2020 represents an average annual increase of 3.3 percent over the entire forecast peri-od.
The freight/express component of domestic air cargo is highly correlated with capital spending.Consequently, the growth of this component in the future will be tied to growth in the economy. Themail component of domestic air cargo will be affected by overall mail volume.
The all-cargo carriers have increased their share of domestic cargo RTMs flown from 65.4 percent in1997 to 79.4 percent in 2006. This is because of significant growth in express service by FedEx andUnited Parcel Service coupled with a lack of growth of domestic freight/express business for passengercarriers. There are a number of recent factors that account for the relative growth of the all-cargo sec-tor. One was the October 2001 FAA security directive that strengthened security standards for trans-porting cargo on passenger flights. Another factor was the inclusion of Airborne Express into the cargodata reported beginning in 2003. In addition, with passenger load factors at record levels, there is lessspace available for belly cargo. The all-cargo share is forecast to increase to 83.6 percent by 2020based on increases in wide-body capacity for all-cargo carriers and security considerations.
FAA Aerospace Forecast Fiscal Years 2007–2020
37

International cargo RTMs are forecast to increase 5.9 percent in 2007 and 7.0 percent in 2008 withgrowth of the world economy and expansion in trade with open skies agreements. For the balance ofthe forecast period, international cargo RTMs are forecast to increase an average of 6.3 percent a yearbased on projected growth in world GDP. The forecast 56.4 billion RTMs in 2020 represents an aver-age annual increase of 6.3 percent over the entire forecast period.
All-cargo carriers increased their share of international cargo RTMs flown from 54.5 percent in 1997 to65.5 percent in 2006. This increase has resulted from the demand for expedited service, increasedactivity from the war in Iraq, and the change in reporting of contract services. The all-cargo share isforecast to increase to 69.7 percent by 2020 based on increased capacity.
Commercial Aircraft Fleet
The number of commercial aircraft is forecast to grow from 7,626 in 2006 to 11,203 in 2020, an averageannual growth rate of 2.8 percent or 256 aircraft annually. The commercial fleet grows by a net 120 air-craft in 2007 and 152 aircraft in 2008; however, most of this growth occurs in low-cost carriers.
FAA Aerospace Forecast Fiscal Years 2007–2020
38
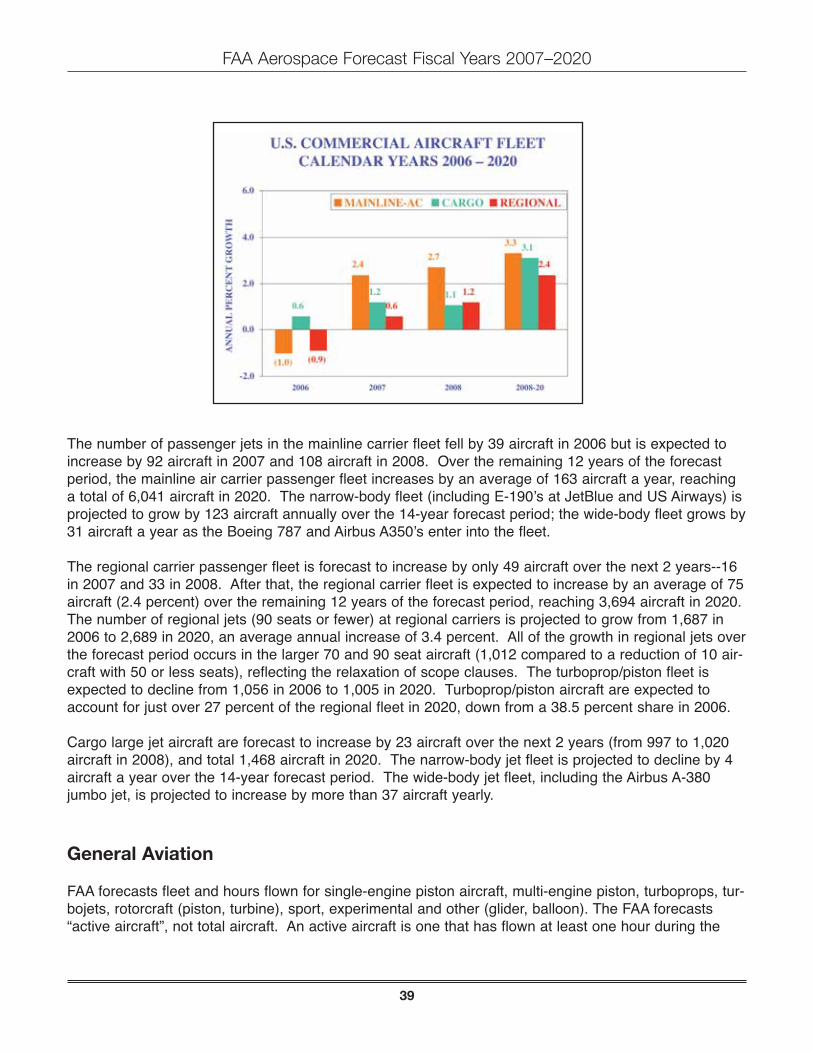
The number of passenger jets in the mainline carrier fleet fell by 39 aircraft in 2006 but is expected toincrease by 92 aircraft in 2007 and 108 aircraft in 2008. Over the remaining 12 years of the forecastperiod, the mainline air carrier passenger fleet increases by an average of 163 aircraft a year, reachinga total of 6,041 aircraft in 2020. The narrow-body fleet (including E-190’s at JetBlue and US Airways) isprojected to grow by 123 aircraft annually over the 14-year forecast period; the wide-body fleet grows by31 aircraft a year as the Boeing 787 and Airbus A350’s enter into the fleet.
The regional carrier passenger fleet is forecast to increase by only 49 aircraft over the next 2 years--16in 2007 and 33 in 2008. After that, the regional carrier fleet is expected to increase by an average of 75aircraft (2.4 percent) over the remaining 12 years of the forecast period, reaching 3,694 aircraft in 2020.The number of regional jets (90 seats or fewer) at regional carriers is projected to grow from 1,687 in2006 to 2,689 in 2020, an average annual increase of 3.4 percent. All of the growth in regional jets overthe forecast period occurs in the larger 70 and 90 seat aircraft (1,012 compared to a reduction of 10 air-craft with 50 or less seats), reflecting the relaxation of scope clauses. The turboprop/piston fleet isexpected to decline from 1,056 in 2006 to 1,005 in 2020. Turboprop/piston aircraft are expected toaccount for just over 27 percent of the regional fleet in 2020, down from a 38.5 percent share in 2006.
Cargo large jet aircraft are forecast to increase by 23 aircraft over the next 2 years (from 997 to 1,020aircraft in 2008), and total 1,468 aircraft in 2020. The narrow-body jet fleet is projected to decline by 4aircraft a year over the 14-year forecast period. The wide-body jet fleet, including the Airbus A-380jumbo jet, is projected to increase by more than 37 aircraft yearly.
General Aviation
FAA forecasts fleet and hours flown for single-engine piston aircraft, multi-engine piston, turboprops, tur-bojets, rotorcraft (piston, turbine), sport, experimental and other (glider, balloon). The FAA forecasts“active aircraft”, not total aircraft. An active aircraft is one that has flown at least one hour during the
FAA Aerospace Forecast Fiscal Years 2007–2020
39

year. The FAA uses estimates of fleet size, hours flown and, utilization from the General Aviation andAir Taxi Activity and Avionics Survey (GA Survey) as baseline figures upon which assumed growth ratescan be applied. This survey has been conducted annually since 1977. As noted previously, beginningwith the CY2004 Survey there were significant improvements to the survey methodology. Theseimprovements included conducting 100 percent samples for turboprops and turbojets, all rotorcraft, allaircraft in Alaska and all aircraft operating on-demand under Part 135. The changes resulted in thesample size nearly doubling. At the same time the survey methodology changed, large changes in boththe number of aircraft and hours in many categories occurred. It is unclear whether the large changesmentioned above are due to the methodological changes described. FAA is assuming that the changesobserved in the past two years of the Survey are in fact indicative of changes in the underlying popula-tion. As such, we believe that because of the methodological improvements, current estimates from theGA Survey are superior to those in the past and are used as the basis for our forecast. Because theSurvey is on a calendar year basis, the 2005 statistics are the latest available. Figures for 2006 areestimated based on other activity indicators and the forecasts of activity begin in 2007 and continuethrough 2020.
As the demand for business jets has grown over the past several years, the current forecast assumesthat business use of general aviation aircraft will expand at a more rapid pace than that forpersonal/sport use. The business/corporate side of general aviation should continue to benefit from agrowing market for new microjets. In addition, corporate safety/security concerns for corporate staff,combined with increased processing times at some U.S. airports have made fractional, corporate, andon-demand charter flights practical alternatives to travel on commercial flights.
The active general aviation fleet is projected to increase at an average annual rate of 1.4 percent overthe 14-year forecast period, growing from an estimated 226,422 in 2006 to 274,914 aircraft in 2020. Themore expensive and sophisticated turbine-powered fleet (including rotorcraft) is projected to grow at anaverage of 3.6 percent a year over the 14-year forecast period with the turbine jet fleet increasing at 6.0percent per year.
At the October 2006 TRB/FAA workshop, industry experts suggested the market for new microjets couldadd 500 aircraft a year to the active fleet by 2010. The relatively inexpensive twin-engine microjets(priced between $1 and $2 million) are believed by many to have the potential to redefine the business
FAA Aerospace Forecast Fiscal Years 2007–2020
40

jet segment by expanding business jet flying and offering performance that could support a true on-demand air-taxi business service. This year’s forecast assumes that microjets will begin to enter theactive fleet in 2007 (350 aircraft) and grow by 400 to 500 aircraft a year after that, reaching 6,300 air-craft by 2020.
The number of piston-powered aircraft (including rotorcraft) is projected to increase from 170,967 in2006 to 181,750 in 2020, an average increase of 0.4 percent yearly. Although piston rotorcraft are pro-jected to increase rapidly (5.7 percent per year) they are a relatively small component of this segment ofgeneral aviation aircraft. Single-engine and multi-engine fixed-wing piston aircraft, which are much morenumerous, are projected to grow at much slower rates (0.3 and -0.2 percent respectively) leading to thelow growth of the piston-powered fleet. In addition, it is assumed that relatively inexpensive microjetsand new light sport aircraft could erode the replacement market for traditional piston aircraft at the highand low ends of the market respectively.
Starting in 2005, a new category of aircraft (previously not included in the FAA's aircraft registry counts)was created: "light sport" aircraft. The forecast assumes registration of 5,600 aircraft over a 5-year peri-od beginning in 2006 including both newly built aircraft and conversions from ultralight trainers. Thisnew aircraft category is projected to total roughly 13,200 in 2020.
The number of general aviation hours flown is projected to increase by 3.4 percent yearly over the 14-year forecast period. Much of the increase reflects increased flying by business and corporate aircraftas well as steady if relatively small annual percentage increases in utilization rates for piston aircraft.Hours flown by turbine aircraft (including rotorcraft) are forecast to increase 6.1 percent yearly over theforecast period, compared with 1.3 percent for piston-powered aircraft. Jet aircraft are forecast toaccount for most of the increase, with hours flown expanding at an average annual rate of 9.4 percentover the 14 years. The large increases in jet hours result from the introduction of microjets, as well asincreases in the fractional ownership fleet and its activity levels. Fractional ownership aircraft fly about1,200 hours annually compared to roughly 350 hours for all business jets in all applications.
Very light jets (VLJs) are expected to function much differently than traditional turbojets. Because of this,FAA has made separate assumptions for traditional turbojets and VLJs. The assumptions underlyingthe very light jet (VLJ) forecast are vital for both fleet and hours flown. Assumptions are made for theentire VLJ fleet and also for the distribution of that fleet among air taxi use, private use and fractionaluse. For the various uses, assumptions are made about utilization rates which, along with fleet sizes,determine hours flown. Utilization rates for VLJs will vary by mission. VLJ air taxis are expected toaverage approximately 1,500 hours per year, fractionals 1,200 and private use 350. This results in anexpected utilization rate for all VLJs in 2020 of 1,067 hours. Traditional (non-VLJ) turbojets are expectedto average approximately 407 hours per year by 2020, since VLJs are expected to have a greater shareof their use in on-demand air taxi than the traditional turbojets.
FAA Aerospace Forecast Fiscal Years 2007–2020
41

The number of active general aviation pilots (excluding air transport pilots) is projected to be 506,097 in2020, an increase of almost 51,000 (up 0.8 percent yearly) over the forecast period. Commercial pilotsare projected to increase from 117,610 in 2006 to 130,590 in 2020, an average annual increase of 0.8percent. The number of student pilots increase from 84,866 in 2006 to 100,181 in 2020, an averageannual rate of 1.2 percent. In addition, FAA is projecting that 16,252 new sport pilots will be certifiedduring the forecast period. As of December 31, 2006, the number of sport pilot certificates issued was939, reflecting a growing interest in this new “entry level” pilot certificate that was only created in 2005.The number of private pilots is projected to total 219,655 in 2020, just 422 higher than the total in 2006.
FAA Workload Forecasts
There were 494 towered airports at the end of September 2006--263 FAA towers and 231 contract tow-ers. While the number of FAA towers is expected to remain constant at 263 in 2007, the number of FAAcontract towered airports is forecast to increase by 8 to 239. In 2006, aircraft activity at these 8 airportstotaled roughly 767,000 operations, with general aviation accounting for 95.4 percent of the total activity.
FAA and Contract Towers
Activity at the combined FAA and contract towers totaled 61.1 million operations in 2006, down 3.1 per-cent from 2005. Activity is projected to increase 2.2 percent in 2007, reflecting a surge in non-commer-cial activity, rise 2.7 percent in 2008, and increase 2.0 percent a year over the remaining 12 years of theforecast period, reaching 81.1 million operations in 2020. Total activity at combined FAA/contract towersis not expected to return to pre-9/11 levels until 2012.
Most of the growth over the 14-year forecast period results from increased commercial aircraft activity(up 2.3 percent annually). Air carrier activity is projected to increase 3.4 percent in 2007 as carriers add
FAA Aerospace Forecast Fiscal Years 2007–2020
42

back capacity following sizeable cuts in 2006, then rises 2.8 percent in 2008 as capacity increases, andincreases an average of 3.3 percent a year over the remaining 12 years of the forecast period.Commuter/air taxi operations are forecast to fall 0.4 percent in 2007 then rise 0.6 percent in 2008,before growing an average of 1.2 percent a year over the rest of the forecast period.
General aviation activity (down 3.0 percent in 2006) is forecast to increase 2.8 percent in 2007 and 3.5percent in 2008. For the balance of the forecast, general aviation activity at towered airports is project-ed to increase an average of 1.8 percent a year, to 43.7 million operations in 2020. Much of the growthin 2007 and 2008 results from the extra activity at the 8 new contract towers that was not in the previ-ous database. General aviation activity at combined FAA/contract towers is not expected to return topre-9/11 levels until 2014.
Military activity, which declined 3.1 percent in 2006, is forecast to rise 1.0 percent in 2007 and 0.7 per-cent in 2008. Activity levels are then held constant at the 2008 activity level (2.8 million) through theforecast period. The increase in 2007 and 2008 is because of activity at the 8 new contract towers.
Instrument operations at FAA towered airports (45.8 million) fell 2.9 percent in 2006. Instrument activityis projected to increase just 1.3 percent in 2007, as increases in air carrier and general aviation activityoffset declines in commuter/air taxi activity, and then rise 2.2 percent in 2008. For the balance of theforecast period, instrument operations grow an average of 2.7 percent a year, totaling 65.4 million in2020. Instrument activity at FAA towers is forecast to exceed pre-9/11 levels by 2012.
Over the 14-year forecast period, commercial aircraft instrument operations are forecast to increase at2.5 percent per year with modest increases in commuter/air taxi activity. General aviation instrumentoperations are projected to grow faster at 3.1 percent a year. After 2007, general aviation instrumentoperations are projected to grow 3.2 percent a year versus a 2.6 percent annual rate for commercialinstrument operations, reflecting the expected impact of the introduction of microjets to the general avia-tion fleet. Military activity is expected to remain constant at its 2007 level (2.6 million) of activitythroughout the forecast period.
FAA Aerospace Forecast Fiscal Years 2007–2020
43

En Route Centers
The number of IFR aircraft handled at FAA en route traffic control centers decreased 2.7 percent to 46.2million in 2006. All user groups except military saw declines in activity in 2006. The other user cate-gories – air carrier (down 2.4 percent), commuter/air taxi (down 6.1 percent), and general aviation(down 2.0 percent) fell at least 2 percent. Activity at en route centers is forecast to increase by 2.2 per-cent in 2007, with increases in air carrier and general aviation activity, then rises 2.6 percent in 2008 ascommuter/air taxi activity picks up. En route activity then increases by 3.2 percent annually over thebalance of the forecast period, reaching 70.3 million aircraft handled in 2020. Between 2008 and 2020,commercial activity is projected to increase at an average annual rate of 3.3 percent, reflecting increas-es in the commercial fleet and aircraft stage lengths. During the same period, general aviation activityis projected to grow faster, 3.8 percent a year, reflecting the expected impact of microjets and fractionalactivity. Military activity is held constant at the 2007 activity level throughout the forecast period.
Activity at FAA en route centers is growing faster than at FAA towered airports because more of theactivity in en route centers is from the faster growing commercial sector, and high-end general aviationflying. Much of general aviation activity at FAA towered airports, which is growing more slowly, is localin nature and does not impact the centers.
FAA Aerospace Forecast Fiscal Years 2007–2020
44