F/6 DAMAGE AND COMMUNICABLE DISEASE … report documentation page read instructions before...
75
7AD-AO9G 612 R AND D ASSOCIATES MARINA DEL REY CA F/6 6/5 COLLATERAL DAMAGE AND COMMUNICABLE DISEASE WITH PARTICULAR REFE--ETC(U) OCT 78 H H MITCHELL DNAOOI-7-C-O009 UNCLASSIFIED RDA-TR-107004-011 DNA-5430T NL IIIIIIIIIIIIfflfflf EEIIEEEEEEEEEE EEEIIEIIIIIIIE EEEEEEEEEEEEI IEIIIEEEIIIEEE
Transcript of F/6 DAMAGE AND COMMUNICABLE DISEASE … report documentation page read instructions before...

7AD-AO9G 612 R AND D ASSOCIATES MARINA DEL REY CA F/6 6/5COLLATERAL DAMAGE AND COMMUNICABLE DISEASE WITH PARTICULAR REFE--ETC(U)OCT 78 H H MITCHELL DNAOOI-7-C-O009
UNCLASSIFIED RDA-TR-107004-011 DNA-5430T NLIIIIIIIIIIIIfflfflf
EEIIEEEEEEEEEEEEEIIEIIIIIIIEEEEEEEEEEEEEIIEIIIEEEIIIEEE

DNA 5430T
COLLATERAL DAMAGE AND COMMUNICABLEDISEASEWith Particular Reference to Tactical Nuclear Warin Europe
0 Harold H. Mitchellm! R&D Associates
P.O. Box 9695Marina del Rey, California 90291
31 October 1978I
Topical Report for Period 1 October 1977-31 October 1978
CONTRACT No. DNA 001-78-C-0009
APPROVED FOR PUBLIC RELEASE; N
DISTRIBUTION UNLIMITED. MAR 2 3 1981
ATHIS WORK SPONSORED BY THE DEFENSE I\N.JLEAR AG[N 'y
UNDER RDT&E RMSS CODE B3100784C4 1 99O)A, rpOO36 H2590D
b> Prepared for
Aj Director-j
- DEFENSE NUCLEAR AGENCY
Washington, D. C. 20305
813 20 073~.511 1

Destroy this report when it is no longerneeded. Do not return to sender.
PLEASE NOTIFY THE DEFENSE NUCLEAR AGENCY,ATTN: STTI, WASHINGTON, D.C. 20305, IFYOUR ADDRESS IS INCORRECT, IF YOU WISH TOBE DELETED FROM THE DISTRIBUTION LIST, ORIF THE ADDRESSEE IS NO LONGER EMPLOYED BYYOUR ORGANIZATION.
.oN4.
4

UNCLASSIFIEDSECURITY CLASSIFICATION OF THIS PAGE
READ INSTRUCTIONSREPORT DOCUMENTATION PAGE BEFORE COMPLETING FORM
I. R !O ? MR 1 2. GOVT ACCI SSII)N NOl 3 RI C IV11 N I S CA TAl 00 NUMII P IIf
4.TTE5. TYPE of P #a PEf4IOL ((CVF RE 1)
*LLATPAI,_AMAd AN opical ~etefor PeriodSpLTPLJMG AND MMUNICABLE 7
EASE I 1 Oct 77- 31 Oct 78 i
th p~al cular ofrence to Tactical P~~MNiO. ~61 ~M4HvIu e Wr- ,a r in *.rope& " 4ARDA-TR-07904-#0ll
)Harold H. /vitchell / DNA'6I,1-78-C-0009
9. PERFORMING ORGANIZATION NAME AND AD ~TSs 10. PROGRAM ELEMENT. PROJECT, TASK
R & DAssocatesAREA & WORK~ UNIT NUMBERS
P. 0. Box 9695 U/ubtask P990AXDBOI-36Marina del Rey, California 90291 '
11. CONTROLLING OFFICE NAME AND ADDRESS! 12. RETPORT DATE
Director . / 31 octoaer -1978Defense Nuclear Agency'h13F4rROPAEWashington, D.C. 20305 7
14. MONITORING AGENCY NAME & ADDRESS (If different fronr, ConrIolinq Office) 15. S& e (of tis report)
UN CLASSI F IED
15a. DECLASSIFICATION/DOWNGRADiNGSCEDULE
16. DISTRIBUTION STATEMENT (oftifs report)
Approved for public release; distribution unlimited.
I? DIST RIFRJT ION STATEF MY NY Ir? thle ahtc,rt entered *n hiI'rrr 20. it Odffe-,t Ir~ .... evcr, I)
18. SLIPP F MN tA F yN, ,r s
This work sponsored by the Defense Nuclear Agency under RDT&E RMSSCode B310078464 P99QAXDBOO136 H2590D.
19, KEY WORPrS ICont ,r ,, *v eerse side of necessary and Identify by blicknoreI
Nuclear Warfare EpidemicsTactical Weapons Civilian PopulationsCollateral DamageDisease Predictions
20. ARS R AC T I( ontinue on reverwse ,.if necessary anid identify by hIiyL 'i,,be, I
-This report examines the question of whether major epidemics arelikely to follow a tactical nuclear war in Europe. The relation-ship between the bombing campaign and the increase in communicablediseases during World War II (with special emphasis on Germany) isexamined, as well as the limited data relating nuclear radiationand the incidence of disease. The report tentatively concludesthat, barring a breakdown in society, major epidemics arc notlikely to result.
DD 1 JAN 73 1473k. UNCLASSIFIEDEDITION OF 1 NOV 65 IS OBSOLETE SECURITY CLASSIFICATION OF THIS PAGE

UNCLASSI FIEDSECURITY CLASSIFICATION OF THIS PAGE(When Data Entered)
UNCLASSIFIED1E C IY CL ASSI FIr ATION I)F THIS PZ ArF IP,., W.h'

PREFACE
A substantial effort has been expended in evaluating the col-
lateral damage which might result if tactical nuclear weapons
were used in the European Theater. These assessments have
focused on the impact of prompt weapon effects (i.e., blast,
thermal, and nuclear radiation) on the civilian population.
In addition to these prompt effects, however, nuclear weapons
can disrupt the life support functions of the communities.
Water and sewer lines can be broken, hospital facilities and
drug supplies destroyed and food supplies diminished and possibly
contaminated. A situation can easily be established in which
major epidemics may spread through these disrupted areas causing
widespread deaths.
An accurate assessment of the impact of these "secondary" effects
is difficult (perhaps impossible) to make. However, experience
from past wars can provide some guidance to estimate the poten-
tial consequences.
Av8 111 g /Jt
t SP
--. - -. -!.C- t ! O l
.....--

TABLE OF CONTENTS
Page
Preface ............. ........................ 1
1. Introduction ....... .... ................... 7
2. Recent German Communicable Disease Statistics . . 12
3. Disaster Epidemiology ..... ............... 19
3.1 The U.S. Strategic Bombing Survey(U.S.S.B.S.) (Germany) ... ........... 19
3.1.1 Typhus Fever .... ............. 203.1.2 Diphtheria ..... .............. 223.1.3 Scarlet Fever .... ............. 253.1.4 Whooping Cough .... ............ 263.1.5 Measles ........ ................. 283.1.6 Poliomyelitis .... ............. 303.1.7 Epidemic Encephalitis .. ......... 303.1.8 Epidemic Meningitis .. .......... 303.1.9 Influenza and Pneumonia ......... 303.1.10 Gastrointestinal Disease . ....... 333.1.11 Typhoid Fever .... ............. 333.1.12 Paratyphoid Fever ... ........... 333.1.13 Bacillary Dysentery .. .......... 353.1.14 Bacterial Food Poisoning . ....... 353.1.15 Summary of U.S.S.B.S. Study ...... 37
3.2 The League of Nations Survey .. ......... 413.3 The Greek Experience of 1941-1942 ...... 443.4 Netherlands Occupation, World War II ..... .. 443.5 U.S. Strategic Bombing Survey--Japan ..... .. 50
4. Radiation and Communicable Disease . ........ 53
4.1 Hiroshima and Nagasaki ExperienceImmediately Following the Bombing ..... 53
4.1.1 Nagasaki ..... ............... 534.1.2 Hiroshima ..... ............... 54
4.2 Long-Term Follow-up of Hiroshima and NagasakiPopulation Involved in the Atomic Bombing 56
4.3 The Marshallense Experience .. ......... 584.4 Experimental Studis . ................... 5
5. The Special Case of Tuberculosis ... .. ......... 61
6. Collateral Damage and Communicable Disease . . .. 61
References ......... ...................... 67
2

LIST OF TABLES
Table Page
1 Examples of Epidemics - Worldwide .... ....... 8
2 Cases of Selected Contagicus DiseasesSubject to Compulsory Registration ........ . 13
3 Comparison of Disease Incidence: FederalRepublic of Germany vs\United States ...... . 14
4 Bacillus-Excreting Agents as per 31December of Each Year .... ............. 15
5 Deaths from Selected Contagious DiseasesWest Germany, 1967-1971 .... ............ 18
6 Diseases Included in U.S.S.B.S. Study ..... 20
7 Annual Case Incidence of Typhus Feverin Seven German Cities in 1938, 1940,1942-43-44 (Rates per 100,000 Population;Annual Basis) ...... ................. 21
8 Reported Cases of Typhus Fever in Magdeburgin 1943 and 1944 ...... ................ 21
9 Annual Case Incidence of Diphtheria in SevenGerman Cities in 1938, 1940, 1942-43-44(Rates per 100,000 Population; AnnualBasis) ........ ..................... 23
10 Diphtheria Mortality Rates ... ........... 23
11 Annual Case Incidence of Scarlet Feverin Seven German Cities in 1938, 1940,1942-43-44 (Rates per 100,000 Population;Annual Basis) ...... ................. 26
12 Annual Mortality Rates from ScarletFever (Combined Cities) (Rates per 100,000Population; Annual Basis) ... ........... 27
13 Annual Case Incidence of Whooping Coughin Seven German Cities in 1940, 1942-43-44(Rates per 100,000 Population; AnnualBasis) ........ ..................... 27
3

LIST OF TABLES (CONT.)
Table Page
14 Annual Mortality from Whooping Cough(Combined Cities) (Rates per 100,000Population; Annual Basis) ... ........... 28
15 Annual Mortality from Measles inThirteen German Cities in 1938, 1940,1942-43-44 (Rates per 100,000 Population;Annual Basis) ...... ................. 29
16 Annual Case Incidence of Poliomyelitis,Epidemic Meningitis, and Epidemic Encepha-litis in Seven German Cities in 1938, 1940,1942-43-44 (Rates per 100,000 Population;Annual Basis) ...... ................. 31
17 Annual Mortality from Influenza and Pneumoniain Thirteen German Cities in 1938, 1940,1942-43-44 (Rates per 100,000 Population;Annual Basis) . . . . . . . . . . . . . . . . .
18 Annual Case Incidence of GastrointestinalDisease in Six German Cities in 1938, 1940,1942-43-44 (Rates per 100,000 Population;Annual Basis) . . . . . . . . . . . . . . . . .
19 Annual Case Incidence of Typhoid Fever inSeven German Cities in 1938, 1940, 1942-43-44(Rates per 100,000 Population; AnnualBasis) .......... ..................... 4
20 Annual Case Incidence of ParatyphoidFever in Six German Cities in 1938,1940, 1942-43-44 (Rates per 100,000Population; Annual Basis) . . . . . . . . . . .
21 Annual Case Incidence of Dysenteryin Six German Cities in 1938, 1940,1942-43-44 (Rates per 100,000 Pop)-ulation; Annual Basis) ..... .............
22 Annual Case Incidence of Bacterial FoodPoisoning in Six German Cities in 1938,1940, 1942-43-44 (Rates per 100,000 Pop-ulation; Annual Basis) .... ............... 7
L%4

LIST OF TABLES (CONT.)
Table Page
23 Effects of Bombing on Infectious DiseaseIncidence in Germany, WWII ... ........... 38
24 Effects of Bombing on Infectious DiseaseMortality in Germany, WWII ... ........... 39
25 Summary of Highest Morbidity RatesRecorded (Rates per 100,000 Population;Annual Basis) ...... ................. 40
26 Communicable Disease: Cases Notifiedin Germany (Altreich) .... ............. 43
27 Numbers of Deaths in Athens andPiraeus of Both Sexes by Cause .. ......... . 46
28 Netherlands Increase of the Death-Ratein 1941 (As Percentage of 1939) (Exclusiveof Direct War Casualties) ... ........... 47
29 Communicable Diseases: Cases Notifiedin the Netherlands ....... ............... 48
30 Netherlands Increase in Certain ContagiousDiseases Since 1939 (Index Figures) ...... 49
31 Netherlands Increasing Number of DeathsAccording to Different Causes (in IndexFigures) ........ .................... 49
32 Communicable Diseases Included inThis Survey ....... .................. 50
33 Hospital Cases of CommunicableDiseases - Nagasaki ..... .............. 55
34 Prevalence and Incidence of ActiveTuberculosis Cases ..... ............... 62
35 Number of New Cases and Deaths ofTuberculosis in Schleswig-Holstein,1939-1946 ........ ................... 63
5

SECTION 1. INTRODUCTION
This paper reviews tha historical incidences of major epidemics
and attempts to assess the impact of wartime disruption on the
frequency of disease outbreaks. Given the poor state of pre-
dictability of epidemiology for peacetime epidemics, what we
really attempt here is a rendering of judgment based on:
1. The historical record (especially World
War II experience).
2. The baseline statistics defining the
communicable disease picture in Germany
in recent years.
3. The knowledge now available to meet the
expected problems.
It is correct to be concerned about the possible damage that
might be done by communicable diseases, along with the other
damaging modalities expected during a war. Communicable dis-
eases, sui generis, have been responsible for the greatest
disasters in history and as a secondary consequence of wartime
disruption, they have usually been responsible for greater
morbidity and mortality than physical-mechanical injuries.
Table 1 is an arbitrary selection of examples, arranged chrono-
logically, of various epidemics [1]. When the world was ignorant
of communicable disease causation, the classical scourges killed
people in the millions (lack of personal and public hygiene,
etc., also contributed mightily). One aspect of the table is
S. Garb and E. S. Garb, Disaster Handbook (2nd Edition), Springer
Publishers, 1969.
7hIECMNlG PAGN 5A I-NOT la 1£-M

Table 1. Examples of Epidemics - Worldwide
I ESTIMATE OFDATE TYPE PLACE DEATHS POPULATIONI KILLED (PEPCENT)'
500-550 BUBONIC PLAGUE EUROPE & ASIA 100,000,000 20-50
1348 BUBONIC PLAGUE WORLD 25,000,000 25-75
1349-1350 BUBONIC PLAGUE ENGLAND 1,200,000 20-30
1418 BUBONIC PLAGUE PARIS 50,0001518 SWEATING SICKNESS ENGLAND MILLIONS 30-501520 SMALLPOX MEXICO MILLIONS 50
1603 BUBONIC PLAGUE LONDON 34,000 14
1628 TYPHUS LYONS, FRANCE 60,000
1665 BUBONIC PLAGUE LONDON 100,000 271711 BUBONIC PLAGUE BRANDENBERG 215,000
1722 BUBONIC PLAGUE MARSEILLES 40,000 30
1831 CHOLERA MOSCOW 4,500
1875 MEASLES FIJI ISLANDS 40,000
1915 TYPHUS SERBIA 150,0001918-1919 INFLUENZA WORLDWIDE 20,000,000
1920 DYSENTERY POLAND 5,000
1947 CHOLERA EGYPT 11,000
1966 MALARIA BRAZIL 2,000
1967 BUBONIC PLAGUE NE0AL 171968 BUBONIC PLAGUE INDONESIA 40
1968 CHOLERA PAKISTAN 37
1968 POLIO TURKEY 98

especially significant, and that is the later reported epidemics
which show involvement of deaths below 100. The fact that
these are worthy of being recorded as epidemics gives an indi-
cation of the startling changes which have taken place over
historical time. Another item worthy of mention is the entry
for 1918--the influenza pandemic which was responsible for
20,000,000 deaths world-wide--this disease is still a threat
to the world. Influenza epidemics still occur with very high
attack rates, but there has not been a repeat of the high
death rates seen in 1918.
Wars have always brought increases in epidemic disease, both
to the armies in the field and to the civilian populations
involved in wartime disruptions. It is apparent from the his-
torical record that most of the toll of communicable diseases
during wartime occurred before the development of modern sani-
tation and bacteriology.
Germany, during the Thirty Years War (1618-1648), had severe
epidemics of typhus fever and plague, and it has been estimated
that the population fell from 16-17 million down to 4 million.
This estimate has been challenged, and a 50 percent reduction
in population was made as being more nearly the truth. Esti-
mates of population loss for more localized regions are prob-
ably more accurate. For example, the population of Bohemia
went from 3 million down to 780,000; Wirttemberg from 448,000
(1622) down to 97,000 (1648); Hesse sustained a loss of 25
percent of its population [2].
During the Napoleonic Wars, in the years 1813-1814, the German
population was approximately 20,000,000 and the cases of typhus
F. Frinzing, Epidemics Resulting from Wars, Oxford Press, 1916.
9

fever amounted to approximately 2,000,000, with about 200,000
deaths. In the city of Berlin, with a population of 155,000
people, there were 1,184 deaths from typhus in 1813 (out of a
total of 7,012 deaths) and 545 deaths from this disease in
1814 [2].
During the Franco-German War, there was an extensive smallpox
epidemic. In all of Germany (population approximately 41
million), there were approximately 170,000 cases of smallpox
in the years 1871-1872 [2].
Given the history of epidemic diseases, professionals in the
fields or medicine and public health have registered surprise
at the statistical description of Germany (and Japan) during
World War II regarding communicable disease experience. Epi-
demic disease was much less of a problem than was anticipated.
The absence of large-scale epidemics during the famine years
in Greece (1941-1942) and the Netherlands (1941-1943) was also
unexpected.
K. A. Western [3] has stated that "since the end of World War
II, there has not been a single outbreak of the classical com-
municable diseases in Europe, Canada and the United States,
which can be attributed to a disaster." Thus, it has been
necessary to rely principally on the experience of World War
II to provide the basic data for this study.
The use of the extensive data from World War II in Germany
provides an important plus to this study. Epidemic disease
3K. A. Western, "Epidemiology of Communicable Diseases inDisaster Situations (Summary)," Ann. Soc. Belge Med. Trop.,Vol. 56, 1976, p. 199.
10

spread and control are highly dependent on the "social fabric"
as it relates to personal hygiene, obeying of public health
directives and countless other small but significant details.
The closest we can come to assessing this aspect of the problem
is to assume that Germany today is, in this regard, similar
to the Germany of the 1940s.
The approach of this report, then, is to utilize the World War
II experience as extensively as possible for bounding the
problem of communicable disease occurrence. The current sta-
tistics on peacetime communicable disease incidence will be
described, as this will be the "base line" for predicting the
effects of future wartime disturbance.
The one qualitatively new feature which, except for Hiroshima
and Nagasaki, was not present during World War II, is that
of nuclear radiation. The effect of radiation exposure on
communicable disease incidence will be addressed.
Ii , I

SECTION 2. RECENT GERMAN COMMUNICABLE DISEASE STATISTICS [4-91
It is important to have a firm description of the usual endemic-
epidemic base for communicable diseases if one is to make
judgments or predictions of the future course of these diseases
under wartime conditions. The tables and figures presented in
this section document that Germany is a remarkably "clean"
country with regard to most communicable diseases. In the years
-just prior to 1973, the total number of reported contagious
diseases has remained fairly constant, within a range of 70,000-
80,000 per year (exclusive of tuberculosis and venereal disease).
Table 2 shows the disease incidence for several communicable
diseases for the years 1967-1972. Notably absent from the record
are the former scourges, such as cholera, smallpox, plague and
typhus fever.
Scarlet fever, infectious hepatitis and salmonellosis are the
diseases with the highest reported incidence and meningococcus
meningitis and infectious meningitis are also diseases of rel-
atively high prevalence.
In Table 3, a comparison is made (for the year 1973) between
the U.S. and the Federal Republic of Germany for selected
diseases as reported to the World Health Organization. It is
apparent from the overall impression given by this chart that
although there are differences between the two countries, Ger-
many is quite adequately handling its communicable disease
problems, if one uses the U.S. experience as a reference
standard.
Table 4, which directs attention to the bacterial carrier
problem, shows that there is a declining trend in the total
12

('.4 - I Lo) t Io LO) -c co. 0l C) C m me c) w r- m~ m
C - ' -~ m~ - MO Me 10 I,- - CMj J Me 100 CDr- CO m 1O (Y) CD 1O (n Cl)
r- CeO CM .C l) m
4- C3) C\M4-,
.0 CD cc m0 C) " r- r- 1O C) N. C) - CMJ 0) 0) 1O 1) 0Y)3 C:) - N. - o- C'.) LO 10 O C:) 00 t- CMj C\ c % 10
V)A>O 0O :T o,, 00 3 ..c'j Cc3 - i-fC)C.
ru E
a)
co rM N. ) -0C r- C) CO0 J-'~ u- 0'. M 0 C) re) - M c 0 0-D
4- I'D -0L l L) - k - O l
r-- mO 10 C - - -1 LO) 1C 00 r-01 r M -co C'. - 0) " ) :Zr CD ko M e cc CD M e)0 n
S4-j0a) 0)
-C; cc C~ t 0 )t0 r - M-. -0 C 0 0 O k
(o0 Ce) CMi
a)0- (
Q)CL ~(l - (
LU LUO >~
(Ai L) L L/ U U(
-A 0 U (A M: - Q L ) ( ( A( - LUJ0j .-.. LL =4 0 a- - IL C)LJ A
) 0 VL) LL V) 01- V) 0 0 W F- V
LL I- LL >- J A >D F- L ) LU 7- (A LUt0) C.. 0 C- L. DL 9-.. V) IL) () ,. 0-O j U-- LU - C >- M Li~ - L LU = O >- -Z LU ul. ' 0-. ! C) w = ofC < O .) C) CD Cn CD LU I- - I
J 0J L. af Of -~ >. LUJ af LU
(A <- <.. C >- 0 (A l E - M~ - = -Cccc
CLCLW - V : K D13OM

W t V
L) ~
cc. 4 0 C) C
-l * r. ('mm ~ r ' ~\ ~ ~ 0~ -
-- CI'I ( A .- ' j C. A I. I
C))
C)2 V) w 0 CLiL I
r-a 0 C) 0
C) 0 t ) * .
>~ . 0I- I-0 a- ~
s- E -.
EA (D m I L LI C,~~
0~ to 0wII . 0
'A L) = IA -. LZ
~ A L L 0. "dZ w -IA ~ ~ ~ ~ L C) C) 11-Od, L I . I I I~~~~- Jl wI I .~ . 0 0 ~ ~ .
w C
=11 4
- ~ N IA 0- I NI D NI WW N

ZJ0~J ( 3' .~. .rc -
2"-,C 0
(n - '--3'
EL - .~ (NJ , (N. - , - V. -
w -~ - -tO
3',.-C3'' I
U, -
w ~-
3'. 'p3'o~ 3''" (NJ (NJ 3'~ 3' 3'(~~ (N. -3'rrI3' 3'r.JCNJ3'3'3'0(N4--~
o .~ 3'~.3'3'3'r---c.-3'--C
4 .X .- 3' NJ
S.-(00.) ("3'
3'J45 0~-3'C--3'(fl('J3'C-.- C'. 3'
u 3'J.~JJ 3'- 3' C'. 3' 3' (03' C'.
'0 Jr =
wo (03' 3' 3' 3' 3' 3' (003'
3' (N. 3'- 3' 3'- ('~ 3' 3' ('.3' 3' (NJ JO 3'
S.- -
0)-oC) a .3' ~3' 3'3'3'3'.m43'3'3' a.U ~. .~ ~ 3' 0
C) - 3' 3'
.3' ('.3' 3' 3' 3' 3' 3' 003' 3'3' C. 3' 3' 3' 3' 3' (N (N. 3' 3' 3' C'.
3'3'-3'3'r~0- 3' -5- -, . -
C) - C'. - 3'
0.(A 3'' 3' 003' 3' 3' (NJ 3' C'. 3'
to (0' 3' 3' 3' Jr 3'- 03' 3' 3' 3' 3''3' 3' 3'3' ('.3' 3'r-..--CNJN. 3'
U, - 3' - 3'3'3'
CC) - Jr 3' 3' 3' 03' (N- 3' 3' (N- -
3' ~
(-4 - (NJ - 3';-4 3'
C-~ 3' 3' ('.3' ~- a ~ 3' 03''3' 003' 3' 3'- 3' 03' 3' 3'4.) '3' O 3'3'-3'3'3'3' (NJ (NJ (N. C'.
C) : - - C'. - C5- __
U
Li.) 3' 3' 3' 3' 03' 3' 3' C'. 3' 3' 3'!JO 3'3'3'043'3' ('43' (NJ 3' 3'3' .03' (03' (03' 3' 3' (NJ (NJ C-- 3'
U, .
- 'NJ - 3'
('.3' 3' 3' 3' 3'- 3' ('43' 3'U -~ C-. O~ (0-3' (003'- (NJ
CoCO - C'. - 0,
C) - 3' 3'
Jr 3' 3' ~: -C. JJJ J.- 3' - 3'
0 I 3' 23 3'- Jr La3' , ' , - -I.- C C t.j Jr 03' 233'
- 3' - Jr0 023 C Jr 3' 3' 23 Jr C3' 3' 3' Jr 1 Jr 4 Jr C Jr 3'
.4 3' 0 1 03'.-LaU43'4 0-- SJ.4.-43'3'J.403' 3' 3' Jr'.3 3' - 3' 0 3' Jr 3' 3' 3' 3' 03' I Jr ~ Jr I 3' 3' 3' 3' 3' 3'
15

number of carriers from 10,326 in 1964 to 7,388 in 1971. It
is known that Germany has had an elaborate system for monitoring
and controlling its typhoid carriers since the end of World WarII.
Figure 1 is an interesting graphic display of the trends of
seven communicable diseases for the years 1948-72. There are
dramatic falls shown for poliomyelitis and diphtheria (immuni-
zation programs) and a steady and significant downward trend
for typhoid fever (carrier control program). Scarlet fever is
still quite high and does not show a significant downward trend.
The curves of infectious hepatitis, enteritis (mainly salmonel-
losis) and infectious meningitis are in uptrends.
It is worth noting that the mortality rate for contagious dis-
eases (including tuberculosis and influenza) has reached a low*
figure of 15 deaths per 100,000 (1971). One-hundred years
ago the rate was 2,500-3,000 per 100,000 and 20 years ago (1952)
the rate was 45 per 100,000. Table 5 records the deaths for
selected contagious diseases for the years 1967-1971.
The latest figures available to the author were in StatisticalAtlas on Public Health in the Federal Republic of Germany, 1974.Although not much change is anticipated in the overall picture,more recent statistics should be obtained and monitored as anongoini addenclum to this report.
16

' I I I ' I ' ' I . . 1 '
200
100 SCARLET" ..... " "... .... FEVER
50
30 INFECTIOUS HEPATITIS. -.. ...
% % ENTERTIS (MAINLY /1 0' / \" S A L M O N E L L A ) - 1 ' J ----\ ' -' -_..< ,F" -:--:',JINFECTIOUS
5 MENINGITISU
TYPHOID
0\ --. __FVER
0.3
0.1
INFANTILE
0.03
0.01 J I I I I I I ,1948 50 55 60 65 70
Figure 1. Development of Selected Contagious Diseases Subject to
Compulsory Registration for West Germany, 1948-1972
1
17

Table 5. Deaths from Selected Contagious Diseases
West Germany, 1967-1971
DISEASE 1967 1968 1969 1970 1971
TUBERCULOSIS 6,424 6,298 5,850 5,047 4,363
INFLUENZA 1,668 6,311 5,958 7,192 1,761
TYPHUS ABDOMINALIS 8 8 7 6 12
PARATYPHUS 14 6 6 8 9
OTHER SALMONELLA 25 20 17 39 31
DYSENTERY 3 4 4 4 6
SCARLET FEVER (+STREPT.) 1 9 12 9 9
DIPHTHERIA 4 5 4 3 5
MENINGOCOCCAL INFECTIOUS 118 119 133 177 198
WHOOPING COUGH 41 37 46 35 24
TETANUS 84 102 84 82 64
WEIL'S DISEASE 9 7 5 1 6
POLIOMYELITIS 6 - 7 1 3
INFECTIOUS MENINGITIS 34 31 29 20 16
MEASLES 53 116 104 79 84
INFECTIOUS HEPATITIS 76 106 93 68 79
MALARIA 6 5 13 3 6
18

SECTION 3. DISASTER EPIDEMIOLOGY
3.1 THE U.S. STRATEGIC BOMBING SURVEY (U.S.S.B.S.) (GERM ANY)
Following the end of World War II, a U.S. medical team attempted
to assess the effect of aerial bombing of civilian population
on the incidence and mortality of communicable diseases. This
study [10] is an important source of data for assisting in making
judgments on the current collateral damage issue.
As stated in the introductory remarks to the U.S.S.B.S. study:
Training, experience, and knowledge would leadone to expect a tremendous increase in communi-cable diseases to epidemiologic proportions whenvisualizing the destruction of German cities,but there were no major epidemics [10].
There were, of course, many epidemics during the years of the
war, and an attempt was made to assess whether the bombing
itself increased the incidence of the disease. The problem is
complicated by the need to determine what effects should be
attributable to the bombing. Besides the obvious one of de-
struction of property and the wounding and killing of people,
there are the related ones of shelter living, nutritional status,
availability and distribution of medical supplies, etc.
The study was mainly statistical, but the opinion of reliable
German medical authorities was also sought. The diseases
studied are shown in Table 6.
10The United States Strategic Bombing Survey: The Effects ofBombing on Health and Medical Care in Germany, Medical Division,1947.
19

Table 6. Diseases Included in U.S.S.B.S. Study
1. TYPHUS 8. EPIDEMIC MENINGITIS
2. DIPHTHERIA 9. INFLUENZA AND PNEUMONIA
3. SCARLET FEVER 10. TYPHOID FEVER
4. WHOOPING COUGH 11. PARATYPHOID FEVER
5. MEASLES 12. DYSENTERY
6. POLIOMYELITIS 13. BACTERIAL FOOD POISONING
7. EPIDEMIC ENCEPHALITIS
3.1.1 Typhus Fever
Typhus fever is not endemic to Germany. It was most likely
introduced by the immigration of foreign workers from eastern
European countries where the disease was endemic. The labor
camps provided living conditions conducive to the spread of
typhus fever. Under pressure of wartime conditions, especially
the bombing raids, the absolute separation of the native pop-
ulation from the foreign work force broke down, and typhus
spread to the German civilians. As indicated in Table 7, there
were no cases of typhus fever reported for the years 1938-1940
in the seven cities examined. In 1942, the case rate reached
0.23 (per 100,000) and climbed to 5.51 (per 100,000) in 1944.
The analysis of the typhus fever data for Magdeburg is particu-
larly instructive (see Table 8). In 1943, no air raids were
made on Magdeburg and only two cases of typhus appeared in the
resident population, although this disease existed in consid-
erable numbers in the foreign population. The bombinq raids
ot 1944 seem to be associated with the epidemic which occurred
among the German civilians.
20

Table 7. Annual Case Incidence of Typhus Fever inSeven German Cities in 1938, 1940, 1942-43-44(Rates per 100,000 Population; Annual Basis)
CITY 1938 1940 1942 1943 1944
Bochum 0.00 0.00 0.00 1.22 1.11
Duisburg 0.00 0.00 0.00 0.00 0.00
Frankfort 0.00 0.00 0.00 0.38 5.72
Hamburg 0.00 0.00 0.06 0.81 0.98
Kiel 0.00 0.00 0.00 0.35 0.00
Maqdeburq 0.00 0.00 1.16 0.89 39.28
Nuremberg 0.00 0.00 1.08 0.58 7.76
Combined Cities 0.00 0.00 0.23 0.65 5.51
Table 8. Reported Cases of Typhus Fever inMagdeburg in 1943 and 1944
DATE NUMBER OF CASES REPORTED AMONG
YEAR MONTH RESIDENTS DISPLACED PERSONS
1942 December 0 1
1943 January 0 5
February 2 46
March 0 43
April 0 1
October 0 0
1944 January 0 6
February 0 37
March 0 5
April 8 19
May 74 46
June 4 12
December 0 1
21

The survey concluded as follows:
In summary, it can be stated that although typhusfever did not assume epidemic proportions of anymagnitude, a relationship between aerial bombingsand outbreaks in German nationals cannot be dis-puted. The bombings led to an increased inter-mingling between Germans and foreigners by virtueof the fact that public shelters were shared byboth groups alike and that evacuation could notbe carried out separately for Germans and foreignersbecause of the disruption of transportationfacilities. The decrease in cleanliness broughtabout by longer working hours and lack of soapmust also be taken into account [10].
It is worth noting that the German authorities decided against
an extensive mass immunization program against typhus. They
felt that the basic cleanliness of the German population
(absence of lice) was sufficient protection and that public
health surveillance would control any outbreak.
3.1.2 Diphtheria
Interpreting the data on diphtheria in Table 9 is difficult
because there was an epidemic in Germany in 1937-1938, which
persisted and gave higher than usual rates into 1940.
The 1944 high rates are therefore even more significant since
they are compared with years that were themselves above usual
norms. The bombing data suggest that incidence of the disease
rose after periods of heavy bombings. Some of the rise was
considered to be part of the natural history of the disease, but
all those concerned with the problem in Germany agreed that
aerial bombing had an indirect effect on the incidence and
course of the disease. (Table 10 shows the rise in mortality
rates during the war years.)
22

Table 9. Annual Case Incidence of Diphtheria inSeven German Cities in 1938, 1940, 1942-43-44(Rates per 100,000 Population; Annual Basis)
CITY 1938 1940 1942 1943 1944
Bochum 503.18 571.90 303.91 281.79 363.70
Duisburg 399.08 290.39 297.40 225.87 379.19
Frankfort 128.00 315.09 143.71 158.29 202.82
Hamburg 201.25 253.33 246.98 272.85 341.91
Kiel 206.81 109.32 441.68 229.27 237.42
Magdeburg 363.05 309.00 397.00 363.05 425.48
Nuremberg 321.44 208.89 366.62 476.97 562.95
Combined Cities 263.00 281.01 280.70 277.15 351.05
Table 10. Diphtheria Mortality Rates
YEAR PERCENTAGE
1938 4.5
1940 4.6
1942 4.8
1943 6.0
1944 7.1
23

The role which air warfare played in the morbidity and mortality
of diphtheria was explained as follows:
By 1943, the German population was fatigued.The resistance of the people had been loweredowing to poor living conditions and to constantcuts in their food rations. They had becomecareless. Although a law had been passed earlyin the war providing that people ill with commu-nicable diseases could go only to those bunkersand shelters which were designated for isolation,and if they were not near such a shelter or bunkerthey were to remain in their homes, the law wasnot always obeyed. For instance, a mother wouldnot leave her sick child home and 9o to the bunkerherself; she took the child along. Thus, childrenill with diphtheria were taken to bunkers andshelters where they spread the disease, partic-ularly to adults who had not been immunized andwere thus vulnerable to it.
The changes in morbidity in diphtheria as comparedwith the picture of the disease as seen before theair war was started were:
1. A higher incidence among adults.
2. A more malignant and rapid course.
3. A mortality which averaged 4.5 percent formost of Germany, but in some places went upto 7 percent.
4. Multiple and serious sequelae such as myocardialdamage, paralyses of the soft palate, and poly-neuritides.
These polyneuritides were particularly resistantto therapy as were the other complications ofdiphtheria. Large doses of thiamin chloride weregiven without effect, and Professor Stepp of Munich,Germany's leading expert on vitamins and nutrition,stated in a personal interview that the whole subjectof complications was conditioned by the poor nutri-tional state of the patients. He did not thinkthe virulence of Klebisella diphtheriae had changed,a belief which was borne out of bacteriologic studies.
24

Additional causative or contributory factorswere thought to be:
1. That too many people who suffered from"sore throats" did not seek medicalattention. First of all, they were hardpressed and rushed, doctors were busy,and transportation off schedule, and,second, absenteeism was blazoned by thepress and all state and Nazi party agenciesas unpatriotic--so too many "sore throats"were allowed to go untreated and to spread
the pathogenic organism.
2. That compulsory immunizations caused anincreased incidence in adults. Some publichealth men with somewhat old-fashioned con-ceptions of immunology (as Dr. W. Bolt ofCologne) claimed that many immunized childrenwere carriers and infected nonimmunized adults.
This was hotly debated by several well-qualifiedpublic health authorities. Thus, Dr. HansEller, public health officer of Augsburg,showed that in his city the increase of diph-theria was noticeable but by no means alarming,nor were there any complications such asobserved in other cities. The reason for thiswas thought to be that compulsory immunizationagainst diphtheria was started in 1935, andthat, therefore, active immunity of a consid-erable degree had been produced in the pop-ulation of Augsburg. The argument then, boilsdown to one conclusion: immunization was startedtoo late in most German cities [10].
3.1.3 Scarlet Fever
There was an epidemic of scarlet fever in Germany in 1941, and
a high incidence persisted into 1942 and 1943. The general
conclusion was reached that no relation existed between bombing
attacks and the incidence of scarlet fever. Nevertheless, some
isolated instances suggested that air attacks did indeed raise
the expected rates (see Table 11).
25

Table 11. Annual Case Incidence of Scarlet Fever inSeven German Cities in 1938, 1940, 1942-43-44(Rates per 100,000 Population; Annual Basis)
CITY 1938 1940 1942 1943
Bochum 230.25 403.33 586.97 437.92
Duisburg 278.58 286.22 692.34 482.60
Frankfort 160.36 187.72 542.74 581.28
Hamburg 188.27 263.14 719.42 446.36
Kiel 262.12 322.13 753.11 465.51
Magdeburg 192.79 241.05 715.01 618.22
Nuremberg 169.13 140.44 393.81 635.86
Combined Cities 200.65 256.00 652.92 505.31
In Munich, as a striking example, the number ofreported cases before the air attacks averaged20 a week. Since 1942, the weekly number ofreported cases averaged 100. Reasons for thissharp rise were thought to be overcrowding inhomes, at work, and in air raid shelters [10].
Table 12 showing combined-city mortality rates indicates that
the war years yielded higher mortality rates, although thistrend was downward from 1942-1944.
3.1.4 Whooping Cough
The year 1940 was an epidemic year for whooping cough, yielding
a high mortality rate as shown in Tables 13 and 14. The table
also reveals increasing mortality rate trends for the years
1942-1944, although these years were all lower than the epidemic
year of 1940.
26 ilk.

Table 12. Annual Mortality Rates from Scarlet Fever(Combined Cities)
(Rates per 100,000 Population; Annual Basis)
YEAR PERCENTAGE
1938 1.73
1940 2.60
1942 9.08
1943 7.08
1944 5.94
Table 13. Annual Case Incidence of Whooping Cough inSeven German Cities in 1940, 1942-43-44
(Rates per 100,000 Population; Annual Basis)
CITY 1940 1942 1943 1944
Bochum 244.45 128.99 93.37 25.98
Duisburg 451.80 127.38 246.75 164.01
Frankfort 446.42 177.81 66.14
Hamburg 321.97 127.89 145.59 182.99
Kiel 693.46 195.03 366.20 170.59
Magdeburg 344.44 308.52 124.46
Nuremberg 321.65 138.09 168.22 109.41
Combined Cities 377.40 159.87 193.61 140.95
27

Table 14. Annual Mortality from Whooping Cough(Combined Cities)
(Rates per 100,000 Population; Annual Basis)
YEAR PERCENTAGE
1938 3.51
1940 5.90
1942 2.50
1943 4.18
1944 4.27
The reason for this increase in mortality wasthought to be the frequent disorganization ofhome and hospital life, the disruption of heatingfacilities, and other factors resulting fromaerial warfare. The infants and small childrenhad to be moved from the wards to shelters orbunkers as often as two or three times daily,which practice led to an increase in the durationof the disease and in its complications [10).
There is no indication of a relationship between the actual
intensity of the air attacks and the level of whooping cough.
3.1.5 Measles
The incidence of measles did not change much in Germany during
the war years, as shown in Table 15. Sporadic outbreaks, appar-
ently unrelated to bombings, occurred in several cities. The
year 1944 showed a high mortality rate largely due to the
increased deaths in epidemics in two cities (Bremen and
Dusseldorf).
28

Table 15. Annual Mortality from Measles inThirteen German Cities in 1938, 1940, 1942-43-44
(Rates per 100,000 Population; Annual Basis)
CITY 1933 1940 1942 1943 1944
Augsburg 3.28 1.09 4.81 1.08 0.00(70)
Bochum 1.27 4.20 z.28 0.02 0.66(10,
Bremen 0.86 2.54 1.39 5.09 9.82(10)
Cologne 3.52 2.22 1.38 0.43(5) 2.59(8)
Dortmund 0.75 0.94 1.72 2.65 0.80(9)
Duisburg 2.75 3.47 4.00 3.53 3.06(10)
Duesseldorf 3.55 3.31 2.90 1.34(9) 6.00(7)
Hamburg 0.48 0.71 1.31 1.48 0.82(10)
Kiel 0.40 0.36 0.35 0.35 2.61(10)
Magdeburg 1.83 0.88 1.45 1.48 1.04(10)
Mulheim 2.22 1.44 3.73 3.33 0.00(10)
Nuremberg 2.40 0.50 2.42 2.62 0.84(10)
Solingen 0.00 0.00 1.62 1.72 3.22(10)
COMBINED CITIES 1.70 1.63 1.91 1.82 2.46(10)
29
mod'.

3.1.6 Poliomyelitis
1938 was an epidemic year for poliomyelitis in Germany, and
rates were higher on the whole for that year than any of the
subsequent war years (see Table 16). No correlation is claimed
between increased incidence of the disease and air attacks.
3.1.7 Epidemic Encephalitis
The incidence of epidemic encephalitis, although lowest in 1938,
did not increase excessively during the years 1942-1945 over
the incidence for the year 1940 (see Table 16). No relationship
was found between incidence of the disease and bombing intensity.
3.1.8 Epidemic Meningitis
1939-1941 were epidemic years for epidemic meningitis. Thisaccounts for the high incidence rates for 1940 (see Table 16).
The incidence rates for the years 1942-1944 are within normal
limits in comparison with the year 1938.
German physicians and public health officers stated that the
incidence and mortality of the disease did not change during
the years of bombing. This result could be considered unexpected
in view of the changed conditions of life regarding crowding
and shelter occupancy.
3.1.9 Influenza and Pneumonia
As shown in Table 17, the mortality from influenza and pneumonia
was low during the years of bombing. Only the city of Duisburg
showed a significantly high rate in 1944, but its rate in 1938
was also high. Careful analysis of the bombing data seemed to
30

- 10 ID ~ m COa
u, - (~u m c cu
(NJ c -o a , o ~ a
co '. mr c, m
0 ~ m w0 CD m 'm c
- 0 c , C 0 C
CDl In D azC ca u, - 0 ' . ).
0 a)m ' C5~0a)
a'
C L I z~l c0 0 m0 0 1 0.
-0 0 0 (N C (-
00 ~ I m 'o OCDD
-c 00 .0 s0~
CL) *. - 00 0cc
V) 4-O)m 0
C 0O .Un *C
- CD*.
E~ C -o 0 y , m ~ acu 0(a- u (J% N
a) 4'c rI -DCLC 0 CD m O (C. CD 0 IDI
-0 C I c;I-C
(a 00) u,(( -
I-*-> 4-)
Q) mc a- m 0D Zr ( '
E3 1

Table 17. Annual Mortality from Influenza and Pneumonia inThirteen German Cities in 1938, 1940, 1942-43-44
(Rates per 100,000 Population; Annual Basis)
CITY 1930 1940 1942 1943 1944
AUGSLURG 60.17 70.52 65.69 69.76 79.61
BOCHU!i 116.56 93.65 99.02 75.03 110.30
BREMEN 56.49 64.99 53.33 74.27 101.15
COLOGNE 80.89 115.84 97.78 115.22(5) 84.63
DORTMUND 109.19 99.12 97.32 97.51 111.61LJL;ISRURG 147.77 118.57 124.98 125.62 167.62
j IiJ' O RF 100.31 134.66 95.19 98.96(9) 86.51
r AIrG 84.31 126.46 104.29 95.78 81.78
68.14 127.54 50.23 55.40 71.41
85.28 68.83 72.60 73.20 81.43
ILLICH 124.06 105.35 118.66 107.35 112.64
82.40 108.98 89.37 88.05 74.79
SOLINGEN 121.20 123.00 90.81 65.47 74.13
COH1I.ED CITIES 92.38 110.53 92.99 92.11 92.91
32
I.1

confirm that, even with the low rates, some of the mortality
figures were correlated with the increases in bombing attacks.
3.1.10 Gastrointestinal Disease
The group of gastrointestinal diseases (typhoid fever, para-
typhoid fever, dysentery, bacterial food poisoning) showed no
rise, but, in fact, fell during the years of aerial warfare,
as indicated in Table 18. Some individual cities showed
increases at various times, but there was no trend for the
group as a whole.
3.1.11 Typhoid Fever
No significant increase in typhoid fever was noted during the
war years, as indicated in Table 19. Sporadic outbreaks were
usually traced to foreign laborers who had contaminated a
water supply.
The German public health system had an effective "typhoid
carrier" control program, which undoubtedly contributed to the
C (itr(,l ot spread of this disease.
3.1.12 Paratyphoid Fever
A modest increase in paratyphoid fever was observed during the
years 1942 and 1943, as shown in Table 20, which may be cor-
related with increased air attacks. Sporadic outbreaks of this
disease were also attributed to contamination of sonic water
supply by foreign workers.
OIL*

Table 18. Annual Case Incidence of Gastrointestinal Disease inSix German Cities in 1938, 1940, 1942-43-44(Rates per 100,000 Population; Annual Basis)
CITY 1938 1940 1942 1943 1944
Bochum 15.93 16.46 14.00 51.38 23.21
Duisburg 21.31 26.87 81.27 64.57 37.24
Frankfort 19.45 21.08 18.05 21.85 5.09
Hamburg 29.66 44.77 35.62 25.10 17.17
Madgeburg 10.67 30.76 51.99 24.30 26.92
Nuremberg 15.86 34.74 26.38 25.37 34.23
Combined Cities 23.17 35.75 36.28 30.78 21.30
Table 19. Annual Case Incidence of Typhoid Fever inSeven German Cities in 1938, 1940, 1942-43-44(Rates per 100,000 Population; Annual Basis)
CITY 1938 1940 1942 1943 1944
Bochum 3.82 4.84 4.23 14.68 10.50
Duisburg 4.58 2.78 3.46 10.60 1.50
Frankfort 3.27 0.72 7.66 1.71 1.59
Hamburg 3.10 1.24 2.26 2.75 3.43
Kiel 9.22 20.41 1.39 10.45 2.95
Magdeburg 2.44 1.76 4.07 2.37 5.74
Nuremberg 1.20 0.76 5.11 3.50 4.94
Combined Cities 3.47 2.92 3.65 4.77 3.83
34_ __

Table 20. Annual Case Incidence of Paratyphoid Fever inSix German Cities in 1938, 1940, 1942-43-44(Rates per 100,000 Population; Annual Basis)
CITY 1938 1940 1942 1943 1944
Bochum 4.14 3.55 2.28 28.54 5.53
Duisburg 2.29 3.01 24.78 4.82 0.38
Frankfort 3.45 1.62 2.19 7.03 0.32
Hamburg 5.06 4.84 6.96 4.63 3.24
Madgeburg 1.22 1.76 2.03 1.78 1.32
Nuremberg 9.37 4.03 0.27 0.29 7.06
Combined Cities 4.56 3.67 6.53 6.09 2.97
3.1.13 Bacillary Dy~entery
Bacillary dysentery was a common and fairly mild disease with
no deaths. As shown in Table 21, significant increases were
noted in World War II, presumably due to the decrease in sani-
tation.
3.1.14 Bacterial Food Poisoning
There was no overall increase in the incidence of this disease
during the war years 1942-1945, as shown in Table 22. No cor-
relation of cases with bombings could be established.
In summary, gastrointestinal diseases as a group did not appear
to increase significantly in incidence as a result of the bombing
of German cities. Some sporadic outbreaks did occur but without
definite attribution to bombing damage.
35

Table 21. Annual Case Incidence of Dysentery inSix German Cities in 1938, 1940, 1942-43-44(Rates per 100,000 Population; Annual Basis)
CITY 1938 1940 1942 1943 1944
Bochum 5.10 8.07 7.49 7.75 6.63
Duisburg 5.73 12.74 50.37 38.23 32.73
Frankfort 12.73 12.43 5.65 13.11 2.54
Hamburg 20.96 37.80 25.98 17.32 9.32
Madgeburg 4.57 25.48 45.89 20.15 19.80
Nuremberg 5.29 29.19 19.92 19.83 16.94
Combined Cities 13.42 26.61 25.14 18.48 12.88
Table 22. Annual Case Incidence of Bacterial Food Poisoning inSix German Cities in 1938, 1940, 1942-43-44(Rates per 100,000 Population; Annual Basis)
CITY 1938 1940 1942 1943 1944
Bochum 2.87 0.00 0.00 0.41 0.55
Duisburg 8.71 8.34 2.66 10.92 2.63
Frankfort 0.00 6.31 2.55 0.00 0.64
Hamburg 0.54 0.89 0.42 0.40 1.18
Magdeburg 2.44 1.76 0.00 0.00 0.00
Nuremberg 0.00 0.76 1.08 1.75 5.29
Combined Cities 1.72 2.55 0.96 1.44 1.62
36

3.1.15 Summary of U.S.S.B.S. Study
Table 23 represents an overall summary of the U.S.S.B.S. study.
The combined statistics show that there were no devastating
epidemics and also no universal trend in all diseases toward
greater increase, as the war progressed. Some diseases in 1944
had greater and some lesser incidence than in the prewar years
of 1938. Also, the year of highest incidence varied for each
disease. The impression is one of an increased overall incidence
during the war years, with the numerical results dominated by
the large relative incidence of diphtheria, scarlet fever and
whooping cough.
Approximately the same impression is given by Table 24, which
summarizes the mortality rates for five diseases. The war
years showed moderately higher rates for the war years without
any actual trend toward increase as the war progressed.
Table 25 summarizes the highest mortality rate recorded for each
disease by city and year. This attempts to show the limits of
severity encountered in specific locations without the diluting
effect of averaging for all the population involved in the
study. As expected, diphtheria, scarlet fever and whooping
cough are dominant with influenza-pneumonia and combined gastro-
intestinal disease following with considerably lower rates.
Comparing the highest rate recorded with the average combined
cities' rate for prewar 1938, one can see the factor increases
involved. The rarer diseases tend to show greater values (from
"infinity" for typhus because of zero incidence in 1938 and
9.3 for epidemic encephalitis down to 1.8 for influenza-pneu-
monia).
37
LI

CD LoA zj LA m~ (n C'J CCI- 09 - .0 Cmt c L CS C~j C) \i 00
CY) M~
C)LL
C:)C) LAA - - C\j ko - C)
C) .4t 1 :WC:) m~ C) N. Lo m~ - C) C'~i C) ko
Li) - - r C) al cn) C'.j
(a) LU V)-
V~ ) c'.J I-j o r C ) C
<o m CC) C\. " m -- CD m o ~-I 00 Lo LA m)
U LU
L3
- ) C) - CD CD C'IJ LO "' LA r--CD C) C) C) - C\j m~ C)~ t,-
0 0) C) P-LL - C\J C) N. LA 0)a - 00 LA N- m~
C)r ~ C)j
0 ) -1k C)u C\J ('.4
4- U ~4-C LUJ LU
~ V)
aJL
V-= , - L.) Acz~ ~ ~ LL ))j= >
V) L L i-ca- *L 4 LUI
a- C ) LA '4LU -j wCA M LU F L- co
a- LU L c C) - LU - V) X:LU ~LU ) = -(= CLU LU. cc C
cm V) ::c 0 -C) L
38

ClI-
C) m- C) 0zi 0- 0 C\ CC)a) C) I:- r C : c- 00 'i c .
CD (n CMd
c' ko co q) m- g
0 mi 0 m- C) U -C
4- a; C\:
CM :r.o . o .
-. - C C C m~ m~ r-a >. C cOC) tD 00 .0 Lt) (C)
M CM CM LO , C kC)0) - -- CMJ
0*
04-' r- - - C). M C Mclm CMi
U 4-'
WLU
4-0 LU LDUL
LjJ -.J
C=, LU-2~L (D f D c
LI) LU F- L LUJLUI LUJ L) LL
- - W D V)J co92 - <c C ) cc L U X
(-) = LU C)
39

40 Cw .01
CCC) CC
cc m
0 - =C
- C
4j CCC
C=) cl-I CC ccCC
4J
Ln CC - cCC
Ln C~ f C C C CC C C m C C C
C>- ,C)4J
i)~ C C M 0
CD -aI C
t; --
W. C3.1
C) ~ ~ ~ c CDV ~z 0 =.
CA)V) a44n I
*~~~-)~0 o C, Q CC C,
C 4 C Cl C C Cv C
4040

The 2.14, 3.75 and 4.93 factor increases for diphtheria, scarlet
fever and whooping cough are of interest because of the high
basic rates from which they escalate. With regard to the
influenza-pneumonia figures, it should be noted that this is a
mortality rate; nevertheless, the increase of the rate by a
factor of 1.8 is significant as this is a disease classification
of high incidence.
The increased factor of 3.5 for "combined" gastrointestinal
disease is worthy of comment. One would have expected this,
a priori, to have been much higher given the amount of dis-
ruption of sewage and water supply systems and the envisioned
lowering of sanitation standards in the handling of food under
wartime conditions.
3.2 THE LEAGUE OF NATIONS SURVEY
The following observations have been taken from the League of
Nations Survey [11].
For most contagious diseases, an increase in thenumber of cases notified began from the time ofthe prewar mobilization and has definitely expandedsince the outbreak of hostilities. This is partic-ularly the case as regards scarlet fever and diph-theria, for which record figures were notified in1942 and 1943 [see Table 26].
The increase in the number of cases of meningitispreceded the war and after 1940 an improvement asregards the epidemic outbreak was observed.
llY. M. Briand, Health in Europe--A Survey of the Epidemic and
Nutritional Situation, Bulletin of the Health Organization,League of Nations, Vol. 10, No. 4, 1943-1944.
41

Typhoid and paratyphoid fevers showed an appreciablerise from 1942. Dysentery, already abnormally highbefore the war, remained high during the war. Germancivilians showed an increase only in the mild formof dysentery caused by Sonne bacillus.
The increase in endemic contagious diseases isprimarily due to mixing of the population andthe increase in communal living brought on bywartime changes.
The arrival of persons from rural areas and alsofrom the countries of Central Europe into theindustrial centers is another principal cause forthe increase in some contagious diseases (especiallytyphus fever). Typhus fever spread was limitedbecause of the small numbers of body lice existingin the German civilian population.
From the figures and indications available, itappears that, on the whole, the health situationin Germany is favorable; that though extensivemovements of the population have provoked anincrease in common contagious diseases, this isa temporary phenomenon, unaccompanied by anyserious increase in fatality from those diseases.
Although no statistics are available on the 12million or so foreigners (prisoners and civilians),their health situation is reported to be very bad(a reflection on their bad housing and sanitaryconditions, etc.).
As shown in Table 26, the composite epidemic indexrose from a base standard of 100 (1928-1938 median)to a high of 295.7 by 1942.
Using 1937-38 as a base (approximately 140), theepidemic index went up by somewhat more than afactor of two (to 295.7) by 1942. It fell back to253.9 in 1943.
42
mo

S-i
4 01N 4.4 In
-~~ ~I Ln N . .. 4o - '
10 L0
LA
c~c -1 m.. .. N
0 0' c o W) m 0t
Q. - VI 1. - 1 .- I
04 N N 40-40 4043

3.3 THE GREEK EXPERIENCE OF 1941-1942
The following paragraphs have been excerpted from Reference 12:
World War II caused severe dislocations inGreece with a country-wide famine, duringthe years 1941-1942. Overall statisticsfor the country are not available but theAthens-Piraeus (population 956,813 in 1940census) area has been reported on.
The Greek experience, consisting of a faminewhose acute effects lasted two years (May1941-April 1943) in a war-involved country,was not accompanied by any severe epidemicdisease increase.
During the famine years, there was a markedincrease in 'violent deaths' which includesdeaths due to famine (see Figure 2). Thesenility deaths also were augmented by afamine component. The figure also indicatesa rise in deaths due to infectious disease butthis was obviously moderate.
Table 27 data indicate that the infectiousdisease deaths increased but that there wereno large scale epidemics. There was one smallepidemic of typhus and one of malaria in 1942.Tuberculosis death rates also rose considerablyin 1942, as did typhoid fever.
3.4 NETHERLANDS OCCUPATION, WORLD WAR II
The following paragraphs have been excerpted from Reference 13:
12V. G. Valaoras, "Some Effects on Famine on the Population of
Greece," The Milbrook Memorial Fund Quarterly, Vol. 24, 1946,p. 215.
13C. H. Bourne, Starvation in Europe, G. Allen and Unwin, Ltd.,London, 1943.
44

VIOLENT DEATHS INCLUDE FAMINE DEATHS, AND SENILITY DEATHSARE UNDOUBTEDLY AUGMENTED BY A FAMINE COMPONENT
7
VIOLENT DEATHS
6 iSENILITY ETC.
RESPIRATORY ANDaDIGESTIVE CAUSES
z5INFECTIOUS DISEASES
0
t 4
" -LL0
YEAR
Figure 2. Numbers of Deaths by Broad Groups of
Causes in Athens and Piraeus, 1940-1943
45
M ......... . -

LI),
Ir -~cc an cc m u-0 C-- ccI D- c -c
ccce. - c
c- ue-c cc 'occ m- C ccc cc c
%o: L11C', me cc~ cc m cc'- D cc ko Z e
oy CD c> C:, 'o c - cc Cc n cc cen k C' c c cc n ~ n cc CC
I C
a-c' cc cc n I e-c'~ In en ~ cc c en -cc e c
n CeV C zo - r C- OD en In
4-. Ir
I)l cc c r en C ,( ~ C cc c'-c e cc G
IC, ' ~ e ccr I - c c , '.
4.In C, crC'7 ,- I I
~~fl c-z-0.

The combination of deficient diet, along with thenumerous other hardships of the occupation, wasresponsible for an overall increase in the deathrate in 1941 as shown in Table 28. Morbidityand mortality rates from communicable diseasealso rose during the war (Netherlands had thelowest prewar rates in Europe).
Table 28. NetherlandsIncrease of the Death-Rate in 1941
(As Percentage of 1939)(Exclusive of Direct War Casualties)
Children Under 4 j 31 Percent
Children 5-14 27 PercentAdolescents 43 Percent
Adults 14 Percent
Table 29 shows the number of cases reported forthe years through 1943, for nine diseases. Usingthe 1928-38 median number of notified cases toequal 100, a composite epidemic index is calculatedwhich shows a rise to 565.6 for 1943 from a 75.7low in 1937. The total number of cases reportedin 1937 was 12,527 and this rose to 93,548 by1943.
Using 1939 as an index year, the morbidity ratesfor seven contagious diseases are compared for theyears 1940-42 in Table 30. There is a ten-foldrise in diphtheria which probably has to be atleast partially explained by an interruption inusual immunization programs. The six-fold increasein dysentery is also significant.
Looking at death rates (Table 31), there was anapproximate doubling (1941 over 1939) for influenzaand for 'contagious diseases' (exclusive ofinfluenza and tuberculosis). Deaths from diarrheaand enteritis increased by 54 percent.
By modern standards, the rise in the morbidityand the mortality of contagious diseases wasconsiderable. Nevertheless, there were nodevastating epidemics during the war years inthe Netherlands, even for the year 1944 whichwas even more stressful than any of the yearsthrough 1943.
47

'D 2D'
cc
41
ci)cc 0> C,0
4)Ci)- 0
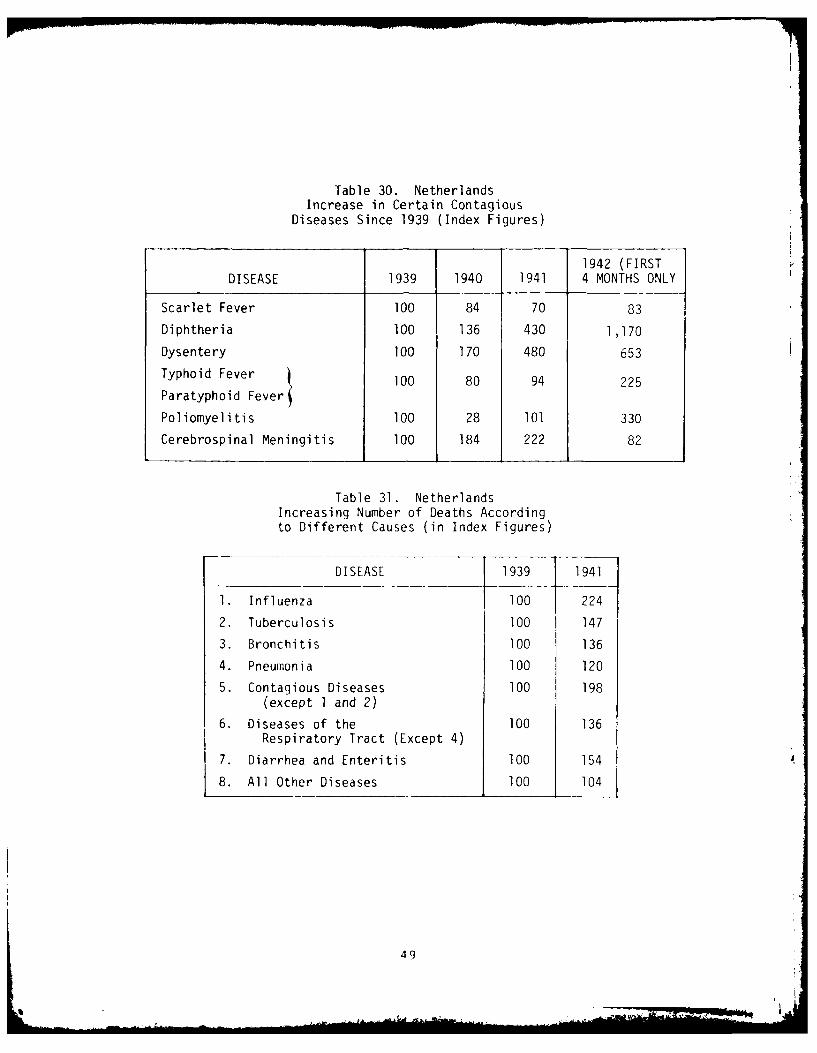
Table 30. NetherlandsIncrease in Certain Contagious
Diseases Since 1939 (Index Figures)
1942 (FIRSTDISEASE 1939 1940 1941 4 MONTHS ONLY
Scarlet Fever 100 84 70 83
Diphtheria 100 136 430 1,170
Dysentery 100 170 480 653
Typhoid Fever 100 80 94 225
Paratyphoid Fever
Poliomyelitis 100 28 101 330
Cerebrospinal Meningitis 100 184 222 82
Table 31. NetherlandsIncreasing Number of Deaths Accordingto Different Causes (in Index Figures)
DISEASE 1939 1941
1. Influenza 100 224
2. Tuberculosis 100 147
3. Bronchitis 100 136
4. Pneumonia 100 120
5. Contagious Diseases 100 198(except I and 2)
6. Diseases of the 100 136Respiratory Tract (Except 4)
7. Diarrhea and Enteritis 100 154
8. All Other Diseases 100 104
49

3.5 U.S. STRATEGIC BOMBING SURVEY--JAPAN
The following paragraphs have been excerpted from Reference 14:
This survey of the effects of bombings on com-municable diseases in Japan was done in a similarmanner to the German survey. Six cities wereincluded in the survey, including Kyoto whichwas not bombed and, therefore, represented a
'control' city for estimating bombing effects.The communicable diseases included in the surveyare listed in Table 32.
Table 32. Communicable Diseases Included in This Survey
1. Dysentery 5. Typhus Fever
2. Typhoid Fever 6. Scarlet Fever
3. Paratyphoid Fever 7. Diphtheria
4. Smallpox 8. Meningococus Meningitis
Although it does not appear useful to report this study in
detail, several observations made in the report are worth
noting:
An outstanding incidence of dysentery occurred inNagoya in 1945. Extensive bombing in May and Junepreceded the outbreak which began in July, peakedin August and extended into October.
Kobe had an extremely serious epidemic of typhoidand paratypnoid fever in the summer of 1945. Therate began to rise in June--the month of heaviestbombing. The peak disease rate in August was sixtimes the average August rate of the previous fouryears.
1 4 The United States Strategic Bombing Survey: The Effects of
Bombing on Health and Medical Services in Japan, MedicalDivision, June 1947.
50

The peak typhoid-paratyphoid rates for Yokohamadid not correlate with bombing directly. It was,however, associated with previous bombings thatdamaged water mains, etc., that were still unre-paired.
An epidemic of typhoid or paratyphoid fever inKyoto (which was not extensively bombed) mayhave been associated with wartime shortagesrelating to water-treatment devices and mate-rials.
We have noted an increased incidence of typhoidand paratyphoid fever during the bombing periodin four of the six cities covered by this study.The fact that one of these four cities was Kyoto,which was not bombed, points to the possibilityof casual factors other than bombing being oper-ative in the other three cities also. However,in spite of this possibility, conditions producedby bombing seem to be closely associated withthe outbreaks in these cities.
It is noted that the incidence of enteric diseasesduring the bombing period in Japan is very muchhigher than in Germany. The combined dysenteryrates for six surveyed German cities ranged from13 to 27 cases per 100,000 persons per year andfor the Japanese cities the range was 74 to 204.For typhoid and paratyphoid fever, German rateswere 7 to 11 and Japanese rates were 72 to 185cases per 100,000 persons per year. This indicatesthe very high incidence of these enteric diseasesin Japan as compared with their place in the com-municable disease picture of Germany. Dysenteryepidemics with peak monthly rates such as thatof Nagoya for June 1945 of 3,500 cases per 100,000persons per year were unheard of in Germany. Thepeak monthly dysentery rate noted in the courseof the survey of nine German cities was approximately250 cases per 100,000 persons per year for thecity of Duisburg.
Similarly the report of bombing in Germany showsno record of a typhoid fever epidemic comparableto that of Kobe in the summer of 1945 with itspeak rate during August of 1,827 cases per 100,000persons per year. Several outbreaks are reportedfor the nine German cities covered by the surveybut none uf them exceed a rate of 120 cases per100,000 per year.
51

Diphtheria was quite prevalent and revealed arapidly rising tendency in the six cities sur-veyed and in Japan generally. The 1945 Japaneserate was 125 cases per 100,000 persons per year.
Japan had a rising rate for many years with amarked acceleration in 1943 and 1944. Associationwith wartime conditions, generally, is possible,but not specifically with bombing.
Meningococcus meningitis rates for the years 1941-1944 are not remarkable. 1945, however, showsconsistently higher rates for several cities andfor Japan generally. These rates are considerablyhigher than those reported in the German survey.The highest rate in Germany was 1.9 per 100,000cases per year (Bochum, 1942) compared to 6.3(Kyoto, 1945) for Japan. Crowding and populationmovements, etc., are associated with rising inci-dence of this disease.
Japan had a low and decreasing scarlet feverrate durinq the period from 1941 to 1945 and thereis no evidence of increase in the incidence ofthis disease during the bombing period. Thecontrast with the German experience is striking.The German rates were about ten times as high asthe corresponding Japanese rates.
war conditions produced increased incidenceof typhus in the cities studied and in Japan asa whole, but bombing as a separate factor did nothave a prominent part in bringing about the increase.Selected labor force units were responsible in amanner similar to the foreign labor force originof typhus fever in Germany.
Of the eight diseases under observation, the onlyones showing an increased case fatality rate during1945, according to the record of Tokyo, Osaka, Kobe,Nagoyi and Kyoto, were the two children's diseases,diphtheria and scarlet fever. Ekiri also showedevidence of an increased 1945 fatality rate inthree cities for which information on this diseasewas available. (Ekiri is a dysentery-like diseaseof children which exists only in Japan.)
52
' . . . . .. .. .. . . 'A *li f . .. .. .N l l . .... . . .. . .. . . I

SECTION 4. RADIATION AND COMMUNICABLE DISEASE
4.1 HIROSHIMA AND NAGASAKI EXPERIENCE IMMEDIATELY FOLLOWINGTHE BOMBING [15]
Japan required that the following diseases be reported on a
weekly basis by each city and prefecture:
1. Dysentery
2. Typhoid Fever
3. Paratyphoid Fever
4. Typhus Fever
5. Smallpox
6. Diphtheria
7. Scarlet Fever
8. Epidemic Meningitis
9. Cholera
10. Plague
The following two subsections report information from the U.S.
Strategic Bombing Survey.
4.1.1 Nagasaki
In the three months following the bombing of Nagasaki, no major
outbreak of epidemic disease was recorded. The only significant
observation was a four-fold increase in dysentery cases in
October of 1945 over that of October 1944.
1 5The United States Strategic Bombing Survey: The Effects ofAtomic Bombs on Health and Medical Services in Hiroshima andNagasaki, Medical Division, June 1947.
53
- -o

Two cases of typhoid and paratyphoid fever were reported for
September and October of 1945. This compares with 14 for
September and October of 1944 and 13 for the two months before
the bombing.
No cases of scarlet fever or meningococcus meningitis were
reported since the bombing and only 10 cases of diphtheria.
Correcting for the population reduction, this still represents
a decrease from earlier experience.
A few cases of smallpox developed in a neighboring village in
September and a revaccination program was instituted (vaccina-
tion program had been discontinued in 1943).
Cholera, plague and typhus were not endemic in recent years
and no cases were reported following the bombing.
Starting with the week of 14 October 1945, the U.S. Military
Government required daily reporting on hospital cases of com-
municable disease. Although reporting was incomplete (and
contains some duplication of cases), the data in Table 33
"bear out the belief of the U.S. Government officers that
there were no serious outbreaks of communicable diseases within
the city."
4.1.2 Hiroshima
In Hiroshima all epidemic disease data were destroyed and none
collected following the bombing. The prefectural health officer
in charge of infectious diseases stated, however, that he had
no information to suggest serious epidemic since the bombing.
The same health officer stated that since the bombing three
months previously, he had heard of only two cases of typhoid
fever, no typhus fever, and that the prevalence of diphtheria
54
• o . . . a,,,-.- I .

Table 33. Hospital Cases of Communicable Diseases -Nagasaki
KNOWN CASESOF COMMUNCIABLE DISEASES
(OLD AND NEW) 1ST WEEK 2ND WEEK 3RD WEEK
Dysentery 150 120 75
Typhoid 3 1 1
Trachoma 15 15 20
Poliomyelitis 2 2 1
Mlalaria 2 0 0
Pneumonia 10 6 10
Smallpox 0 0 0
Syphilis 10 20 12
Tuberculosis 79 60 50
Gonorrhea 7 11 15
Chaneroid 4 2 2
Diphtheria 0 0 0
and epidemic meningitis had not been affected by the bombing.
He also stated that there had been no cholera or plague in the
city for the past five years. There may have been a slight
increase in diphtheria in the prefecture as four or five requests
were being reviewed daily for antitoxin.
Tuberculosis was a serious health problem in both cities, but
no effect on this disease was to be expected in the short
interval of time that elapsed between the bombing and this
survey. An increase in tuberculosis was expected to show up
as time passed.
55

A final conclusion was expressed as follows:
How such large numbers could have fled tosurrounding areas, and how the remainingpopulation could have existed under suchdisrupted conditions of living without re-sulting epidemics is still difficult tounderstand, but there were no major out-breaks [Emphasis Supplied]. The gradualreoccupation has allowed sufficient timefor the reestablishment of facilities formedical care and sanitation.
4.2 LONG-TERM FOLLOW-UP OF HIROSHIMA AND NAGASAKI POPULATIONINVOLVED IN THE ATOMIC BOMBING
The Atomic Bomb Casualty Committee (ABCC) has generated an
extensive amount of statistical data which includes an attempt
to relate the incidence of communicable diseases with degree
of exposure to radiation.
In a review of this data [16], Anderson drew the following
conclusions:
Considerable effort has been expended at ABCC;and to date, with one exception, no relationsnipbetween a variety of infectious diseases andradiation has been documented.
Hiroshima males so located (0 to 1400 meters fromthe hypocenter) demonstrated a significant excessof deaths due to tuberculosis, whereas Hiroshimafemales showed an increased frequency of deathsattributable to other (not tuberculosis) infec-tious or parasitic diseases. The foregoini dis-crepancies were particularly marked during 1951and 1952 and appeared to disappear thereafter.
1 6R. E. Anderson, "The Delayed Consequences of Exposure to
Ionizing Radiation," Human Pathology, Vol. 2, 1971, p. 469.
56

Periodic evaluations of the ABCC-JNIH AdultHealth Study Population have shown no clinicalradiographic or laboratory evidence of radiationrelated infectious disease .... A review ofthe ABCC autopsy experience in this regard alsofailed to document a consistent relationshipbetween exposure status and inflammatory processesor infectious diseases.
In a study of tuberculosis and A-Bomb exposure, Kamatsu and
Onishi [17] examined workers of the Mitsubishi shipyard in
1954 (and followed them). They concluded:
There was no remarkable variation in tuberculosisprevalence by distance from the hypocenter for allage groups combined. The rate in the exposed aged30-39 was significantly higher than that in thecontrol groups; for other age groups, rates in theexposed were smaller than in the control groups,although not significantly.
Tuberculosis prevalence in exposed persons whohad acute radiation symptoms (8.6%) is higherthan those without acute radiation symptoms(3.8%) . . . however, the latter rate was lower
than the rate for the control groups, and therate in the group without symptoms did not sig-nificantly exceed rates in the control groups.No interpretation of the significance of thesefindings is offered.
No relationship could be observed between theprognosis of tuberculosis and exposure status.
17T. Kamatsu and S. Onishi, Tuberculosis and A-Bomb Exposure,
A StL1wy of Nagasaki, Mitsubishi Shipyard Workers, Atom BombCasualty Commission Technical Report 15-61, 1961.
57

Turner and Hollingsworth [181 have reported on the incidence
of tuberculosis in relation to radiation exposure at Hiroshima
and Nagasaki. They concluded:
Radiation exposure was not related to prevalenceor radiological extent of tuberculosis.
Although it is quite possible that an increasein tuberculosis might have been present in theirradiated survivors of the immediate post-bombperiod, no such trends are noted in the follow-up of the present survivors.
4.3 THE MARSHALLENSE EXPERIENCE [19-22]
Eighty-two Marshallense people were involved in exposure to
radiation from fallout on the islands of Rangelap and Ailingnae.
The Rangelap people received an estimated whole-body dose of
175 r of gamma radiation and the Ailingnae people received
69 r [191.
These people have been followed from the onset of the exposure,
and extensive medical records are available. There is no
evidence of increased incidence of communicable disease attrib-
utable to the radiation exposure. Measles, chicken pox, etc.,
did occur but were within the normal range.
4.4 EXPERIMENTAL STUDIES
In 1954, Sheckmeister reviewed the subject of the susceptibility
of irradiated animals to infection [23]. The literature he
cited is quite varied with respect to (1) animals used, (2)
infecting agent, (3) exposure time and intensity of radiation.
He summarized his findings as follows:
58

In summary, the importance of infection in radi-ation injury is indicated by the findings thatdifferent species of animals exposed either tolethal or sublethal doses of x-radiation are muchmore susceptible to experimental infection, andthat bacteremia produced in these animals as aresult of irradiation is an important factor inradiation death . . .. It is essential that therole of post irradiation period as well as theradiation dose and challenge dose be considered.Sublethal radiation has been found to activatesubclinical or latent infections in mice andpossibly rats.
In 1965, Bond et al. [24] concluded that:
It is suggested that a period of increasedsusceptibility to inflammations and infectionscoincides with the first decline of the granu-locytes and is overcome during the period ofabortive recovery.
In 1972, A. D. Conger chaired an "Ad Hoc Panel on Research
Needs for Estimating the Biological Hazards of Low Doses of
Ionizing Radiations" [251. This panel concluded that:
It is now well established that large doses ofradiation (of the order of 100 rems) can causesignificant impairment of the immune response,and that such effects may have far reaching andyet unpredictable implications for the well-beingand physiology of the affected individual, hissusceptibility to infection, for example. Nosuch effects have been detected at doses below20 rems.
24V. P. Bond et al., Mammalian Radiation Lethality, New York
Academic Press, 1965.2 5A. D. Conger (Chairman), Ad Hoc Panel on Research Needs for
Estimating the Biological Hazards of Low Doses of IonizingRadiations, UNSCEAR-A/8725, G.A. Official Records, 27th Session,Supplement #25, 1972.
59

Knowledge of immune processes and their responseto radiation is still relatively primitive. Hence,further elucidation of this subject by appropriateinvestigations at higher dose levels in animals aswell as human subjects is strongly indicated.
The empirical evidence from the Hiroshima, Nagasaki and Marshall
Island experience is not sufficient to rule out the possibility
of radiation exposure contributing to an increase in communicable
disease under differing epidemiological conditions. The expe-
rimental evidence certainly suggests that there may well be a
unique set of circumstances leading to considerable enhancement
of communicable disease incidence following radiation exposure.
More study and analysis of past data and new experimental studiesare called for.
60
i

SECTION 5. THE SPECIAL CASE OF TUBERCULOSIS
Tuberculosis is a communicable disease which differs markedly
from the others under study in this report in its epidemiology
and its pathogensis. It is also the most serious of the commun-
icable diseases when considered as a peacetime health problem.
In 1971 it was responsible, in West Germany, for nearly 50 percent
of the mortality due to contagious diseases. (Its contribution
to total mortality in 1971, however, was only 0.6 percent 14].)
Table 34 shows the recorded cases and rates per 100,000 in
West Germany for the recent years through 1971 [4]. The number
of recorded cases has declined from 401,817 in 1958 to 172,093
in 1971. (The prevalence rates per 100,000 were 735.8 in 1958
and 279.8 in 1971.) The number of new cases reported annually
is also shown. The prevalence figures are more important to us
as they indicate the endemic base from which the rise will take
place if the population is subjected to the stress of war.
The League of Nations Health Survey of Europe (1943-1944) [11]
reported that there was a slight increase (reversing the down-
trend demonstrable to 1939) which culminated in 1942. Even
the rate for that year, however, is below the median rate
observed during the 1929-1938 period.
The above report is not consistent, but not completely contra-
dictory, with the report for Berlin, which indicated a prewar
mortality rate of 82 for 1938 and a 1946 rate of 302 which
represents an increase of 268 percent [26]. (N.B.: By 194 the
IfH. Mitchell, The Problem of Tuberculosis in the Postattack
Environment, The Rand Corporation, RM-5362-PR, June 1967.
61
.... . . . - , .
Table 34. Prevalence and Incidence of ActiveTuberculosis Cases for West Germany
YEAR END PREVALENCE ANNUAL INCIDENCE
RATE PER RATE PERYEAR NUMBER 100,000 POPULATION NUMBER 100,000 POPULATION
1958 401,817 735.8 ....
1965 257,574 434.4 ....-
1966 239,990 401.4 60,019 100.6
1967 221,090 368.8 54,671 91.3
1968 211,075 349.1 51,786 85.8
1969 199,977 326.8 49,695 81.7
1970 189,122 310.1 48,262 79.5
1971 172,093 279.8 45,325 74.0
tuberculosis rate in all of Germany had doubled and returned
to its prewar rate by 1948 [26].) The experience of Schleswig-
Holstein in the northern part of Germany is also of interest
(Table 35) as this also shows an unusually high increase based
on peculiar local circumstances. The tuberculosis rate climbed
from 1939 to 1943. Then with an influx of population (numbers
doubled), the number of cases doubled in proportion but the
death rate underwent a four-fold increase from 1944 to 1946.
Changes in tuberculosis rates are a sensitive index for overall
stress changes relating to nutrition, work-load, housing, etc.
Wartime conditions can be expected, therefore, to raise the
incidence of tuberculosis. The length of time over which the
stress is applied is important. Significant changes in tuber-
culosis rates are not likely to be a factor in acute short-
lived stress situations.
62

Table 35. Number of New Cases and Deaths ofTuberculosis in Schleswig-Holstein, 1939-1946
YEAR CASES DEATHS
1939 1,252 407
1940 1,242 449
1941 1,516 578
1942 1,818 442
1943 2,414 637
1944 3,191 721
1945 6,034 1,332
1946 6,575 2,754
(N.B.: The change in tuberculosis epidemiology because of the
continuing decrease of subclinical cases in the young may have
unexpected effects on the incidence increase in stress situ-
ations. This subject is quite complex and the opinions of
experts in tuberculosis control should be sought.)
63

SECTION 6. COLLATE aL DAMAGE AND COMMUNICABLE DISEASE
The data and descriptions in the foregoing sections of this
report do not add up to a oody of knowledge enabling one to
make accurate predictions on the behavior of communicable
diseases in the disordered environment accompanying a tactical
nuclear war in Germany. However, judgments can be made on a
"best guess basis" if the war scenarios are reasonably des-
cribed in terms of amount of physical damage, length of time
of hostilities, behavior of the population (with regard to
crowding shelter, etc.) and availability of medical and sani-
tation supplies, personnel and equipment. The most important
factor in prediction may be summed up as "integrity of the
social fabric." If the population is disciplined regarding
personal hygiene and the public health and medical infrastruc-
ture functions with regard to disease surveillance and control,
the epidemic disease problem should be more moderate than
that encountered during World War II (given even more physical
damage than occurred there). This judgment is based on the
following:
1. The endemic-epidemic base has improved consid-
erably since World War II.
2. The immunological status of the population
will be improved over that of the start of
World War II (especially for diphtheria and
poliomyelitis).
3. Medication (essential antibiotics) is now
available to treat and limit the spread of
many diseases which during World War II could
not be so controlled.
64

4. The lesson of typhus importation has been
learned and is not likely to be repeated.
5. The war is likely to be muc.I shorter than World
War II, and many epidemic diseases require time
to build up to maximum damage potential.
Several caveats should be added to the above assessment:
1. The response of an irradiated population combined
with a concurrent epidemic might lead to unexpec-
tedly high morbidity and mortality rates from
the indicated disease.
2. The question of radiation effect on endemic
disease, subclinical cases, and carrier states
is certainly not settled by the limited experience
recorded to date.
3. Those diseases which are proving troublesome
to control during peacetime (e.ci., infectious
hepatitis and infectious meningitis) may cause
more trouble than anticipated.
4. A change in tuberculosis epidemiology leading
to higher incidence of disease should be con-
sidered a possibility. The changed experience
(lack of contact with tubercle bacilli) of
younger age groups today compared with the
past might lead to unexpectedly high inci-
dence and mortality rates. (This caveat is
based on the possibility that a population
65

reaching adulthood without subclinical infec-
tion with tubercle bacilli may react in a more
serious manner.)
5. And the final caveat: "Fools rush in where
angels fear to tread."
66
.... 9

REFERENCES
1. S. Garb and E. S. Garb, Disaster Handbook (2nd Edition),Springer Publishers, 1969.
2. F. Prinzing, Epidemics Resulting from Wars, Oxford Press,1916.
3. K. A. Western, "Epidemiology of Communicable Disease inDisaster Situations (Summary)," Ann. Soc. Belge Med.Trop., Vol. 56, 1976, p. 199.
4. Statistical Atlas on Public Health in the Federal Republic
of Germany, Vol. 5, Verlag W. Kohlhammer Stuttgart/Mainz,1974.
5. Health Statistics Report of the Federal Republic of Germany
Vol. 7, Verlag W. Kohlhammer Stuttgart/Mainz, 1960.
6. Statistical Papers on Public Health in the Federal Republicof Germany, Vol. 8, Verlag W. Kohlhammer Stuttgart/Mainz,1961.
7. Statistical Papers on Public Health in the Federal Republicof Germany, Vol. 10, Verlag W. Kohlhammer Stuttgart/Mainz,1963-1966.
8. Statistical Papers on Public Health in the Federal Republicof Germany, Vol. 11, Verlag W. Kohlhammer Stuttgart/Mainz,1966-1969.
9. World Health Statistics, World Health Organization, 1973.
10. The United States Strategic Bombing Survey: The Effects ofBombing on Health and Medical Care in Germany, MedicalDivision, 1947.
11. Y. M. Briand, Health in Europe--A Survey of the Epidemicand Nutritional Situation, Bulletin of the Health Orga-nization, League of Nations, Vol. 10, No. 4, 1943-1944.
12. V. G. Valaoras, "Some Effects of Famine on the Populationof Greece," The Milbrook Memorial Fund Quarterly, Vol.24, 1946, p. 215.
13. G. H. Bourne, Starvation in Europe, G. Allen and Unwin,Ltd., London, 1943.
14. The United States Strategic Bombing Survey: The Effectsof Bombing on Health and Medical Services in Japan,Medical Division, June 1947.
15. The United States Strategic Bombing Survey: The Effectsof Atomic Bombs on Health and Medical Services in Hiro-shima and Nagasaki, Medical Division, June 1947.
67

16. R. E. Anderson, "The Delayed Consequences of Exposure toIonizing Radiation," Human Pathology, Vol. 2, 1971, p.469.
17. T. Kamatsu and S. Onishi, Tuberculosis and A-Bomb Exposure,A Study of Nagasaki, Mitsubishi Shipyard Workers, AtomBomb Casualty Commission Technical Report 15-61, 1961.
18. R. W. Turner and R. Hollingsworth, "Tuberculosis in Hiro-shima," Yale Journal of Biology and Medicine, Vol. 36,1963, p. 165.
19. E. P. Cronkite et al., Twelve Month Postexposure to Fall-out Radiation, BNL-384 (T-71), August 1955.
20. R. A. Conrad et al., "Medical Status of Marshall Islandersin 1959, Five Years After Exposure to Fallout Radiation,"Nuclear Medicine, Vol. 1, 1960, p. 314.
21. R. A. Conrad, "Medical Findings in Marshallese PeopleExposed to Fallout Radiation," Journal American MedicalAssociation, Vol. 192, 1965, p. 457.
22. C. F. Behrens et al., Atomic Medicine, 5th Edition, Bal-timore, 1969.
23. I. L. Sheckmeister, "Susceptibility of Irradiated Animalsto Infection," Rad. Res., Vol. 1, 1954, p. 401.
24. V. P. Bond et al., Mammalian Radiation Lethality, NewYork, Academic Press, 1965.
25. A. D. Conger (chairman), Ad Hoc Panel on Research Needsfor Estimating the Biological Hazards of Low Doses ofIonizing Radiations, UNSCEAR-A/8725, G. A. OfficialRecords, 27th Session, Supplement #25, 1972.
26. H. H. Mitchell, The Problem of Tuberculosis in the Post-attack Environment, The Rand Corporation, .1-5362-PR,June 1967.
68

DISTRIBUTION LIST
DEPARTMENT OF DEFENSE DEPARTMENT OF DEFENSE (Continuedj
Armed Forces Radiobiology Research Institute National Defense UniversityATTN: Director ATTN: NWCLB-CR
Armed Forces Staff College DirectorATTN: Reference & Technical Svcs Br Net Assessment
Office of the Secretary of DefenseAssistant to the Secretary of Defense ATTN: LTC BanksonAtomic Energy ATTN: Military Assistants
ATTN: T. Sisson ATTN: F. GiesslerATTN: Nuclear Policy PlanningATTN: Strategy & Assessment DEPARTMENT Or THE ARMYATTN: L. Michael
Harry Diamond LaboratoriesDefense Advanced Rsch Proj Agency Department of the Army
ATTN: TIO ATTN: DELHD-N-DATTN: TTO ATTN: 00100 Conmander/Tech Dir/TSO
ATTN: DELHD-N-TDDefense Intelligence Agency ATTN: DELHD-N-P
ATTN: DB-4C, E. O'Farrell ATTN: Chairman Nuc Vulnerability BrATTN: DIO-GPF, W. MagathanATTN: ON U.S. Army Concepts Analysis AqencyATTN: Library ATTN: CSSA-ADLATTN: RTS-2CATTN: DT, J. Vorona U.S. Army Nuclear & Chemical AgencyATTN: DB-4C, P. Johnson ATTN: MONA-ZB, D. Panzer
ATTN: LibraryDefense Nuclear Agency
ATTN: STRA U.S. Army TRADOC Sys Analysis ActvyATTN: STNA ATTN: ATAA-TACATTN: NATD
4 cy ATTN: TITL DEPARTMENT Of THE NAVY
Defense Technical Information Center Naval Academy12 cy ATTN: DD ATTN: Library
Deputy Undersecretary of Defense for Policy Plng Naval Research LaboratoryATTN: Dir Plng & Requirements, M. Sheridan ATTN: Code 2627ATTN: Dir Negotiations Policy, S. BuckleyATTN: Dir Strategic Policy, C. Estes Naval Surface Weapons Center
ATTN: Code DG-502, E. FreilingField CommandDefense Nuclear Agency DEPARTMENT OF HE AIR FORCE
ATTN: FCP, J. Digrazia2 cy ATTN: FCPR Air Force Academy
ATTN: LibraryField CommandDefense Nuclear Agency Air Force School of Aerospace MedicineLivermore Branch ATTN: Radiobiology Division
ATTN: FCPRLAir Force Weapons Laboratory
Field Command Air Force Systems ConmandDefense Nuclear Agency ATTN: SULLos Alamos Branch ATTN: NSSB
ATTN: FCPRAAssistant Chief of Staff
Interservice Nuclear Weapons School Studies & AnalysesATTN: Document Control Department of the Air Force
ATTN: AF/SAMI
Joint Strat Tgt Planning Staff ATTN: AF/SAGFATTN: JL ATTI: H. ZwemerATTN: JPATTN: JPSATTN: JLTW
69
,,.

OTHER GOVERNMENT AGENCY DEPARTMENT OF DEFENSE CONTRACTORS _Continuedd
Central Intelligence Agency Kaman Sciences CorpATTN: OSWR/NED ATTN: V. CoxATTN: OSR/SE/F ATTN: F. Shelton
DEPARTMENT OF ENERGY CONTRACTORS Kaman Sciences CorpATTN: T. Long
Lawrence Livermore National LabATTN: L-21, M. Gustavson McLean Research Center, Inc
ATTN: W. Schilling
Los Alamos National Scientific LabATTN: M/S 632, T. Dowler Pacific-Sierra Research Corp
ATTN: R. Stolpe ATTN: H. BrodeATTN: G. Lang
Sandia National LaboratoriesLivermore National Laboratory Pacific-Sierra Research Corp
ATTN: T. Gold ATTN: G. Moe
DEPARTMENT OF DEFENSE CONTRACTORS R & D AssociatesATTN: S. Cohen
Academy for Interscience Methodology ATTN: P. HaasATTN: N. Pointer
Rand CorpAnalytical Technology Applications Corp ATTN: Library
ATTN: J. Scharfen ATTN: J. DigbyATTN: T. Parker
BDM CorpATTN: J. Braddock Santa Fe Corp
ATTN: D. PaolucciBoeing Co
ATTN: L. Harding Science Applications, IncATTN: C. Whittenbury
66th MI Group ATTN: M. DrakeATTN: J. Eade ATTN: J. Martin
Decision-Science Applications, Inc Science Applications, IncATTN: Pugh ATTN: W. LaysonATTN: Galiano ATTN: J. Goldstein
ATTN: J. McGahan
General Electric Company-TEMPOATTN: DASIAC Science Applications, Inc
ATTN: D. KaulGeneral Research Corp
ATTN: H. Schroeder SRI InternationalATTN: Tactical Warfare Operations ATTN: W. Jaye
ATTN: G. AbrahamsonHistorical Evaluation & Rsch Org ATTN: B. Gasten
ATTN: T. Dupuy ATTN: J. Naar
Hudson Institute, Inc Tetra Tech, IncATTN: C. Gray ATTN: F. BothwellATTN: H. Kahn
TRW Defense & Space Sys (;roupInstitute for Defense Analyses ATTN: R. Anspach
ATTN: M. Scher
JAYCORATTN: E. Almquist
70