F T B SYSTEMS T ACK ESTING - Fibonacci Trader SWING CHART NEXT ARKAY SWING CHART OWN BALANCE POINT...
21
F T SYSTEMS & BACK TESTING FIBONACCI TRADER SYSTEMS SUPPLEMENT Page 1 A long the main menu of the Fibonacci Trader you see a choice titled Systems. If you left click on Systems the window to the right opens. This is the Select Systems control window. Right click in this win- dow and you can create new, edit, delete, use or clear systems from your plan. There are two types of Systems avail- able for the Fibonacci Trader. The first type is a simple collection of your favorite indicators that you would use on a regular basis. For example, you may want to use a moving average, the Dynamic Trio and the Dy- namic Fibonacci Channel for trading your favorite stocks or commodity. You can cre- ate, name, and save a System that will have these indicators formatted to your taste. Any time that you want to use this collection of indicators, you can call it up to be used on any plan. This saves you time if you decide to follow a new stock or when a futures contract expires and a new contract becomes the active contract. You don’t have to go to the Indicator menu and manually add each of the indicators to the plan. You simply create a System, name it, and it is available to be used at your command. All of the Fibonacci Trader indicators can be used in designing your System. The second type of System uses the group of indicators that have alarms. The alarms accompanying the indicators can be used as rules for buying and selling. For example, a close past the HiLo Activator could be an entry rule. Once you have set up a System using these special indicators, you can back test the system. After you run the test, you can view the signals on your plan, analyze results of your rules, as well as monitor the system on an ongoing basis. We will go into the steps of setting up this system test shortly. But first, let’s design a system for every day use of application of your favorite indicators.
Transcript of F T B SYSTEMS T ACK ESTING - Fibonacci Trader SWING CHART NEXT ARKAY SWING CHART OWN BALANCE POINT...
F TSYSTEMS &BACK TESTING
FIBONACCI TRADER SYSTEMS SUPPLEMENT Page 1
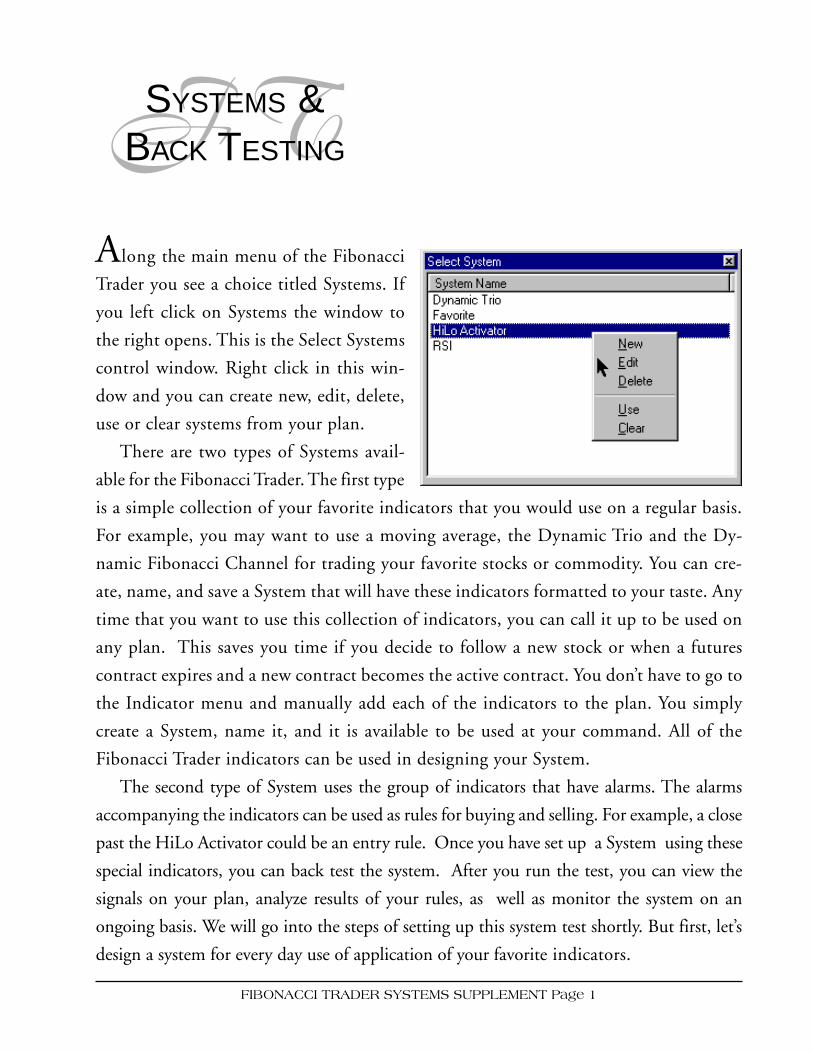
Along the main menu of the Fibonacci
Trader you see a choice titled Systems. If
you left click on Systems the window to
the right opens. This is the Select Systems
control window. Right click in this win-
dow and you can create new, edit, delete,
use or clear systems from your plan.
There are two types of Systems avail-
able for the Fibonacci Trader. The first type
is a simple collection of your favorite indicators that you would use on a regular basis.
For example, you may want to use a moving average, the Dynamic Trio and the Dy-
namic Fibonacci Channel for trading your favorite stocks or commodity. You can cre-
ate, name, and save a System that will have these indicators formatted to your taste. Any
time that you want to use this collection of indicators, you can call it up to be used on
any plan. This saves you time if you decide to follow a new stock or when a futures
contract expires and a new contract becomes the active contract. You don’t have to go to
the Indicator menu and manually add each of the indicators to the plan. You simply
create a System, name it, and it is available to be used at your command. All of the
Fibonacci Trader indicators can be used in designing your System.
The second type of System uses the group of indicators that have alarms. The alarms
accompanying the indicators can be used as rules for buying and selling. For example, a close
past the HiLo Activator could be an entry rule. Once you have set up a System using these
special indicators, you can back test the system. After you run the test, you can view the
signals on your plan, analyze results of your rules, as well as monitor the system on an
ongoing basis. We will go into the steps of setting up this system test shortly. But first, let’s
design a system for every day use of application of your favorite indicators.
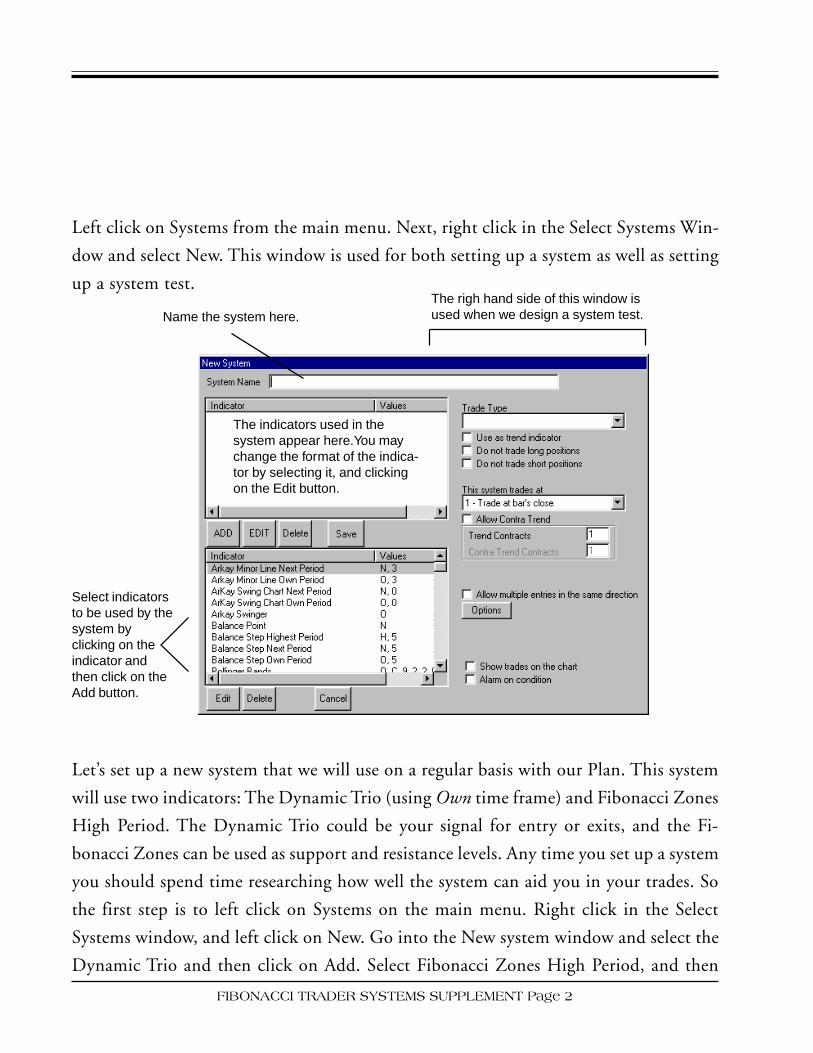
Left click on Systems from the main menu. Next, right click in the Select Systems Win-
dow and select New. This window is used for both setting up a system as well as setting
up a system test.
Let’s set up a new system that we will use on a regular basis with our Plan. This system
will use two indicators: The Dynamic Trio (using Own time frame) and Fibonacci Zones
High Period. The Dynamic Trio could be your signal for entry or exits, and the Fi-
bonacci Zones can be used as support and resistance levels. Any time you set up a system
you should spend time researching how well the system can aid you in your trades. So
the first step is to left click on Systems on the main menu. Right click in the Select
Systems window, and left click on New. Go into the New system window and select the
Dynamic Trio and then click on Add. Select Fibonacci Zones High Period, and then
FIBONACCI TRADER SYSTEMS SUPPLEMENT Page 2
Name the system here.
Select indicatorsto be used by thesystem byclicking on theindicator andthen click on theAdd button.
The indicators used in thesystem appear here.You maychange the format of the indica-tor by selecting it, and clickingon the Edit button.
The righ hand side of this window isused when we design a system test.

FIBONACCI TRADER SYSTEMS SUPPLEMENT Page 3
click on Add. Enter into the
System Name your name for
the system, such as “New
System.” The system should
look like this one shown
here. Now click on Save.
This system is now avail-
able to be brought up and
used with any plan.
For example, here is a
Daily/Weekly/Monthly plan
for Microsoft. Open up the
plan, then left click on Sys-
tem from the main menu.
Your new system will be
listed. Left click on the
name of the new system
“New System,” right click,
and then left click on “Use.”
In our example,
Microsoft moves up through
resistance, trends higher,
and hits resistance the next
week. The Dynamic Trio
followed the trend up, and
exited when the price traded back into the resistance zone. The next week the price hit
support again. Let’s set up a system test, using the available indicators.
Break out
Support
Support
Support
Resistance
Resistance
DynamicTrio

ARKAY SWING CHART NEXTARKAY SWING CHART OWNBALANCE POINTBALANCE STEP HIGHBALANCE STEP NEXTBALANCE STEP OWNDANTON STOPDIRECTIONAL MOVEMENT INDEXDIRECTIONAL VOLATILITY NEXT 1.382DIRECTIONAL VOLATILITY NEXT 1.618DIRECTIONAL VOLATILITY NEXT 2.382DYNAMIC BALANCE POINT OWNDYNAMIC BP STEP NEXT:DYNAMIC TRIO NEXTDYNAMIC TRIO OWNEXPONENTIAL MOVING AVERAGEFAST POINT SWITCHGANN SWING CHARTIST NEXTGANN SWING CHARTIST OWNHILO ACTIVATOR HIGHHILO ACTIVATOR NEXTHILO ACTIVATOR OWNLEAST SQUARESLEAST SQUARES SLOPEMACD HISTOGRAMMOMENTUMMOVING AVERAGE CONVERGENCE-DIVERGENCEON BALANCE VOLUMEPARABOLICPARABOLIC FILTERSPERRY KAUFMAN ADAPTIVE MARATIO OSCILLATORRELATIVE STRENGTH INDEXSIMPLE MOVING AVERAGESTOCHASTICSSTOCHASTICS RSITRIPLE SWITCH HIGHTRIPLE SWITCH NEXTTRIPLE SWITCH OWNTRUE STRENGTH INDEXVOLATILITY STOPWEIGHTED MOVING AVERAGEWILLIAMS %RWILLIAMS A/D OSCILLATOR
FIBONACCI TRADER SYSTEMS SUPPLEMENT Page 4
The list shown here on the right are the
indicators that can be used in a system’s
backtest. All indicators can be used in any
system for display purposes, but only the
indicators listed here can be used with
rules during a backtest.
Obviously, indicators have unique
uses. For example, a moving average rule
may be a close past the moving average
value or for momentum, the crossing of
the zero line will be a rule. The system
back test in the Fibonacci Trader has 9
choices for rules. These are referred to as
the Trade Type in the Edit System win-
dow:
Let’s build a simple system, and back test
the rules to see the results.
TRADE TYPE
1- Close past line2- Bar crossing line3- Change of slope direction4- Stop and reverse5- Overbought and Oversold6- Slow average crossing7- Change of trend8- Crossing zero line9- Step direction

SYSTEMS CONTROL WINDOW
Indicators that are drawn from the list on the previous page have rules associated for per-
forming a back test. Once you run the backtest you can view tables of results in both
summary and tabular form, plus the individual trades will be displayed on the charts and/or
linked to an alarm. Let’s get started reviewing the various features available. First, left click
on Systems from the main menu. Next right click in the Select Systems window (above) and
select New to set up a system. The Systems Control Window shown below will open. Now, we
will walk through each of the features displayed on the right hand side of the window as we build
a simple system.
FIBONACCI TRADER SYSTEMS SUPPLEMENT Page 5
Name the system here.
Trade Type refers to one of the ninerules listed on the previous page.Each indicator has it’s own rule or aset of rules.
Set stop lossrules and profitprotection rules.
Alarms windowwill open.
The indicators used in thesystem appear here.Select from the list below, clickon Add. If you want to edit theindicator select it in this windowand click on Edit.
An indicator can be setto be used for only theconfirmation of the di-rection of the trend, andnot for entry and exit.
Specify long or shortpositions.
Show signals onthe chart.
Set system rules, num-ber of contracts, trendand contra trend trading.

SYSTEMS TUTORIAL
We’ll start with very basic steps, and build from there while explaining each feature. As
we evolve the system we will show a chart showing the effect of each modification. First,
developing a system is detail work, and the purpose of this tutorial is to explain the
features. For your own system please check carefully that the final logic of the system is
the same as your goal. Developing a system with the use of a computer requires a careful
study and analysis of your logic. One idea is to build the system in stages, checking how
the system performs as you add each new rule.
So let’s begin by building a simple trend following system. The system will be called the Trend
Follower. Left click on Systems on the main menu, right mouse click in the Select System window
and select New. Type in the name Trend Follower, and select the moving average indicator, and
click on Add. Select the Moving average indicator in the upper Indicator window, and then in the
Trade Type window select “Close past line.” The next window, “This system trades at”, refers to
the choice of when the execution occurs, i.e., trade at the close , the next bar’s open or the indica-
tor value. For example, the indicator could issue a trade based on the close but if the system trades
at the next bar’s open, then the trade will be on the open. Click “Show trades on the chart:, and
Save to save this system. See the next two charts of the September 1998 T-bond contract.
Set the number of ticks for asignal, here we’ll use 1 tick.
FIBONACCI TRADER SYSTEMS SUPPLEMENT Page 6
Trade Type refers to one of thenine rules. The movingaveragecan use this four of the avail-able choices.
This widow controls when theSysten trades, as compared tothe indicator signal.
Clck here to show the tradeson the chart.

FIBONACCI TRADER SYSTEMS SUPPLEMENT Page 7
This simple moving average system is always long or short, and trades basedon the close past the moving average. The system shows how many contractsare bought or sold for each signal in the arrow. Right click on the arrow and thecurrent action and position is shown.
Here is the same simple moving average system except the system trades atthe next bar’s open. The simple moving average indicator will trade based onthe close past the moving average but the system trades at the next bar’s open.

Now, we’ll add another moving average as an additional signal and then as a trend confirmation. Open
up the system Trend Follower from the Systems menu by right mouse clicking on the name and left click
on Edit, or if the system is currently shown on your plan, then right click on the name and left click on
edit. Let’s add another moving av-
erage to the system. Select the
Moving Average, and click on
Add. Now select this new Mov-
ing Average, click on Edit and
change the length to 21, and
change the symbol to solid circles
so we can see it on the chart.
Change the “This system trades
at” to Trade at bar’s close. Your
system should look like the
above picture, then click on
“Save as default.”
Here is the new system us-
ing the 7 and 21 period mov-
ing average. If the price closes
above the 7 period moving av-
erage and the 21 period, mov-
ing average the system is long
1 contract, or if below both
moving averages the system is
short 1 contract. If the price
closes between the two moving
averages the system is flat.
Why? Because one indicator
says to be long, and one says to be short, so they cancel each other. If we want both moving average
7 periodmovingaverage.
21 period moving average.
FIBONACCI TRADER SYSTEMS SUPPLEMENT Page 8

to contribute trades we can select the “Allow multiple entries in the same direction.”
Then, if the price closes above both the 7 period moving average and the 21 period
moving average the system will go long 2 contracts because both indicators are long, or
if the price closes below both
moving averages the system
is short 2 contracts. If the
price closes between the two
moving averages the system
is flat because the 7 moving
average would be short 1
contract and the 21 period
moving average would be
long 1 contract. Let’s add an
additional moving average
and use it as a trend indica-
tor and see some additional
features of the system testing module. Add another moving average, then select it and
change it to a length of 35, and change the symbol to a cross so you can see it on the
chart. Select the new 35 period moving average and then click on “Use as trend indica-
tor.” Be that each indicator has the “By # of ticks” is set to 1, and that the Edit system
window looks like the one above.
At this point we have created a crossover system that is using the 35 period moving average for
identifying the trend, and the 7 and 21 period moving averages for trading signals. At first glance
it would appear that there is redundancy in that all three of the indicators are trend following
indicators, and using the 35 period moving average for trend identification does not offer any new
information. This next section demonstrates a unique ability of the Fibonacci Trader. You can set
a number of contracts to trade in the direction of the trend different from the set trading against
or contra trend. We’ll look into this feature by beginning with a the current system and make
modifications to it, and see the results in a trading range.
Select the 35 period moving average.and click on “Use as trend indicator.”
FIBONACCI TRADER SYSTEMS SUPPLEMENT Page 9

Look at the chart here. We’ll walk through this example of the basic system, and
then make changes to the rules and you will see the effect. First, at point A the
system is long 1 contract
because the price closed
above both the 7 and 21
period moving averages
(the multiple contracts is
not checked, therefore
only 1 contract is used),
and the trend is up based
on the price closing above
the 35 period moving av-
erage. At point B the sys-
tem is flat because the 7
period moving average is short 1 contract, and the 21 period moving average is
long 1 contract, and they cancel each other.
Notice that the 35 period moving average does not actually signal a trade, it is
only for trend confirmation. Returning to the chart you can see that point C , the
system is long 1 contract, and at point D the system is
flat. At point E the system is now short 1 contract be-
cause the price closed below the 35 period moving av-
erage, which changes the trend to down, and therefore
the short signals from the 7 and 21 period moving av-
erage is now accepted. At point F the system goes flat,
and at point G the system goes long.
Return to the System Edit window and click on “Allow Contra trend, and change
the “Trend Contracts” to 2, and the “Contra Trend Contracts” to 1, and click Save
as Default. At this point we are changing the system to trade two contracts in the
direction of the trend, and to trade 1 contract when the 7 and 21 period moving
A
B
C
D
E
F
G
WHEN YOU CLICK THE
“USE AS TREND INDI-CATOR” THE INDICA-TOR NO LONGER
CONTRIBUTES A BUY
OR SELL SIGNAL.
FIBONACCI TRADER SYSTEMS SUPPLEMENT Page 10

averages are issuing short sell signals, but the price is still above the 35 period moving aver-
age. Your system should look like the one shown in this window.
The 35 period moving average isused for determining the trend.
The system trades at the close.
Contra trend trades are allowed.
Two contracts are traded with the trend.
One contract is traded against the trend.
Here are trades from the same
period show in the previous
chart. Each of the trades are
identical except now there are
two contracts traded with the
trend for each signal. The key
difference is the new trade
number E. Here the system
goes short one contract because
the price trades below the 7 and
21 period moving average, but
the price is still above the 35 period moving average so this is a contra trend signal, and the system
goes short only 1 contract. At bar F the price closes below the 35 period moving average and so another
contract is sold short because the trend is now down and the system should be short 2 contracts.
FIBONACCI TRADER SYSTEMS SUPPLEMENT Page 11
A
B
C
DE
F
G
H

FIBONACCI TRADER SYSTEMS SUPPLEMENT Page 12
OPTIONS
The Options button takes you to the Stop Provisions, Profit Protection Rules and color choices
for your system. The Stops window is the first selection available. If you choose “None” then your
system will only exit a trade based on your indicators. If use a stop rule, and your system exits by
the stop being hit, then your
system will need a new signal
to renter the market.
For example, the chart on
the bottom of the page uses a 7
period simple moving average
to signal entries, and a fixed
stop of 10 ticks from the entry
price. At point A the system
sells short 2 contracts, revers-
ing from long to short 1 con-
tract. The next day, at point B,
the position is stopped out for
a 10 tick loss. At point C the
system is long 1 contract on the
close past the moving average.
The next day, at point D, the
trade is stopped out, and is now
flat. Notice that the market rises
with no new signal until point
E when the price closes below
the moving average. The arrow
at point F is the fixed stop for
this latest trade.
A
B
D
C
E
F
Enter in the value forthe percent stop orthe number of ticksstop.

FIBONACCI TRADER SYSTEMS SUPPLEMENT Page 13
There are a number of choices for how you use stops in your system. Your first
choice is None, the next is “By % of value” or “By Ticks.” Either of these two
choices require you to enter a value into the Value window. If you click on the “By
% of value” and enter a whole number, such as 1, then 1% will be subtracted for a
sell stop or added for a buy stop to the entry price. You can also use decimal, for
example 0.5 will be 0.5%. Both the “By % of value” or “By Ticks” are a fixed stop
based on the entry price, and
will not adjust to market ac-
tion after the initial entry.
The next stop loss op-
tion is the “Average range
of ” option. Here you can
set the stop based on a
lookback period and a per-
cent of the average range
over the lookback period.
If you chose 5 periods then
the program will calculate
the last five period’s average range, (H-L)/2, and the stop loss will be set at that
price point difference from the entry point. For example, if you were trading T-
bonds, and the average range was 28/32nds based on a five period lookback for the
T-bonds and you set the stop to be 50%, then the program will place the stop 14/
32nds from the entry point.
The next option is to set the average percentage range stop to be subtracted
from the low or added to the high of the entry bar, depending if you are long or
short. In addition, this stop can be set to be a trailing stop, following the overall
trend of the market. As the daily ranges change the stop will adjust to the level of

the daily range volatility. For example, if the daily ranges expand the stop will move away
from the current price. If the daily ranges contracts, the difference between the stop and the
market will tighten. The trail-
ing stop will follow the trend
of the market as in the chart.
You next choice is “Previ-
ous High/Low. This option
enables you to set your stop
based on the highest high or
lowest low over the lookback
period since the entry. If you
click on the trailing option
the stop will advance each bar
based on the lookback period.
Previous High or Low indi-
cates that today’s bar is no in-
cluded in the lookback pe-
riod.
The next option is to close
all trades at the end of the day.
Day traders, may want a sys-
tem that does not carry posi-
tions over night, so check this
box and all trades based on an
intraday system will be exited
at the close of the trading day.
Otherwise the intraday sys-
tem will keep the position open overnight. No slippage is considered for fills, but if the
opening price exceeds your stop loss level, then the opening price will be used.
FIBONACCI TRADER SYSTEMS SUPPLEMENT Page 14

FIBONACCI TRADER SYSTEMS SUPPLEMENT Page 15
PROFIT PROTECTION
Click on the Profit Protection tab. Here, you set parameters to take profits either by a set objective of ticks
or a percentage gain based on your entry price. You can also set also set the objective as a percentage gain
based on the average bar range of
a lookback period. In addition,
you can set the profit objective to
be based on a percentage retrace-
ment from the peak or trough of
a trend. The first option is
“None.” This would be clicked
to remove any previous profit
protection instructions.
The next option is “By % of
value. Once you click on this op-
tion you will need to place a value
in the box. For example, in the
chart on the right the entry sys-
tem is enter a position if the mar-
ket penetrates the Dynamic Trio
Own line and the profit object is
2% of the entry price. If the price
moves 2% of the entry price in
your favor the system goes flat,
and waits for the next signal. If
the market opens past your profit
point the program will use the
opening price for your exit
price. The next option is “By
ticks.” Enter in an amount of ticks for a profit objective. For example, you may set up your system
L o n ghere
P ro f i there
S h o r there
P ro f i there
Check here to set the profit protection rulesbased on a percentage retracement fromthe peak or valley of the targeted profit.

FIBONACCI TRADER SYSTEMS SUPPLEMENT Page 16
to automatically take profit 20 ticks from the entry price. Another feature is to set your profit
target and then set a percentage retracement of the peak profit if the minimum profit is hit. The
window to the right shows a
profit protection minimum of
1% and if hit, then exit at a
33% retracement of the peak
profit.
The chart below shows this
action. The simple moving av-
erage system went short at the
close at 123-20 (point A). The
minimum target was 1%,
which calculates to be 122-12,
(123.625*.01 = 1.23625,
123.625 - 1.2365 = 122.3888
which approximates 122-12).
Two days later the price exceeds
this price (point B) and reaches
122-07 (point C). A 33%
retracement of this peak profit
(123-20 minus 122-07) is 122-
21 (point D), and the system
exits and goes flat.
You can also set the profit
protection to be based on a
minimum of ticks. The next
example sets a minimum tar-
get of 52 ticks and a percent-
age retracement of 33%. The
D
C
B
A

FIBONACCI TRADER SYSTEMS SUPPLEMENT Page 17
menu shown is this set up.
Click on “By Ticks,” enter 52
into the Value box, then click
on retracement and enter 33.
The chart below shows the
trade.
A
B
C
The system went short at 123-
20 (point A). The minimum
objective was 52 ticks, which
was hit at point B. A 33% of
52 ticks is 17 ticks, which was
hit at point C. When the profit
protection rule is enacted, the
system goes flat and wauts for
the next entry signal.
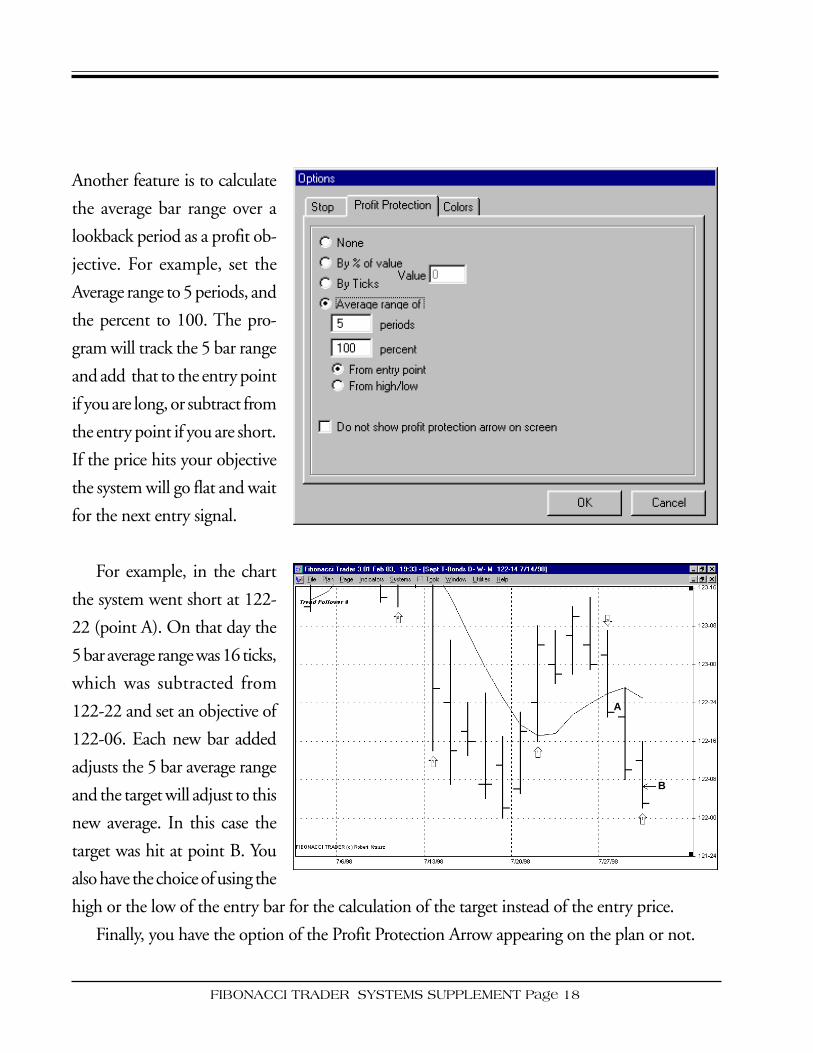
Another feature is to calculate
the average bar range over a
lookback period as a profit ob-
jective. For example, set the
Average range to 5 periods, and
the percent to 100. The pro-
gram will track the 5 bar range
and add that to the entry point
if you are long, or subtract from
the entry point if you are short.
If the price hits your objective
the system will go flat and wait
for the next entry signal.
For example, in the chart
the system went short at 122-
22 (point A). On that day the
5 bar average range was 16 ticks,
which was subtracted from
122-22 and set an objective of
122-06. Each new bar added
adjusts the 5 bar average range
and the target will adjust to this
new average. In this case the
target was hit at point B. You
also have the choice of using the
high or the low of the entry bar for the calculation of the target instead of the entry price.
Finally, you have the option of the Profit Protection Arrow appearing on the plan or not.
A
B
FIBONACCI TRADER SYSTEMS SUPPLEMENT Page 18

The Colors Tab provides
you with the choice of colors
for the arrows for Going
Long, Going Short, Going
Flat, Stop Arrow and Profit
Protection Arrow.
FIBONACCI TRADER SYSTEMS SUPPLEMENT Page 19

SYSTEMS REPORTS
The Fibonacci Trader program produces three reports for a system. The reports are available by
right mouse clicking over the name of the system in the top left hand corner of the chart and
selecting Results. The first re-
port is a trade by trade listing
giving you the date, time if
intraday, quantity, price, stop &
reverse quantity, and the cumu-
lative total number of ticks the
system produced. You can copy
any and all of the information by
dragging your mouse over the
data and pressing the key “Ctrl”
and the letter “C,” then paste to
the application you want to use.
From this window you can
select to view the parameters of
the system, see the next two
reports by clicking on Sum-
mary, or print the report. If you
click on Summary your choices
are the Performance report and
the Risk report. The table on the
right is the Performance Report.
The Open Interest figures at the
bottom refer to the number of
contracts the system carried.
The Risk report, shown here on
the right, is a much more detailed
Performance Results for T-Bonds D- W- M SystemHiLo ActivatorFrom 1/2/85 05:35 to 4/11/97 06:46
Gross Profit 585.41Gross Loss -479.44Net 105.97
Total Trades 425.00Total Winning 145.00Total Losing 280.00Percent Profitable 34.12
Largest Winning Trade 25.31Largest Losing Trade -6.66Average Winning Trade 4.04Average Losing Trade -1.71Ratio Average Win/Average Loss 2.36Average Trade 2.51
Max Consecutive Winners 5.00Max Consecutive Profit 31.78Max Consecutive Losers 11.00Max Consecutive Draw Down -17.75
Maximum Open Interest 3.00Maximum Open Interest Average 2.18
FIBONACCI TRADER SYSTEMS SUPPLEMENT Page 20

Performance Results for T-Bonds D- W- M SystemHiLo ActivatorFrom 1/2/85 05:35 to 4/11/97 06:46
Gross Profit 585.41Gross Loss -479.44Net 105.97
Gross Profit Points 585.41Gross Loss Points -479.44Net Points 105.97
Total Winning DayTrades 0.00Total Losing DayTrades 0.00Total DayTrades 0.00Total Winning Normal 145.00Total Losing Normal 280.00Total Normal Trades 425.00Total Trades 425.00
Total Winning DayTrades Contracts 0.00Total Losing DayTrades Contracts 0.00Total DayTrades Contracts 0.00Total Winning Normal Contracts 381.00Total Losing Normal Contracts 545.00Total Normal Trades Contracts 926.00Total Trades Contracts 926.00Average Contracts per Trade 2.18Max Trade Contracts 6.00Min Trade Contracts 2.00
Largest Winning Trade 25.31Average Winning Trade 4.04Max Consecutive Winners 5.00Max Consecutive Profit 31.78
Largest Losing Trade -6.66Average Losing Trade -1.71Max Consecutive Losers 11.00Max Consecutive Draw Down -17.75
Maximum Open Interest Average 2.18
Average Buy Price 80.64Average Sell Price 80.84Average Trade Price 80.74
Average Buy Instrument Value 80.64Average Sell Instrument Value 80.84Average Instrument Value 80.74
report. This report breaks down
the trading statistics to include
day trades as well as overnight
(normal) trades.
In addition, the reports lists
the total number of contracts
traded, including the number of
contracts for winning and los-
ing trades. With this informa-
tion you can calculate the im-
pact commissions would have
on your systems’ performance.
The average buy price and
average sell price are included,
as well as the average buy instru-
ment value and sell instrument
value. Other contracts have an
instrument value because of the
size of the contracts, such as
wheat is 5,000 bushels multi-
plied by the price equals the in-
strument value.
Any results that you save are
viewed by going to the Contracts
Lists and right mouse clicking
on the contract.
FIBONACCI TRADER SYSTEMS SUPPLEMENT Page 21