EY ITEM Club special report on consumer spending …...2019/04/19 · EY ITEM Club Special Report...
27
EY ITEM Club Special Report on Consumer Spending June 2019
Transcript of EY ITEM Club special report on consumer spending …...2019/04/19 · EY ITEM Club Special Report...
EY ITEM Club
Special Report on Consumer Spending
June 2019
EY 1
Contents Foreword 2
Highlights 4
1. Introduction 5
2. Recent trends in consumer spending 5
3. Purchasing power picked up since mid-2018 7
4. Other factors recently affecting spending 9
5. The outlook for household incomes 11
6. Factors affecting different household groups 16
7. Non-income drivers of consumer spending 18
8. Changing nature of consumer spending 23
9. ‘No-deal’ Brexit would hit consumption 23
10. Forecast for consumer spending growth 25
Conclusion 25
EY is the sole sponsor of the ITEM Club, which is the only non-governmental economic forecasting group to use the HM Treasury model of the UK economy. Its forecasts are independent of any political, economic or business bias.

Foreword
The consumer remains resilient …
Although consumer spending growth slowed to a six-year low of 1.8% in 2018, this was a stronger performance than was forecast in the 2018 EY ITEM Club Special Report on Consumer Spending. This trend for growth to surprise on the upside has continued with an increase of 0.7% over the previous quarter in the first three months of 2019.
The stronger than expected performance was due to more robust employment growth than predicted and a marked pick-up in real earnings growth over the second half of the year. With annual real earnings growth rising from just 0.1% in mid-2018 to 1.5% at the end of 2018, consumer confidence held up much better than business confidence. As a result, consumer spending in 2018 was once again the major driver of UK economic growth.
… but very dependent on the labour market …
However, as the EY ITEM Club notes, growth of 1.8% in consumer spending was the slowest rate of increase since 2012 and was significantly below the increase of 3.2% in 2016. Spending was also volatile with retail sales a case in point, with wide variations in growth rates throughout 2018. With debt levels having risen and savings rates falling, consumers will need to be confident about their employment prospects if they are to continue to drive the economy forward.
Our sense is that as the EY ITEM Club identifies, earnings growth is likely to slow slightly over the rest of 2019 while the rate of job creation will slow as the labour market softens. The EY ITEM Club expects employment growth will be 1.0% in 2019 and 0.6% in 2020, and that annual earnings growth will average 3.2% over 2019. With average consumer price inflation seen dipping to 1.8% in 2019 from 2.5% in 2018, overall inflation-adjusted pay is forecast to average 1.4% in 2019, down slightly from the end of 2018’s real earnings growth of 1.5%.
… meaning relatively low growth remains the norm ...
Consumer spending may gain some support from workers at the lower end of the pay scale benefitting from the National Living Wage rising by 4.9% in April 2019 and the National Minimum Wage seeing increases of 3.6%–4.3%, together with increases in tax thresholds. On balance, the EY ITEM Club sees consumer spending rising broadly in line with increases in real disposable income growth over the next couple of years. After slowing to a six-year low of 1.8% in 2018, it is forecast to remain at similar levels of 1.6% in 2019 and 1.7% in 2020.
… creating a set of challenges for business
The economy is unlikely to deliver growth to consumer-oriented businesses, and success will be dependent on a positive result in the battle for a greater share of the consumer wallet, which in some segments could be shrinking in real terms.
Fo
rew
ord
Julie Carlyle EY Partner & Head of Retail, UK&I
Mark Gregory EY Chief Economist, UK

Foreword
In this challenging environment, businesses looking for long-term sustainable success should consider:
► Reshaping and restructuring business models in order to adapt to the pervasive change in consumer and shopping habits. Organisations need to be bold in re-invention and, where possible, maximise the declining benefits from existing business models to help fund transformation.
► Reviewing the size of cost bases and infrastructure across the organisation. In many cases, operational structures that have developed over many years cannot be supported in today’s environment. Bravery to strip out previously trusted competences is required to flexibly keep up with the pace of change.
► Putting the consumer at the forefront of strategic thinking and understanding what it takes to engage with today’s consumer (and the consumer of tomorrow). In our increasingly ‘experience everything’ world, consumers expect transparency, personalisation and connectivity. Businesses need to provide this experience at every stage of the customer journey.
► Recognising that consumer buying habits will continue to change at pace and plan how best to remain relevant. As consumers rely more and more on intermediary technologies (such as smart home systems) to curate choices and purchases, many products will become a commodity — very few will have the engagement of discretionary shopping.
► Clarifying the definition and articulation of their brand and business purpose, in order to engage with both consumers and talent. More successful businesses will have a differentiated (or bold enough) purpose, embedded across the organisation so that is felt at every touch point with the consumer.
Many consumer businesses will rise to these broad set of challenges and the balance between dealing with today’s relentless pressures and re-inventing for an ever-changing long term will be a critical factor in success.

EY ITEM Club Special Report on Consumer Spending
EY 4
Highlights
► While consumer spending growth slowed to a six-year low of 1.8% in 2018 from 2.2% in 2017 and 3.2% in 2016, it out-performed the economy overall as GDP expanded 1.4%. Consumer spending then grew 0.7% q/q in Q1 2019, (its best performance for two years) as UK GDP growth picked up to 0.5% q/q.
► Consumer spending benefitted in 2018 from robust employment growth and a marked pick-up in real earnings growth over the second half; this was the consequence of both pay picking up and inflation moderating. Annual real earnings growth rose from just 0.1% in mid-2018 to 1.5% at the end of 2018 and a peak of 1.6% in early 2019 (the highest since mid-2016). Meanwhile, real household disposable income growth improved markedly to 2.2% in 2018, from just 0.5% in 2017 and a drop of 0.2% in 2016.
► The improvement in purchasing power has meant that consumers have been markedly less affected in their spending decisions than businesses by uncertainties over the economy and Brexit. While consumer confidence in late 2018/early 2019 weakened to the lowest level since mid-2013, perceptions of personal finances and willingness to spend generally held up much better than views of the economy.
► We suspect earnings growth peaked in early 2019 and is likely to remain modestly below this level over the rest of 2019 and very possibly beyond. We believe labour market strength will increasingly fray over the coming months as companies tailor their behaviour to a lacklustre domestic economy, prolonged Brexit uncertainties, a fraught domestic political environment and a challenging global environment. Employment growth is seen as slowing from 1.2% in 2018 to 1.0% in 2019 and 0.6% in 2020.
► We expect annual earnings growth to average 3.2% over 2019, up from the 2018 outturn of 3.0% but down modestly from the end of 2018’s growth rate of 3.5%. With average consumer price inflation seen dipping to 1.8% in 2019 from 2.5% in 2018, overall inflation-adjusted pay is forecast to average 1.4% in 2019; this would be down slightly from the end of 2018’s real earnings growth of 1.5% and the early 2019 peak of 1.6%. We see real earnings growth little changed at 1.2% in 2020.
► Consumer spending may gain some support from workers at the lower end of the pay scale benefitting from the National Living Wage rising by 4.9% in April 2019 and the National Minimum Wage seeing increases of 3.6–4.3%, as well as the increases in tax thresholds. Lower inflation also particularly benefits lower-paid workers as well as easing the squeeze on those on welfare.
► Prospects for non-labour income look mixed at best. Dividend growth looks likely to slow in 2019, while compensation payments for mis-sold Payment Protection Insurance (PPI) will soon be coming to an end.
► The Bank of England is seen lifting interest rates by only 50 basis points from the current level of 0.75% through to the end of 2020 (and could very well sit tight through 2019); this will keep interest rates at historically very low levels (1.25% at end-2020) and should have little impact on consumer spending.
► With the household saving ratio very low compared to long-term norms, despite a modest rise in 2018, we expect consumers to be, at the very least, keen to avoid further dissaving, especially given current major uncertainties. Meanwhile, lenders have cut back on the availability of unsecured consumer credit.
► On balance, we see consumer spending rising broadly in line with increases in real disposable income growth over the next couple of years. Specifically, following consumer spending growth slowing to a six-year low of 1.8% in 2018, we forecast it to essentially stabilise at 1.6% in 2019 and 1.7% in 2020.
► If the UK eventually leaves the EU without a ‘deal’ — be it at the end of October or some other time — we expect consumer spending to be significantly weaker, even allowing for its resilience in the immediate aftermath of the Brexit referendum in June 2016. The expected combination of a softer labour market (stemming from weakened growth prospects and heightened business uncertainty) and lower purchasing power resulting from higher inflation and reduced earnings growth, would likely weigh markedly on consumer spending — although it is very possible consumers may be less worried about the heightened uncertainties resulting from a ‘no-deal’ Brexit than businesses. Moreover, the downward pressure on consumer spending would likely be limited by monetary and fiscal measures to help the economy.
EY ITEM Club Special Report on Consumer Spending
EY 5
1. Introduction
A notable feature of the UK economy over 2018 and the early months of 2019 has been the relative resilience of the consumer. While the UK economy overall performed broadly in line with expectations in 2018, consumer spending growth was modestly better than had been anticipated. Having said that, the performance of consumer spending was not hugely out of line with the economy overall, which tends to be the case given that the sector comprises just under 65% of GDP. It tends to take something pretty remarkable for consumer spending not to be the key driver of the economy’s performance.
In our last Special Report on Consumer Spending, published in March 20181, we forecast consumer spending would grow 1.3% in real terms in 2018 as GDP expanded 1.7%. The actual 2018 outturn saw UK GDP growth lower than anticipated at 1.4% (the weakest performance since 2012), while consumer spending growth was above expectations at 1.8%. The relative resilience of the consumer in 2018 contrasted with some other areas of the economy as Brexit and economic uncertainties (notably including slowing global growth) mounted during the year. In particular, consumer spending growth of 1.8% in 2018 compared with a fall in business investment of 0.4% and export growth of just 0.1%.
However, while consumer spending growth was better than anticipated in 2018 and outperformed GDP growth, it was still the slowest expansion in private consumption since 2012 — down from growth of 2.2% in 2017 and 3.2% in 2016. Particularly weak in 2018 was spending on new cars, with private registrations down 6.4% (this followed a drop of 6.8% in 2017). There also appeared to be appreciable consumer caution in spending on services. However, growth in retail sales volumes (accounting for around one-third of consumer spending) picked up in 2018 after a sharp slowdown in 2017.
The early months of 2019 saw consumers spending strongly despite heightened uncertainties over Brexit. Indeed, consumer spending growth of 0.7% q/q in Q1 2019 was the best quarterly performance for two years. Retail sales were particularly robust through Q1 and may have benefitted from special factors — notably warm weather, as well as possibly some stockpiling and bringing forward of purchases amid concerns that a disruptive ‘no-deal’ Brexit could have occurred in late March.
This new Special Report begins by looking at the factors which influenced consumer spending over 2018 and the early months of 2019, before turning to the outlook for the rest of 2019 and beyond. We consider the key issues of prospective pay and employment growth, as well as potential non-income drivers of consumer spending. We conclude by setting out our overall forecast for consumer spending and consider the outlook for consumer spending in the event of a ‘no-deal’ Brexit.
2. Recent trends in consumer spending
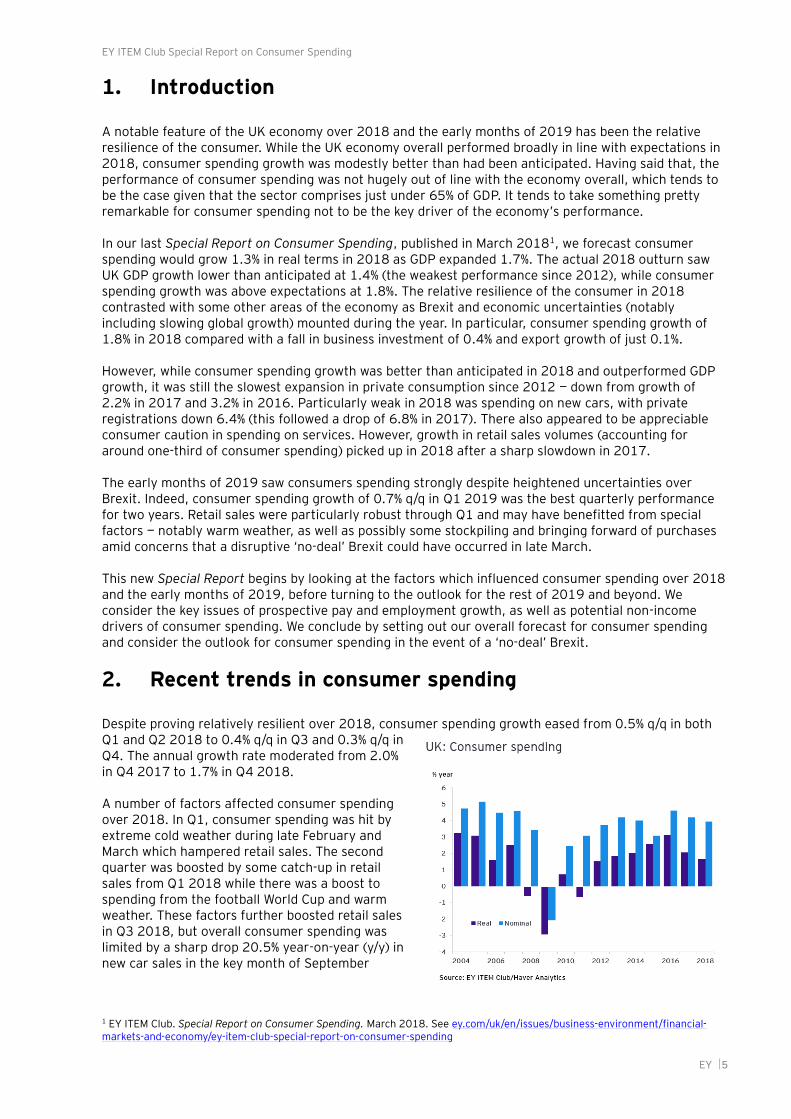
Despite proving relatively resilient over 2018, consumer spending growth eased from 0.5% q/q in both Q1 and Q2 2018 to 0.4% q/q in Q3 and 0.3% q/q in Q4. The annual growth rate moderated from 2.0% in Q4 2017 to 1.7% in Q4 2018.
A number of factors affected consumer spending over 2018. In Q1, consumer spending was hit by extreme cold weather during late February and March which hampered retail sales. The second quarter was boosted by some catch-up in retail sales from Q1 2018 while there was a boost to spending from the football World Cup and warm weather. These factors further boosted retail sales in Q3 2018, but overall consumer spending was limited by a sharp drop 20.5% year-on-year (y/y) in new car sales in the key month of September
1 EY ITEM Club. Special Report on Consumer Spending. March 2018. See ey.com/uk/en/issues/business-environment/financial-markets-and-economy/ey-item-club-special-report-on-consumer-spending

EY ITEM Club Special Report on Consumer Spending
EY 6
(when number plates change). Car sales and retail sales were soft in Q4 2018 but there was higher spending on household goods and services.
The consumption picture was also weaker in 2018 in cash or nominal terms. Specifically, growth in nominal consumer spending slowed to 3.9% in 2018 from 4.2% in 2017 and 4.6% in 2016 (which had been the strongest expansion in cash terms since 2007). On a nominal basis, 2018’s performance was slightly better than the 3.6% rise averaged since the current period of economic growth began in 2010. So in essence, consumers spent broadly in line with recent norms in 2018 but got less for their money.
Looking in detail at individual consumer spending sectors, retail sales volumes growth picked up to 2.7% in 2018 after slowing markedly to a four-year low of 2.0% in 2017 from 4.7% in 2016. Retail sales began 2018 poorly, falling 0.3% q/q in Q1 as freezing weather hampered consumers’ ability to get to the shops. Sales volumes rebounded 1.2% q/q in Q2 2018, not only reflecting some making up of sales lost in Q1 but also getting a lift from warm weather as well as from the football World Cup which took place in June/July.
Retail sales volumes maintained buoyancy in Q3 2018, growing 1.3% q/q with further help from the World Cup but more significantly from the summer heatwave. However, retail sales then stagnated in Q4 2018. This appears to have been due to consumers adopting a more cautious approach after splashing out on retail sales in Q2 and Q3, amid heightened concerns over the economic and political outlook as Brexit uncertainties increased. While retail sales spiked 1.2% month-on-month (m/m) in November, this was seemingly driven by consumers looking to take advantage of Black Friday sales and promotions. Indeed, retail sales subsequently fell back 0.7% m/m in December, indicating that the Black Friday events had primarily brought forward retail purchases to November from December, rather than lifting sales overall. The extended squeeze on purchasing power has encouraged consumers to become savvier in their Christmas shopping in recent years.
Private new car sales were weak over 2018, declining 6.4%, with falls in eight out of 12 months. This followed a drop of 6.8% in 2017, after they had reached a record high in 2016. The weakness was particularly pronounced in the latter months of 2018. Private car sales were pressurised in 2018 by a number of factors — dwindling demand for diesel cars, stricter emission regulations leading to supply problems since September, and consumers clearly being cautious over making major purchases.
Consumer spending on services was relatively lacklustre over 2018. The Q4 2018 Consumer trends released by the Office for National Statistics (ONS) revealed that falls in real terms occurred in 2018 in consumer spending on restaurants and hotels (0.5%), education (0.8%) and communications (2.7%), while growth in spending on recreation and culture slowed to 0.9% from 3.0% in 2017. However, health spending rose to 11.1% from 9.7% in 2017.
Consumer spending showed impressive strength in the early months of 2019. Indeed, growth picked up to 0.7% q/q in Q1 2019; this was the best performance for two years and lifted y/y growth to 1.9% from 1.7% in Q4 2018. This was undeniably a resilient performance — but ‘special’ factors seemingly lent a hand, notably unseasonably warm weather in February and March as well as the Brexit effect.
Consumer spending’s strength in Q1 2019 was centred on retail sales, which grew 1.7% q/q with healthy performances in each month. Warm weather was reported to have helped retail sales in both March and February, while January’s sales were seemingly buoyed by consumers taking advantage of the clearance sales, adding to evidence that they have been particularly keen to time their purchases to get the best value possible for their money.
In addition to the warm weather, it is very possible that retail sales gained a lift in Q1 from some stockpiling of goods by consumers wary of a ‘no-deal’ Brexit occurring at the end of March. There were
EY ITEM Club Special Report on Consumer Spending
EY 7
some reports of this occurring. It is also possible that some consumers brought forward purchases amid concern that prices could rise if a disruptive Brexit in late March led to sterling weakening sharply.
The run of strong monthly retail sales gains ended in April when volumes were flat m/m. The later Easter this year and warm weather provided some support to retail sales in April, but consumers were always likely to take a breather after the Q1 splurge. Retail sales volumes were still up 5.2% y/y in April and 1.8% on a three-month/three-month basis. However, CBI and British Retail Consortium (BRC) surveys point to markedly weakened retail sales in May.
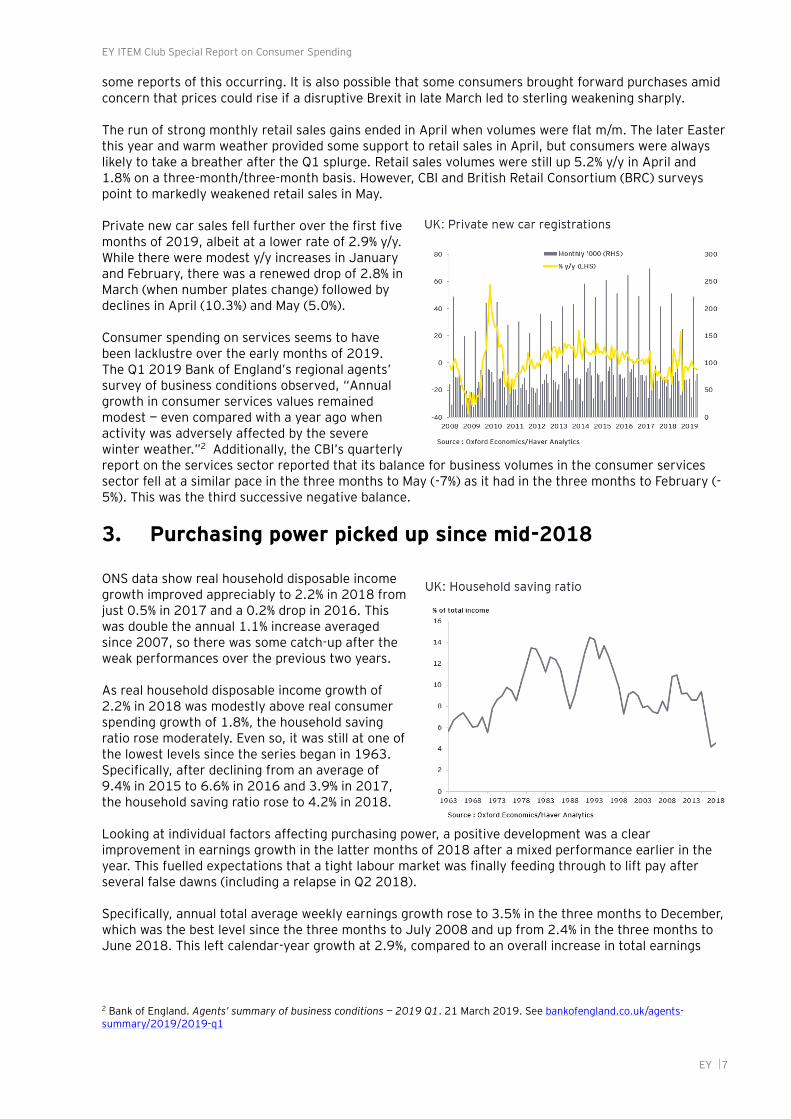
Private new car sales fell further over the first five months of 2019, albeit at a lower rate of 2.9% y/y. While there were modest y/y increases in January and February, there was a renewed drop of 2.8% in March (when number plates change) followed by declines in April (10.3%) and May (5.0%).
Consumer spending on services seems to have been lacklustre over the early months of 2019. The Q1 2019 Bank of England’s regional agents’ survey of business conditions observed, “Annual growth in consumer services values remained modest — even compared with a year ago when activity was adversely affected by the severe winter weather.”2 Additionally, the CBI’s quarterly report on the services sector reported that its balance for business volumes in the consumer services sector fell at a similar pace in the three months to May (-7%) as it had in the three months to February (-5%). This was the third successive negative balance.
3. Purchasing power picked up since mid-2018
ONS data show real household disposable income growth improved appreciably to 2.2% in 2018 from just 0.5% in 2017 and a 0.2% drop in 2016. This was double the annual 1.1% increase averaged since 2007, so there was some catch-up after the weak performances over the previous two years.
As real household disposable income growth of 2.2% in 2018 was modestly above real consumer spending growth of 1.8%, the household saving ratio rose moderately. Even so, it was still at one of the lowest levels since the series began in 1963. Specifically, after declining from an average of 9.4% in 2015 to 6.6% in 2016 and 3.9% in 2017, the household saving ratio rose to 4.2% in 2018.
Looking at individual factors affecting purchasing power, a positive development was a clear improvement in earnings growth in the latter months of 2018 after a mixed performance earlier in the year. This fuelled expectations that a tight labour market was finally feeding through to lift pay after several false dawns (including a relapse in Q2 2018).
Specifically, annual total average weekly earnings growth rose to 3.5% in the three months to December, which was the best level since the three months to July 2008 and up from 2.4% in the three months to June 2018. This left calendar-year growth at 2.9%, compared to an overall increase in total earnings
2 Bank of England. Agents’ summary of business conditions — 2019 Q1. 21 March 2019. See bankofengland.co.uk/agents-summary/2019/2019-q1
EY ITEM Club Special Report on Consumer Spending
EY 8
growth of 2.4% in 2017 and 2.3% in 2016. Even so, earnings growth remained clearly below the pre-financial crisis norm of 4.5%–5% annual growth.
Annual regular earnings growth (which strips out sometimes-volatile bonus payments) stood at 3.4% in the three months to December, which was also the best level for a decade. It was up from 2.7% in the three months to June 2018 and 2.1% in the three months to August 2017.
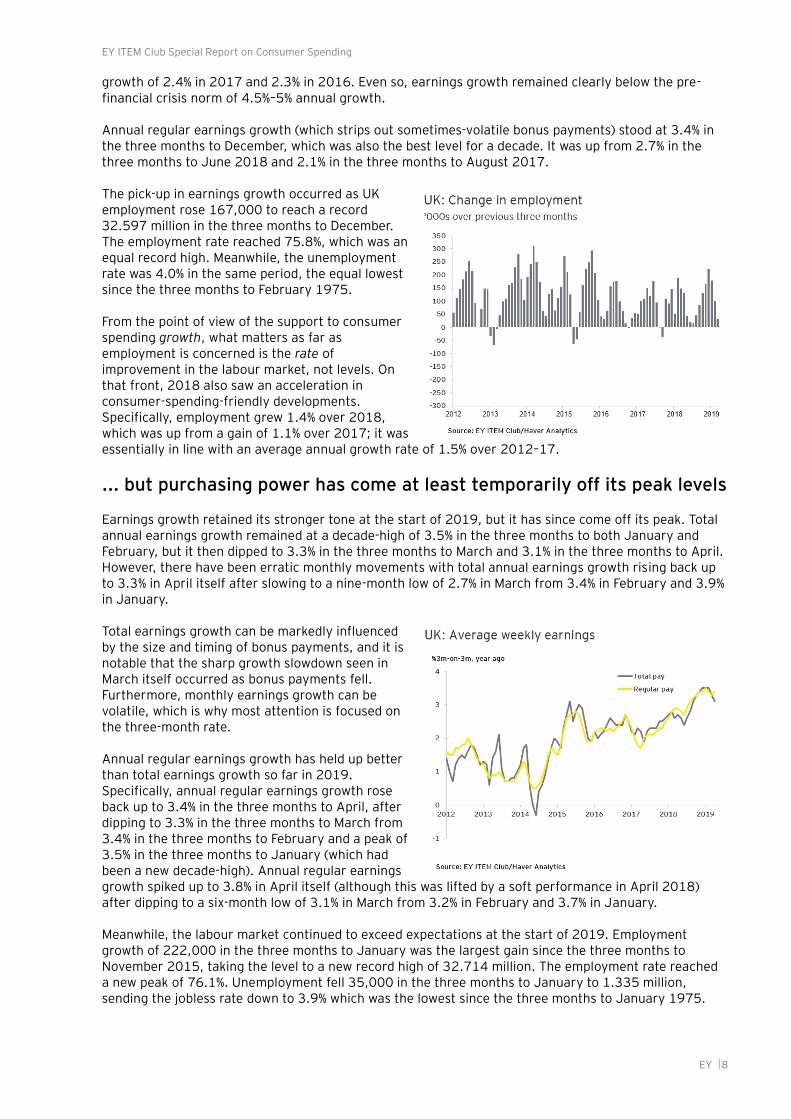
The pick-up in earnings growth occurred as UK employment rose 167,000 to reach a record 32.597 million in the three months to December. The employment rate reached 75.8%, which was an equal record high. Meanwhile, the unemployment rate was 4.0% in the same period, the equal lowest since the three months to February 1975.
From the point of view of the support to consumer spending growth, what matters as far as employment is concerned is the rate of improvement in the labour market, not levels. On that front, 2018 also saw an acceleration in consumer-spending-friendly developments. Specifically, employment grew 1.4% over 2018, which was up from a gain of 1.1% over 2017; it was essentially in line with an average annual growth rate of 1.5% over 2012–17.
... but purchasing power has come at least temporarily off its peak levels
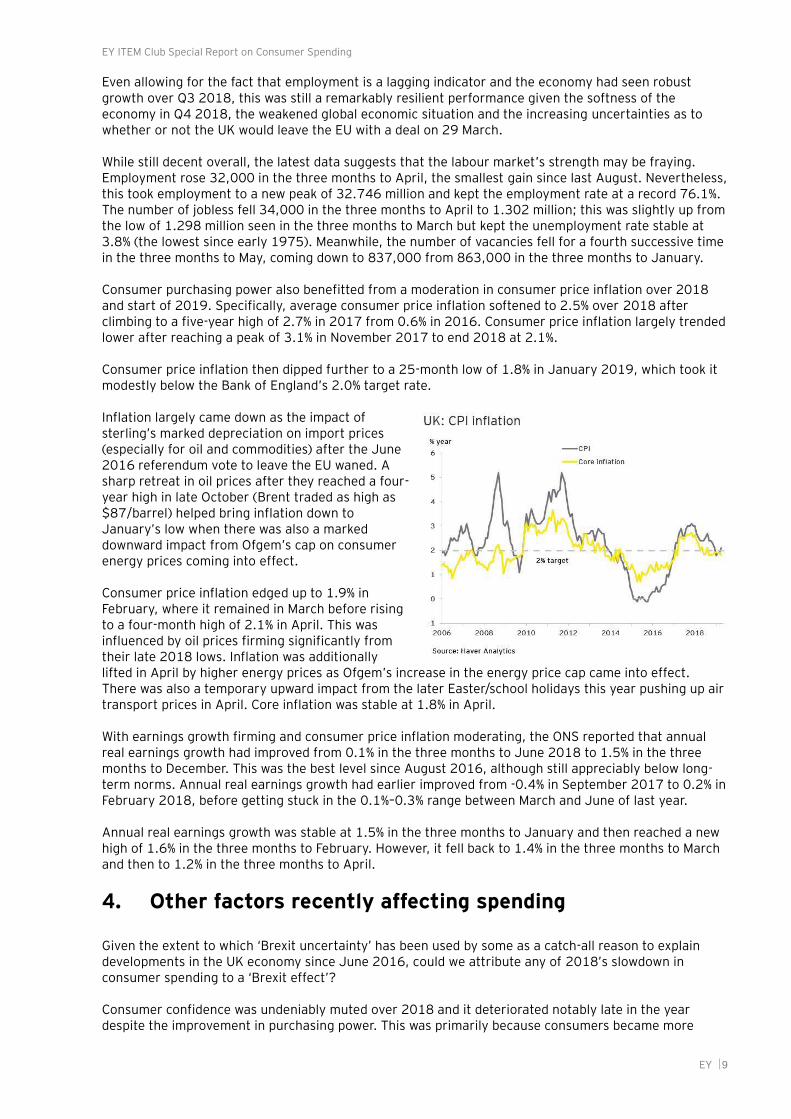
Earnings growth retained its stronger tone at the start of 2019, but it has since come off its peak. Total annual earnings growth remained at a decade-high of 3.5% in the three months to both January and February, but it then dipped to 3.3% in the three months to March and 3.1% in the three months to April. However, there have been erratic monthly movements with total annual earnings growth rising back up to 3.3% in April itself after slowing to a nine-month low of 2.7% in March from 3.4% in February and 3.9% in January.
Total earnings growth can be markedly influenced by the size and timing of bonus payments, and it is notable that the sharp growth slowdown seen in March itself occurred as bonus payments fell. Furthermore, monthly earnings growth can be volatile, which is why most attention is focused on the three-month rate.
Annual regular earnings growth has held up better than total earnings growth so far in 2019. Specifically, annual regular earnings growth rose back up to 3.4% in the three months to April, after dipping to 3.3% in the three months to March from 3.4% in the three months to February and a peak of 3.5% in the three months to January (which had been a new decade-high). Annual regular earnings growth spiked up to 3.8% in April itself (although this was lifted by a soft performance in April 2018) after dipping to a six-month low of 3.1% in March from 3.2% in February and 3.7% in January.
Meanwhile, the labour market continued to exceed expectations at the start of 2019. Employment growth of 222,000 in the three months to January was the largest gain since the three months to November 2015, taking the level to a new record high of 32.714 million. The employment rate reached a new peak of 76.1%. Unemployment fell 35,000 in the three months to January to 1.335 million, sending the jobless rate down to 3.9% which was the lowest since the three months to January 1975.
EY ITEM Club Special Report on Consumer Spending
EY 9
Even allowing for the fact that employment is a lagging indicator and the economy had seen robust growth over Q3 2018, this was still a remarkably resilient performance given the softness of the economy in Q4 2018, the weakened global economic situation and the increasing uncertainties as to whether or not the UK would leave the EU with a deal on 29 March. While still decent overall, the latest data suggests that the labour market’s strength may be fraying. Employment rose 32,000 in the three months to April, the smallest gain since last August. Nevertheless, this took employment to a new peak of 32.746 million and kept the employment rate at a record 76.1%. The number of jobless fell 34,000 in the three months to April to 1.302 million; this was slightly up from the low of 1.298 million seen in the three months to March but kept the unemployment rate stable at 3.8% (the lowest since early 1975). Meanwhile, the number of vacancies fell for a fourth successive time in the three months to May, coming down to 837,000 from 863,000 in the three months to January.
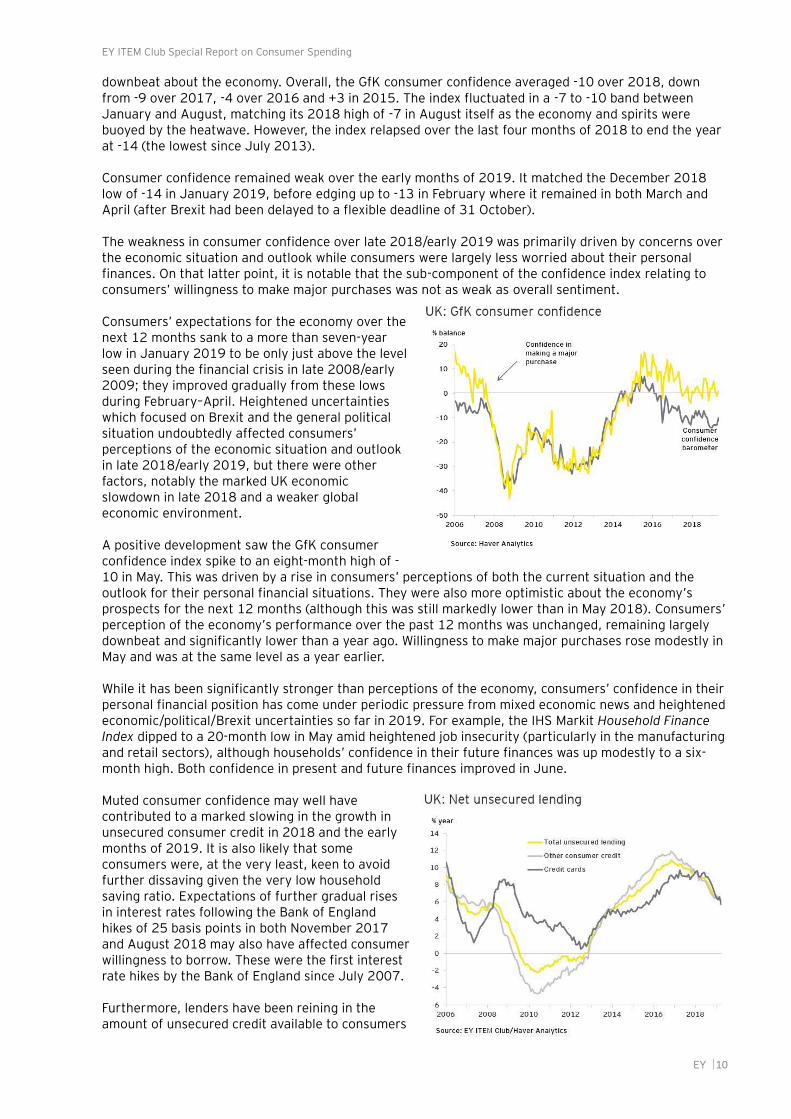
Consumer purchasing power also benefitted from a moderation in consumer price inflation over 2018 and start of 2019. Specifically, average consumer price inflation softened to 2.5% over 2018 after climbing to a five-year high of 2.7% in 2017 from 0.6% in 2016. Consumer price inflation largely trended lower after reaching a peak of 3.1% in November 2017 to end 2018 at 2.1%.
Consumer price inflation then dipped further to a 25-month low of 1.8% in January 2019, which took it modestly below the Bank of England’s 2.0% target rate.
Inflation largely came down as the impact of sterling’s marked depreciation on import prices (especially for oil and commodities) after the June 2016 referendum vote to leave the EU waned. A sharp retreat in oil prices after they reached a four-year high in late October (Brent traded as high as $87/barrel) helped bring inflation down to January’s low when there was also a marked downward impact from Ofgem’s cap on consumer energy prices coming into effect.
Consumer price inflation edged up to 1.9% in February, where it remained in March before rising to a four-month high of 2.1% in April. This was influenced by oil prices firming significantly from their late 2018 lows. Inflation was additionally lifted in April by higher energy prices as Ofgem’s increase in the energy price cap came into effect. There was also a temporary upward impact from the later Easter/school holidays this year pushing up air transport prices in April. Core inflation was stable at 1.8% in April.
With earnings growth firming and consumer price inflation moderating, the ONS reported that annual real earnings growth had improved from 0.1% in the three months to June 2018 to 1.5% in the three months to December. This was the best level since August 2016, although still appreciably below long-term norms. Annual real earnings growth had earlier improved from -0.4% in September 2017 to 0.2% in February 2018, before getting stuck in the 0.1%–0.3% range between March and June of last year.
Annual real earnings growth was stable at 1.5% in the three months to January and then reached a new high of 1.6% in the three months to February. However, it fell back to 1.4% in the three months to March and then to 1.2% in the three months to April.
4. Other factors recently affecting spending
Given the extent to which ‘Brexit uncertainty’ has been used by some as a catch-all reason to explain developments in the UK economy since June 2016, could we attribute any of 2018’s slowdown in consumer spending to a ‘Brexit effect’?
Consumer confidence was undeniably muted over 2018 and it deteriorated notably late in the year despite the improvement in purchasing power. This was primarily because consumers became more
EY ITEM Club Special Report on Consumer Spending
EY 10
downbeat about the economy. Overall, the GfK consumer confidence averaged -10 over 2018, down from -9 over 2017, -4 over 2016 and +3 in 2015. The index fluctuated in a -7 to -10 band between January and August, matching its 2018 high of -7 in August itself as the economy and spirits were buoyed by the heatwave. However, the index relapsed over the last four months of 2018 to end the year at -14 (the lowest since July 2013).
Consumer confidence remained weak over the early months of 2019. It matched the December 2018 low of -14 in January 2019, before edging up to -13 in February where it remained in both March and April (after Brexit had been delayed to a flexible deadline of 31 October).
The weakness in consumer confidence over late 2018/early 2019 was primarily driven by concerns over the economic situation and outlook while consumers were largely less worried about their personal finances. On that latter point, it is notable that the sub-component of the confidence index relating to consumers’ willingness to make major purchases was not as weak as overall sentiment.
Consumers’ expectations for the economy over the next 12 months sank to a more than seven-year low in January 2019 to be only just above the level seen during the financial crisis in late 2008/early 2009; they improved gradually from these lows during February–April. Heightened uncertainties which focused on Brexit and the general political situation undoubtedly affected consumers’ perceptions of the economic situation and outlook in late 2018/early 2019, but there were other factors, notably the marked UK economic slowdown in late 2018 and a weaker global economic environment.
A positive development saw the GfK consumer confidence index spike to an eight-month high of -10 in May. This was driven by a rise in consumers’ perceptions of both the current situation and the outlook for their personal financial situations. They were also more optimistic about the economy’s prospects for the next 12 months (although this was still markedly lower than in May 2018). Consumers’ perception of the economy’s performance over the past 12 months was unchanged, remaining largely downbeat and significantly lower than a year ago. Willingness to make major purchases rose modestly in May and was at the same level as a year earlier.
While it has been significantly stronger than perceptions of the economy, consumers’ confidence in their personal financial position has come under periodic pressure from mixed economic news and heightened economic/political/Brexit uncertainties so far in 2019. For example, the IHS Markit Household Finance Index dipped to a 20-month low in May amid heightened job insecurity (particularly in the manufacturing and retail sectors), although households’ confidence in their future finances was up modestly to a six-month high. Both confidence in present and future finances improved in June.
Muted consumer confidence may well have contributed to a marked slowing in the growth in unsecured consumer credit in 2018 and the early months of 2019. It is also likely that some consumers were, at the very least, keen to avoid further dissaving given the very low household saving ratio. Expectations of further gradual rises in interest rates following the Bank of England hikes of 25 basis points in both November 2017 and August 2018 may also have affected consumer willingness to borrow. These were the first interest rate hikes by the Bank of England since July 2007.
Furthermore, lenders have been reining in the amount of unsecured credit available to consumers
EY ITEM Club Special Report on Consumer Spending
EY 11
and tightening their lending standards. Consequently, Bank of England data shows annual growth in unsecured consumer credit in April 2019 was the slowest since June 2014. Specifically, annual unsecured consumer credit growth dipped to 5.9% in April from 6.4% in March, 6.5% in February and a peak of 10.9% in November 2016. A significant factor has been markedly weaker private car sales as this has reduced demand for car finance.
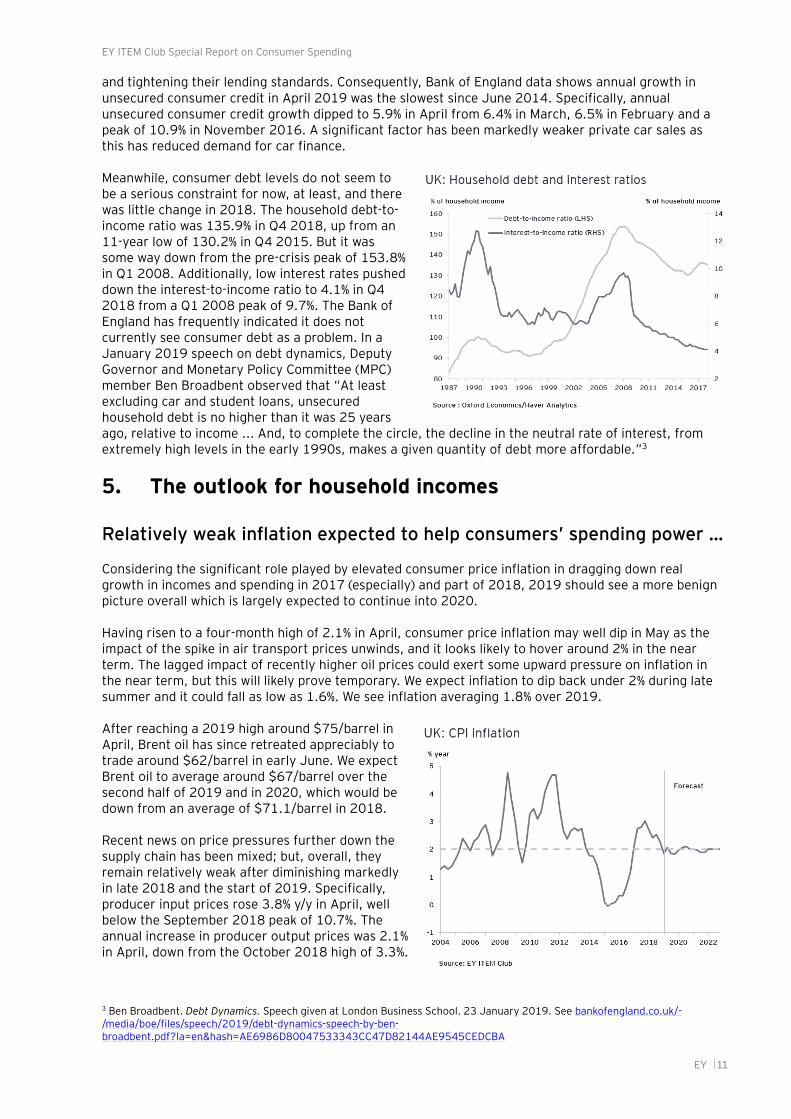
Meanwhile, consumer debt levels do not seem to be a serious constraint for now, at least, and there was little change in 2018. The household debt-to-income ratio was 135.9% in Q4 2018, up from an 11-year low of 130.2% in Q4 2015. But it was some way down from the pre-crisis peak of 153.8% in Q1 2008. Additionally, low interest rates pushed down the interest-to-income ratio to 4.1% in Q4 2018 from a Q1 2008 peak of 9.7%. The Bank of England has frequently indicated it does not currently see consumer debt as a problem. In a January 2019 speech on debt dynamics, Deputy Governor and Monetary Policy Committee (MPC) member Ben Broadbent observed that “At least excluding car and student loans, unsecured household debt is no higher than it was 25 years ago, relative to income ... And, to complete the circle, the decline in the neutral rate of interest, from extremely high levels in the early 1990s, makes a given quantity of debt more affordable.”3
5. The outlook for household incomes
Relatively weak inflation expected to help consumers’ spending power …
Considering the significant role played by elevated consumer price inflation in dragging down real growth in incomes and spending in 2017 (especially) and part of 2018, 2019 should see a more benign picture overall which is largely expected to continue into 2020.
Having risen to a four-month high of 2.1% in April, consumer price inflation may well dip in May as the impact of the spike in air transport prices unwinds, and it looks likely to hover around 2% in the near term. The lagged impact of recently higher oil prices could exert some upward pressure on inflation in the near term, but this will likely prove temporary. We expect inflation to dip back under 2% during late summer and it could fall as low as 1.6%. We see inflation averaging 1.8% over 2019.
After reaching a 2019 high around $75/barrel in April, Brent oil has since retreated appreciably to trade around $62/barrel in early June. We expect Brent oil to average around $67/barrel over the second half of 2019 and in 2020, which would be down from an average of $71.1/barrel in 2018. Recent news on price pressures further down the supply chain has been mixed; but, overall, they remain relatively weak after diminishing markedly in late 2018 and the start of 2019. Specifically, producer input prices rose 3.8% y/y in April, well below the September 2018 peak of 10.7%. The annual increase in producer output prices was 2.1% in April, down from the October 2018 high of 3.3%.
3 Ben Broadbent. Debt Dynamics. Speech given at London Business School. 23 January 2019. See bankofengland.co.uk/-/media/boe/files/speech/2019/debt-dynamics-speech-by-ben-broadbent.pdf?la=en&hash=AE6986D80047533343CC47D82144AE9545CEDCBA

EY ITEM Club Special Report on Consumer Spending
EY 12
Meanwhile, domestic inflation pressures are expected to be relatively modest over the coming months amid likely lacklustre UK growth. Admittedly unit labour costs rose 3.1% in 2018, which was the sharpest increase since 2013 and was the consequence of increased earnings growth and poor productivity. However, we suspect that earnings growth has peaked, at least for the time being. Consumer price inflation is seen firming slightly to average 2.0% in 2020 as modestly stronger GDP growth increases domestic inflationary pressures. However, an expected firmer pound will help to limit this rise in inflationary pressures.
… but earnings growth looks likely to have peaked for time being at least
But will further increases in cash wages combine with lower inflation to deliver a double leg-up for real incomes? Specifically, can earnings growth build on the clear improvement seen through the second half of 2018 or will it flatten out or even relapse?
Our suspicion is that annual earnings growth peaked in late 2018/early 2019 and is likely to remain modestly below this level over the rest of 2019 and very possibly beyond.
True, it can be argued that the ingredients in terms of labour market tightness are still largely in place to push pay up further. As at the three months to April 2019, the unemployment rate of 3.8% was the lowest since the three months to December 1974, while an employment rate of 76.1% was the highest since records began in 1971.
Additionally, the economic inactivity rate (the proportion of people aged from 16 to 64 who were economically inactive) was 20.7% in the three months to both January and February 2018, the lowest figure since comparable estimates began in 1971. It remained very close to this record low level at 20.8% in the three months to April. Furthermore, a ratio of 1.56 unemployed people per job vacancy in the three months to April was close to another historic low. Business surveys suggest that skills shortages have built up in a number of sectors over the last year, particularly for skilled and professional staff.
Meanwhile, pay growth for those towards the lower end of the income distribution will continue to receive support from state-sanctioned increases in the National Minimum Wage (NMW) and National Living Wage (NLW).
However, caution seems advisable in predicting that pay growth will continue to pick-up. Employers will certainly be keen to keep their labour costs as low as possible given the current highly uncertain economic outlook and they will face rising costs from pensions auto-enrolment (having risen from 1% to 2% in April 2018, contribution rates rose further to 3% in April 2019). Additionally, employers with pay bills of more than £3 million a year have had to pay the Apprenticeship Levy since April 2017.
Furthermore, latest productivity developments are hardly conducive to granting higher pay increases. ONS data show that output per hour worked was down 0.2% y/y in Q1 2019; which was the third successive annual decline. This marked a poor start to 2019 for productivity after an underwhelming overall performance in 2018. Indeed, labour productivity rose just 0.5% over 2018 as a whole, which was markedly below the annual average growth rate of 2.0% seen before the 2008/9 downturn. It also meant that unit labour costs rose 3.1% in 2018, the most since 2013.
Meanwhile, several of the factors that seem to have limited pay growth’s response to a tightening labour market in recent years are still significant — notably a lack of worker power stemming from de-unionisation, globalisation and the threat of offshoring. Fragile consumer confidence has also probably deterred many workers from pushing hard for markedly higher pay rises over the past couple of years.
EY ITEM Club Special Report on Consumer Spending
EY 13
Moreover, the low official unemployment rate disguises a still significant pool of working-age people who are out of work or underemployed. As at the three months to April 2019, 4.06 million people were either officially unemployed (1.304 million), classed as inactive but saying they wished to work (1.823 million), or in part-time jobs but wanting a full-time role (933,000). And the experience since the 1980s is that while recessions have been effective at shocking pay growth down, expansions, even of the duration seen from 1992 to 2007, struggle to push pay growth up. So past performance suggests that our expectation of a continued expansion in the economy will not be a guarantee for further pay rises.
A final factor likely to limit any further pick-up in earnings growth is that employment growth looks set to be clearly lower over the rest of 2019 after a strong start.
There is survey support suggesting pay growth may have peaked after labour market tightness lifted starting salaries and also salaries for people switching jobs as 2018 progressed.
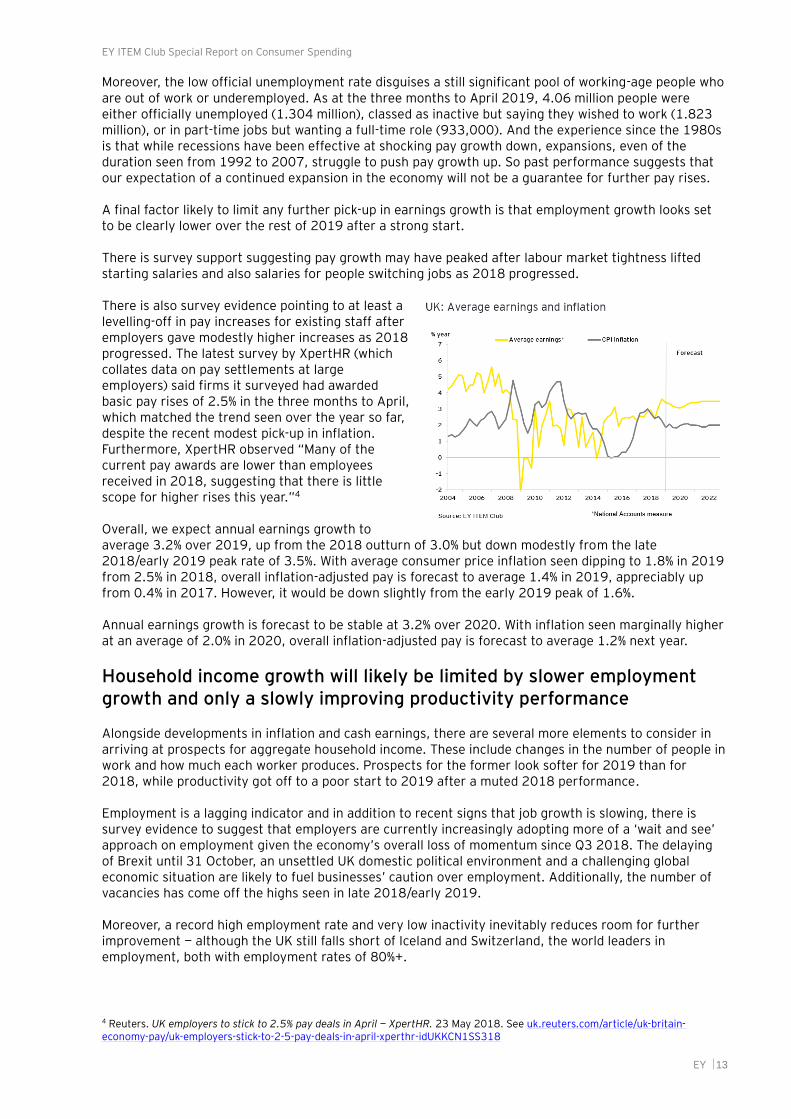
There is also survey evidence pointing to at least a levelling-off in pay increases for existing staff after employers gave modestly higher increases as 2018 progressed. The latest survey by XpertHR (which collates data on pay settlements at large employers) said firms it surveyed had awarded basic pay rises of 2.5% in the three months to April, which matched the trend seen over the year so far, despite the recent modest pick-up in inflation. Furthermore, XpertHR observed “Many of the current pay awards are lower than employees received in 2018, suggesting that there is little scope for higher rises this year.”4
Overall, we expect annual earnings growth to average 3.2% over 2019, up from the 2018 outturn of 3.0% but down modestly from the late 2018/early 2019 peak rate of 3.5%. With average consumer price inflation seen dipping to 1.8% in 2019 from 2.5% in 2018, overall inflation-adjusted pay is forecast to average 1.4% in 2019, appreciably up from 0.4% in 2017. However, it would be down slightly from the early 2019 peak of 1.6%.
Annual earnings growth is forecast to be stable at 3.2% over 2020. With inflation seen marginally higher at an average of 2.0% in 2020, overall inflation-adjusted pay is forecast to average 1.2% next year.
Household income growth will likely be limited by slower employment growth and only a slowly improving productivity performance
Alongside developments in inflation and cash earnings, there are several more elements to consider in arriving at prospects for aggregate household income. These include changes in the number of people in work and how much each worker produces. Prospects for the former look softer for 2019 than for 2018, while productivity got off to a poor start to 2019 after a muted 2018 performance.
Employment is a lagging indicator and in addition to recent signs that job growth is slowing, there is survey evidence to suggest that employers are currently increasingly adopting more of a ‘wait and see’ approach on employment given the economy’s overall loss of momentum since Q3 2018. The delaying of Brexit until 31 October, an unsettled UK domestic political environment and a challenging global economic situation are likely to fuel businesses’ caution over employment. Additionally, the number of vacancies has come off the highs seen in late 2018/early 2019.
Moreover, a record high employment rate and very low inactivity inevitably reduces room for further improvement — although the UK still falls short of Iceland and Switzerland, the world leaders in employment, both with employment rates of 80%+.
4 Reuters. UK employers to stick to 2.5% pay deals in April — XpertHR. 23 May 2018. See uk.reuters.com/article/uk-britain-economy-pay/uk-employers-stick-to-2-5-pay-deals-in-april-xperthr-idUKKCN1SS318

EY ITEM Club Special Report on Consumer Spending
EY 14
Meanwhile, some of the big drivers of growth in the UK workforce have tailed off. Since 2012, expansion in the number of workers has been to a large extent driven by inflows of foreign-born people. From Q1 2012 to Q4 2017, the UK workforce rose by 1.6 million people. Within this, the number of UK-born people in the workforce climbed a much more modest 336,000. Meanwhile, there was an increase of 1.25 million in the foreign-born workforce, with a majority (816,000) made up of people born in EU countries.
However, growth in the foreign-born workforce slowed sharply over 2018. There was only an increase of 13,300 in the year to Q4 2018, down from 49,600 in the year to Q4 2017 and an average of 240,000 a year over 2012–16. The change was particularly marked for EU-born people. Indeed, the number of EU-born people in the UK workforce fell 74,000 in the year to Q4 2018, compared to an increase of 63,000 in the year to Q4 2017 and an annual average increase of 150,600 over the earlier 2012–16 period.
Admittedly, the number of non-UK workers was up 125,200 in the year to Q1 2019, but the strong suspicion is that the growth in the foreign-born workforce will be limited going forward, particularly from the EU, given ongoing Brexit uncertainties and the likely immigration policy after Brexit occurs, the pound’s relatively soft level against the euro compared to the earlier period, and falling unemployment in the EU (the unemployment rate was down to 6.4% in April 2019, the lowest since Eurostat started a monthly unemployment series for the EU in January 2000).
There was though, a renewed pick-up in 2018 in the participation of older people in the UK workforce following a slowdown in 2017 which had been a hiccup in the recent marked growth of older workers. As of Q4 2018, the number of people aged 50 or older in work or looking for work was up 2.9% y/y. Growth had previously slowed to 1.7% in the year to Q4 2017, which was down from 2.5% in the year to Q4 2016 and a peak of 3.3% at the end of 2013. The increase in the state pension age from 65 to 66 between 2019 and 2020 will support workforce growth. But this will battle against a steadily ageing UK population and the depressing effect on participation that a greying population invariably entails.
Overall, we expect employment growth to slow over the rest of 2019, as companies tailor their behaviour to a relatively lacklustre domestic economy, prolonged Brexit uncertainties, a fraught domestic political situation and a challenging global environment. Employment growth may also be limited by increased difficulties in finding suitable candidates in some sectors. Specifically, we expect employment growth to be 1.0% over 2019 (largely due to the strong gains at the start of the year), with the unemployment rate edging back up to 3.9% by the end of the year. This is down from the gain of 1.2% in 2018.
With the economy expected to improve modestly in 2020 and uncertainties assumed to have reduced by the UK having left the EU with a deal at the end of October 2019, we expect employment to rise by 0.6%, with the unemployment rate remaining at 3.9%.
From the point of view of overall household incomes, a key question is whether a slower rise in the number of people in work will be compensated for by a more productive workforce (and the willingness of employers to share the fruits of higher productivity with their staff). The post-financial crisis period overall and the performance in 2018 and Q1 2019 does not bode well here.
And a recent history of relatively soft growth in business investment and the absence of any evidence suggesting that firms are engaging in a large expansion in their training programmes also offer cause for pessimism. Indeed, business investment fell 0.4% over 2018, contracting q/q in each quarter (the first time business investment had contracted for four quarters running since the 2008/9 downturn) as businesses seemingly adopted an increasingly cautious approach to capital expenditure amid mounting Brexit uncertainties. While business investment rose 0.5% q/q in Q1 2019, this failed to recoup the 0.9% q/q drop seen in Q4 2018, and it was down 1.4% y/y.

EY ITEM Club Special Report on Consumer Spending
EY 15
But in a world where firms have less scope to expand by taking on more workers, an upside surprise on productivity growth could occur. This would be reinforced by increasing earnings growth, making it relatively less costly to engage in capital investment rather than taking on more workers. Meanwhile, jobs paying the NLW and NMW generally have a higher degree of so-called ‘routine task intensity’ and hence are more readily doable by machines.5 It follows that state policy on pay may support productivity growth, albeit at the risk of job losses (although the history of technological advances does not point to any permanent effect on the level of employment. Furthermore, there appears to be little evidence of job losses in this respect happening so far in the UK). And it is not just legal minimums on pay which could encourage efforts to raise productivity. Extra costs on employers from changes to pensions and apprenticeships policies may also have the same effect.
So there is increasing pressure for UK companies to get more out of their workers and we expect to ultimately see some improvement going forward — although productivity is unlikely to regain the levels seen before the 2008/9 downturn. Therefore, while our forecast is cautious, predicting productivity growth at 0.3% in 2019 picking up to 0.9% in 2020 and 1.1% in 2021, there is scope for an upside surprise.
Prospects for non-labour income look mixed at best
The majority of income for most households comes from wages, salaries or self-employment income. However, in aggregate and after taxes, almost half of household income comes from other sources, such as government benefits, private pensions, and interest and dividend payments. Some non-labour income sources have limited bearing for consumer spending, e.g. some investors reinvest dividends automatically while variations in employers’ pension contributions (which are included in the official measure of household income) are unlikely to affect spending, at least in the short term.
But other non-labour sources are important. The Office for Budget Responsibility estimates government welfare spending amounted to £223.0 billion in 2018/19, the equivalent of a quarter of household income from wages and salaries. Around 11.5 million UK households are continuing to be affected by the cash freeze on many working-age benefits which began in April 2016 and is not due to end until the close of 2019–20.
The contribution of benefits and transfers to annual growth in real household post-tax income growth amounted to 0.5 percentage points in 2018. This was actually the highest contribution since 2012 and up from 0.2 percentage points in 2017. Benefits and transfers delivered an annual average boost of 0.5 percentage points to real income growth during 2010–18.
On a positive note, lower inflation over 2019 as a whole (and an expected broadly similar rate in 2020) will ease the real-term cut to benefits received and reduce the drag on income growth from this source.
5 Institute for Fiscal Studies. Will the rising minimum wage lead to more low-paid jobs being automated? 4 January 2018. See ifs.org.uk/publications/10287
EY ITEM Club Special Report on Consumer Spending
EY 16
The effect on consumer spending will be magnified by lower-income, benefit-receiving households tending to consume a higher share of incomes than their better-off peers.
Dividend income likely to slow from 2018’s strong performance while PPI payments will end in August
2019 will probably deliver a less buoyant year for household income from dividends, although this is in part a reflection of strength in 2018. ONS data show that the distributed income of UK companies reached a record high of £122.8 billion in 2018, which was up 11.6% from £110.0 billion in 2017. Banking and mining companies accounted for the largest share of the dividend growth in 2018.
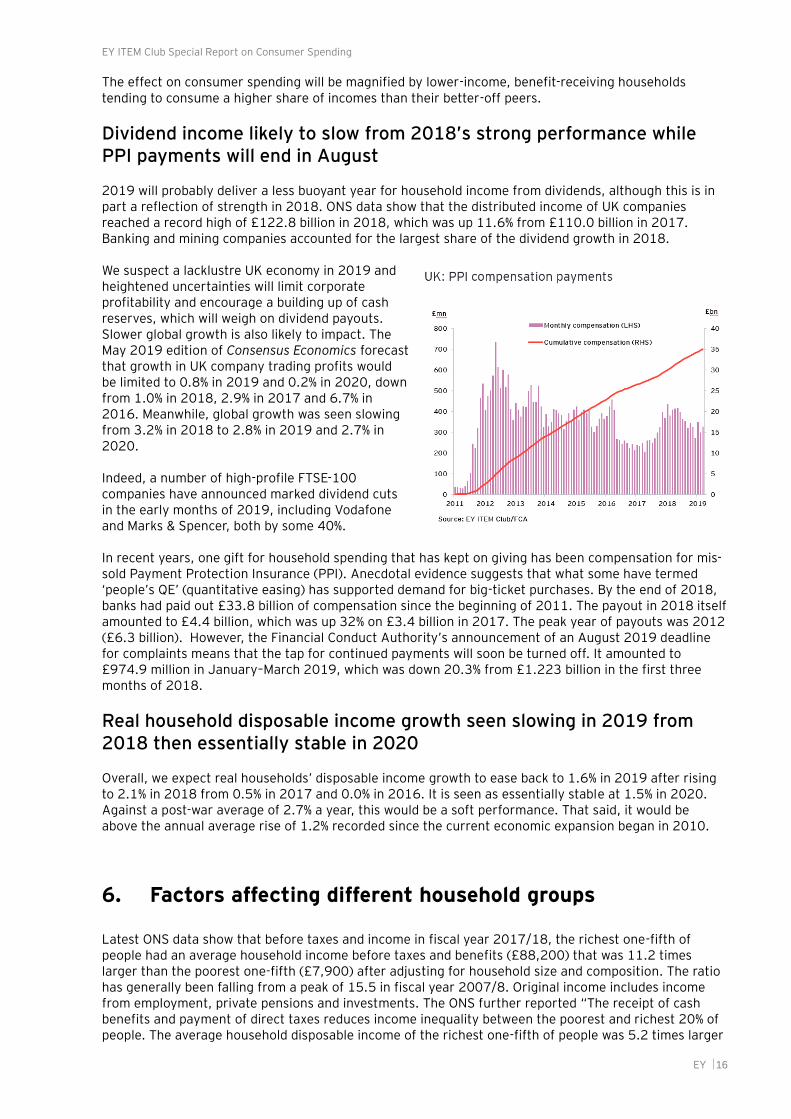
We suspect a lacklustre UK economy in 2019 and heightened uncertainties will limit corporate profitability and encourage a building up of cash reserves, which will weigh on dividend payouts. Slower global growth is also likely to impact. The May 2019 edition of Consensus Economics forecast that growth in UK company trading profits would be limited to 0.8% in 2019 and 0.2% in 2020, down from 1.0% in 2018, 2.9% in 2017 and 6.7% in 2016. Meanwhile, global growth was seen slowing from 3.2% in 2018 to 2.8% in 2019 and 2.7% in 2020.
Indeed, a number of high-profile FTSE-100 companies have announced marked dividend cuts in the early months of 2019, including Vodafone and Marks & Spencer, both by some 40%.
In recent years, one gift for household spending that has kept on giving has been compensation for mis-sold Payment Protection Insurance (PPI). Anecdotal evidence suggests that what some have termed ‘people’s QE’ (quantitative easing) has supported demand for big-ticket purchases. By the end of 2018, banks had paid out £33.8 billion of compensation since the beginning of 2011. The payout in 2018 itself amounted to £4.4 billion, which was up 32% on £3.4 billion in 2017. The peak year of payouts was 2012 (£6.3 billion). However, the Financial Conduct Authority’s announcement of an August 2019 deadline for complaints means that the tap for continued payments will soon be turned off. It amounted to £974.9 million in January–March 2019, which was down 20.3% from £1.223 billion in the first three months of 2018.
Real household disposable income growth seen slowing in 2019 from 2018 then essentially stable in 2020
Overall, we expect real households’ disposable income growth to ease back to 1.6% in 2019 after rising to 2.1% in 2018 from 0.5% in 2017 and 0.0% in 2016. It is seen as essentially stable at 1.5% in 2020. Against a post-war average of 2.7% a year, this would be a soft performance. That said, it would be above the annual average rise of 1.2% recorded since the current economic expansion began in 2010.
6. Factors affecting different household groups
Latest ONS data show that before taxes and income in fiscal year 2017/18, the richest one-fifth of people had an average household income before taxes and benefits (£88,200) that was 11.2 times larger than the poorest one-fifth (£7,900) after adjusting for household size and composition. The ratio has generally been falling from a peak of 15.5 in fiscal year 2007/8. Original income includes income from employment, private pensions and investments. The ONS further reported “The receipt of cash benefits and payment of direct taxes reduces income inequality between the poorest and richest 20% of people. The average household disposable income of the richest one-fifth of people was 5.2 times larger
EY ITEM Club Special Report on Consumer Spending
EY 17
than the income of the poorest one-fifth — £69,400 compared with £13,300. After indirect taxes (for example, Value Added Tax (VAT), alcohol duties and so on) and benefits-in-kind (for example, state education, National Health Service) are taken into account, the ratio further reduces to 3.5.”6
While we expect overall real household disposable income to rise by 1.6% in 2019 and 1.5% in 2020, there are specific factors that could lead to significant differences across income groups.
At the lower end of the income distribution group, the Low Pay Commission has sketched out a profile for the National Living Wage (NLW) which would see the minimum pay bar achieve the Government’s stated objective of reaching 60% of the median wage by 2020.7 The NLW rose from £7.50 to £7.83 an hour in April 2018 (up 4.4%) and it increased by a further 4.9% to £8.21 in April 2019.
Meanwhile the National Minimum Wage (NMW) which applies to those aged under 25, rose by 3.6%–4.3% in April 2019, depending on the age of the employee; this followed increases of 3.7%–5.4% in April 2018. Additionally, the minimum wage for apprentices increased by 5.4% from £3.70 to £3.90 per hour. This followed a rise of 5.7% (from £3.50 to £3.70) in April 2018. The Government claims “This will benefit around 2.4 million workers and is a £690 annual pay rise for a full-time worker”.8
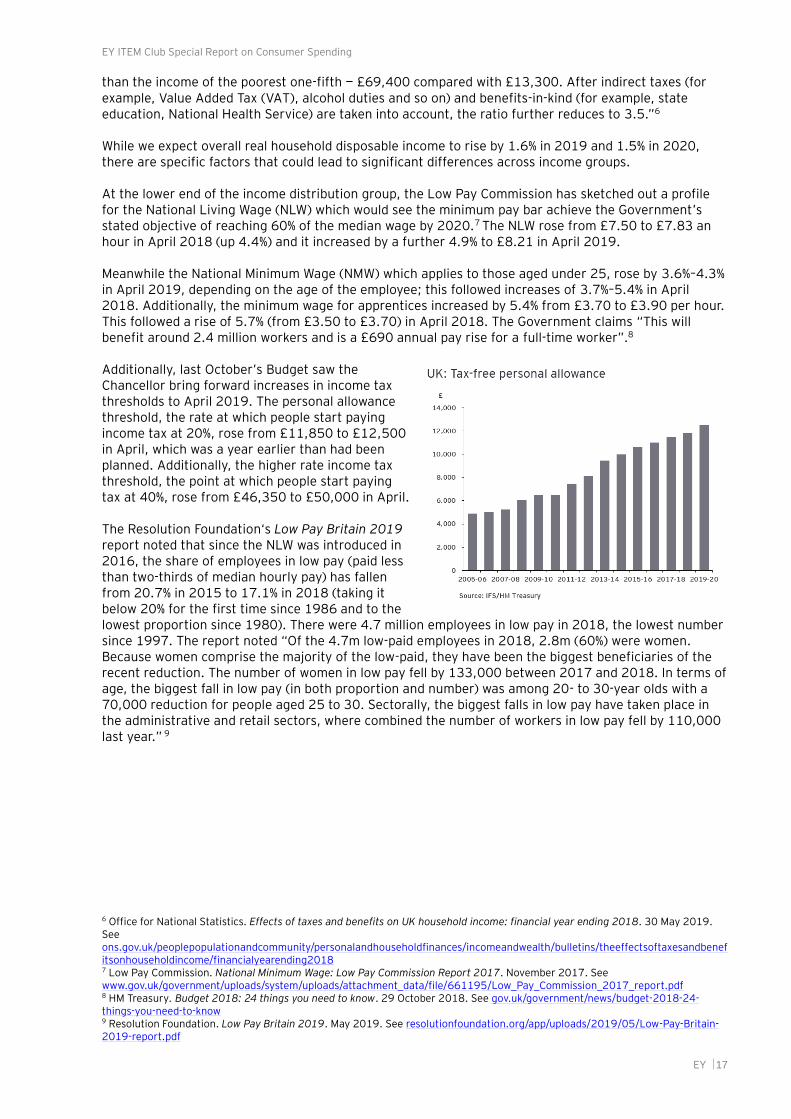
Additionally, last October’s Budget saw the Chancellor bring forward increases in income tax thresholds to April 2019. The personal allowance threshold, the rate at which people start paying income tax at 20%, rose from £11,850 to £12,500 in April, which was a year earlier than had been planned. Additionally, the higher rate income tax threshold, the point at which people start paying tax at 40%, rose from £46,350 to £50,000 in April.
The Resolution Foundation‘s Low Pay Britain 2019 report noted that since the NLW was introduced in 2016, the share of employees in low pay (paid less than two-thirds of median hourly pay) has fallen from 20.7% in 2015 to 17.1% in 2018 (taking it below 20% for the first time since 1986 and to the lowest proportion since 1980). There were 4.7 million employees in low pay in 2018, the lowest number since 1997. The report noted “Of the 4.7m low-paid employees in 2018, 2.8m (60%) were women. Because women comprise the majority of the low-paid, they have been the biggest beneficiaries of the recent reduction. The number of women in low pay fell by 133,000 between 2017 and 2018. In terms of age, the biggest fall in low pay (in both proportion and number) was among 20- to 30-year olds with a 70,000 reduction for people aged 25 to 30. Sectorally, the biggest falls in low pay have taken place in the administrative and retail sectors, where combined the number of workers in low pay fell by 110,000 last year.” 9
6 Office for National Statistics. Effects of taxes and benefits on UK household income: financial year ending 2018. 30 May 2019. See ons.gov.uk/peoplepopulationandcommunity/personalandhouseholdfinances/incomeandwealth/bulletins/theeffectsoftaxesandbenefitsonhouseholdincome/financialyearending2018 7 Low Pay Commission. National Minimum Wage: Low Pay Commission Report 2017. November 2017. See www.gov.uk/government/uploads/system/uploads/attachment_data/file/661195/Low_Pay_Commission_2017_report.pdf 8 HM Treasury. Budget 2018: 24 things you need to know. 29 October 2018. See gov.uk/government/news/budget-2018-24-things-you-need-to-know 9 Resolution Foundation. Low Pay Britain 2019. May 2019. See resolutionfoundation.org/app/uploads/2019/05/Low-Pay-Britain-2019-report.pdf

EY ITEM Club Special Report on Consumer Spending
EY 18
The scheduled end of the working-age benefits freeze after four years in April 2020 will be a positive development for low-income households — although it is not clear what exactly will happen then.
It is also worth noting that lower overall inflation in 2019 and 2020 compared to 2018 and 2017 should most help those at the lower end of the pay scale. This is because they tend to spend a greater proportion of their incomes on food, housing and petrol (44% of total spending in 2016–17), all of which saw sharp, sterling-related price rises in 2017. Conversely, those in the top decile of the pay scale spend a smaller proportion of their incomes on these goods and services (33% of total spending in 2016–17).
Meanwhile, it seems likely that workers at the upper end of the income distribution are most likely to benefit from the tight labour market. With skills shortages being reported in several sectors, those towards the top of the income distribution should benefit as employers pay more in an attempt to attract labour and retain existing workers.
The group expected to endure the weakest improvements in spending power is the so-called ‘squeezed middle’. These workers earn too much to gain from the NLW and no longer have the support from over-indexation of tax thresholds to boost their take-home pay. And their mid-range skill levels leave them vulnerable to polarisation in the labour market, as routine white-collar and skilled manufacturing jobs fall prey to growing automation.
Another factor that will have some impact on households’ spending power is pensions auto-enrolment. Auto-enrolment rates for employees rose from 1% to 3% in April 2018 and then to 5% in April 2019. Admittedly, this will only affect a minority of those in work — currently just over 10 million people are covered by auto-enrolment, against 32.7 million people in employment. But those in low-paid occupations have been disproportionately captured by the policy and for those people concerned, rising contribution rates will, all else being equal, result in a reduction in take-home pay. Analysis done for the BBC in February 2019 by Hargreaves Lansdown indicated the annual take-home pay of someone earning £15,000 will typically be £49 lower, if they pay contributions on their entire salary. Someone on £30,000 will take home £253 less.10
The forthcoming change of Conservative leader and Prime Minister could well have significant implications for tax policies and different household income groups.
7. Non-income drivers of consumer spending
Interest rates likely to rise only gradually
Following the Bank of England’s two 25 basis points interest rate hikes — in November 2017 (from 0.25% to 0.50%) and August 2018 (from 0.50% to 0.75%) — households are likely to face only small further rate increases over the rest of 2019 and 2020.
Despite decent growth of 0.5% q/q in Q1 2019 (albeit boosted by stockpiling), a tight labour market and recent higher earnings growth, the MPC currently clearly prefers to adopt a ‘wait and see’ approach on interest rates until the Brexit situation becomes clearer and it can see how the economy is reacting. The MPC believes that there is little immediate risk from adopting such a stance.
With Brexit uncertainty being prolonged by the delayed flexible UK departure date of 31 October and this being likely to hamper the economy, we believe the odds favour the Bank of England keeping interest rates at 0.75% through 2019. However, there is a possibility that if the UK economy proves
10 BBC. Pension contribution hike to hit pay packets. 17 February 2019. See bbc.co.uk/news/business-47269042
EY ITEM Club Special Report on Consumer Spending
EY 19
resilient over the coming months despite the extended Brexit uncertainties, the MPC could decide that an interest hike from 0.75% to 1.00% is warranted — especially if the labour market continues to tighten and earnings growth moves back up.
Assuming there is no interest rate hike in 2019, we see the Bank of England raising interest rates twice in 2020 (each time by 25 basis points) taking them up to 1.25% by the end of 2020 as it looks to gradually normalise monetary policy and as the economy is likely to be firmer if the UK has left the EU with a deal.
Obviously if interest rates do not rise in 2019, there will be no impact on households. And even if there is one hike, the impact will likely be minimal. Nevertheless, if there are two 25 basis point interest rate hikes by the end of 2020, it could have a limited impact on consumer spending. This impact would be magnified if households expected the tightening cycle to continue thereafter. Higher interest rates will raise income for net savers and interest payments by net borrowers. Given that borrowers’ spending tends to be more responsive to rate changes, one would expect dearer money to deliver a net drag on consumption. Moreover, the incentive to save rather than spend will also increase.
In several respects, households are in a good position to deal with more expensive debt
There are several reasons to think that the MPC’s past and likely future actions will have a modest effect on the outlook for consumer spending. For one, rates are — and even allowing for two 25 basis point hikes by the end of 2020 — will remain, very low by historical standards.
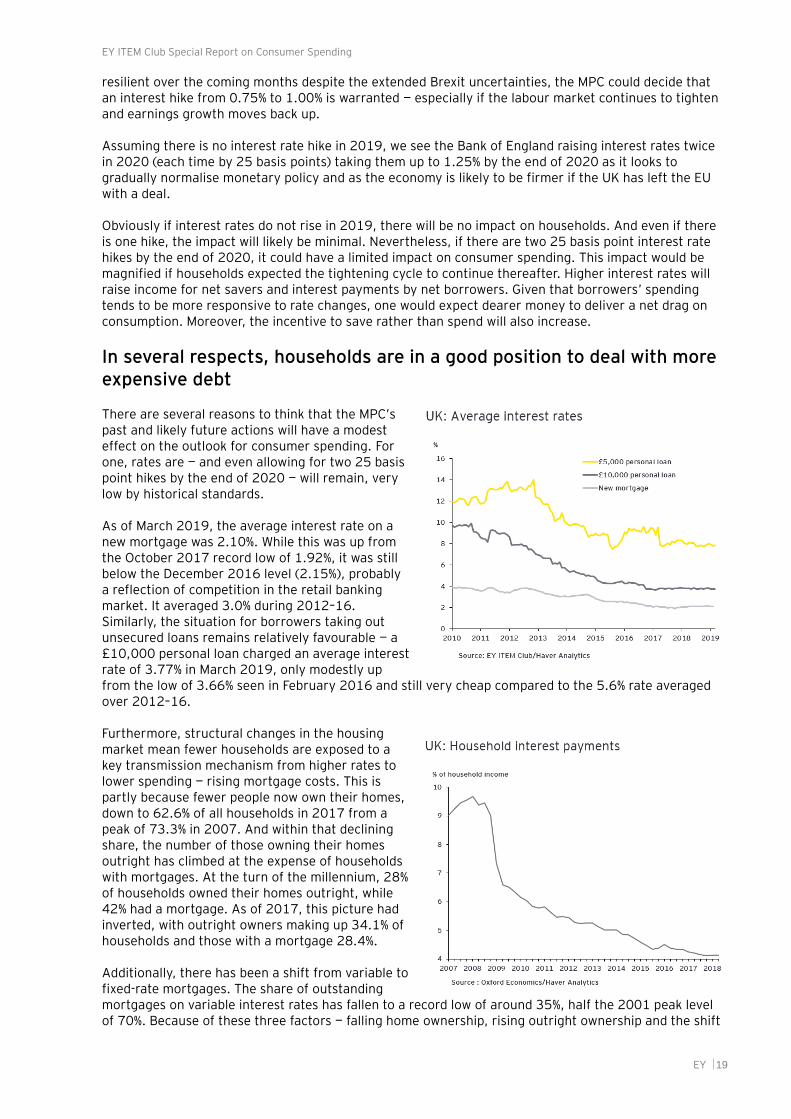
As of March 2019, the average interest rate on a new mortgage was 2.10%. While this was up from the October 2017 record low of 1.92%, it was still below the December 2016 level (2.15%), probably a reflection of competition in the retail banking market. It averaged 3.0% during 2012–16. Similarly, the situation for borrowers taking out unsecured loans remains relatively favourable — a £10,000 personal loan charged an average interest rate of 3.77% in March 2019, only modestly up from the low of 3.66% seen in February 2016 and still very cheap compared to the 5.6% rate averaged over 2012–16.
Furthermore, structural changes in the housing market mean fewer households are exposed to a key transmission mechanism from higher rates to lower spending — rising mortgage costs. This is partly because fewer people now own their homes, down to 62.6% of all households in 2017 from a peak of 73.3% in 2007. And within that declining share, the number of those owning their homes outright has climbed at the expense of households with mortgages. At the turn of the millennium, 28% of households owned their homes outright, while 42% had a mortgage. As of 2017, this picture had inverted, with outright owners making up 34.1% of households and those with a mortgage 28.4%.
Additionally, there has been a shift from variable to fixed-rate mortgages. The share of outstanding mortgages on variable interest rates has fallen to a record low of around 35%, half the 2001 peak level of 70%. Because of these three factors — falling home ownership, rising outright ownership and the shift
EY ITEM Club Special Report on Consumer Spending
EY 20
towards fixed-rate mortgages — little more than a tenth of UK households have variable rate mortgages at present. The impact of a 0.25 percentage points rise in interest rates for those households amounts to an increase in repayments of just £6.40 per month, or 1.3% of existing repayments, on an average mortgage of £70,000.11
There are other respects in which households are facing potential modest interest rate rises in a relatively good position. As of Q4 2018, interest payments absorbed 4.1% of the average household’s income. This was the equal lowest ratio since records began in 1987 (interest payments peaked at almost 13% of incomes in 1990 and have averaged 7.1% over the past 30 years).
Meanwhile, although it has come off the lows seen in Q4 2015, total household debt at 135.9% of income in Q4 2018 was 17.9 percentage points below the Q1 2008 peak of 153.8% of income.
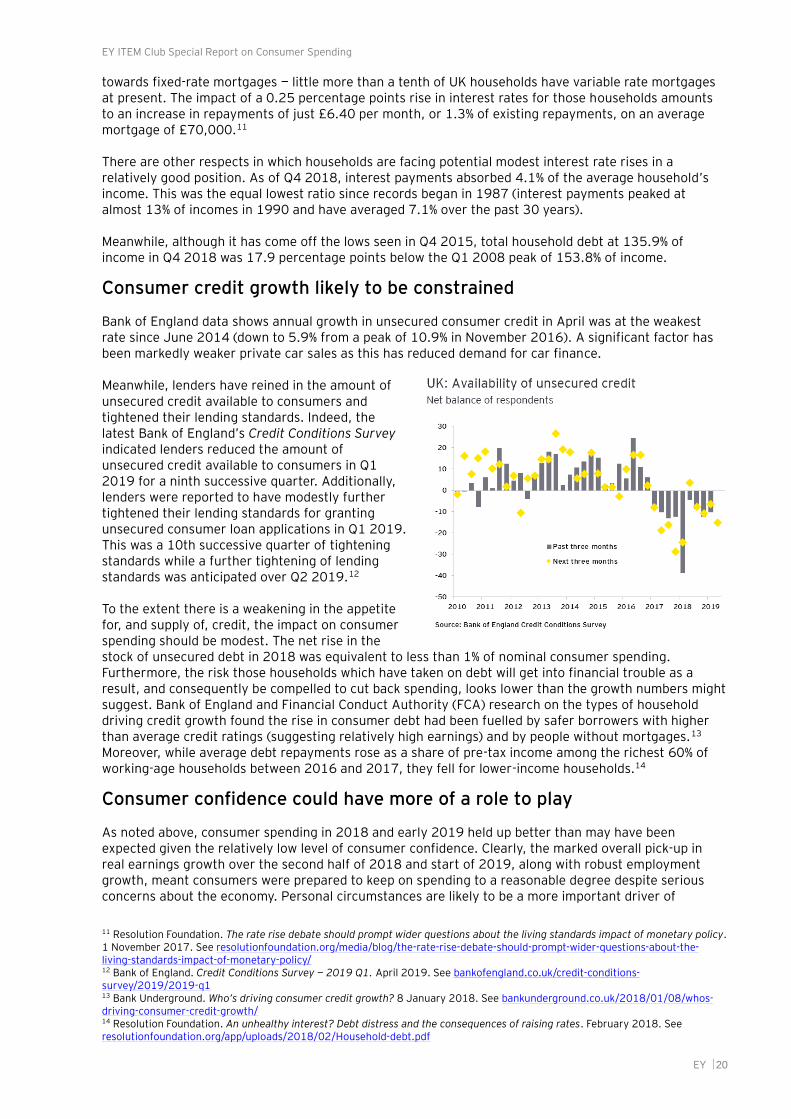
Consumer credit growth likely to be constrained
Bank of England data shows annual growth in unsecured consumer credit in April was at the weakest rate since June 2014 (down to 5.9% from a peak of 10.9% in November 2016). A significant factor has been markedly weaker private car sales as this has reduced demand for car finance.
Meanwhile, lenders have reined in the amount of unsecured credit available to consumers and tightened their lending standards. Indeed, the latest Bank of England’s Credit Conditions Survey indicated lenders reduced the amount of unsecured credit available to consumers in Q1 2019 for a ninth successive quarter. Additionally, lenders were reported to have modestly further tightened their lending standards for granting unsecured consumer loan applications in Q1 2019. This was a 10th successive quarter of tightening standards while a further tightening of lending standards was anticipated over Q2 2019.12
To the extent there is a weakening in the appetite for, and supply of, credit, the impact on consumer spending should be modest. The net rise in the stock of unsecured debt in 2018 was equivalent to less than 1% of nominal consumer spending. Furthermore, the risk those households which have taken on debt will get into financial trouble as a result, and consequently be compelled to cut back spending, looks lower than the growth numbers might suggest. Bank of England and Financial Conduct Authority (FCA) research on the types of household driving credit growth found the rise in consumer debt had been fuelled by safer borrowers with higher than average credit ratings (suggesting relatively high earnings) and by people without mortgages.13 Moreover, while average debt repayments rose as a share of pre-tax income among the richest 60% of working-age households between 2016 and 2017, they fell for lower-income households.14
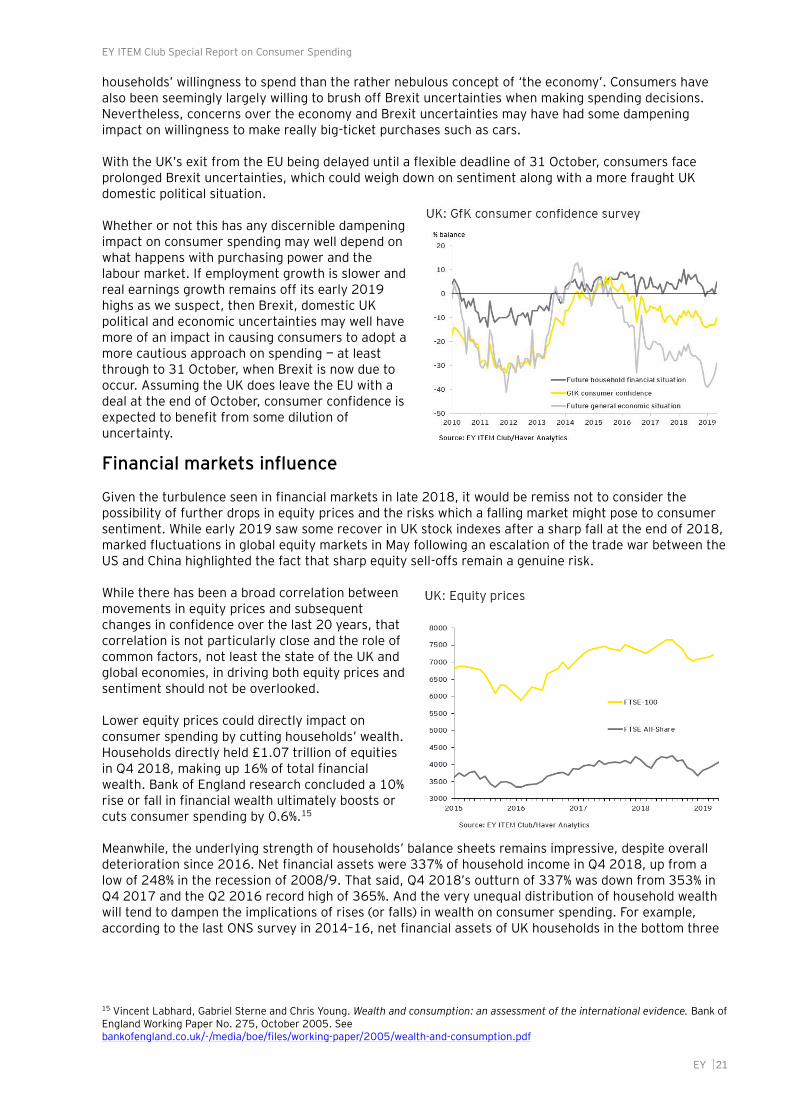
Consumer confidence could have more of a role to play
As noted above, consumer spending in 2018 and early 2019 held up better than may have been expected given the relatively low level of consumer confidence. Clearly, the marked overall pick-up in real earnings growth over the second half of 2018 and start of 2019, along with robust employment growth, meant consumers were prepared to keep on spending to a reasonable degree despite serious concerns about the economy. Personal circumstances are likely to be a more important driver of
11 Resolution Foundation. The rate rise debate should prompt wider questions about the living standards impact of monetary policy. 1 November 2017. See resolutionfoundation.org/media/blog/the-rate-rise-debate-should-prompt-wider-questions-about-the-living-standards-impact-of-monetary-policy/ 12 Bank of England. Credit Conditions Survey — 2019 Q1. April 2019. See bankofengland.co.uk/credit-conditions-survey/2019/2019-q1 13 Bank Underground. Who’s driving consumer credit growth? 8 January 2018. See bankunderground.co.uk/2018/01/08/whos-driving-consumer-credit-growth/ 14 Resolution Foundation. An unhealthy interest? Debt distress and the consequences of raising rates. February 2018. See resolutionfoundation.org/app/uploads/2018/02/Household-debt.pdf
EY ITEM Club Special Report on Consumer Spending
EY 21
households’ willingness to spend than the rather nebulous concept of ‘the economy’. Consumers have also been seemingly largely willing to brush off Brexit uncertainties when making spending decisions. Nevertheless, concerns over the economy and Brexit uncertainties may have had some dampening impact on willingness to make really big-ticket purchases such as cars.
With the UK’s exit from the EU being delayed until a flexible deadline of 31 October, consumers face prolonged Brexit uncertainties, which could weigh down on sentiment along with a more fraught UK domestic political situation.
Whether or not this has any discernible dampening impact on consumer spending may well depend on what happens with purchasing power and the labour market. If employment growth is slower and real earnings growth remains off its early 2019 highs as we suspect, then Brexit, domestic UK political and economic uncertainties may well have more of an impact in causing consumers to adopt a more cautious approach on spending — at least through to 31 October, when Brexit is now due to occur. Assuming the UK does leave the EU with a deal at the end of October, consumer confidence is expected to benefit from some dilution of uncertainty.
Financial markets influence
Given the turbulence seen in financial markets in late 2018, it would be remiss not to consider the possibility of further drops in equity prices and the risks which a falling market might pose to consumer sentiment. While early 2019 saw some recover in UK stock indexes after a sharp fall at the end of 2018, marked fluctuations in global equity markets in May following an escalation of the trade war between the US and China highlighted the fact that sharp equity sell-offs remain a genuine risk.
While there has been a broad correlation between movements in equity prices and subsequent changes in confidence over the last 20 years, that correlation is not particularly close and the role of common factors, not least the state of the UK and global economies, in driving both equity prices and sentiment should not be overlooked.
Lower equity prices could directly impact on consumer spending by cutting households’ wealth. Households directly held £1.07 trillion of equities in Q4 2018, making up 16% of total financial wealth. Bank of England research concluded a 10% rise or fall in financial wealth ultimately boosts or cuts consumer spending by 0.6%.15
Meanwhile, the underlying strength of households’ balance sheets remains impressive, despite overall deterioration since 2016. Net financial assets were 337% of household income in Q4 2018, up from a low of 248% in the recession of 2008/9. That said, Q4 2018’s outturn of 337% was down from 353% in Q4 2017 and the Q2 2016 record high of 365%. And the very unequal distribution of household wealth will tend to dampen the implications of rises (or falls) in wealth on consumer spending. For example, according to the last ONS survey in 2014–16, net financial assets of UK households in the bottom three
15 Vincent Labhard, Gabriel Sterne and Chris Young. Wealth and consumption: an assessment of the international evidence. Bank of England Working Paper No. 275, October 2005. See bankofengland.co.uk/-/media/boe/files/working-paper/2005/wealth-and-consumption.pdf

EY ITEM Club Special Report on Consumer Spending
EY 22
income deciles averaged £967; The corresponding figure for the top 30% of the income distribution was £37,867.16
Subdued housing market likely to be of little help to consumer spending
Our expectation of another subdued year for the housing market in 2019 followed by only limited improvement in 2020 — both in terms of house price inflation and housing transactions — is another route by which households’ assets could influence (in this case, dampen) consumer spending growth.
Two channels could potentially be at play here — first, the aforementioned wealth effect and, second, the tendency for home moves to be accompanied by purchases of white goods and other big-ticket items. (What was an additional and significant channel between housing and consumption before the financial crisis — housing equity withdrawal — has continued to remain deep in negative territory).
We forecast house price inflation (on the Land Registry/ONS measure) to slow to 1.4% this year from 3.3% in 2018, 4.5% in 2017 and 7.0% in 2016 before edging up to 2.0% in 2020. Indeed, latest data from the Land Registry/ONS shows the annual increase in house prices was just 1.4% in March having been as low as 1.0% in February (the weakest y/y rise since January 2013).
However, the consequences for consumer spending are not unambiguously negative. Lower house price inflation will boost the spending power of first-time buyers or those trading up to a dearer property.
Low savings rate could weigh down on consumer spending
Although the household saving ratio saw a modest rise in 2018 as real household disposable income growth outpaced consumer spending growth, it remained very low compared to long-term norms. Specifically, after declining from an average of 9.4% in 2015 to just 3.9% in 2017, the household saving ratio rose to 4.2% in 2018. It improved from 3.9% in Q1 2018 to 4.5% in Q4 2018.
A measure of the saving ratio which excludes some elements of non-labour income and so better captures saving out of available income, has not been so far out of line with the long-run norm. But at 2.3% in Q4 2018, it was still some distance below the long-run (1987–2018) average of 3.6%.
There is no mechanical reason why the saving ratio should revert to the historical average. But with the household saving ratio being very low, consumers may, at the very least, be keen to avoid further dissaving — especially given current major uncertainties and the likelihood that interest rates will rise to a limited extent through to the end of 2020.
16 Office for National Statistics. Financial wealth: wealth in Great Britain. February 2018. See ons.gov.uk/peoplepopulationandcommunity/personalandhouseholdfinances/incomeandwealth/datasets/financialwealthwealthingreatbritain
EY ITEM Club Special Report on Consumer Spending
EY 23
8. Changing nature of consumer spending
While not necessarily having any impact on aggregate consumer spending, it is notable there have been significant changes in recent years in the way consumers spend, particularly with respect to retail sales.
Online sales have taken an increasing share with the Office for National Statics revealing that in November 2018, and lifted by Black Friday transactions, online purchases exceeded 20% of total retail sales for the first time ever, getting as high as 21.5%. Latest data shows that online sales accounted for 18.7% of total retail sales in April, up from 17.7% a year earlier.
A survey by uSwitch released in January claimed that smartphones are overtaking shopping centres as the most popular way to shop. The survey reported that in 2019, shoppers are planning to spend £25 billion using their smartphones, which would be up £10 billion on 2018. More than 30 million people in UK (58% of the population) will use smart devices to shop in 2019, an increase of 12 million on 2018. This compares to 56% who are expected to visit shopping centres. The popularity of smartphone and tablet shopping is being lifted by convenience, created by payment facilities such as Apple Pay, which let shoppers spend money in a single click. Shoppers are also reportedly being tempted by links and adverts on social media platforms such as Facebook and Instagram. According to uSwitch, people like shopping on a smartphone because they can do so at any time, while easily comparing prices and seeing a superior level of choice. They also said they felt they could get the best value online. The survey found that clothes are the most popular product bought online (69%) followed by books (51%), groceries (47%) and theatre or cinema tickets (43%).17
This increasing competition from online sales has heaped pressure on the high street, where many shops are also hampered by high and rising costs. Indeed, 2018 was a torrid year for retailers with many well-known names either disappearing from the high street or significantly cutting back on their presence. This continued in the early months of 2019. Retailers disappearing included Toys R Us, Maplin, House of Fraser (some stores were saved after Mike Ashley takeover) and Poundworld. Retailers cutting back on branches included New Look, Marks & Spencer, Debenhams, Mothercare, Carpetright, Homebase, Patisserie Valerie and Prezzo.
Highlighting the challenging environment for retailers, it was reported that investment in UK shopping centres weakened to a 16-year low in Q1 2019. Specifically, the Financial Times reported that “just £20 million of shopping centres changed hands in the first quarter of this year, according to data from CoStar, against a 10-year quarterly average of £783 million. This was the weakest quarter since at least 2003 and ‘probably this century’, said Mark Stansfield, head of UK analytics at CoStar.”18
Another development in consumer spending was debit card payments overtaking cash use for the first time in 2017 and then extending their lead in 2018, according to UK Finance. Total debit card payments rose 14% to 13.2 billion in 2017 and then climbed another 14% to 15.1 million in 2018. Meanwhile, cash payments fell 15% in 2017 to 13.1 billion and then dropped a further 16% to 11.0 billion in 2018. It was reported over 5 million used cash no more than once a month in 2018, up from 3.4 million in 2017.19
9. ‘No-deal’ Brexit would hit consumption
Despite Brexit being delayed until 31 October and Parliament passing motions in March against a ‘no-deal’ Brexit, this remains a very real possibility. Indeed, the prospect of a ‘no-deal’ Brexit appears to have risen with Theresa May’s resignation as Prime Minister in late May and the Conservative Party’s performance in the European elections along with the strong showing by Nigel Farage’s Brexit Party.
Leaving the EU without a deal at the end of October — or any other time — and switching to World Trade Organization (WTO) trading rules would have major ramifications for the UK’s economic outlook.
17 Daily Telegraph. Smartphones overtake shopping centres as a popular way to shop. 17 January 2019. See telegraph.co.uk/news/2019/01/17/smartphones-overtake-shopping-centres-popular-way-shop/ 18 Financial Times. UK shopping centre investment hits 16-year low. 19 April 2019. See ft.com/content/bdd468a4-6835-11e9-9adc-98bf1d35a056 19 UK Finance. UK Payments Market Summary 2019. June 2019. See ukfinance.org.uk/sites/default/files/uploads/pdf/UK-Finance-UK-Payment-Markets-Report-2019-SUMMARY.pdf

EY ITEM Club Special Report on Consumer Spending
EY 24
However, in putting together any forecast for this eventuality, it must be borne in mind that economic projections made in the immediate aftermath of the June 2016 vote for the UK to leave the EU proved overwhelmingly pessimistic. In particular, consumers kept on spending post-referendum as it took time for sterling’s sharp drop following the vote for Brexit to feed through to lift inflation and squeeze purchasing power. Consumer confidence weakened sharply immediately following the June 2016 vote but then rebounded quickly as consumers’ circumstances were little changed in the immediate aftermath of the referendum vote. Meanwhile, nothing changed regarding trading conditions or supply chains.
The critical point this time around is that the circumstances facing the UK after it left the EU without a deal would immediately be different.
If a ‘no-deal’ Brexit occurs at the end of October, there will be an immediate change of trading circumstances and some developments will be harder to assess than others. In particular, there is no knowing just how much disruption will occur at ports and how badly supply chains will be affected. And if there are scenes of chaos, how much will this affect business and, also, consumer confidence and behaviour?
On the positive side, while the delaying of Brexit from 29 March to 31 October has extended the uncertainties facing the economy, it gives businesses and the Government more time to prepare for a ‘no-deal’ UK exit from the EU. Nevertheless, there is a limit to how much preparation can be done.
Sterling would likely fall markedly following a ‘no-deal’ Brexit — as it did after the referendum vote in June 2016 — with the weaker pound then feeding through to lift inflation and push up companies’ input costs. The Government has indicated that it would look to mitigate the likely impact on inflation by making overall reductions to import tariffs compared to the current situation, but the suspicion is that this will be insufficient to prevent inflation from rising materially.
Additionally, facing a more uncertain and weakened economic outlook, businesses would likely adopt a significantly more cautious stance on employment and look to limit their costs by limiting pay, with adverse repercussions for workers and, hence, the consumer.
The combination of a softer labour market and weaker purchasing power resulting from higher inflation and reduced earnings growth would likely weigh markedly on consumer spending — although there is the very real possibility that consumers would be less worried about the heightened uncertainties resulting from a ‘no-deal’ Brexit than businesses. However, the downward pressure on consumer spending would likely be limited by monetary and fiscal measures to help the economy.
We suspect policymakers would provide both fiscal and monetary policy support to the economy in the event of a ‘no-deal’ Brexit. The Bank of England has repeatedly stated interest rates could either go up or down should there be a ‘no-deal’ Brexit, depending on the balance of how the UK’s supply capacity and demand side of the economy are perceived to be affected. Exchange rate movements will also be a factor. We take the view that interest rates would be far more likely to be cut than increased if there is a ‘no-deal’ Brexit. With Bank Rate currently only at 0.75%, there is of course limited scope for taking interest rates lower, although the Bank of England could also reactivate quantitative easing.
Meanwhile, the Chancellor has indicated emergency fiscal measures could be introduced in the event of a ‘no-deal’ Brexit and we suspect that there would be some loosening of fiscal policy. However, how much fiscal stimulus the Chancellor would be able to provide would likely be limited by the fact that the public finances are still far from healthy despite the recent marked improvement.
On balance, if the UK leaves the EU without a deal on 31 October, we suspect that GDP growth would slow to a minimal 0.3% in 2020 — with the economy likely to suffer mild recession over the first half of the year — from a likely outturn of 1.3% in 2019. Within this, consumer spending growth is seen slowing to just 0.6% in 2020 from 1.6% in 2019.
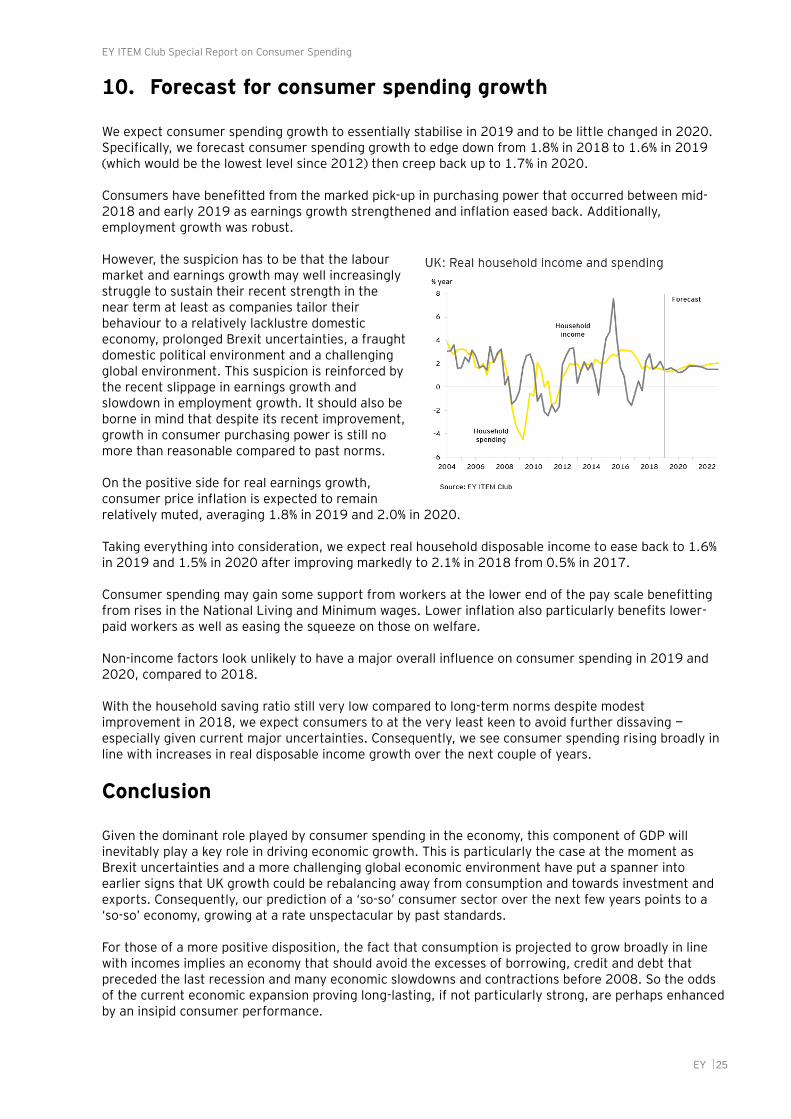
EY ITEM Club Special Report on Consumer Spending
EY 25
10. Forecast for consumer spending growth
We expect consumer spending growth to essentially stabilise in 2019 and to be little changed in 2020. Specifically, we forecast consumer spending growth to edge down from 1.8% in 2018 to 1.6% in 2019 (which would be the lowest level since 2012) then creep back up to 1.7% in 2020.
Consumers have benefitted from the marked pick-up in purchasing power that occurred between mid-2018 and early 2019 as earnings growth strengthened and inflation eased back. Additionally, employment growth was robust.
However, the suspicion has to be that the labour market and earnings growth may well increasingly struggle to sustain their recent strength in the near term at least as companies tailor their behaviour to a relatively lacklustre domestic economy, prolonged Brexit uncertainties, a fraught domestic political environment and a challenging global environment. This suspicion is reinforced by the recent slippage in earnings growth and slowdown in employment growth. It should also be borne in mind that despite its recent improvement, growth in consumer purchasing power is still no more than reasonable compared to past norms.
On the positive side for real earnings growth, consumer price inflation is expected to remain relatively muted, averaging 1.8% in 2019 and 2.0% in 2020.
Taking everything into consideration, we expect real household disposable income to ease back to 1.6% in 2019 and 1.5% in 2020 after improving markedly to 2.1% in 2018 from 0.5% in 2017.
Consumer spending may gain some support from workers at the lower end of the pay scale benefitting from rises in the National Living and Minimum wages. Lower inflation also particularly benefits lower-paid workers as well as easing the squeeze on those on welfare.
Non-income factors look unlikely to have a major overall influence on consumer spending in 2019 and 2020, compared to 2018.
With the household saving ratio still very low compared to long-term norms despite modest improvement in 2018, we expect consumers to at the very least keen to avoid further dissaving — especially given current major uncertainties. Consequently, we see consumer spending rising broadly in line with increases in real disposable income growth over the next couple of years.
Conclusion
Given the dominant role played by consumer spending in the economy, this component of GDP will inevitably play a key role in driving economic growth. This is particularly the case at the moment as Brexit uncertainties and a more challenging global economic environment have put a spanner into earlier signs that UK growth could be rebalancing away from consumption and towards investment and exports. Consequently, our prediction of a ‘so-so’ consumer sector over the next few years points to a ‘so-so’ economy, growing at a rate unspectacular by past standards.
For those of a more positive disposition, the fact that consumption is projected to grow broadly in line with incomes implies an economy that should avoid the excesses of borrowing, credit and debt that preceded the last recession and many economic slowdowns and contractions before 2008. So the odds of the current economic expansion proving long-lasting, if not particularly strong, are perhaps enhanced by an insipid consumer performance.
EY 26
EY | Assurance | Tax | Transactions | Advisory
Ernst & Young LLP
About EY
EY is a global leader in assurance, tax, transaction and advisory services. The insights and quality services we deliver help build trust and confidence in the capital markets and in economies the world over. We develop outstanding leaders who team to deliver on our promises to all of our stakeholders. In so doing, we play a critical role in building a better working world for our people, for our clients and for our communities. EY refers to the global organization and may refer to one or more of the member firms of Ernst & Young Global Limited, each of which is a separate legal entity. Ernst & Young Global Limited, a UK company limited by guarantee, does not provide services to clients. Information about how EY collects and uses personal data and a description of the rights individuals have under data protection legislation are available via ey.com/privacy. For more information about our organization, please visit ey.com.
About EY ITEM Club
EY ITEM Club is the only non-governmental economic forecasting group to use the HM Treasury’s model of the UK economy. ITEM stands for Independent Treasury Economic Model. HM Treasury uses the UK Treasury model for its UK policy analysis and Industry Act forecasts for the Budget. EY ITEM Club’s use of the model enables it to explore the implications and unpublished assumptions behind Government forecasts and policy measures. Uniquely, EY ITEM Club can test whether Government claims are consistent and can assess which forecasts are credible and which are not. Its forecasts are independent of any political, economic or business bias.
Ernst & Young LLP The UK firm Ernst & Young is a limited liability partnership registered in England and Wales with Registered number OC300001 and is a member firm of Ernst & Young Global Limited Ernst & Young LLP, 1 More London Place, London, SE1 2AF. © 2019 Ernst & Young LLP. Published in the UK. All Rights Reserved. ED None All views expressed in the EY ITEM Club Special Report on Consumer Spending 2019 are those of ITEM Club Limited and may or may not be those of Ernst & Young LLP. Information in this publication is intended to provide only a general outline of the subjects covered. It should neither be regarded as comprehensive or sufficient for making decisions, nor should it be used in place of professional advice. Neither the ITEM Club Limited, Ernst & Young LLP nor the EY ITEM Club accepts any responsibility for any loss arising from any action taken or not taken by anyone using this material. If you wish to discuss any aspect of the content of this newsletter, please talk to your usual EY contact. This document may not be disclosed to any third party without Ernst & Young LLP’s prior written consent. Reproduced with permission from ITEM Club Limited.
ey.com/item/consumer

![[Research];[Vietnam consumer confidence & spending]](https://static.fdocuments.net/doc/165x107/547c1d1cb4795998508b45cc/researchvietnam-consumer-confidence-spending.jpg)