THE STATUTE OF FRAUDS IN OIL AND GAS TRANSACTIONS: WHAT DOES IT
Global oil and gas transactions review 2016
Contents
Note: This report presents EY’s analysis of transaction data largely compiled by Derrick Petroleum Services. Throughout this report, disclosed or reported transaction values are expressed in US dollars.
1. Introduction 3
2. Key drivers in 2017 4
Credit and the cost of capital 5Where to next for the majors? 6
8
11
14
16
Introduction
In retrospect, 2016 is likely to have seen the low point of the recent oil price downturn. However, the severity of that downturn, with crude hitting US$30 a barrel was a major shock to the system for the oil and gas sector. The low point achieved and the slow climb out of the trough up to the end of the third quarter acted as a major depressant to deal volumes particularly for the upstream
move of prices above US$50 a barrel and established a greater consensus around a medium-term pricing outlook, which released pent-up demand and drove a surge in M&A activity which has carried through into 2017.
to enable it to sustain and grow in a lower oil price environment. In conjunction with standardization and cost cutting, they are increasingly adopting digitalization to redesign and simplify their businesses and improve performance. In the context of heavily squeezed balance sheets, upstream capex dropped 40% in 2016
so far suffered most from the downturn.
In conjunction with the drop in capex funding, the sector also
Public debt was more resilient and public equity was surprisingly
continues to remain strong: while a few energy funds have closed, the capital raised is likely to match levels from the previous year. Private equity was highly represented in the upstream deal volume upturn at the end of 2016.
As noted above, in the initial quarters of 2016, the overall M&A deal volumes were depressed. However, deal values for the sector were supported by the announcement of large megadeals in midstream
The extent of the upturn in deal volumes in the fourth quarter was notable; volumes nearly doubled in value over the third quarter. Upstream deal value during December was the highest of the year at US$28.3 billion, which was higher than the deal value of the entire third quarter. The positive trend in upstream has continued unabated, with several large deals announced in January 2017,
activity in 2017.
Midstream received a major boost from two megadeals valued in aggregate of more than US$97 billion. The key deal trends in midstream, particularly that of companies looking for capital synergy and divestment by E&P companies, are also likely to continue in 2017. The value of deals in downstream remained strong as the perceived value from integration resurfaced with selected upstream players’ continued efforts to increase footprint
ongoing merger of GE’s oil services business with Baker Hughes to
markedly as the transformation of the sector started in 2016
In all, these trends portend a positive outlook for M&A in 2017.
3Global oil and gas transactions review 2016 |
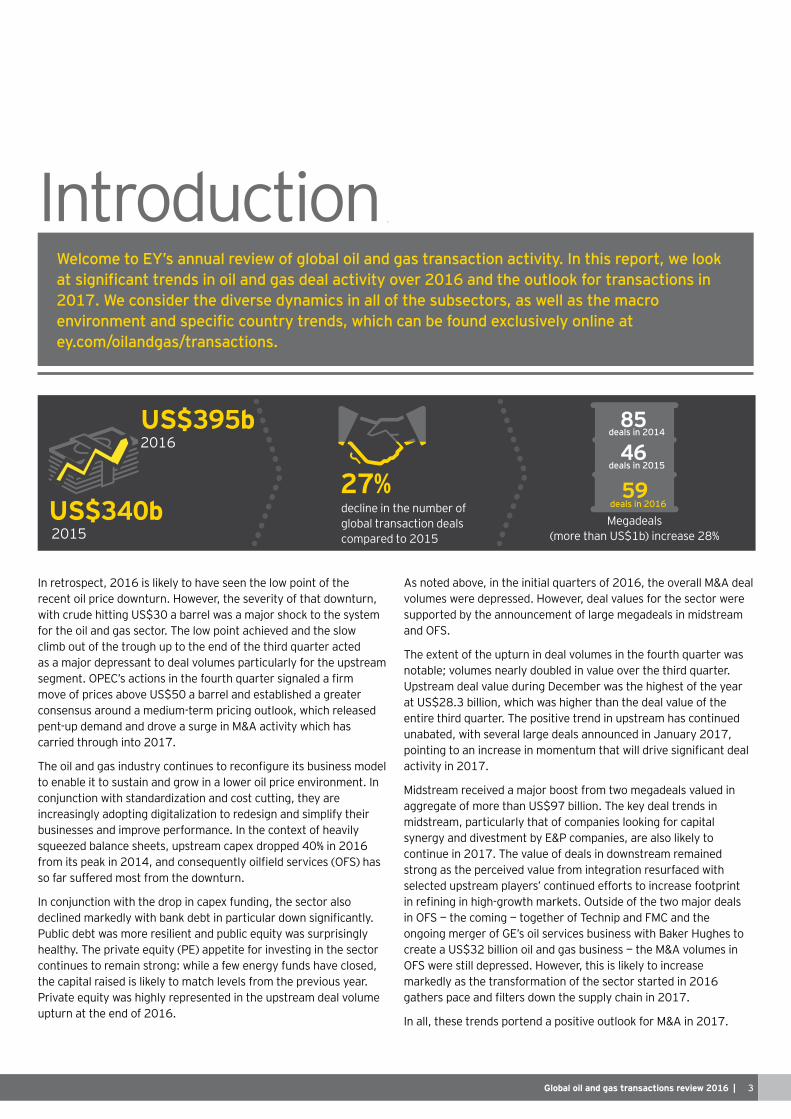
US$395b2016
US$340b2015
27%decline in the number of global transaction deals compared to 2015
59 deals in 2016
46deals in 2015
85deals in 2014
Megadeals(more than US$1b) increase 28%
| Global oil and gas transactions review 20164
Divest to invest (or distribute)The majors have been engaged in portfolio rationalization for the past decade. The stress placed on their balance sheets by the price downturn and the implicit obligations to maintain dividend distributions have, if anything, accelerated the focus they place on this activity. Active portfolio management has become a core skill for an oil major and will be for the foreseeable future. In terms of the divestment targets, mature upstream and lower-risk/return downstream assets and businesses top the list.
Growth themesDespite the balance sheet pressure they have faced, the majors have continued to use M&A to drive growth in their business. While each company has a different portfolio and strategy, some common areas of focus have emerged.
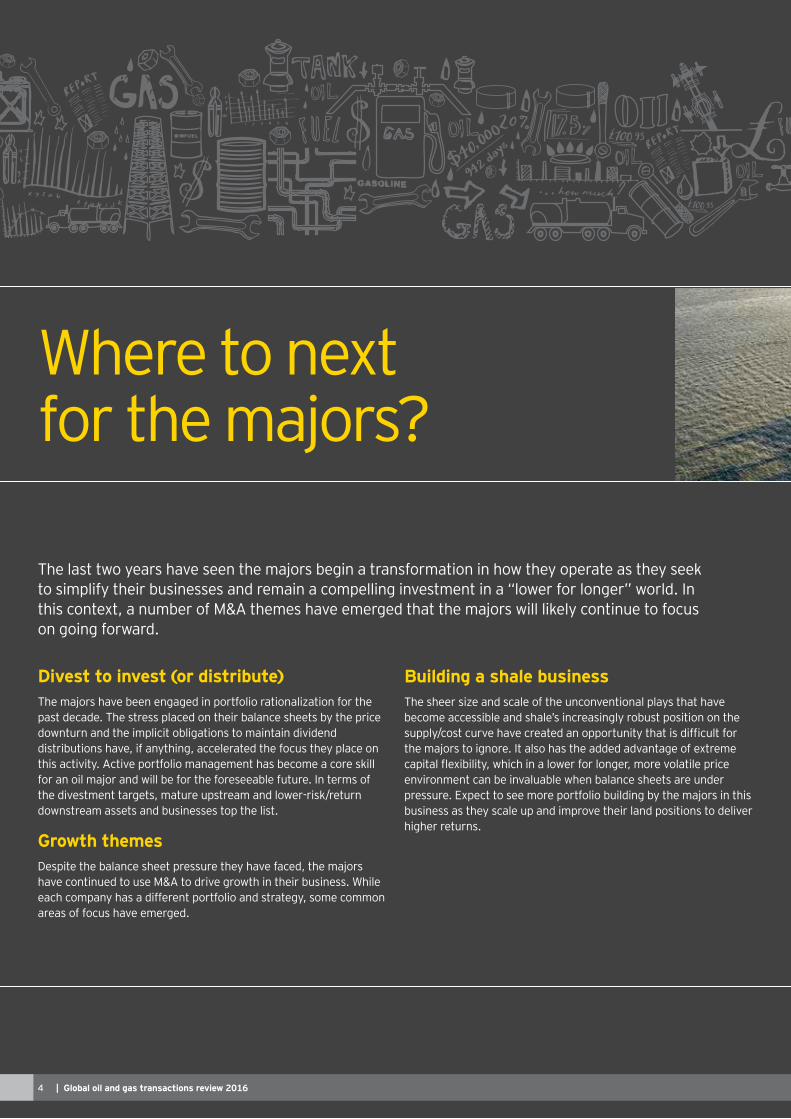
Where to next for the majors?
The last two years have seen the majors begin a transformation in how they operate as they seek to simplify their businesses and remain a compelling investment in a “lower for longer” world. In this context, a number of M&A themes have emerged that the majors will likely continue to focus on going forward.
Building a shale businessThe sheer size and scale of the unconventional plays that have become accessible and shale’s increasingly robust position on the
the majors to ignore. It also has the added advantage of extreme
environment can be invaluable when balance sheets are under pressure. Expect to see more portfolio building by the majors in this business as they scale up and improve their land positions to deliver higher returns.
| Global oil and gas transactions review 20164
Global oil and gas transactions review 2016 | 5
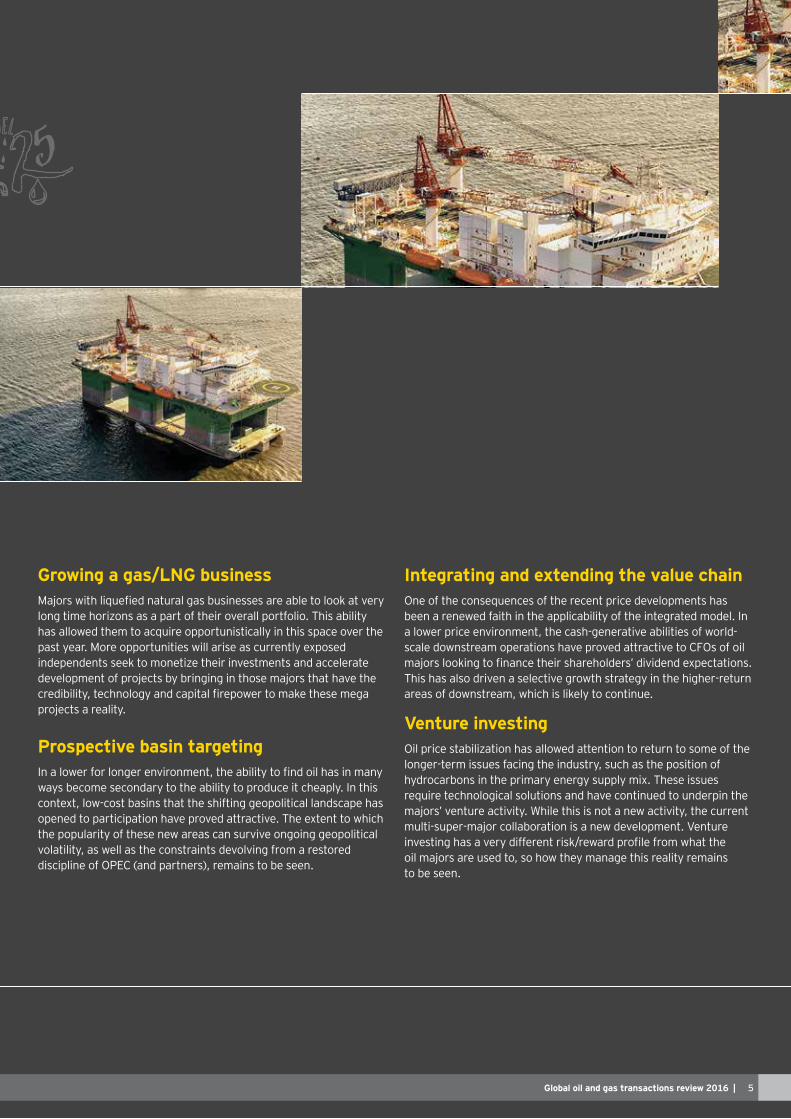
Growing a gas/LNG business
long time horizons as a part of their overall portfolio. This ability has allowed them to acquire opportunistically in this space over the past year. More opportunities will arise as currently exposed independents seek to monetize their investments and accelerate development of projects by bringing in those majors that have the
projects a reality.
Prospective basin targeting
ways become secondary to the ability to produce it cheaply. In this context, low-cost basins that the shifting geopolitical landscape has opened to participation have proved attractive. The extent to which the popularity of these new areas can survive ongoing geopolitical volatility, as well as the constraints devolving from a restored
Integrating and extending the value chainOne of the consequences of the recent price developments has been a renewed faith in the applicability of the integrated model. In a lower price environment, the cash-generative abilities of world-
This has also driven a selective growth strategy in the higher-return areas of downstream, which is likely to continue.
Venture investingOil price stabilization has allowed attention to return to some of the longer-term issues facing the industry, such as the position of hydrocarbons in the primary energy supply mix. These issues require technological solutions and have continued to underpin the majors’ venture activity. While this is not a new activity, the current multi-super-major collaboration is a new development. Venture
oil majors are used to, so how they manage this reality remains to be seen.
Global oil and gas transactions review 2016 | 5
| Global oil and gas transactions review 20166
Key drivers in 2017
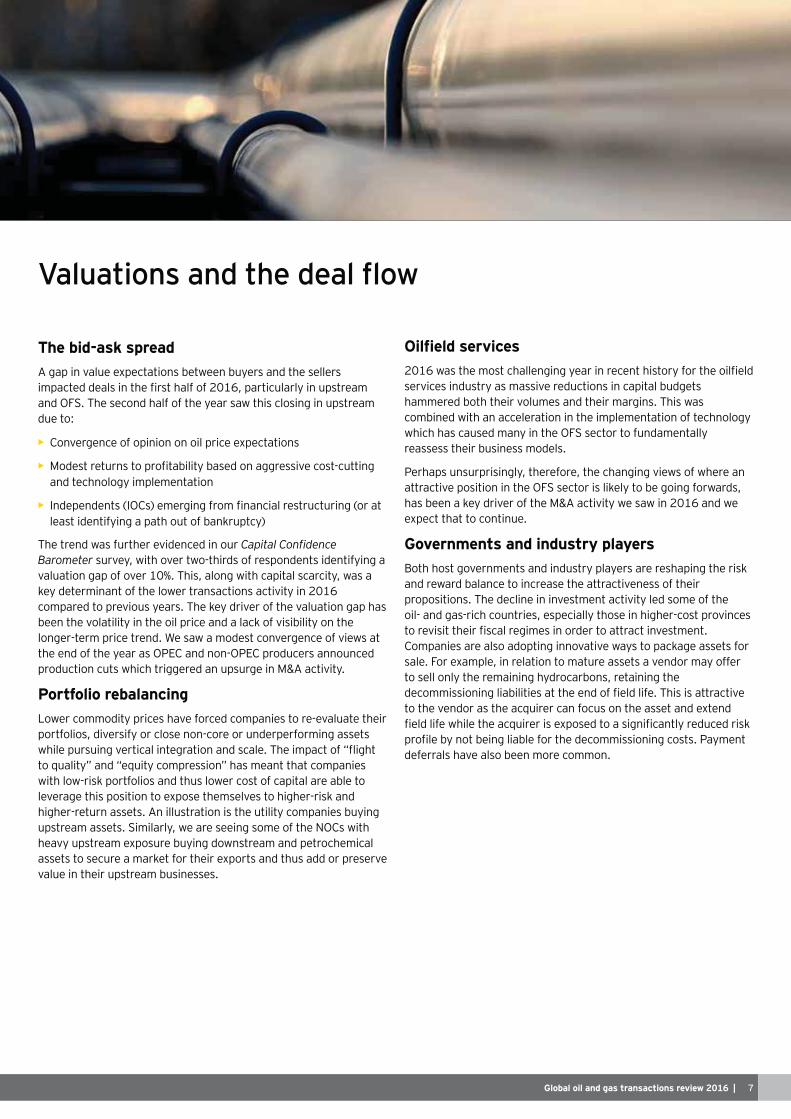
Average Debt spread (bps)
Source: EY analysis of data from S & P Capital IQ
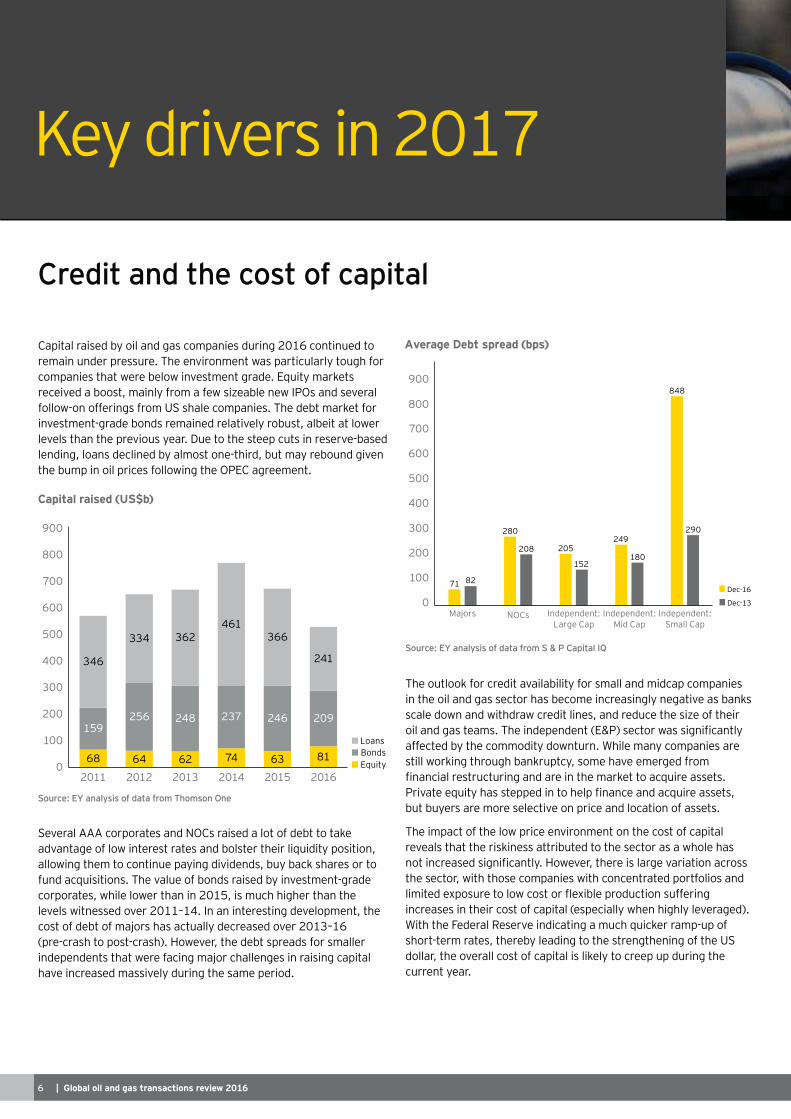
Capital raised by oil and gas companies during 2016 continued to remain under pressure. The environment was particularly tough for companies that were below investment grade. Equity markets received a boost, mainly from a few sizeable new IPOs and several follow-on offerings from US shale companies. The debt market for investment-grade bonds remained relatively robust, albeit at lower levels than the previous year. Due to the steep cuts in reserve-based lending, loans declined by almost one-third, but may rebound given the bump in oil prices following the OPEC agreement.
Capital raised (US$b)
Source: EY analysis of data from Thomson One
EquityBondsLoans
68 64 62 74 63 81
159256 248 237 246 209
346
334 362461
366
241
0
100
200
300
400
500
600
700
800
900
2011 2012 2013 2014 2015 2016
Several AAA corporates and NOCs raised a lot of debt to take advantage of low interest rates and bolster their liquidity position, allowing them to continue paying dividends, buy back shares or to fund acquisitions. The value of bonds raised by investment-grade corporates, while lower than in 2015, is much higher than the levels witnessed over 2011–14. In an interesting development, the cost of debt of majors has actually decreased over 2013–16
independents that were facing major challenges in raising capital have increased massively during the same period.
The outlook for credit availability for small and midcap companies in the oil and gas sector has become increasingly negative as banks scale down and withdraw credit lines, and reduce the size of their
affected by the commodity downturn. While many companies are still working through bankruptcy, some have emerged from
but buyers are more selective on price and location of assets.
The impact of the low price environment on the cost of capital reveals that the riskiness attributed to the sector as a whole has
the sector, with those companies with concentrated portfolios and
short-term rates, thereby leading to the strengthening of the US dollar, the overall cost of capital is likely to creep up during the current year.
900
800
700
600
500
400
300
200
100
0Majors NOCs Independent:
Large CapIndependent:
Mid CapIndependent:
Small Cap
Dec-16
Dec-13
71
280
208 205249
180
848
290
152
82
Credit and the cost of capital
Global oil and gas transactions review 2016 | 7
The bid-ask spread A gap in value expectations between buyers and the sellers
due to:
• Convergence of opinion on oil price expectations
• and technology implementation
•
The trend was further evidenced in our survey, with over two-thirds of respondents identifying a
valuation gap of over 10%. This, along with capital scarcity, was a key determinant of the lower transactions activity in 2016 compared to previous years. The key driver of the valuation gap has been the volatility in the oil price and a lack of visibility on the longer-term price trend. We saw a modest convergence of views at the end of the year as OPEC and non-OPEC producers announced production cuts which triggered an upsurge in M&A activity.
Portfolio rebalancingLower commodity prices have forced companies to re-evaluate their portfolios, diversify or close non-core or underperforming assets
to quality” and “equity compression” has meant that companies with low-risk portfolios and thus lower cost of capital are able to leverage this position to expose themselves to higher-risk and higher-return assets. An illustration is the utility companies buying upstream assets. Similarly, we are seeing some of the NOCs with heavy upstream exposure buying downstream and petrochemical assets to secure a market for their exports and thus add or preserve value in their upstream businesses.
services industry as massive reductions in capital budgets hammered both their volumes and their margins. This was combined with an acceleration in the implementation of technology
reassess their business models.
Perhaps unsurprisingly, therefore, the changing views of where an
has been a key driver of the M&A activity we saw in 2016 and we expect that to continue.
Governments and industry playersBoth host governments and industry players are reshaping the risk and reward balance to increase the attractiveness of their propositions. The decline in investment activity led some of the oil- and gas-rich countries, especially those in higher-cost provinces
Companies are also adopting innovative ways to package assets for
to sell only the remaining hydrocarbons, retaining the
to the vendor as the acquirer can focus on the asset and extend
deferrals have also been more common.
| Global oil and gas transactions review 20168
Upstream
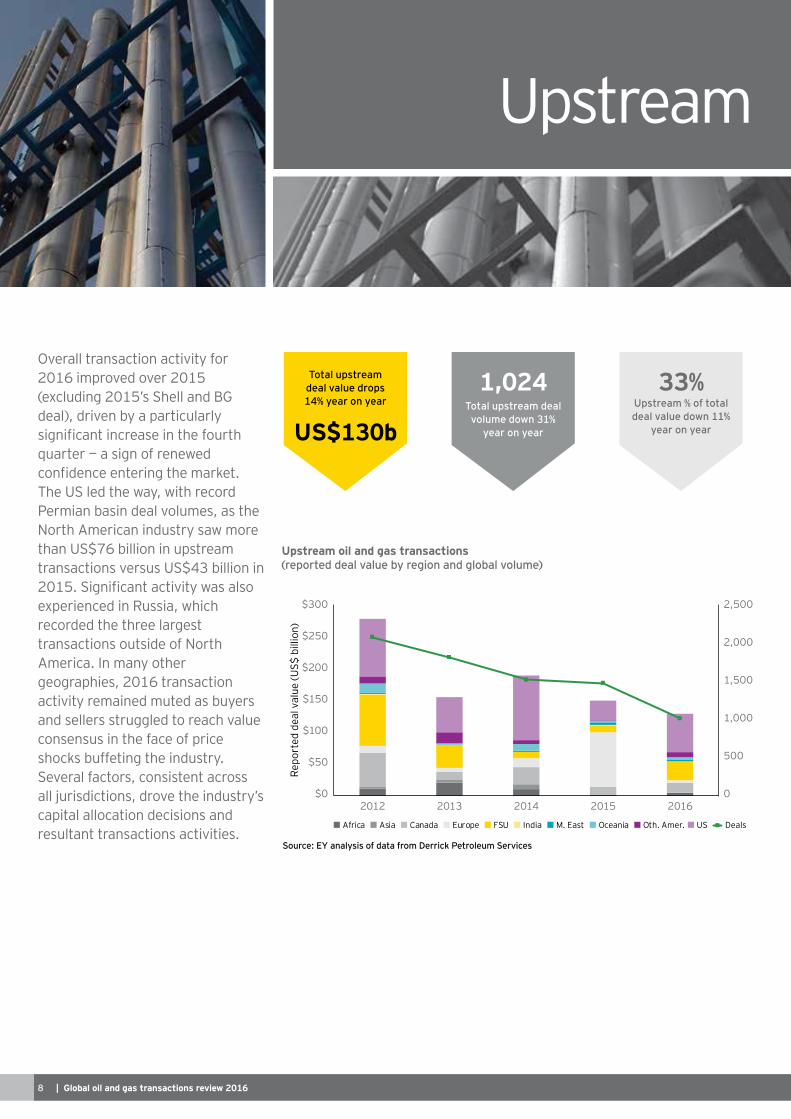
Overall transaction activity for 2016 improved over 2015
The US led the way, with record Permian basin deal volumes, as the North American industry saw more than US$76 billion in upstream transactions versus US$43 billion in
recorded the three largest transactions outside of North America. In many other geographies, 2016 transaction activity remained muted as buyers and sellers struggled to reach value consensus in the face of price shocks buffeting the industry. Several factors, consistent across all jurisdictions, drove the industry’s capital allocation decisions and resultant transactions activities.
0
500
1,000
1,500
2,000
2,500
$0
$50
$100
$150
$200
$250
$300
2012 2013 2014 2015 2016
Repo
rted
dea
l val
ue (U
S$ b
illio
n)
Africa Asia Canada Europe FSU India M. East Oceania Oth. Amer. US Deals
Upstream oil and gas transactions
Total upstream deal value drops 14% year on year
US$130bTotal upstream deal volume down 31%
year on year
1,024Upstream % of total deal value down 11%
year on year
33%
Global oil and gas transactions review 2016 | 9
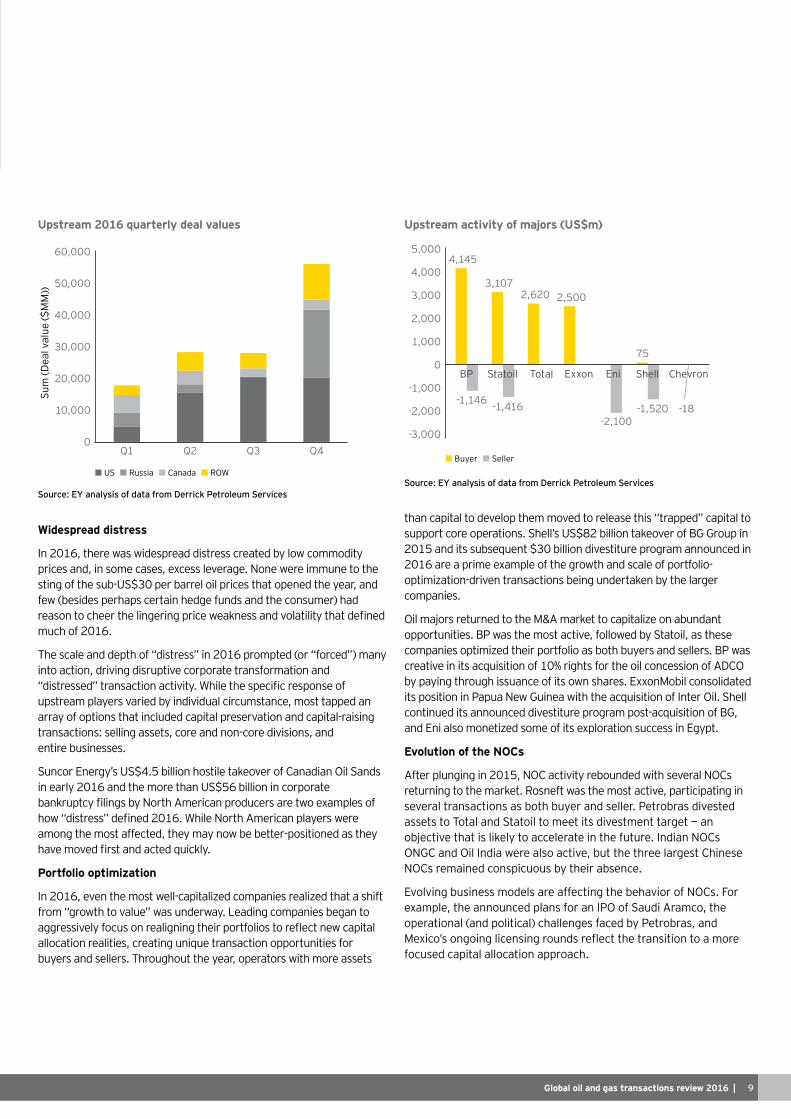
Upstream 2016 quarterly deal values
Widespread distress
In 2016, there was widespread distress created by low commodity prices and, in some cases, excess leverage. None were immune to the sting of the sub-US$30 per barrel oil prices that opened the year, and
much of 2016.
into action, driving disruptive corporate transformation and
upstream players varied by individual circumstance, most tapped an array of options that included capital preservation and capital-raising transactions: selling assets, core and non-core divisions, and entire businesses.
Suncor Energy’s US$4.5 billion hostile takeover of Canadian Oil Sands in early 2016 and the more than US$56 billion in corporate
among the most affected, they may now be better-positioned as they
Portfolio optimization
In 2016, even the most well-capitalized companies realized that a shift from “growth to value” was underway. Leading companies began to
allocation realities, creating unique transaction opportunities for buyers and sellers. Throughout the year, operators with more assets
US Russia Canada ROW
0
10,000
20,000
30,000
40,000
50,000
60,000
Q1 Q2 Q3 Q4
Sum
(Dea
l val
ue ($
MM
))
than capital to develop them moved to release this “trapped” capital to support core operations. Shell’s US$82 billion takeover of BG Group in 2015 and its subsequent $30 billion divestiture program announced in 2016 are a prime example of the growth and scale of portfolio-optimization-driven transactions being undertaken by the larger companies.
Oil majors returned to the M&A market to capitalize on abundant opportunities. BP was the most active, followed by Statoil, as these companies optimized their portfolio as both buyers and sellers. BP was creative in its acquisition of 10% rights for the oil concession of ADCO by paying through issuance of its own shares. ExxonMobil consolidated its position in Papua New Guinea with the acquisition of Inter Oil. Shell continued its announced divestiture program post-acquisition of BG, and Eni also monetized some of its exploration success in Egypt.
Evolution of the NOCs
After plunging in 2015, NOC activity rebounded with several NOCs
several transactions as both buyer and seller. Petrobras divested
objective that is likely to accelerate in the future. Indian NOCs ONGC and Oil India were also active, but the three largest Chinese NOCs remained conspicuous by their absence.
example, the announced plans for an IPO of Saudi Aramco, the
focused capital allocation approach.
Upstream activity of majors (US$m)
Buyer Seller
4,145
3,1072,620 2,500
75
-1,146 -1,416-2,100
-1,520 -18
-3,000
-2,000
-1,000
0
1,000
2,000
3,000
4,000
5,000
BP Statoil Total Exxon Eni Shell Chevron
| Global oil and gas transactions review 201610
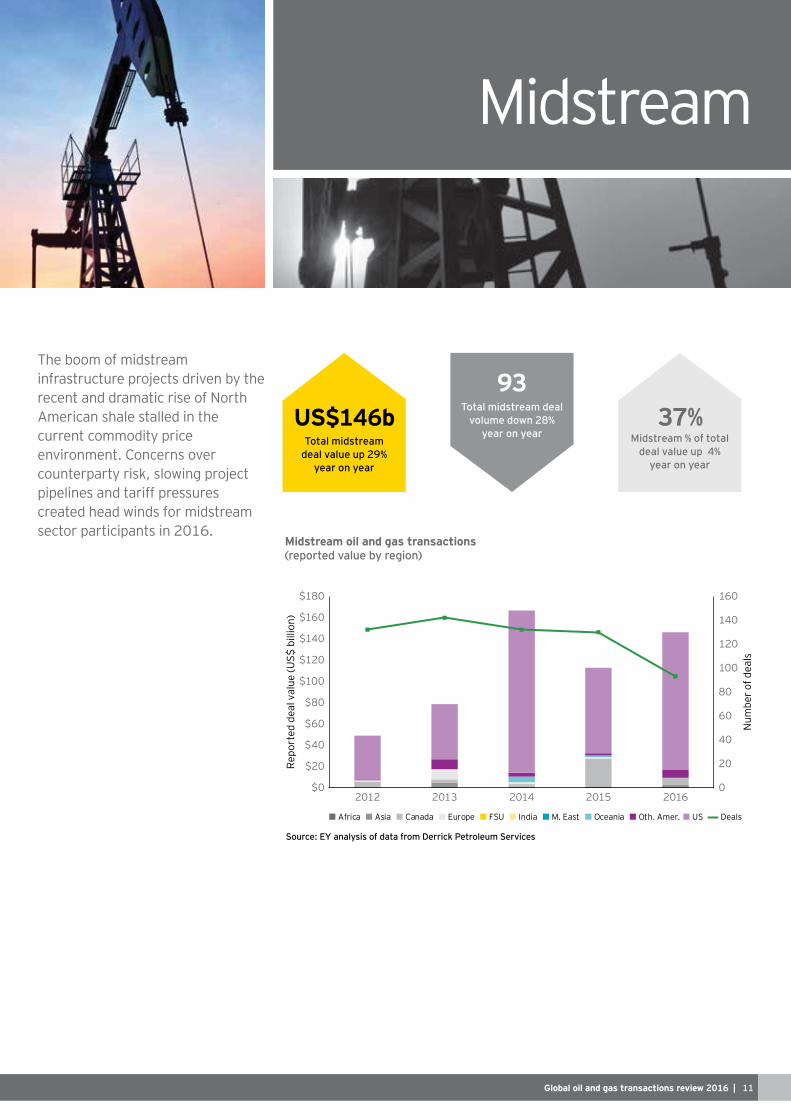
able to access a market with many opportunities at a time when traditional buyers were more capital-constrained. The largest
Glencore and Qatar Investment Authority for US$10.9 billion.
PE deal value in the US more than doubled, but there was a much lower increase in deal count as several large deals were over US$500 million.
Outlook for 2017
Upstream will see a year of opportunity in 2017. The industry is resilient and adaptive, and market discipline is having its intended effect on balancing supply and demand.
While the distress of 2016 will continue to have implications in
more positive and stable commodity price outlook, improving
and better cost structures, a return of capital to the sector, and the appearance of better alignment on valuations will allow industry players to accelerate their strategic initiatives.
Companies will pivot from defensive “survival” tactics to those actions required to be market leaders and winners. Portfolio optimization will accelerate as disciplined players make sure value is being created throughout the capital allocation process. We expect NOC activity to increase as Iran opens its market and reserve replacement ratios of several NOCs come under pressure from steep cutbacks in upstream capex. 2017 could also see the return of Chinese players into the market.
As transaction activity increases, “transaction excellence” will be key. Transaction excellence is achieved by adopting leading-class planning, structuring and execution practices in the transaction
capital structure to match the risk of an investment, to bringing a more rigorous focus and discipline in transaction execution, transaction excellence demands the thoughtful, thorough and honest pursuit of pre- and post-transaction value.
Some of the key transaction themes expected in 2017 include:
• The resolution of 2016’s distressed situations through new
• The increasing availability of quality assets for acquisition as part of accelerated portfolio optimization programs
• in North America, that will leverage access to plentiful capital
• The rise of creative deal structures, such as through joint ventures, as parties seek to share project and capital risk
experienced and there is wide spread belief that 2017 will be better. Transactions will play a critical part in the restructuring and repositioning underway. Opportunities will abound and winners will emerge as the industry looks for a brighter future.
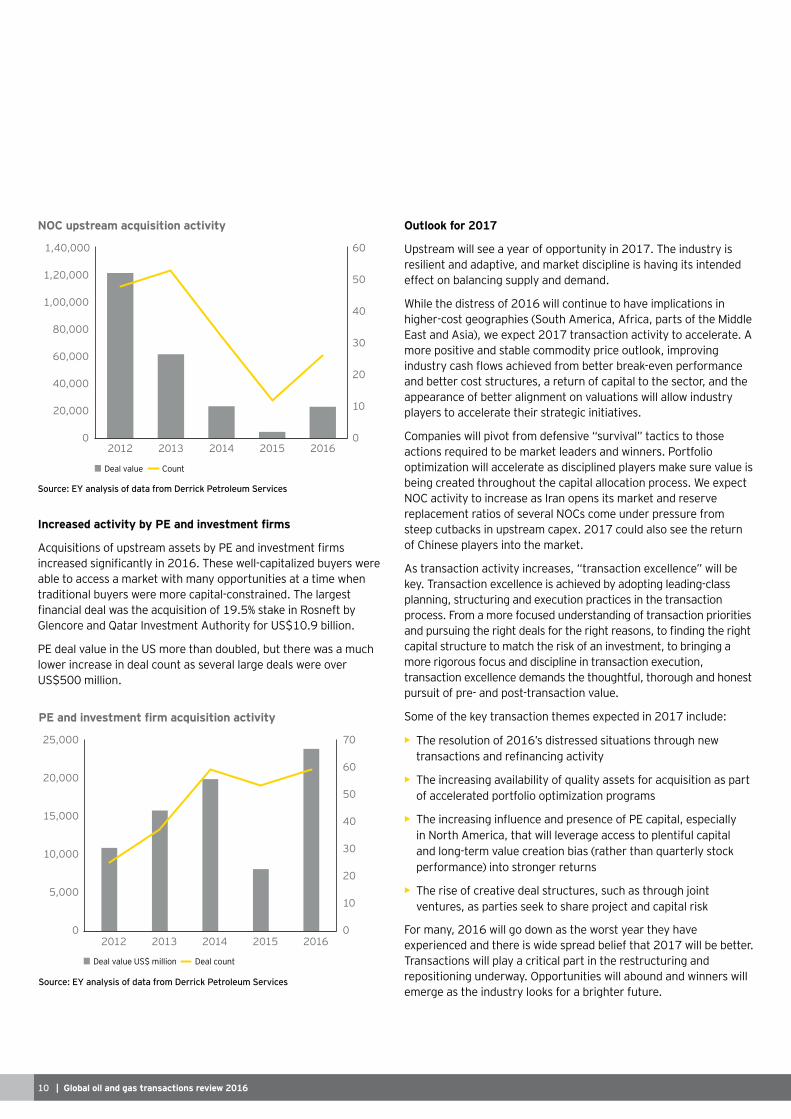
0
10
20
30
40
50
60
0
20,000
40,000
60,000
80,000
1,00,000
1,20,000
1,40,000
2012 2013 2014 2015 2016
Deal value Count
NOC upstream acquisition activity
Deal value US$ million Deal count
0
10
20
30
40
50
60
70
0
5,000
10,000
15,000
20,000
25,000
2012 2013 2014 2015 2016
Global oil and gas transactions review 2016 | 11
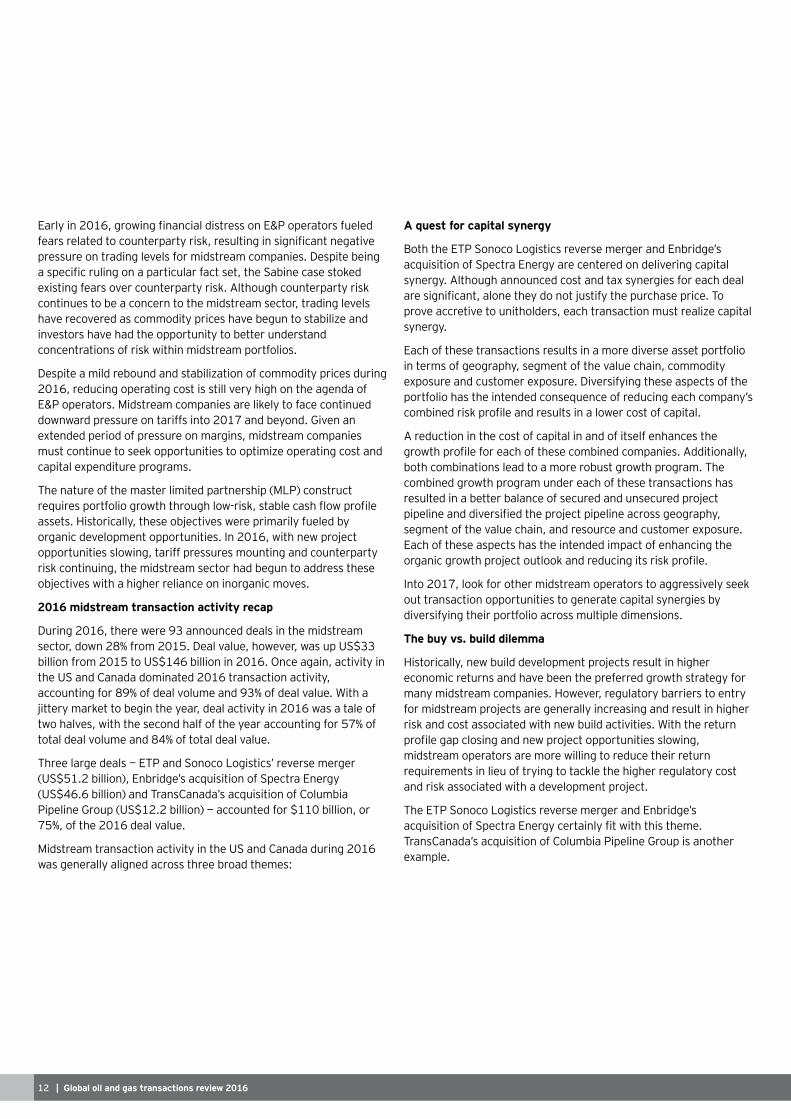
Midstream
The boom of midstream infrastructure projects driven by the recent and dramatic rise of North American shale stalled in the current commodity price environment. Concerns over counterparty risk, slowing project pipelines and tariff pressures created head winds for midstream sector participants in 2016.
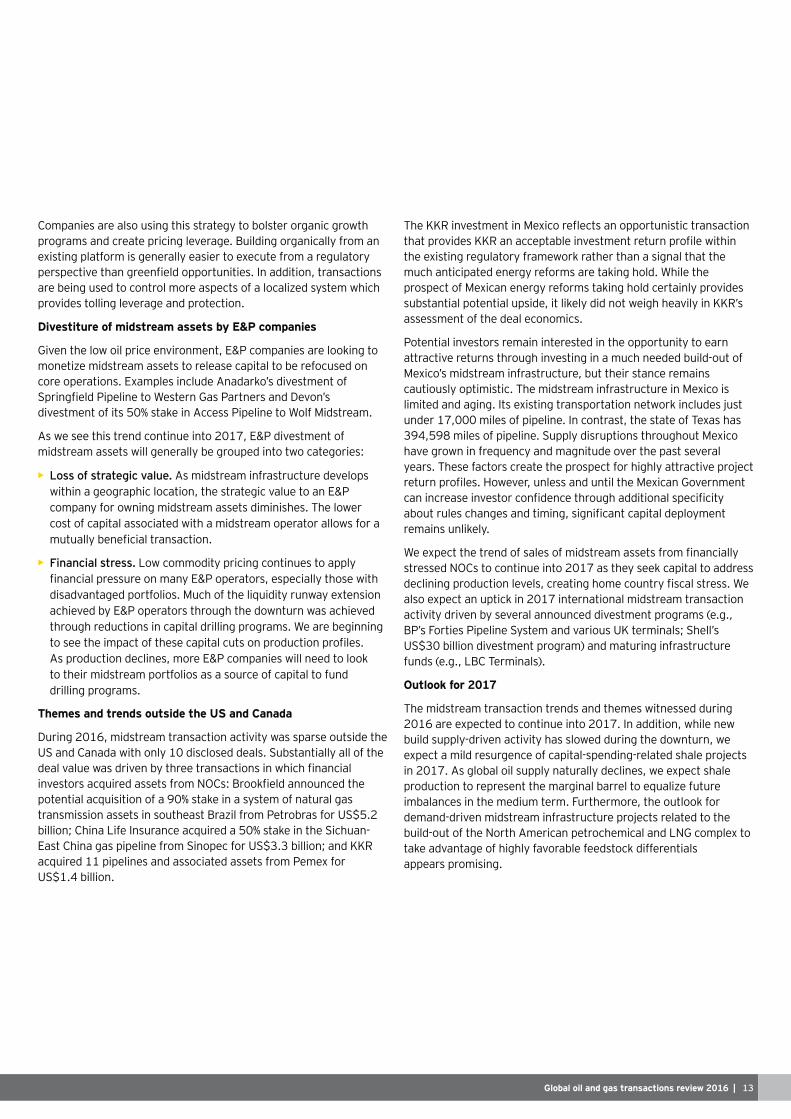
Total midstream deal volume down 28%
year on year
93
Midstream % of total deal value up 4%
year on year
37%Total midstream
deal value up 29% year on year
US$146b
Africa Asia Canada Europe FSU India M. East Oceania Oth. Amer. US Deals
0
20
40
60
80
100
120
140
160
$0
$20
$40
$60
$80
$100
$120
$140
$160
$180
2012 2013 2014 2015 2016
Num
ber o
f dea
ls
Repo
rted
dea
l val
ue (U
S$ b
illio
n)
Midstream oil and gas transactions
| Global oil and gas transactions review 201612
pressure on trading levels for midstream companies. Despite being
existing fears over counterparty risk. Although counterparty risk continues to be a concern to the midstream sector, trading levels have recovered as commodity prices have begun to stabilize and investors have had the opportunity to better understand concentrations of risk within midstream portfolios.
Despite a mild rebound and stabilization of commodity prices during 2016, reducing operating cost is still very high on the agenda of E&P operators. Midstream companies are likely to face continued downward pressure on tariffs into 2017 and beyond. Given an extended period of pressure on margins, midstream companies must continue to seek opportunities to optimize operating cost and capital expenditure programs.
assets. Historically, these objectives were primarily fueled by organic development opportunities. In 2016, with new project opportunities slowing, tariff pressures mounting and counterparty risk continuing, the midstream sector had begun to address these objectives with a higher reliance on inorganic moves.
2016 midstream transaction activity recap
During 2016, there were 93 announced deals in the midstream sector, down 28% from 2015. Deal value, however, was up US$33 billion from 2015 to US$146 billion in 2016. Once again, activity in the US and Canada dominated 2016 transaction activity, accounting for 89% of deal volume and 93% of deal value. With a jittery market to begin the year, deal activity in 2016 was a tale of two halves, with the second half of the year accounting for 57% of total deal volume and 84% of total deal value.
75%, of the 2016 deal value.
Midstream transaction activity in the US and Canada during 2016 was generally aligned across three broad themes:
A quest for capital synergy
Both the ETP Sonoco Logistics reverse merger and Enbridge’s acquisition of Spectra Energy are centered on delivering capital synergy. Although announced cost and tax synergies for each deal
prove accretive to unitholders, each transaction must realize capital synergy.
Each of these transactions results in a more diverse asset portfolio in terms of geography, segment of the value chain, commodity exposure and customer exposure. Diversifying these aspects of the portfolio has the intended consequence of reducing each company’s
A reduction in the cost of capital in and of itself enhances the
both combinations lead to a more robust growth program. The combined growth program under each of these transactions has resulted in a better balance of secured and unsecured project
segment of the value chain, and resource and customer exposure. Each of these aspects has the intended impact of enhancing the
Into 2017, look for other midstream operators to aggressively seek out transaction opportunities to generate capital synergies by diversifying their portfolio across multiple dimensions.
The buy vs. build dilemma
Historically, new build development projects result in higher economic returns and have been the preferred growth strategy for many midstream companies. However, regulatory barriers to entry for midstream projects are generally increasing and result in higher risk and cost associated with new build activities. With the return
midstream operators are more willing to reduce their return requirements in lieu of trying to tackle the higher regulatory cost and risk associated with a development project.
The ETP Sonoco Logistics reverse merger and Enbridge’s
TransCanada’s acquisition of Columbia Pipeline Group is another example.
Global oil and gas transactions review 2016 | 13
Companies are also using this strategy to bolster organic growth programs and create pricing leverage. Building organically from an existing platform is generally easier to execute from a regulatory
are being used to control more aspects of a localized system which provides tolling leverage and protection.
Divestiture of midstream assets by E&P companies
Given the low oil price environment, E&P companies are looking to monetize midstream assets to release capital to be refocused on core operations. Examples include Anadarko’s divestment of
divestment of its 50% stake in Access Pipeline to Wolf Midstream.
As we see this trend continue into 2017, E&P divestment of midstream assets will generally be grouped into two categories:
• As midstream infrastructure develops within a geographic location, the strategic value to an E&P company for owning midstream assets diminishes. The lower cost of capital associated with a midstream operator allows for a
• Financial stress. Low commodity pricing continues to apply
disadvantaged portfolios. Much of the liquidity runway extension achieved by E&P operators through the downturn was achieved through reductions in capital drilling programs. We are beginning
As production declines, more E&P companies will need to look to their midstream portfolios as a source of capital to fund drilling programs.
Themes and trends outside the US and Canada
During 2016, midstream transaction activity was sparse outside the US and Canada with only 10 disclosed deals. Substantially all of the
potential acquisition of a 90% stake in a system of natural gas transmission assets in southeast Brazil from Petrobras for US$5.2 billion; China Life Insurance acquired a 50% stake in the Sichuan-
acquired 11 pipelines and associated assets from Pemex for US$1.4 billion.
the existing regulatory framework rather than a signal that the much anticipated energy reforms are taking hold. While the prospect of Mexican energy reforms taking hold certainly provides
assessment of the deal economics.
Potential investors remain interested in the opportunity to earn attractive returns through investing in a much needed build-out of Mexico’s midstream infrastructure, but their stance remains cautiously optimistic. The midstream infrastructure in Mexico is limited and aging. Its existing transportation network includes just under 17,000 miles of pipeline. In contrast, the state of Texas has 394,598 miles of pipeline. Supply disruptions throughout Mexico have grown in frequency and magnitude over the past several years. These factors create the prospect for highly attractive project
remains unlikely.
stressed NOCs to continue into 2017 as they seek capital to address
also expect an uptick in 2017 international midstream transaction
Outlook for 2017
The midstream transaction trends and themes witnessed during 2016 are expected to continue into 2017. In addition, while new build supply-driven activity has slowed during the downturn, we expect a mild resurgence of capital-spending-related shale projects in 2017. As global oil supply naturally declines, we expect shale production to represent the marginal barrel to equalize future
demand-driven midstream infrastructure projects related to the build-out of the North American petrochemical and LNG complex to take advantage of highly favorable feedstock differentials appears promising.
| Global oil and gas transactions review 201614
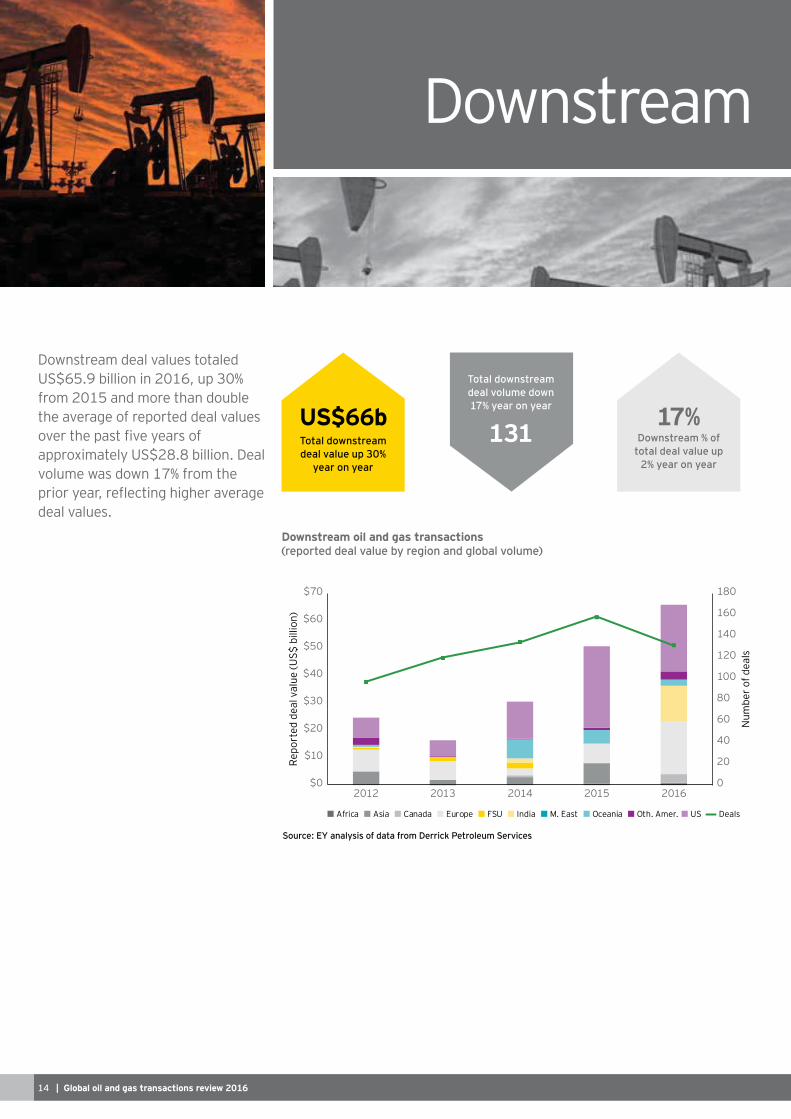
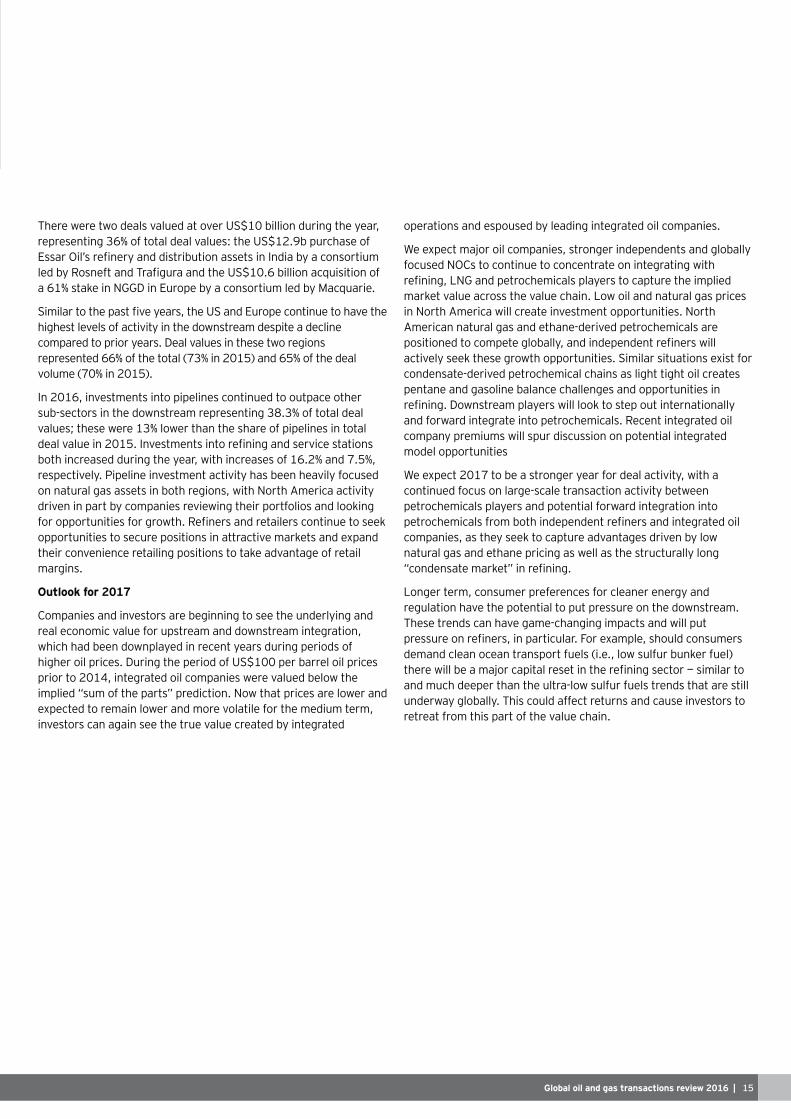
Downstream deal values totaled US$65.9 billion in 2016, up 30% from 2015 and more than double the average of reported deal values
approximately US$28.8 billion. Deal volume was down 17% from the
deal values.
Downstream
131 Downstream % of total deal value up
2% year on year
17%Total downstream deal value up 30%
year on year
US$66b
Total downstream deal volume down 17% year on year
Africa Asia Canada Europe FSU India M. East Oceania Oth. Amer. US Deals
Num
ber o
f dea
ls
0
20
40
60
80
100
120
140
160
180
$0
$10
$20
$30
$40
$50
$60
$70
2012 2013 2014 2015 2016
Repo
rted
dea
l val
ue (U
S$ b
illio
n)
Downstream oil and gas transactions
Global oil and gas transactions review 2016 | 15
There were two deals valued at over US$10 billion during the year, representing 36% of total deal values: the US$12.9b purchase of
a 61% stake in NGGD in Europe by a consortium led by Macquarie.
highest levels of activity in the downstream despite a decline compared to prior years. Deal values in these two regions
In 2016, investments into pipelines continued to outpace other sub-sectors in the downstream representing 38.3% of total deal values; these were 13% lower than the share of pipelines in total
both increased during the year, with increases of 16.2% and 7.5%, respectively. Pipeline investment activity has been heavily focused on natural gas assets in both regions, with North America activity driven in part by companies reviewing their portfolios and looking
opportunities to secure positions in attractive markets and expand their convenience retailing positions to take advantage of retail margins.
Outlook for 2017
Companies and investors are beginning to see the underlying and real economic value for upstream and downstream integration, which had been downplayed in recent years during periods of higher oil prices. During the period of US$100 per barrel oil prices prior to 2014, integrated oil companies were valued below the implied “sum of the parts” prediction. Now that prices are lower and expected to remain lower and more volatile for the medium term, investors can again see the true value created by integrated
operations and espoused by leading integrated oil companies.
We expect major oil companies, stronger independents and globally focused NOCs to continue to concentrate on integrating with
market value across the value chain. Low oil and natural gas prices in North America will create investment opportunities. North American natural gas and ethane-derived petrochemicals are
actively seek these growth opportunities. Similar situations exist for condensate-derived petrochemical chains as light tight oil creates pentane and gasoline balance challenges and opportunities in
company premiums will spur discussion on potential integrated model opportunities
We expect 2017 to be a stronger year for deal activity, with a continued focus on large-scale transaction activity between petrochemicals players and potential forward integration into
companies, as they seek to capture advantages driven by low natural gas and ethane pricing as well as the structurally long
Longer term, consumer preferences for cleaner energy and regulation have the potential to put pressure on the downstream. These trends can have game-changing impacts and will put
and much deeper than the ultra-low sulfur fuels trends that are still underway globally. This could affect returns and cause investors to retreat from this part of the value chain.
| Global oil and gas transactions review 201616
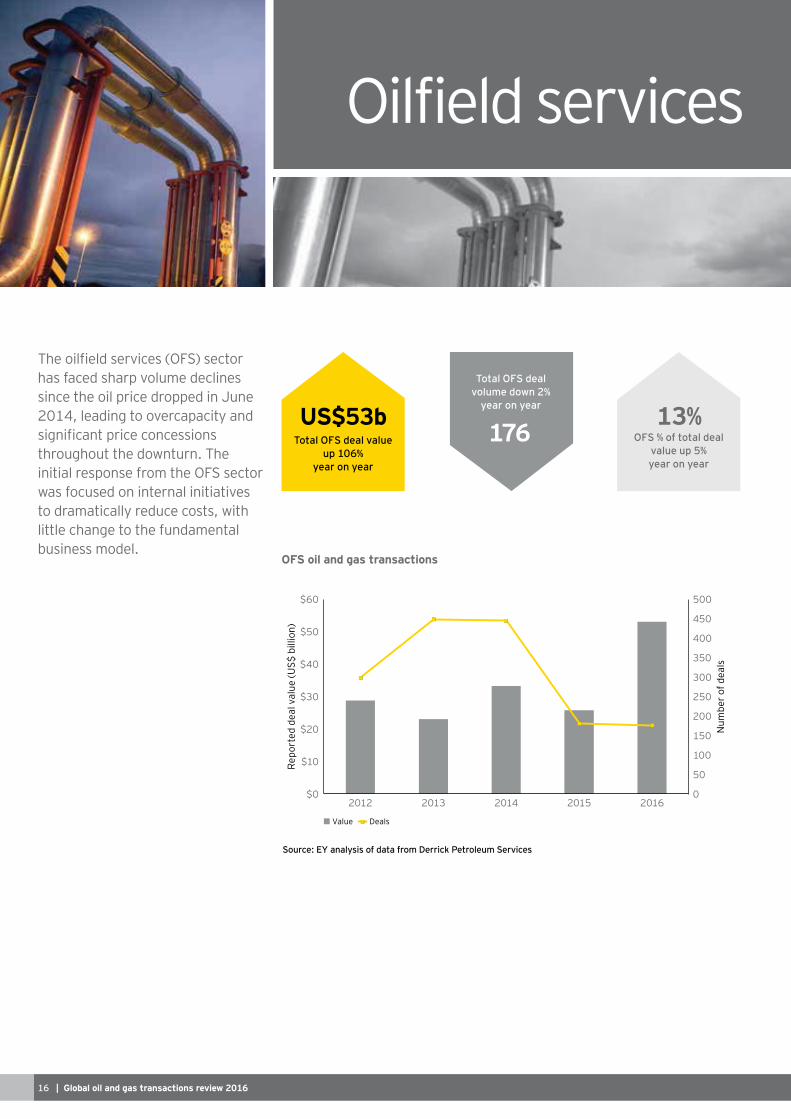
Oilfield services
has faced sharp volume declines since the oil price dropped in June 2014, leading to overcapacity and
throughout the downturn. The
was focused on internal initiatives to dramatically reduce costs, with little change to the fundamental business model.
OFS % of total deal value up 5% year on year
13%Total OFS deal value
up 106% year on year
US$53b176
Total OFS deal volume down 2%
year on year
Value
0
50
100
150
200
250
300
350
400
450
500
$0
$10
$20
$30
$40
$50
$60
2012 2013 2014 2015 2016
Num
ber o
f dea
ls
Repo
rted
dea
l val
ue (U
S$ b
illio
n)
Deals
OFS oil and gas transactions
Global oil and gas transactions review 2016 | 17
changing business environment. Lower commodity price levels have dramatically changed the global activity footprint in terms of both geography and reservoir type. Operators are seeking greater alignment with their supply chain across the entire asset life cycle and are making the organizational and purchasing behavior changes necessary to promote this outcome. Operators have also
concessions will continue beyond the downturn. Transformational
2016 signaled the beginning of this transformation.
2016 transaction activity recap
sector, which is down more than 60% from the 2013 peak. Deal value, however, set a record at US$53 billion, which exceeds the prior record by nearly US$20 billion. Two transformational deals, the GE
accounted for US$46.5 billion, or 88%, of the 2016 deal value.
transformation to adapt to new market realities. Transaction activity driving this transformation aligned across three broad themes:
Vertical integration targeting complex E&P project markets
Baker Hughes, along with Schlumberger’s acquisition of Cameron announced in April 2015, are intended to deliver sustainable savings to operators and establish dominant positions serving the complex E&P project environment. Each of these transactions represent a
value through the creation of a differentiated customer value proposition rather than cost synergies attributable to increased scale. In addition to solution-based offers, an expanded services and equipment portfolio allows a differentiated customer value proposition to be created in one or more of the following areas:
• its ability to generate data. However, this data is currently underused and generally retained within organizational silos.
existing datasets to drive operating performance improvement.
• Higher participation across the development life cycle will increase control and transparency and allow for improved project logistics. In addition, the service
• ability to understand and manage risk, allowing the service provider to offer risk-sharing commercial terms to operators. A
for the operator and potentially stimulate additional activity.
Continuing into 2017 and beyond, large integrated providers are likely to aggressively pursue opportunities to inorganically plug portfolio gaps. Despite the wide breadth of service and equipment
strategy. Conversely, these larger integrated providers are also likely to divest non-core portions from their newly expanded portfolios to reposition and focus on core strategies.
The clear transformation signals provided by “New” Baker Hughes,
response from other market participants. We anticipate additional consolidation in the form of further vertical integration and scale plays as others look for transactional opportunities to enhance their competitive positioning in a rapidly evolving landscape.
Consolidation of the non-complex project focused service market
Beyond the two transformational deals, 2016 was marked by low
completed in the run-up to the fall in oil price was funded by leverage secured on expected growth. Equity and debt investors
downturn, resulting in a much smaller number of forced transactions than many expected. However, high debt levels are beginning to drive transaction activity and create consolidation
International and Topco are a perfect example of a well-capitalized
| Global oil and gas transactions review 201618
consolidation into 2017. We anticipate this consolidation will be
on serving non-complex oil and gas development projects. Well-
likely to drive this market consolidation across three dimensions:
• Opportunistic acquisition of distressed assets. A continued low commodity price environment will force poorly operated or highly leveraged companies to face increasing balance sheet pressure,
pressure is expected to result in the liquidation or forced sale of assets and distressed businesses and begin to alleviate the current capacity overhang.
• Stabilization of commodity pricing and a growing consensus on the medium-term
strategic additions to their offering portfolios.
• The rise of shale has
has led to a substantial shift in the types of reservoirs expected to be drilled in the medium term. This shift has a profound impact on both portfolio and geographic positioning. Look for
mechanism to better position themselves to new market realities.
Focus on technology and digital data integration
The oil and gas industry is one of the world’s most advanced users of technologies. However, these technologies have been primarily
effectiveness of hydrocarbon extraction, rather than operational performance and end-to-end integration.
Global oil and gas transactions review 2016 | 19
The industry also collects massive volumes of data. This data is generally highly technical and specialized and sits within functional silos, limiting cross-functional interaction and understanding.
enterprise understanding to drive better decision making and operating performance.
Although there is a limited population of disclosed transaction details, there have been a number of clear examples of technology and digital data integration underpinning the overall rationale for deals in 2016:
• The deal hypothesis of GE Oil & Gas’ acquisition of Baker Hughes is clearly underpinned by the potential to apply digital
application of GE’s Predix digital analytics platform. By using the scope of the combined portfolio, New Baker Hughes hopes
project life cycle through a better understanding of data to
• of 2017 is another example of this technology trend. With Peak’s
will create a fully integrated well intervention solution designed to
asset use to systematically improve performance. Technology and digital applications have the potential to disrupt the oil and gas industry on a scale equivalent to the North American shale phenomenon. Small and start-up companies are best-positioned to
progress. Expect a high focus on technology and digital transactions into 2017 by larger players as they look to bolster
Conclusion In light of rapidly and dramatically changing market
undergoing a transformation to reposition itself. This transformation is unlikely to reverse if and when commodity
changes and develop a transformation strategy to help
genuinely differentiated value proposition must be created.
The industry has changed rapidly over the past two years. To
or transformative changes to their business model. Given
You can also connect with us using social media:
EY | Assurance | Tax | Transactions | Advisory
EY is a global leader in assurance, tax, transaction and advisory services. The insights and quality services we deliver help build trust and confidence in the capital markets and in economies the world over. We develop outstanding leaders who team to deliver on our promises to all of our stakeholders. In so doing, we play a critical role in building a better working world for our people, for our clients and for our communities.
EY refers to the global organization, and may refer to one or more, of the member firms of Ernst & Young Global Limited, each of which is a separate legal entity. Ernst & Young Global Limited, a UK company
information about our organization, please visit ey.com.
The oil and gas sector is constantly changing. Increasingly uncertain energy policies, geopolitical complexities, cost management and climate change all present significant challenges. EY’s Global Oil & Gas Sector supports a global network of more than 10,000 oil and gas professionals with extensive experience in providing assurance, tax, transaction and advisory services across the upstream, midstream, downstream and oilfield subsectors. The Sector team works to anticipate market trends, execute the mobility of our global resources and articulate points of view on relevant sector issues. With our deep sector focus, we can help your organization drive down costs and compete more effectively.
© 2017 EYGM Limited.
BMC Agency GA 0000_09650
EYG no. 00398-174Gbl
ED None
In line with EY’s commitment to minimize its impact on the environment, this document has been printed on paper with a high recycled content.
This material has been prepared for general informational purposes only and is not intended to be relied upon as accounting, tax or other professional advice. Please refer to your advisors for specific advice.
Andy Brogan +44 20 7951 7009 [email protected]
Vance Scott +1 312 879 2185 [email protected]
Jon Clark +44 20 7951 7352 [email protected]
Sanjeev Gupta +65 6309 8688 [email protected]
Evgeny Khrustalev +61 8 9429 2416 [email protected]
Dilip Khanna +61 8 9429 2416 [email protected]
Kunihiko Taniyama +81 3 4582 6400 [email protected]
Tabrez Khan +44 20 7951 4674 [email protected]
Grigory Arutunyan +7 495 641 2941 [email protected]
Barry Munro +1 403 206 5017 [email protected]
Our Global Oil & Gas Transaction Advisory Services contacts:
EY Global Oil & Gas Center @EY_OilGas EY Global