EY Eurozone Forecast: Eurozone rebalancing toward broad-based ...
56
EY Eurozone Forecast June 2015 Eurozone rebalancing toward broad- based recovery
Transcript of EY Eurozone Forecast: Eurozone rebalancing toward broad-based ...

EY Eurozone Forecast June 2015
Eurozone rebalancing toward broad-based recovery

Highlights
4Implications for businesses
6
Foreword
2
Published in collaboration with
Contents
Time to move forwardWith more stable growth returning to the Eurozone, business leaders should think about investing for growth and identifying key future trends.
“At last, solid and sustainable growth has returned to the Eurozone. We expect steady growth this year and into the medium term, as investment begins to support stronger consumption.”
Mark Otty, Area Managing Partner, Europe, Middle East, India and Africa
Published on 1 June 2015
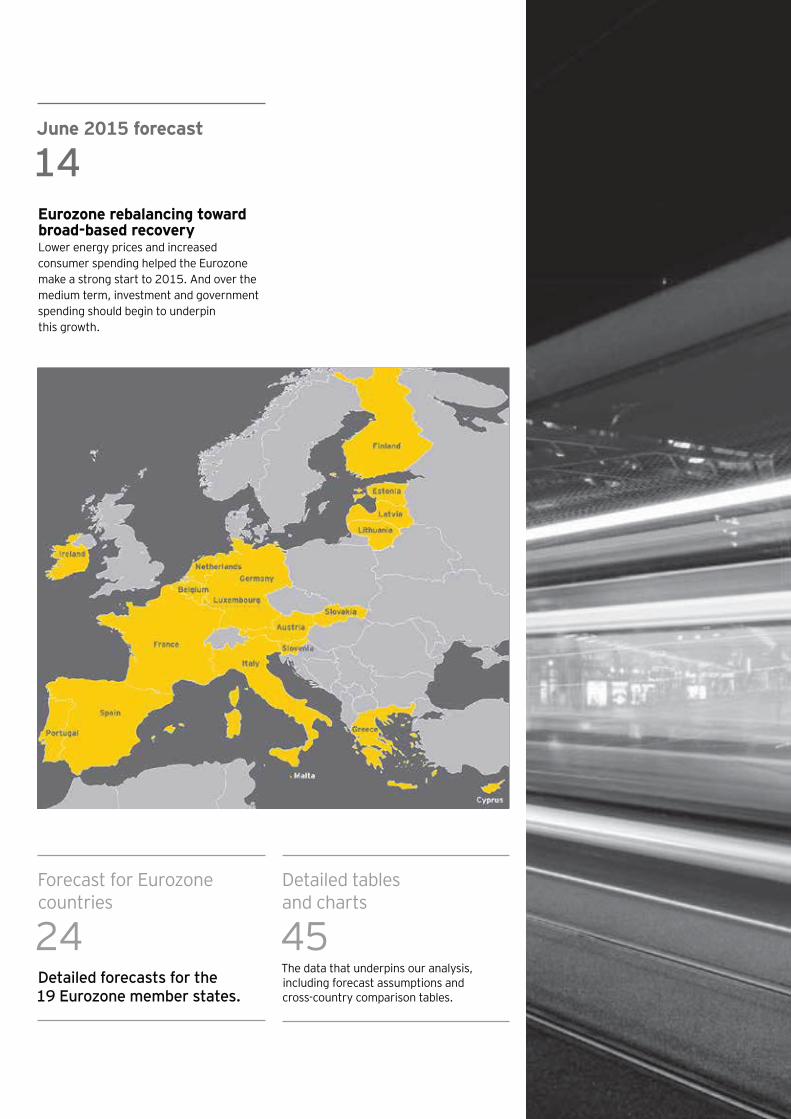
Forecast for Eurozone countries
24Detailed tables and charts
45Detailed forecasts for the 19 Eurozone member states.
The data that underpins our analysis, including forecast assumptions and cross-country comparison tables.
June 2015 forecast
14Eurozone rebalancing toward broad-based recoveryLower energy prices and increased consumer spending helped the Eurozone make a strong start to 2015. And over the medium term, investment and government spending should begin to underpin this growth.

EY Eurozone Forecast June 2015
Eurozone rebalancing toward broad-based recovery
Customize data from the EY Eurozone Forecast at ey.com/eurozone.
At last, solid and sustainable growth has returned to the Eurozone. We expect steady growth this year and into the medium term, as investment begins to support stronger consumption.
Foreword
2 EY Eurozone Forecast June 2015
At last, it seems that stable, steady growth has returned to the Eurozone. We’ve been perhaps overly optimistic in the past, but this time it seems that growth is here to stay.
As I write this, the newspapers are focused on fear of a Greek exit from the single currency. Although this makes for eye-catching headlines, it is a distraction from the broader and much more positive Eurozone story. Lower energy prices, higher consumer spending, a stronger labor market and a weaker euro are all contributing to a broad-based recovery.
some time now. The Eurozone actually outperformed both
with growth of 0.4% on the quarter. In March, we forecast Eurozone-wide growth of 1.5% for 2015. Thanks to the solid performance at the start of the year, we’ve now raised this slightly to 1.6%.
A lot of this early-year uptick has been down to increased
leaving more change in people’s pockets. This effect won’t last forever — oil prices will creep up again in the coming
other areas too. From next year, we expect investment and government spending to help underpin the recovery. As the Eurozone gains stability and momentum, we expect growth of 1.9% in 2016 and 1.7% in 2017.
Despite the positive movement in consumer spending, unemployment is still painfully high in much of the currency bloc, especially in the periphery. Spain, for instance, which has been a real success story in so many respects, won’t see its unemployment rate drop much below 20% until around 2018. Italy still sits above 12% and Portugal at about 13%. In Greece meanwhile, over 25% of people are expected to
jobs next year. As I’ve noted, the number of young people out of work could have particularly pernicious long-term effects if it leads to a disaffected and disenfranchised generation in parts of Europe.
Despite all this, we do expect the labor markets throughout the Eurozone to improve gradually. This is behind our forecast of steadily growing consumer spending, at around 1.7% this year and next, even as oil prices return to higher levels.
with recovery to result in growing capital spending. Already
We are forecasting a strong uptick in investment growth next year, moving to nearly 3% after an expected 1.1% in 2015. Increasing investment should help to underpin the recovery, along with stronger government spending across the bloc.
So business leaders with interests in the Eurozone need to prepare themselves for this return to more stable growth. This edition of the EY Eurozone Forecast explores what
and an M&A boom.
Obviously, the fate of Greece remains a major stumbling block for the single currency. And I can only hope that it is resolved soon — for the sake of the Eurozone’s stability and the straitened Greek people. I also hope that this June edition of the EY Eurozone Forecast is interesting and useful for your business planning. Don’t forget to visit ey.com/eurozone to keep up with the latest Eurozone developments and to access information on the 19 member states.
Mark OttyArea Managing Partner, Europe, Middle East, India and Africa
3EY Eurozone Forecast June 2015
Highlights
A sustained spell of solid growth in prospect
• A positive start to 2015 — with Q1 GDP growing by 0.4% on the quarter, stronger than the US or the UK — suggests that Eurozone consumers are responding to lower energy prices. As a result, we have raised our forecast for growth in 2015 to 1.6% from 1.5% seen in March with 1.9% now projected for 2016. Although growth may then slow a little, the recovery will become more broad-based. Investment spending should become a key growth driver from next year and government spending will make an increasing contribution. We forecast GDP growth of 1.7% in 2017 and an average of about 1.5% a year in 2018–19.
Labor market recovery to support consumer spending
• The latest data suggests consumers are spending their energy windfall, despite stubbornly high unemployment and weak wage growth, and we have lifted our forecast for consumer spending growth in 2015 from 1.6% to 1.7%. But, as oil prices continue to recover gradually in the coming year, this energy windfall will slowly reverse. The modest drag on household income will offset gains from an improving labor market, meaning consumer spending will grow at a similar rate in
up recruitment and labor market slack falls, wage growth will start to gather pace. As such, consumer spending can sustain growth of a little over 1.3% a year in 2017–19.
• Consumer recovery is likely to lead to stronger import growth this year, so even with export growth picking up we have lowered our forecast for the Eurozone current account surplus in 2015 to 2.3% of GDP. But with consumer spending growth easing in the years ahead, and export prospects largely unchanged from our March forecast, we still expect the current
in the coming years.
Investment will gradually recover as uncertainty fades
• There is evidence that businesses are preparing to invest, with increasingly positive business surveys and loans data in recent months. For now, this is only tentatively feeding into capital spending itself. But as uncertainty over Greece’s future is addressed, and with lower borrowing costs than in previous years, we expect this to become more apparent moving into 2016.
• We expect total investment to grow 1.1% in 2015, accelerate to almost 3% in 2016–17, before easing to 2.5% in 2018–19. This is well short of pre-crisis rates of investment growth, but, since much of this was accounted for by housing, a slower pace of capital accumulation need not necessarily imply lower future output growth.
Fiscal squeeze will gradually lift
• As recovery takes hold, tax revenues will do more of the work in reducing
growth should accelerate modestly through the rest of the decade, from 0.5% in 2015, to 0.7% in 2017 and then 0.9% in 2019. But it will be important for governments to ensure new resources are targeted at restoring public investment, which remains 25% below its 2009 level.
4 EY Eurozone Forecast June 2015
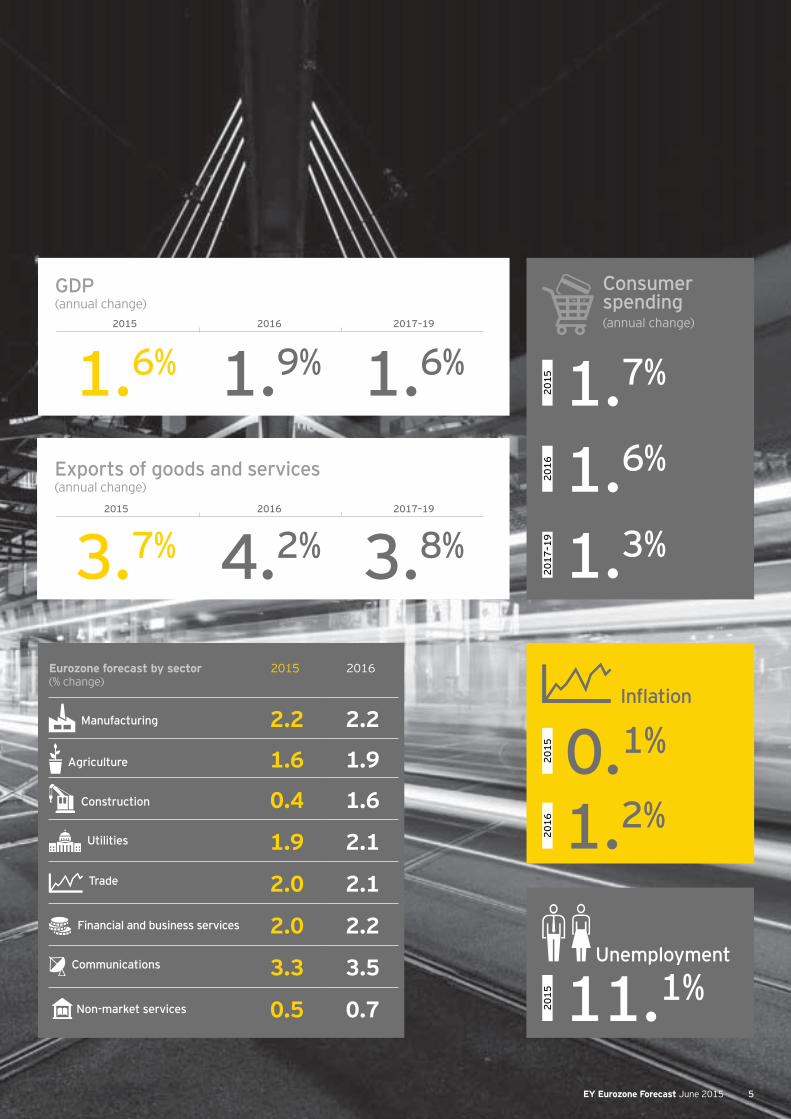
Unemployment
2015
11.1%
Eurozone forecast by sector (% change)
2015 2016
Manufacturing 2.2 2.2
Agriculture 1.6 1.9
Construction 0.4 1.6
Utilities 1.9 2.1
Trade 2.0 2.1
Financial and business services 2.0 2.2
Communications 3.3 3.5
Non-market services 0.5 0.7
GDP (annual change)
1.6% 1.9% 1.6%2015 2016 2017–19
Exports of goods and services(annual change)
3.7% 4.2% 3.8%2015 2016 2017–19
Inflation
2015
0.1%
2016
1.2%
Consumer spending (annual change)
2015
1.7%
2016
1.6%
2017
–19
1.3%
5EY Eurozone Forecast June 2015

6 EY Eurozone Forecast June 2015

Implications for businesses:
Time to move forward7EY Eurozone Forecast June 2015

Time to move forward
Growth in the Eurozone is accelerating. Despite some significant uncertainties, consumers are spending more freely and many companies have resumed hiring. In this fast-changing environment, corporate leaders need to invest and grow their businesses, while policy-makers must step up efforts to nurture economic growth and improve the business climate.
In this section, we explore the five most important concerns for businesses and governments: rising consumer spending, cheap borrowing, changing exchange rates, an upsurge in business flotations, and a boom in mergers and acquisitions (M&A).
Consumer spending
Consumer spending is set to rise 1.7% in 2015 and 1.6% in 2016, up from just 1% in 2014 and well above the average of recent years. In some countries, such as Germany, this is being driven by wage growth
in tightening labor markets. In others, such as Italy, consumers are spending their energy windfall on big-ticket items such as cars and white goods, encouraged by stabilizing employment markets.
For governments
The nascent recovery in consumer spending is welcome news for governments, as sales tax receipts will rise too. And as consumer demand drives firms to hire more, employment tax revenues and national insurance receipts should be starting to rise while unemployment benefits fall. Together, these factors should help restore public finances.
• How should policy-makers allocate these additional revenues as they recover room to maneuver?
• Will debt repayment or investment in infrastructure,
for citizens?
• How can policy-makers help ensure the recovery gets off the ground?
For businesses
After years of cost-cutting, companies need to overhaul their strategies. They need to look on a country-by-country basis at the recovery of consumer demand and the factors behind it.
In Germany, where rises in real personal disposable income of over 3% are expected to result in a sharp rise in consumer spending, increasing wages and social benefits will underpin continuing growth.
In southern Europe, where wage growth remains weak and unemployment is still high, it may take some time before it is clear whether the uptick in consumer spending will last. To adapt to these varying scenarios businesses should reassess their value chains and logistic costs, deciding on whether to expand or relocate capacity, or if there are more competitive suppliers available. Any new investments should consider whether the most attractive locations are in high-growth consumption markets or where wage stability enables a better management of margins.
• How is your business positioned to respond?
• after-sales service?
• Do you have the best products for your target markets?
• Do you have the right go-to-market approach?
8 EY Eurozone Forecast June 2015
Financial markets
Quantitative easing will help keep borrowing costs low for businesses, governments and individuals in the Eurozone this year
and next. However, the possibility of a Greek exit from the common currency may continue to overshadow financial markets.
Exchange rates
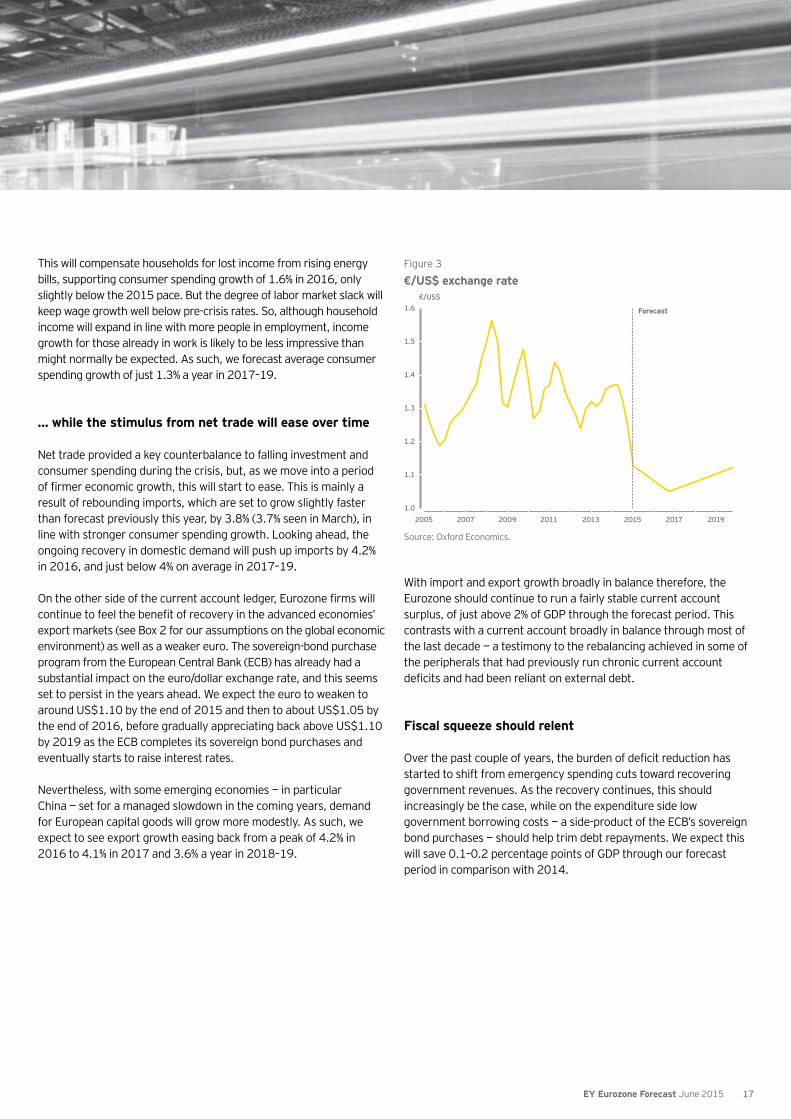
Depreciation has left the euro 7% weaker than at the start of 2015, despite recent appreciation, and weaker still against sterling. This has reinforced Eurozone competitiveness in key export markets as
the dollar soars. We expect the euro to weaken to US$1.10 by the end of this year and about US$1.05 by the end of 2016.
For governments
National, regional and local governments and public bodies can take advantage of cheap rates to lock in affordable debt for years to come. Today’s rates are an opportunity to reduce borrowing costs, accelerate debt repayment where needed and fund desirable projects, such as modernizing administration and public services, and developing 21st century infrastructure.
• How can public bodies achieve the best rates?
• Where in their operations should public bodies devote resources to provide the most cost-effective services and facilities for taxpayers?
For governments
With exports and imports growing strongly we expect the Eurozone as a whole to maintain a current account surplus just above 2% of GDP through to 2019. This should be good news, but it is vital to ensure bureaucracy does not impede increased trade flows.
• volumes and ensure there are no delays?
• Are checks in place to ensure sub-standard goods are not among those sucked in by rising demand?
For businesses
Cheap money is an advantage at a time of rising demand, enabling companies to invest in additional capacity by hiring, adding plant and buildings, and making acquisitions.
• Do you have an optimal capital structure?
• What kind of fund-raising is right for your business, and what terms are appropriate?
• How does a private placement compare with a public bond issue, and how strong is the appeal of your business to potential lenders?
• How can you optimize your treasury management during this era of low interest rates?
For businesses
We expect Eurozone exports to grow by 3.7% in 2015, while imports remain strong despite becoming more expensive. Given the scale of shifts under way, many companies will need to review their value chains and opportunities.
• Are your plants and suppliers optimally located?
• • Are you grasping opportunities to increase exports, or
substitute your products and services for imports?
• Are exchange rate shifts eroding or fattening your margins?
• Do you need to update stakeholders, including shareholders?
9EY Eurozone Forecast June 2015

Time to move forward
IPO trends
The Europe, Middle East, India and Africa (EMEIA) region topped the chart for initial public offerings (IPOs) in Q1 2015. The region hosted 67 flotations valued at US$16.8b in total (44% of global IPOs by value). Eleven companies were floated in France, only one
fewer than in London, making it the fifth biggest market after China, the US, Japan and the UK. Meanwhile, Madrid ranked second only to Shanghai by funds raised, according to EY’s Q1 Global IPO Trends report.
For governments
The world’s biggest IPO during Q1 was the US$4.8b privatization of Spanish state airport operator Aena. Pressure to reduce government budget deficits and stimulate growth should continue to encourage states to float more state-owned companies.
• •
ahead of an IPO?
• How can the challenges of shifting public employees into the private sector be overcome?
For businesses
Private equity firms exiting investments accounted for 7 of the 10 biggest IPOs in EMEIA during Q1 and a record share (54%) of funds raised. Industrials, consumer goods and health care all sold well. We think 2015 will prove a great year for technology IPOs in the region.
As IPO activity strengthens and euro weakness continues to attract US investors, flotation is an attractive option for company owners.
• How strong is demand likely to be for your business and what valuation could it command?
• exit options?
• Which would be the most appropriate market or markets?
• What regulatory hurdles must be crossed?
10 EY Eurozone Forecast June 2015

M&A trends
The M&A spree launched by European companies last year (when they accounted for 46% of global cross-border deals by volume) looks set to continue. EY’s European Mid-Market Barometer shows not only that 6,000 European companies are optimistic about
transactions, but that 9% expect a transition of ownership or managing generations in the next few years, adding to Europe’s potential for a continuing M&A spree.
For governments
Cross-border M&A can raise some difficult questions for policy-makers. Consolidation can boost competitiveness and trigger investment, or cost jobs and swallow national champions.
• How can policy-makers evaluate the consequences for economies, ensure rigorous takeover and competition rules are respected?
• How can they do their best for consumers and competitiveness?
• Where does a country’s long-term best interest lie?
For businesses
April’s EY Capital Confidence Barometer showed soaring confidence among corporate executives in the outlook for the global economy, and especially the Eurozone. While companies have sharpened their focus on cost control, 56% of respondents said they are planning an acquisition in the next 12 months and 84% of the deals are expected to be cross-border, with a focus on developed markets.
Optimism about Europe’s prospects was confirmed in May by the annual EY attractiveness survey: Europe, which shows that Europe has regained its crown as the world’s most attractive destination for foreign direct investment (FDI).
Buying a foothold in new markets, or consolidating rivals, looks like a quick way to profit from a Eurozone recovery. But if that is what you have in mind, have you done your homework thoroughly?
• and partnerships?
• • • How will you integrate an acquisition whose employees don’t
share your culture or language?
Preparing for a new era
Working out exactly how all the above factors will play out over the months ahead is not easy. But all the signs suggest that seven years of crisis are at last drawing to a close.
As we return to a climate of enduring growth, a new style of management will be needed for a more positive, optimistic era. This will require a sea change in management thinking. And as always, the early movers will enjoy an advantage over those who struggle to come to terms with a changing continent.
11EY Eurozone Forecast June 2015

Time to move forward
Viewpoint
Andrea Guerzoni Transaction Advisory Services for EMEIA, EY [email protected]
Eurozone M&A upsurge will continue or accelerate
This has been a remarkably positive year for M&A in the Eurozone.
So far in 2015, Eurozone companies have been involved in deals worth €320b, up 28% on 2014 and equal to 22.5% of all global M&A. Most notably, outbound acquisitions in 2015 already total €126b — over three times what they were in the same months of 2014.
You might think that the Eurozone’s challenges create headaches for would-be dealmakers. However, they also create opportunities for executives who are ready and willing to take advantage of instability and unpredictability to lay the foundations for growth in the years ahead.
Consolidation within domestic markets to drive down costs and outbound acquisitions in a search for growth have been the dominant drivers of deals. Those trends should continue. We can also expect an increase in inbound investment, as companies outside Europe take advantage of recent falls in the value of the euro to acquire attractively priced assets.
Many companies will make strategic acquisitions, putting cash piles
savings. We can also expect a rise in strategic sales as companies look to reshape their portfolios, focus on their core businesses and divest to invest.
Cross-border deals should be highly visibly — especially from the Eurozone to the US — as businesses seek growth outside the area to compensate for low growth at home. At the same time, US, Chinese and Japanese buyers may seek high quality assets in Europe.
We can expect activity in many sectors — life sciences, consumer products, industrials, telecoms, and automotive and transport. Technology, media and telecoms companies will do deals as they respond to technological advances. Health care will see a further drive for high quality assets that are also rich in intellectual property — and deals to keep down costs. Reshaping brand portfolios will underpin activity in consumer products. The oil and gas industry will inevitably see consolidation, driven by volatile oil prices.
structures will spur deals across all sectors. The search for innovation will also drive deals at a time when technology and blurring sector lines are disrupting markets.
Major geopolitical or economic shocks notwithstanding, we should see M&A in the Eurozone continue to rise, particularly as more
based recovery takes hold, we can expect even more players coming to the deal table.
12 EY Eurozone Forecast June 2015

Europe sets a new record for foreign investmentThere were 4,341 decisions made to invest in 43 European countries in 2014, up 10% on 2013. The UK, Germany and France remain the top destinations, and Turkey has entered the top 10.
Manufacturing, digital and e-commerce have surged as Europe enters a new phase in its recovery.
Western Europe has become the world’s most attractive investment destination, pushing China down to third place behind North America.
More than half of FDI projects and 30% of jobs created by investments in Europe were taken by the top three destinations: the UK, Germany and France.
An economic recovery, a depreciating euro and falling energy prices have all helped revive the appeal of manufacturing in Europe. Together these factors are underpinning a 20% surge in FDI manufacturing projects and jobs. Logistics operations rose 27%, driven by this industrial resurgence and a boom in e-commerce.
Looking aheadSome 59% of investors believe that Europe’s attractiveness will improve over the next three years. Only 32% of executives, however, have plans to establish or expand operations in Europe over the next year.
59%
EY’s attractiveness survey
Europe 2015
Comeback time
EY’s attractiveness survey: Europe 2015 examines Europe’s investment landscape, including the factors that have led to a new record in FDI.
The report is based on an original methodology that
also surveys 808 international business executives on the perceived attractiveness of Europe for FDI.
13EY Eurozone Forecast June 2015

Eurozone rebalancing toward broad-based recovery
14 EY Eurozone Forecast June 2015
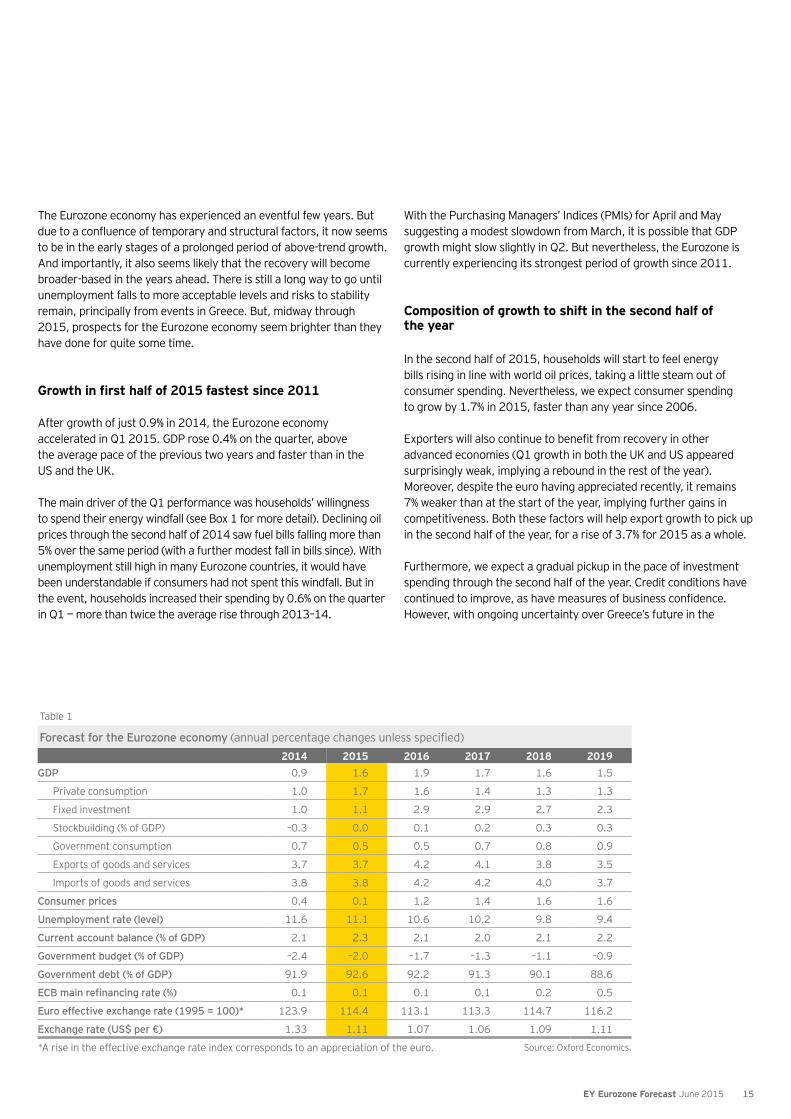
Table 1
Forecast for the Eurozone economy (annual percentage changes unless specified) 2014 2015 2016 2017 2018 2019
GDP 0.9 1.6 1.9 1.7 1.6 1.5
Private consumption 1.0 1.7 1.6 1.4 1.3 1.3
Fixed investment 1.0 1.1 2.9 2.9 2.7 2.3
Stockbuilding (% of GDP) –0.3 0.0 0.1 0.2 0.3 0.3
Government consumption 0.7 0.5 0.5 0.7 0.8 0.9
Exports of goods and services 3.7 3.7 4.2 4.1 3.8 3.5
Imports of goods and services 3.8 3.8 4.2 4.2 4.0 3.7
Consumer prices 0.4 0.1 1.2 1.4 1.6 1.6
Unemployment rate (level) 11.6 11.1 10.6 10.2 9.8 9.4
Current account balance (% of GDP) 2.1 2.3 2.1 2.0 2.1 2.2
Government budget (% of GDP) –2.4 –2.0 –1.7 –1.3 –1.1 –0.9
Government debt (% of GDP) 91.9 92.6 92.2 91.3 90.1 88.6
0.1 0.1 0.1 0.1 0.2 0.5
Euro effective exchange rate (1995 = 100)* 123.9 114.4 113.1 113.3 114.7 116.2
Exchange rate (US$ per €) 1.33 1.11 1.07 1.06 1.09 1.11
*A rise in the effective exchange rate index corresponds to an appreciation of the euro. Source: Oxford Economics.
The Eurozone economy has experienced an eventful few years. But due to a confluence of temporary and structural factors, it now seems to be in the early stages of a prolonged period of above-trend growth. And importantly, it also seems likely that the recovery will become broader-based in the years ahead. There is still a long way to go until unemployment falls to more acceptable levels and risks to stability remain, principally from events in Greece. But, midway through 2015, prospects for the Eurozone economy seem brighter than they have done for quite some time.
After growth of just 0.9% in 2014, the Eurozone economy accelerated in Q1 2015. GDP rose 0.4% on the quarter, above the average pace of the previous two years and faster than in the US and the UK.
The main driver of the Q1 performance was households’ willingness to spend their energy windfall (see Box 1 for more detail). Declining oil prices through the second half of 2014 saw fuel bills falling more than 5% over the same period (with a further modest fall in bills since). With unemployment still high in many Eurozone countries, it would have been understandable if consumers had not spent this windfall. But in the event, households increased their spending by 0.6% on the quarter in Q1 — more than twice the average rise through 2013–14.
With the Purchasing Managers’ Indices (PMIs) for April and May suggesting a modest slowdown from March, it is possible that GDP growth might slow slightly in Q2. But nevertheless, the Eurozone is currently experiencing its strongest period of growth since 2011.
Composition of growth to shift in the second half of the year
In the second half of 2015, households will start to feel energy bills rising in line with world oil prices, taking a little steam out of consumer spending. Nevertheless, we expect consumer spending to grow by 1.7% in 2015, faster than any year since 2006.
Exporters will also continue to benefit from recovery in other advanced economies (Q1 growth in both the UK and US appeared surprisingly weak, implying a rebound in the rest of the year). Moreover, despite the euro having appreciated recently, it remains 7% weaker than at the start of the year, implying further gains in competitiveness. Both these factors will help export growth to pick up in the second half of the year, for a rise of 3.7% for 2015 as a whole.
Furthermore, we expect a gradual pickup in the pace of investment spending through the second half of the year. Credit conditions have continued to improve, as have measures of business confidence. However, with ongoing uncertainty over Greece’s future in the
15EY Eurozone Forecast June 2015

Eurozone rebalancing toward broad-based recovery
Eurozone, and the consequences of its possible exit, this is not yet materializing into higher investment spending. Assuming that uncertainty about Greece’s continued membership fades, this should allow investment spending to start to rise in the last six months of the year, with business investment seen rising 1.5% in 2015 as a whole.
With a modest increase in government spending likely in 2015 overall (at the Eurozone level at least — big differences are likely between individual economies) we expect Eurozone GDP growth of 1.6% for the year.
Figure 1Contributions to GDP growth
Source: Oxford Economics.
% year
–2.5
–2.0
–1.5
–1.0
–0.5
0
0.5
1.0
1.5
2.0
2.5
2011 2012 2013 2014 2015 2016 2017 2018 2019
GDP
Domestic demand
Net exportsForecast
From 2016, the labor market will determine household spending prospects …
The flipside of the oil price slump in the second half of 2014 is that rising oil prices in the coming months will slow households’ real income growth. We expect household energy bills to rise by 5% in 2016, subtracting around half a percentage point from real household income.
Consumer spending will therefore become more reliant on labor market prospects. At the Eurozone level, the unemployment rate has eased by around half a percentage point in the year to Q1 2015, and we expect this pace to be broadly sustained through the coming few years. This would take the unemployment rate from 11.3% in March to just below 9.5% by the end of 2019 — close to the average for the decade to 2007.
Figure 2Unemployment
Source: Oxford Economics; Haver Analytics.
%
9.0
9.5
10.0
10.5
11.0
11.5
12.0
12.5
2011 2012 2013 2014 2015 2016 2017 2018 2019
Forecast
Table 2
Forecast for the Eurozone by sector (annual percentage changes in gross added value)2014 2015 2016 2017 2018 2019
Manufacturing 1.2 2.2 2.2 2.0 1.8 1.6
Agriculture 2.5 1.6 1.9 1.6 1.3 1.1
Construction –0.8 0.4 1.6 1.4 1.6 1.7
Utilities –2.7 1.9 2.1 1.7 1.5 1.3
Trade 1.5 2.0 2.1 1.9 1.7 1.5
Financial and business services 1.1 2.0 2.2 2.0 1.8 1.6
Communications 1.2 3.3 3.5 3.3 3.0 2.8
Non-market services 0.8 0.5 0.7 0.8 0.8 0.9
Source: Oxford Economics.
16 EY Eurozone Forecast June 2015
This will compensate households for lost income from rising energy bills, supporting consumer spending growth of 1.6% in 2016, only slightly below the 2015 pace. But the degree of labor market slack will keep wage growth well below pre-crisis rates. So, although household income will expand in line with more people in employment, income growth for those already in work is likely to be less impressive than might normally be expected. As such, we forecast average consumer spending growth of just 1.3% a year in 2017–19.
… while the stimulus from net trade will ease over time
Net trade provided a key counterbalance to falling investment and consumer spending during the crisis, but, as we move into a period of firmer economic growth, this will start to ease. This is mainly a result of rebounding imports, which are set to grow slightly faster than forecast previously this year, by 3.8% (3.7% seen in March), in line with stronger consumer spending growth. Looking ahead, the ongoing recovery in domestic demand will push up imports by 4.2% in 2016, and just below 4% on average in 2017–19.
On the other side of the current account ledger, Eurozone firms will continue to feel the benefit of recovery in the advanced economies’ export markets (see Box 2 for our assumptions on the global economic environment) as well as a weaker euro. The sovereign-bond purchase program from the European Central Bank (ECB) has already had a substantial impact on the euro/dollar exchange rate, and this seems set to persist in the years ahead. We expect the euro to weaken to around US$1.10 by the end of 2015 and then to about US$1.05 by the end of 2016, before gradually appreciating back above US$1.10 by 2019 as the ECB completes its sovereign bond purchases and eventually starts to raise interest rates.
Nevertheless, with some emerging economies — in particular China — set for a managed slowdown in the coming years, demand for European capital goods will grow more modestly. As such, we expect to see export growth easing back from a peak of 4.2% in 2016 to 4.1% in 2017 and 3.6% a year in 2018–19.
Figure 3
€/US$ exchange rate
Source: Oxford Economics.
1.0
1.1
1.2
1.3
1.4
1.5
1.6
2005 2007 2009 2011 2013 2015 2017 2019
€/US$
Forecast
With import and export growth broadly in balance therefore, the Eurozone should continue to run a fairly stable current account surplus, of just above 2% of GDP through the forecast period. This contrasts with a current account broadly in balance through most of the last decade — a testimony to the rebalancing achieved in some of the peripherals that had previously run chronic current account deficits and had been reliant on external debt.
Fiscal squeeze should relent
Over the past couple of years, the burden of deficit reduction has started to shift from emergency spending cuts toward recovering government revenues. As the recovery continues, this should increasingly be the case, while on the expenditure side low government borrowing costs — a side-product of the ECB’s sovereign bond purchases — should help trim debt repayments. We expect this will save 0.1–0.2 percentage points of GDP through our forecast period in comparison with 2014.
17EY Eurozone Forecast June 2015
Eurozone rebalancing toward broad-based recovery
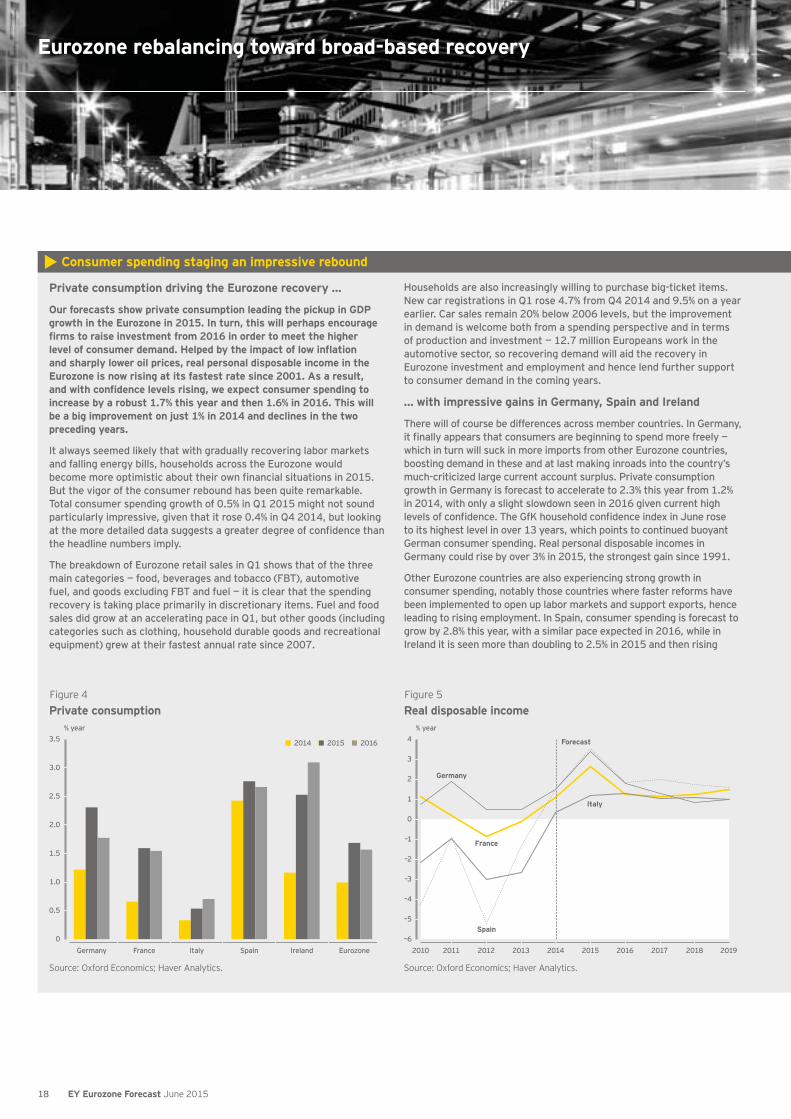
Private consumption driving the Eurozone recovery …
Our forecasts show private consumption leading the pickup in GDP growth in the Eurozone in 2015. In turn, this will perhaps encourage
and sharply lower oil prices, real personal disposable income in the Eurozone is now rising at its fastest rate since 2001. As a result,
increase by a robust 1.7% this year and then 1.6% in 2016. This will be a big improvement on just 1% in 2014 and declines in the two preceding years.
It always seemed likely that with gradually recovering labor markets and falling energy bills, households across the Eurozone would
But the vigor of the consumer rebound has been quite remarkable. Total consumer spending growth of 0.5% in Q1 2015 might not sound particularly impressive, given that it rose 0.4% in Q4 2014, but looking
the headline numbers imply.
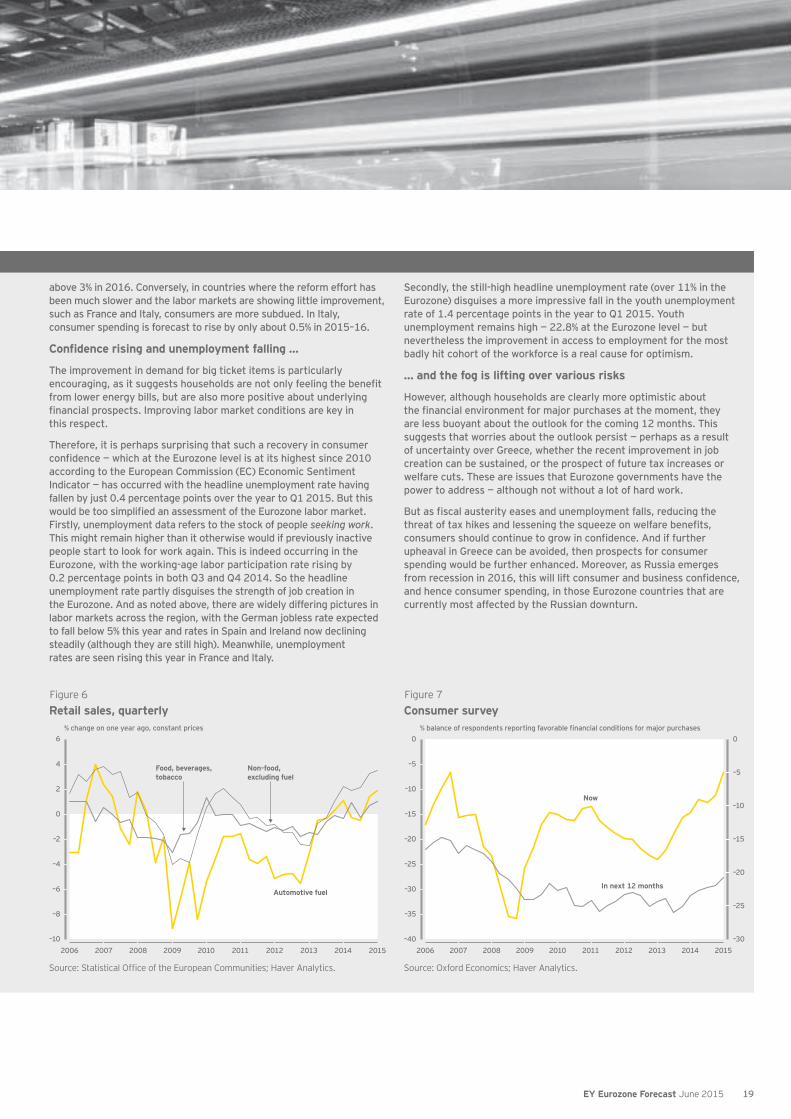
The breakdown of Eurozone retail sales in Q1 shows that of the three main categories — food, beverages and tobacco (FBT), automotive fuel, and goods excluding FBT and fuel — it is clear that the spending recovery is taking place primarily in discretionary items. Fuel and food sales did grow at an accelerating pace in Q1, but other goods (including categories such as clothing, household durable goods and recreational equipment) grew at their fastest annual rate since 2007.
Households are also increasingly willing to purchase big-ticket items. New car registrations in Q1 rose 4.7% from Q4 2014 and 9.5% on a year earlier. Car sales remain 20% below 2006 levels, but the improvement in demand is welcome both from a spending perspective and in terms of production and investment — 12.7 million Europeans work in the automotive sector, so recovering demand will aid the recovery in Eurozone investment and employment and hence lend further support to consumer demand in the coming years.
… with impressive gains in Germany, Spain and Ireland
There will of course be differences across member countries. In Germany,
which in turn will suck in more imports from other Eurozone countries, boosting demand in these and at last making inroads into the country’s much-criticized large current account surplus. Private consumption growth in Germany is forecast to accelerate to 2.3% this year from 1.2% in 2014, with only a slight slowdown seen in 2016 given current high
to its highest level in over 13 years, which points to continued buoyant German consumer spending. Real personal disposable incomes in Germany could rise by over 3% in 2015, the strongest gain since 1991.
Other Eurozone countries are also experiencing strong growth in consumer spending, notably those countries where faster reforms have been implemented to open up labor markets and support exports, hence leading to rising employment. In Spain, consumer spending is forecast to grow by 2.8% this year, with a similar pace expected in 2016, while in Ireland it is seen more than doubling to 2.5% in 2015 and then rising
Consumer spending staging an impressive rebound
Figure 4Private consumption
Source: Oxford Economics; Haver Analytics.
% year
2014 2015 2016
0
0.5
1.0
1.5
2.0
2.5
3.0
3.5
Germany France Italy Spain Ireland Eurozone
Figure 5
Source: Oxford Economics; Haver Analytics.
Real disposable income% year
–6
–5
–4
–3
–2
–1
0
1
2
3
4
2010 2011 2012 2013 2014 2015 2016 2017 2018 2019
Germany
Italy
Spain
France
Forecast
18 EY Eurozone Forecast June 2015
above 3% in 2016. Conversely, in countries where the reform effort has been much slower and the labor markets are showing little improvement, such as France and Italy, consumers are more subdued. In Italy, consumer spending is forecast to rise by only about 0.5% in 2015–16.
The improvement in demand for big ticket items is particularly
from lower energy bills, but are also more positive about underlying
this respect.
Therefore, it is perhaps surprising that such a recovery in consumer
according to the European Commission (EC) Economic Sentiment Indicator — has occurred with the headline unemployment rate having fallen by just 0.4 percentage points over the year to Q1 2015. But this
Firstly, unemployment data refers to the stock of people seeking work. This might remain higher than it otherwise would if previously inactive people start to look for work again. This is indeed occurring in the Eurozone, with the working-age labor participation rate rising by 0.2 percentage points in both Q3 and Q4 2014. So the headline unemployment rate partly disguises the strength of job creation in the Eurozone. And as noted above, there are widely differing pictures in labor markets across the region, with the German jobless rate expected to fall below 5% this year and rates in Spain and Ireland now declining steadily (although they are still high). Meanwhile, unemployment rates are seen rising this year in France and Italy.
Secondly, the still-high headline unemployment rate (over 11% in the Eurozone) disguises a more impressive fall in the youth unemployment rate of 1.4 percentage points in the year to Q1 2015. Youth unemployment remains high — 22.8% at the Eurozone level — but nevertheless the improvement in access to employment for the most badly hit cohort of the workforce is a real cause for optimism.
… and the fog is lifting over various risks
However, although households are clearly more optimistic about
are less buoyant about the outlook for the coming 12 months. This suggests that worries about the outlook persist — perhaps as a result of uncertainty over Greece, whether the recent improvement in job creation can be sustained, or the prospect of future tax increases or welfare cuts. These are issues that Eurozone governments have the power to address — although not without a lot of hard work.
upheaval in Greece can be avoided, then prospects for consumer spending would be further enhanced. Moreover, as Russia emerges
and hence consumer spending, in those Eurozone countries that are currently most affected by the Russian downturn.
Figure 6
Source: .
Retail sales, quarterly% change on one year ago, constant prices
–10
–8
–6
–4
–2
0
2
4
6
2006 2007 2008 2009 2010 2011 2012 2013 2014 2015
Automotive fuel
Non-food, excluding fuel
Food, beverages,tobacco
Figure 7Consumer survey
Source: Oxford Economics; Haver Analytics.
–30
–25
–20
–15
–10
–5
0
–40
–35
–30
–25
–20
–15
–10
–5
0
2006 2007 2008 2009 2010 2011 2012 2013 2014 2015
Now
In next 12 months
19EY Eurozone Forecast June 2015
Eurozone rebalancing toward broad-based recovery
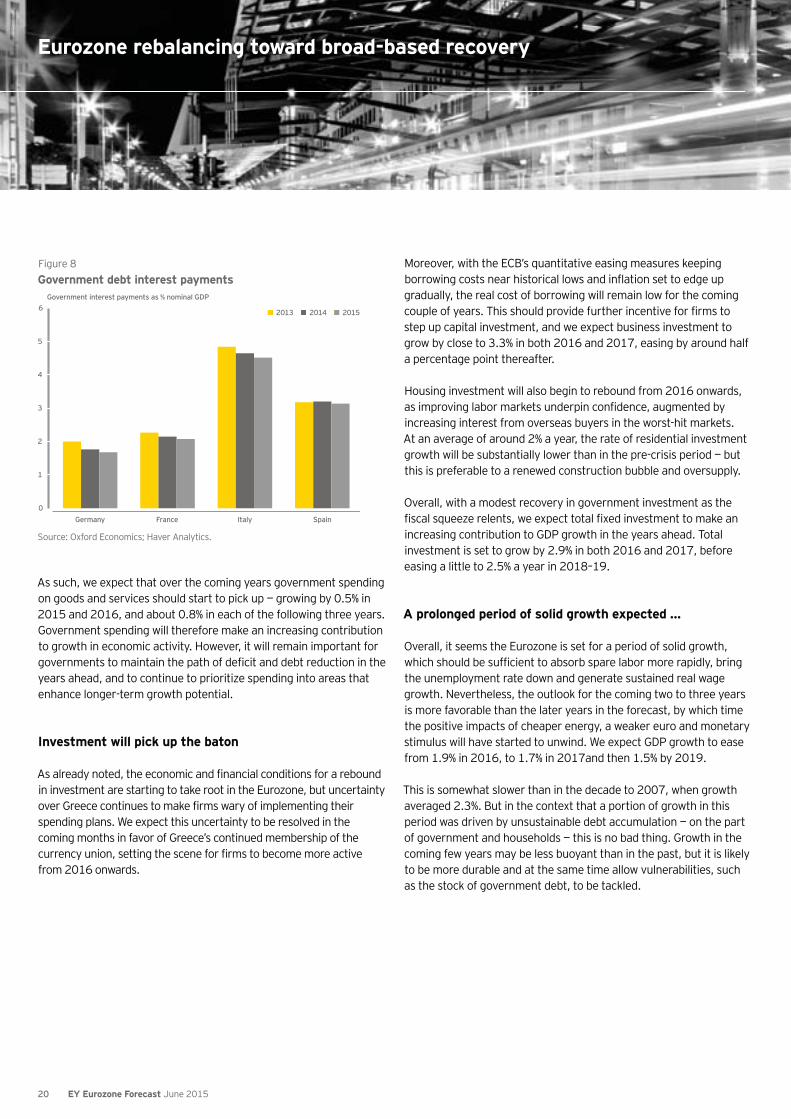
Figure 8
Source: Oxford Economics; Haver Analytics.
Government debt interest paymentsGovernment interest payments as % nominal GDP
0
1
2
3
4
5
6
Germany France Italy Spain
2013 2014 2015
As such, we expect that over the coming years government spending on goods and services should start to pick up — growing by 0.5% in 2015 and 2016, and about 0.8% in each of the following three years. Government spending will therefore make an increasing contribution to growth in economic activity. However, it will remain important for governments to maintain the path of deficit and debt reduction in the years ahead, and to continue to prioritize spending into areas that enhance longer-term growth potential.
Investment will pick up the baton
As already noted, the economic and financial conditions for a rebound in investment are starting to take root in the Eurozone, but uncertainty over Greece continues to make firms wary of implementing their spending plans. We expect this uncertainty to be resolved in the coming months in favor of Greece’s continued membership of the currency union, setting the scene for firms to become more active from 2016 onwards.
Moreover, with the ECB’s quantitative easing measures keeping borrowing costs near historical lows and inflation set to edge up gradually, the real cost of borrowing will remain low for the coming couple of years. This should provide further incentive for firms to step up capital investment, and we expect business investment to grow by close to 3.3% in both 2016 and 2017, easing by around half a percentage point thereafter.
Housing investment will also begin to rebound from 2016 onwards, as improving labor markets underpin confidence, augmented by increasing interest from overseas buyers in the worst-hit markets. At an average of around 2% a year, the rate of residential investment growth will be substantially lower than in the pre-crisis period — but this is preferable to a renewed construction bubble and oversupply.
Overall, with a modest recovery in government investment as the fiscal squeeze relents, we expect total fixed investment to make an increasing contribution to GDP growth in the years ahead. Total investment is set to grow by 2.9% in both 2016 and 2017, before easing a little to 2.5% a year in 2018–19.
Overall, it seems the Eurozone is set for a period of solid growth, which should be sufficient to absorb spare labor more rapidly, bring the unemployment rate down and generate sustained real wage growth. Nevertheless, the outlook for the coming two to three years is more favorable than the later years in the forecast, by which time the positive impacts of cheaper energy, a weaker euro and monetary stimulus will have started to unwind. We expect GDP growth to ease from 1.9% in 2016, to 1.7% in 2017and then 1.5% by 2019.
This is somewhat slower than in the decade to 2007, when growth averaged 2.3%. But in the context that a portion of growth in this period was driven by unsustainable debt accumulation — on the part of government and households — this is no bad thing. Growth in the coming few years may be less buoyant than in the past, but it is likely to be more durable and at the same time allow vulnerabilities, such as the stock of government debt, to be tackled.
20 EY Eurozone Forecast June 2015
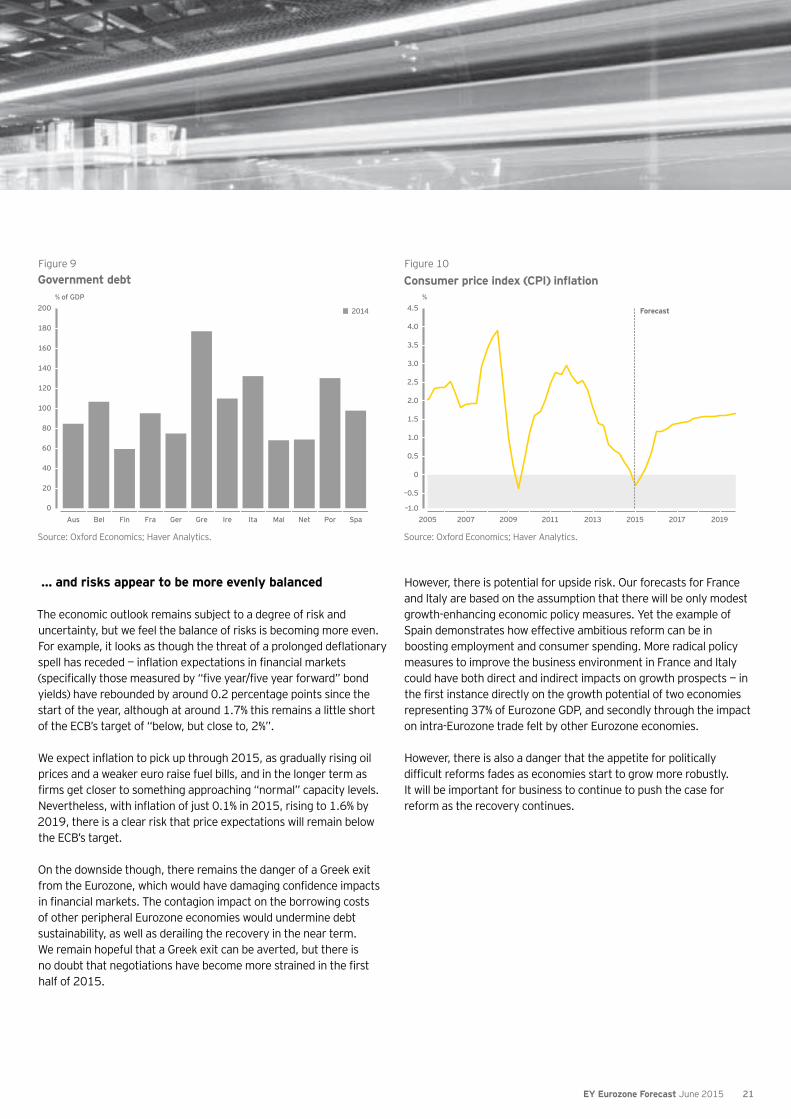
Figure 9
Source: Oxford Economics; Haver Analytics.
Government debt% of GDP
0
20
40
60
80
100
120
140
160
180
200
Aus Bel Fin Fra Ger Gre Ire Ita Mal Net Por Spa
2014
… and risks appear to be more evenly balanced
The economic outlook remains subject to a degree of risk and uncertainty, but we feel the balance of risks is becoming more even. For example, it looks as though the threat of a prolonged deflationary spell has receded — inflation expectations in financial markets (specifically those measured by “five year/five year forward” bond yields) have rebounded by around 0.2 percentage points since the start of the year, although at around 1.7% this remains a little short of the ECB’s target of “below, but close to, 2%”.
We expect inflation to pick up through 2015, as gradually rising oil prices and a weaker euro raise fuel bills, and in the longer term as firms get closer to something approaching “normal” capacity levels. Nevertheless, with inflation of just 0.1% in 2015, rising to 1.6% by 2019, there is a clear risk that price expectations will remain below the ECB’s target.
On the downside though, there remains the danger of a Greek exit from the Eurozone, which would have damaging confidence impacts in financial markets. The contagion impact on the borrowing costs of other peripheral Eurozone economies would undermine debt sustainability, as well as derailing the recovery in the near term. We remain hopeful that a Greek exit can be averted, but there is no doubt that negotiations have become more strained in the first half of 2015.
Figure 10
Source: Oxford Economics; Haver Analytics.
%
–1.0
–0.5
0
0.5
1.0
1.5
2.0
2.5
3.0
3.5
4.0
4.5
2005 2007 2009 2011 2013 2015 2017 2019
However, there is potential for upside risk. Our forecasts for France and Italy are based on the assumption that there will be only modest growth-enhancing economic policy measures. Yet the example of Spain demonstrates how effective ambitious reform can be in boosting employment and consumer spending. More radical policy measures to improve the business environment in France and Italy could have both direct and indirect impacts on growth prospects — in the first instance directly on the growth potential of two economies representing 37% of Eurozone GDP, and secondly through the impact on intra-Eurozone trade felt by other Eurozone economies.
However, there is also a danger that the appetite for politically difficult reforms fades as economies start to grow more robustly. It will be important for business to continue to push the case for reform as the recovery continues.
21EY Eurozone Forecast June 2015
Eurozone rebalancing toward broad-based recovery
The global economy
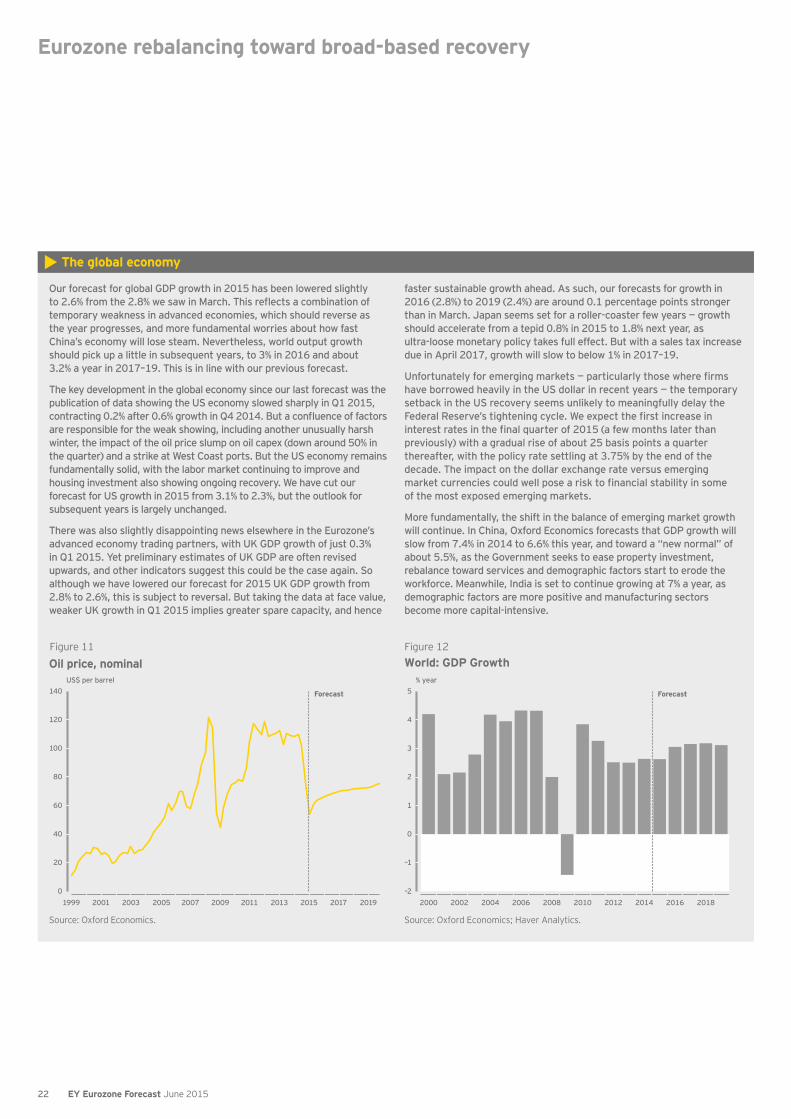
Our forecast for global GDP growth in 2015 has been lowered slightly
temporary weakness in advanced economies, which should reverse as the year progresses, and more fundamental worries about how fast China’s economy will lose steam. Nevertheless, world output growth should pick up a little in subsequent years, to 3% in 2016 and about 3.2% a year in 2017–19. This is in line with our previous forecast.
The key development in the global economy since our last forecast was the publication of data showing the US economy slowed sharply in Q1 2015,
are responsible for the weak showing, including another unusually harsh winter, the impact of the oil price slump on oil capex (down around 50% in the quarter) and a strike at West Coast ports. But the US economy remains fundamentally solid, with the labor market continuing to improve and housing investment also showing ongoing recovery. We have cut our forecast for US growth in 2015 from 3.1% to 2.3%, but the outlook for subsequent years is largely unchanged.
There was also slightly disappointing news elsewhere in the Eurozone’s advanced economy trading partners, with UK GDP growth of just 0.3% in Q1 2015. Yet preliminary estimates of UK GDP are often revised upwards, and other indicators suggest this could be the case again. So although we have lowered our forecast for 2015 UK GDP growth from 2.8% to 2.6%, this is subject to reversal. But taking the data at face value, weaker UK growth in Q1 2015 implies greater spare capacity, and hence
faster sustainable growth ahead. As such, our forecasts for growth in 2016 (2.8%) to 2019 (2.4%) are around 0.1 percentage points stronger than in March. Japan seems set for a roller-coaster few years — growth should accelerate from a tepid 0.8% in 2015 to 1.8% next year, as ultra-loose monetary policy takes full effect. But with a sales tax increase due in April 2017, growth will slow to below 1% in 2017–19.
have borrowed heavily in the US dollar in recent years — the temporary setback in the US recovery seems unlikely to meaningfully delay the
previously) with a gradual rise of about 25 basis points a quarter thereafter, with the policy rate settling at 3.75% by the end of the decade. The impact on the dollar exchange rate versus emerging
of the most exposed emerging markets.
More fundamentally, the shift in the balance of emerging market growth will continue. In China, Oxford Economics forecasts that GDP growth will slow from 7.4% in 2014 to 6.6% this year, and toward a “new normal” of about 5.5%, as the Government seeks to ease property investment, rebalance toward services and demographic factors start to erode the workforce. Meanwhile, India is set to continue growing at 7% a year, as demographic factors are more positive and manufacturing sectors become more capital-intensive.
Figure 11
Oil price, nominal
Source: Oxford Economics.
US$ per barrel
0
20
40
60
80
100
120
140
1999 2001 2003 2005 2007 2009 2011 2013 2015 2017 2019
Forecast
Figure 12
Source: Oxford Economics; Haver Analytics.
World: GDP Growth% year
–2
–1
0
1
2
3
4
5
2000 2002 2004 2006 2008 2010 2012 2014 2016 2018
Forecast
22 EY Eurozone Forecast June 2015

23EY Eurozone Forecast June 2015

Forecast for Eurozone countries
Austria
Belgium
Cyprus
Estonia
Finland
France
Germany
Greece
Ireland
Italy
Latvia
Lithuania
Luxembourg
Malta
Netherlands
Portugal
Slovakia
Slovenia
Spain

To find out more please visit ey.com/eurozone.
19 Eurozone countries
Please visit our Eurozone website for access to additional information on the EY Eurozone Forecast, the 19 individual country forecasts and additional perspectives. The site contains the latest version of our reports and gives you the opportunity to compare data from across the Eurozone member states.
25EY Eurozone Forecast June 2015
GDP growth
2015
0.7%
Austria
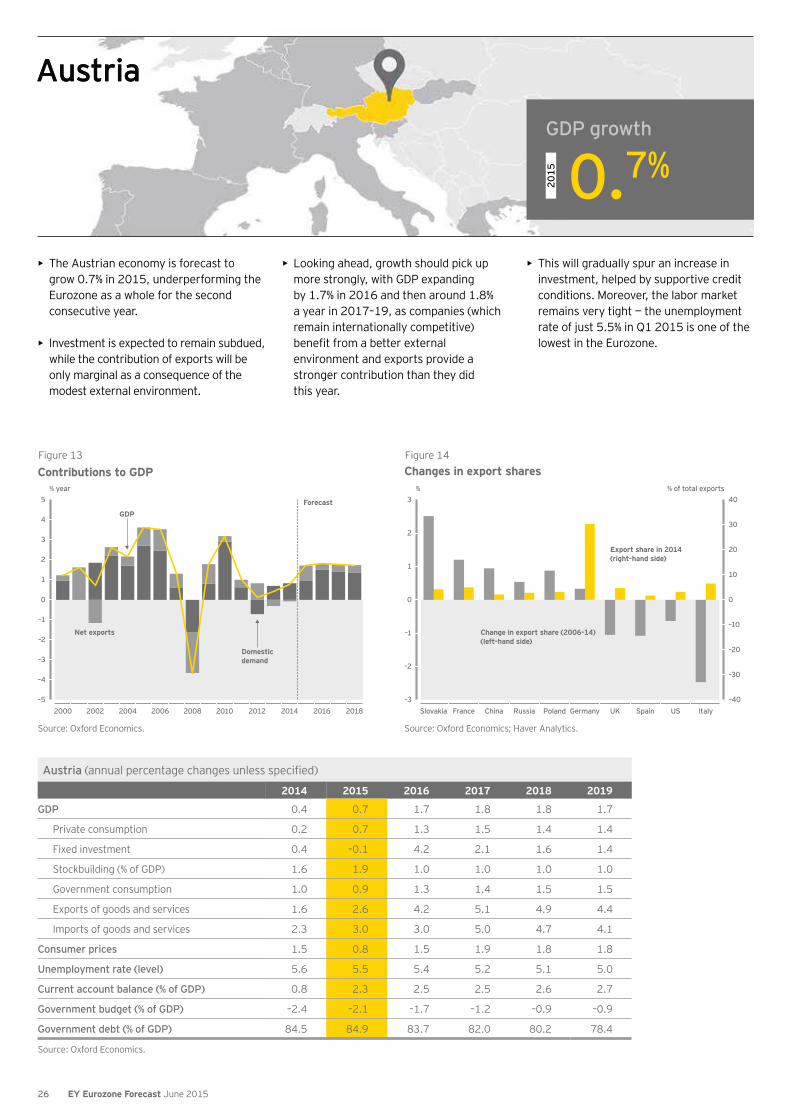
• The Austrian economy is forecast to grow 0.7% in 2015, underperforming the Eurozone as a whole for the second consecutive year.
• Investment is expected to remain subdued, while the contribution of exports will be only marginal as a consequence of the modest external environment.
• Looking ahead, growth should pick up more strongly, with GDP expanding by 1.7% in 2016 and then around 1.8% a year in 2017–19, as companies (which remain internationally competitive)
environment and exports provide a stronger contribution than they did this year.
• This will gradually spur an increase in investment, helped by supportive credit conditions. Moreover, the labor market remains very tight — the unemployment rate of just 5.5% in Q1 2015 is one of the lowest in the Eurozone.
Austria (annual percentage changes unless specified)
2014 2015 2016 2017 2018 2019
GDP 0.4 0.7 1.7 1.8 1.8 1.7
Private consumption 0.2 0.7 1.3 1.5 1.4 1.4
Fixed investment 0.4 –0.1 4.2 2.1 1.6 1.4
Stockbuilding (% of GDP) 1.6 1.9 1.0 1.0 1.0 1.0
Government consumption 1.0 0.9 1.3 1.4 1.5 1.5
Exports of goods and services 1.6 2.6 4.2 5.1 4.9 4.4
Imports of goods and services 2.3 3.0 3.0 5.0 4.7 4.1
Consumer prices 1.5 0.8 1.5 1.9 1.8 1.8
Unemployment rate (level) 5.6 5.5 5.4 5.2 5.1 5.0
Current account balance (% of GDP) 0.8 2.3 2.5 2.5 2.6 2.7
Government budget (% of GDP) –2.4 –2.1 –1.7 –1.2 –0.9 –0.9
Government debt (% of GDP) 84.5 84.9 83.7 82.0 80.2 78.4
Source: Oxford Economics.
Figure 13
Source: Oxford Economics.
Contributions to GDP% year
–5
–4
–3
–2
–1
0
1
2
3
4
5
2000 2002 2004 2006 2008 2010 2012 2014 2016 2018
GDP
Net exports
Forecast
Domesticdemand
Figure 14Changes in export shares
Source: Oxford Economics; Haver Analytics.
% of total exports%
ItalyUSSpainUKGermanyPolandRussiaChinaFranceSlovakia–40
–30
–20
–10
0
10
20
30
40
Change in export share (2006–14)(left-hand side)
–3
–2
–1
0
1
2
3
Export share in 2014(right-hand side)
Austria
26 EY Eurozone Forecast June 2015
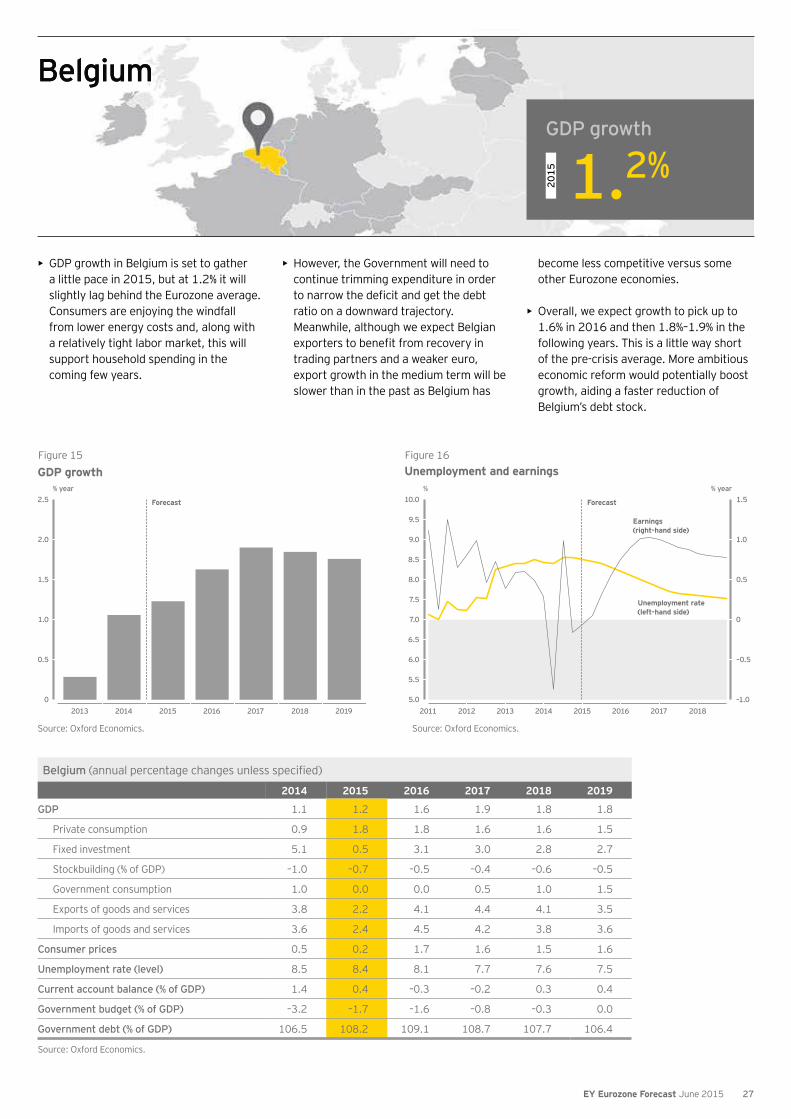
• GDP growth in Belgium is set to gather a little pace in 2015, but at 1.2% it will slightly lag behind the Eurozone average. Consumers are enjoying the windfall from lower energy costs and, along with a relatively tight labor market, this will support household spending in the coming few years.
• However, the Government will need to continue trimming expenditure in order
ratio on a downward trajectory. Meanwhile, although we expect Belgian
trading partners and a weaker euro, export growth in the medium term will be slower than in the past as Belgium has
become less competitive versus some other Eurozone economies.
• Overall, we expect growth to pick up to 1.6% in 2016 and then 1.8%–1.9% in the following years. This is a little way short of the pre-crisis average. More ambitious economic reform would potentially boost growth, aiding a faster reduction of Belgium’s debt stock.
Belgium (annual percentage changes unless specified)
2014 2015 2016 2017 2018 2019
GDP 1.1 1.2 1.6 1.9 1.8 1.8
Private consumption 0.9 1.8 1.8 1.6 1.6 1.5
Fixed investment 5.1 0.5 3.1 3.0 2.8 2.7
Stockbuilding (% of GDP) –1.0 –0.7 –0.5 –0.4 –0.6 –0.5
Government consumption 1.0 0.0 0.0 0.5 1.0 1.5
Exports of goods and services 3.8 2.2 4.1 4.4 4.1 3.5
Imports of goods and services 3.6 2.4 4.5 4.2 3.8 3.6
Consumer prices 0.5 0.2 1.7 1.6 1.5 1.6
Unemployment rate (level) 8.5 8.4 8.1 7.7 7.6 7.5
Current account balance (% of GDP) 1.4 0.4 –0.3 –0.2 0.3 0.4
Government budget (% of GDP) –3.2 –1.7 –1.6 –0.8 –0.3 0.0
Government debt (% of GDP) 106.5 108.2 109.1 108.7 107.7 106.4
Source: Oxford Economics.
Figure 15
GDP growth
Source: Oxford Economics.
% year
0
0.5
1.0
1.5
2.0
2.5
2013 2014 2015 2016 2017 2018 2019
Forecast
Figure 16Unemployment and earnings
Source: Oxford Economics.
% year%
–1.0
–0.5
0
0.5
1.0
1.5
5.0
5.5
6.0
6.5
7.0
7.5
8.0
8.5
9.0
9.5
10.0
2011 2012 2013 2014 2015 2016 2017 2018
Unemployment rate(left-hand side)
Forecast
Earnings(right-hand side)
GDP growth
2015
1.2%
BelgiumBelgium
27EY Eurozone Forecast June 2015
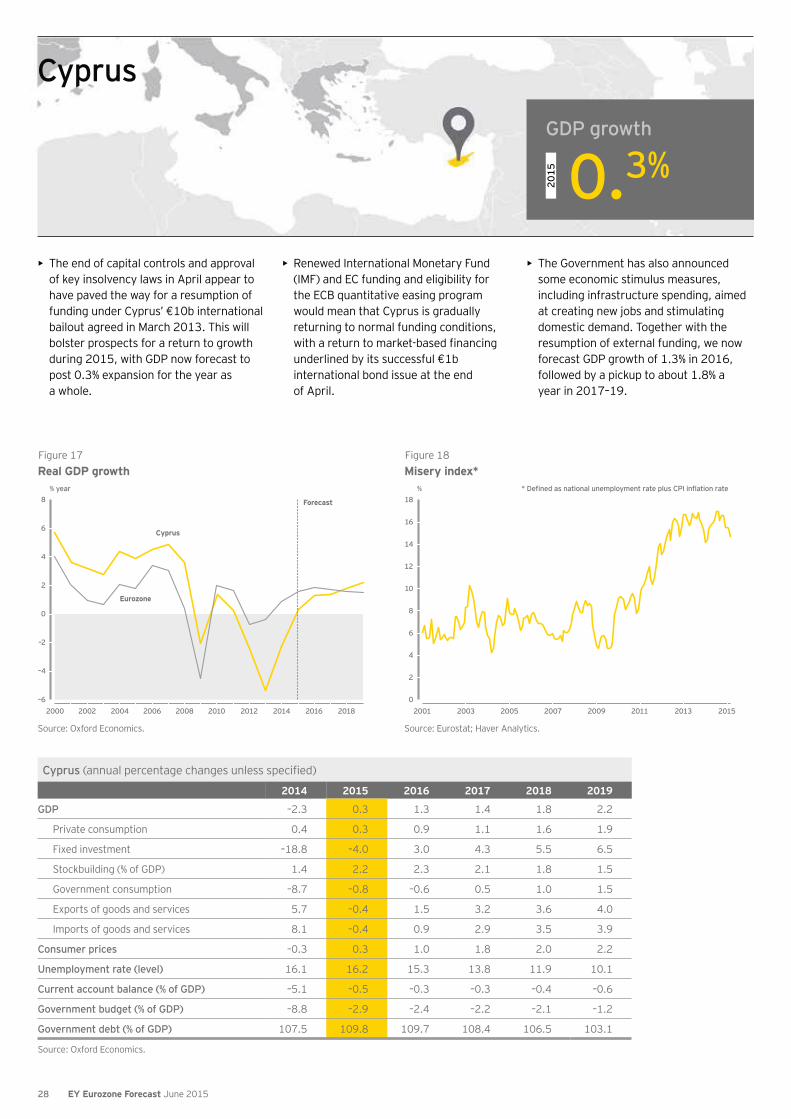
• The end of capital controls and approval of key insolvency laws in April appear to have paved the way for a resumption of funding under Cyprus’ €10b international bailout agreed in March 2013. This will bolster prospects for a return to growth during 2015, with GDP now forecast to post 0.3% expansion for the year as a whole.
• Renewed International Monetary Fund (IMF) and EC funding and eligibility for the ECB quantitative easing program would mean that Cyprus is gradually returning to normal funding conditions,
underlined by its successful €1b international bond issue at the end of April.
• The Government has also announced some economic stimulus measures, including infrastructure spending, aimed at creating new jobs and stimulating domestic demand. Together with the resumption of external funding, we now forecast GDP growth of 1.3% in 2016, followed by a pickup to about 1.8% a year in 2017–19.
Cyprus (annual percentage changes unless specified)
2014 2015 2016 2017 2018 2019
GDP –2.3 0.3 1.3 1.4 1.8 2.2
Private consumption 0.4 0.3 0.9 1.1 1.6 1.9
Fixed investment –18.8 –4.0 3.0 4.3 5.5 6.5
Stockbuilding (% of GDP) 1.4 2.2 2.3 2.1 1.8 1.5
Government consumption –8.7 –0.8 –0.6 0.5 1.0 1.5
Exports of goods and services 5.7 –0.4 1.5 3.2 3.6 4.0
Imports of goods and services 8.1 –0.4 0.9 2.9 3.5 3.9
Consumer prices –0.3 0.3 1.0 1.8 2.0 2.2
Unemployment rate (level) 16.1 16.2 15.3 13.8 11.9 10.1
Current account balance (% of GDP) –5.1 –0.5 –0.3 –0.3 –0.4 –0.6
Government budget (% of GDP) –8.8 –2.9 –2.4 –2.2 –2.1 –1.2
Government debt (% of GDP) 107.5 109.8 109.7 108.4 106.5 103.1
Source: Oxford Economics.
Figure 17
Source: Oxford Economics.
Real GDP growth% year
–6
–4
–2
0
2
4
6
8
2000 2002 2004 2006 2008 2010 2012 2014 2016 2018
Eurozone
Cyprus
Forecast
Figure 18
Source: Eurostat; Haver Analytics.
Misery index*%
0
2
4
6
8
10
12
14
16
18
2001 2003 2005 2007 2009 2011 2013 2015
GDP growth
2015
0.3%
Cyprus
28 EY Eurozone Forecast June 2015
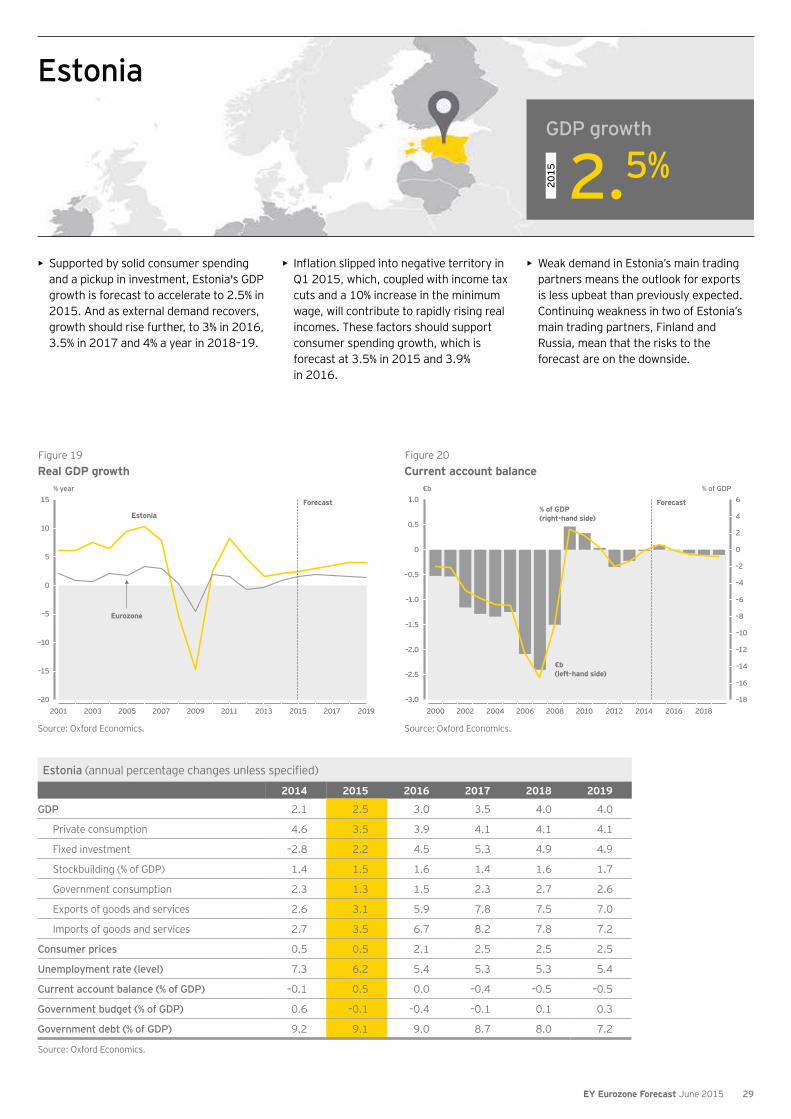
• Supported by solid consumer spending and a pickup in investment, Estonia's GDP growth is forecast to accelerate to 2.5% in 2015. And as external demand recovers, growth should rise further, to 3% in 2016, 3.5% in 2017 and 4% a year in 2018–19.
• Q1 2015, which, coupled with income tax cuts and a 10% increase in the minimum wage, will contribute to rapidly rising real incomes. These factors should support consumer spending growth, which is forecast at 3.5% in 2015 and 3.9% in 2016.
• Weak demand in Estonia’s main trading partners means the outlook for exports is less upbeat than previously expected. Continuing weakness in two of Estonia’s main trading partners, Finland and Russia, mean that the risks to the forecast are on the downside.
Estonia (annual percentage changes unless specified)
2014 2015 2016 2017 2018 2019
GDP 2.1 2.5 3.0 3.5 4.0 4.0
Private consumption 4.6 3.5 3.9 4.1 4.1 4.1
Fixed investment –2.8 2.2 4.5 5.3 4.9 4.9
Stockbuilding (% of GDP) 1.4 1.5 1.6 1.4 1.6 1.7
Government consumption 2.3 1.3 1.5 2.3 2.7 2.6
Exports of goods and services 2.6 3.1 5.9 7.8 7.5 7.0
Imports of goods and services 2.7 3.5 6.7 8.2 7.8 7.2
Consumer prices 0.5 0.5 2.1 2.5 2.5 2.5
Unemployment rate (level) 7.3 6.2 5.4 5.3 5.3 5.4
Current account balance (% of GDP) –0.1 0.5 0.0 –0.4 –0.5 –0.5
Government budget (% of GDP) 0.6 –0.1 –0.4 –0.1 0.1 0.3
Government debt (% of GDP) 9.2 9.1 9.0 8.7 8.0 7.2
Source: Oxford Economics.
Figure 19
Source: Oxford Economics.
Real GDP growth% year
–20
–15
–10
–5
0
5
10
15
2001 2003 2005 2007 2009 2011 2013 2015 2017 2019
Eurozone
Estonia
Forecast
Figure 20Current account balance
Source: Oxford Economics.
€b % of GDP
Forecast
–18
–16
–14
–12
–10
–8
–6
–4
–2
0
2
4
6
–3.0
–2.5
–2.0
–1.5
–1.0
–0.5
0
0.5
1.0
2000 2002 2004 2006 2008 2010 2012 2014 2016 2018
€b(left-hand side)
% of GDP (right-hand side)
GDP growth
2015
2.5%
Estonia
29EY Eurozone Forecast June 2015
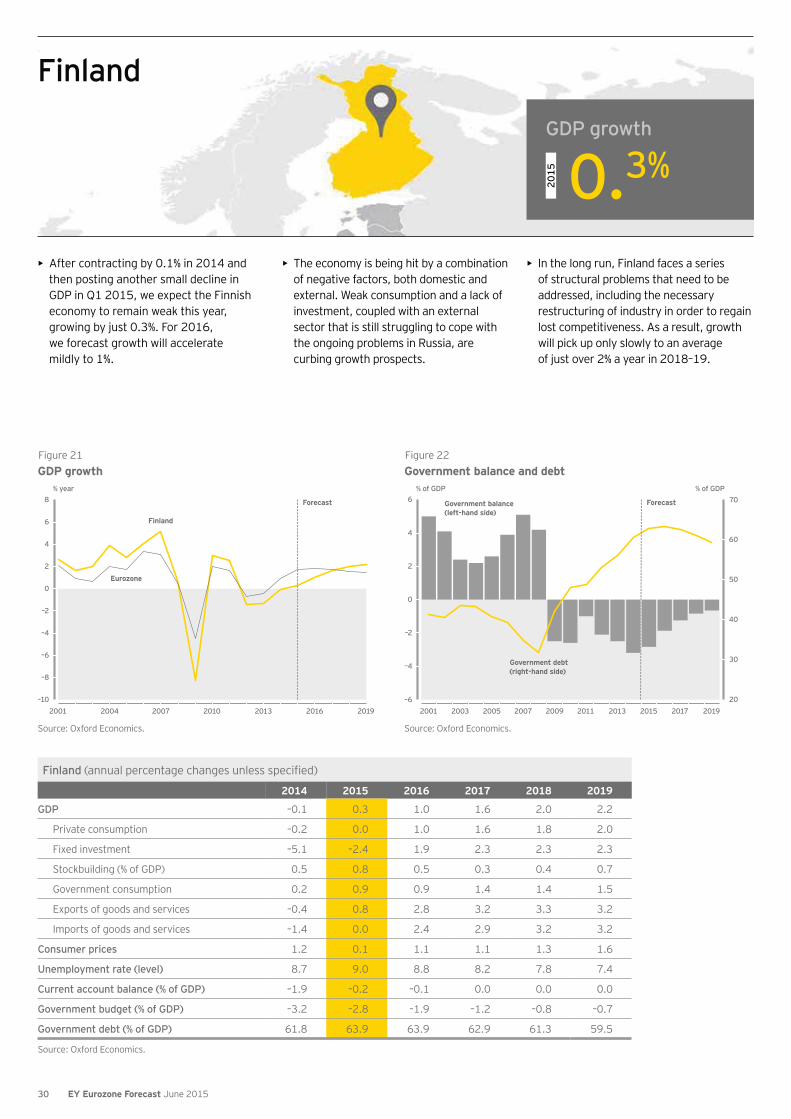
Finland (annual percentage changes unless specified)
2014 2015 2016 2017 2018 2019
GDP –0.1 0.3 1.0 1.6 2.0 2.2
Private consumption –0.2 0.0 1.0 1.6 1.8 2.0
Fixed investment –5.1 –2.4 1.9 2.3 2.3 2.3
Stockbuilding (% of GDP) 0.5 0.8 0.5 0.3 0.4 0.7
Government consumption 0.2 0.9 0.9 1.4 1.4 1.5
Exports of goods and services –0.4 0.8 2.8 3.2 3.3 3.2
Imports of goods and services –1.4 0.0 2.4 2.9 3.2 3.2
Consumer prices 1.2 0.1 1.1 1.1 1.3 1.6
Unemployment rate (level) 8.7 9.0 8.8 8.2 7.8 7.4
Current account balance (% of GDP) –1.9 –0.2 –0.1 0.0 0.0 0.0
Government budget (% of GDP) –3.2 –2.8 –1.9 –1.2 –0.8 –0.7
Government debt (% of GDP) 61.8 63.9 63.9 62.9 61.3 59.5
Source: Oxford Economics.
• After contracting by 0.1% in 2014 and then posting another small decline in GDP in Q1 2015, we expect the Finnish economy to remain weak this year, growing by just 0.3%. For 2016, we forecast growth will accelerate mildly to 1%.
• The economy is being hit by a combination of negative factors, both domestic and external. Weak consumption and a lack of investment, coupled with an external sector that is still struggling to cope with the ongoing problems in Russia, are curbing growth prospects.
• In the long run, Finland faces a series of structural problems that need to be addressed, including the necessary restructuring of industry in order to regain lost competitiveness. As a result, growth will pick up only slowly to an average of just over 2% a year in 2018–19.
Figure 21
Source: Oxford Economics.
GDP growth% year
–10
–8
–6
–4
–2
0
2
4
6
8
2001 2004 2007 2010 2013 2016 2019
Eurozone
Finland
Forecast
Figure 22
% of GDP % of GDP
20
30
40
50
60
70
–6
–4
–2
0
2
4
6
2001 2003 2005 2007 2009 2011 2013 2015 2017 2019
Government balance (left-hand side)
Government debt(right-hand side)
Forecast
Government balance and debt
Source: Oxford Economics.
GDP growth
2015
0.3%
Finland
30 EY Eurozone Forecast June 2015
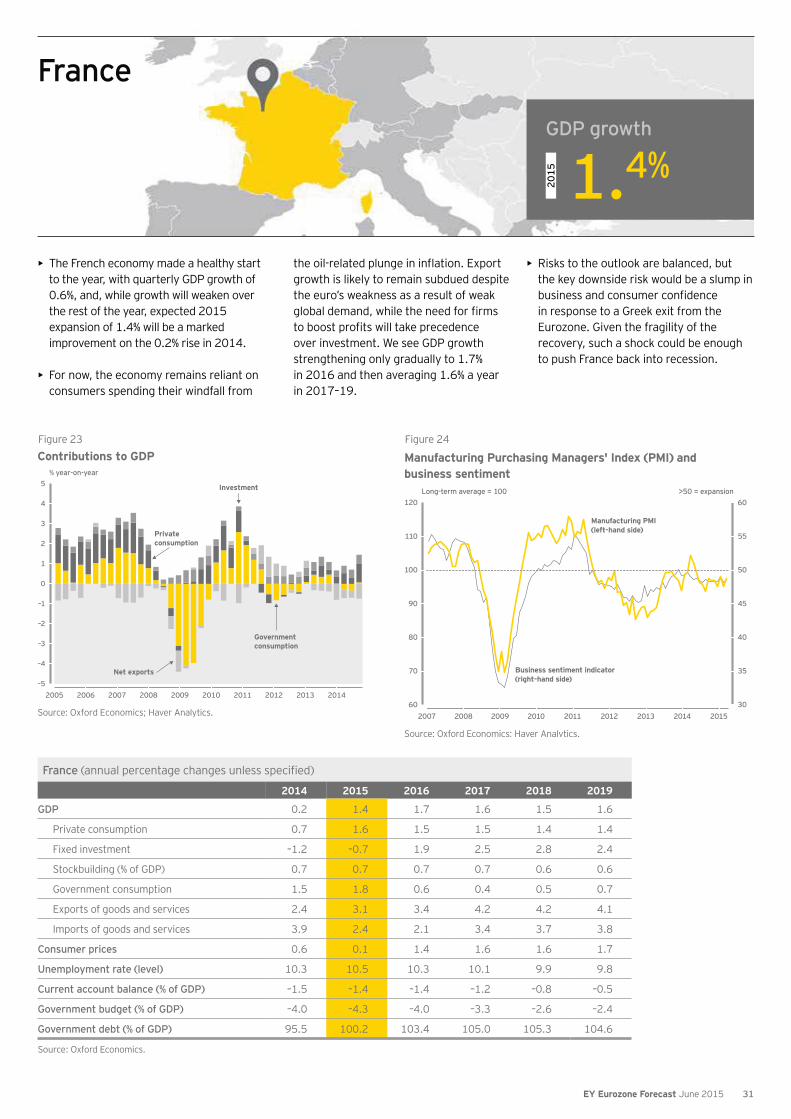
France (annual percentage changes unless specified)
2014 2015 2016 2017 2018 2019
GDP 0.2 1.4 1.7 1.6 1.5 1.6
Private consumption 0.7 1.6 1.5 1.5 1.4 1.4
Fixed investment –1.2 –0.7 1.9 2.5 2.8 2.4
Stockbuilding (% of GDP) 0.7 0.7 0.7 0.7 0.6 0.6
Government consumption 1.5 1.8 0.6 0.4 0.5 0.7
Exports of goods and services 2.4 3.1 3.4 4.2 4.2 4.1
Imports of goods and services 3.9 2.4 2.1 3.4 3.7 3.8
Consumer prices 0.6 0.1 1.4 1.6 1.6 1.7
Unemployment rate (level) 10.3 10.5 10.3 10.1 9.9 9.8
Current account balance (% of GDP) –1.5 –1.4 –1.4 –1.2 –0.8 –0.5
Government budget (% of GDP) –4.0 –4.3 –4.0 –3.3 –2.6 –2.4
Government debt (% of GDP) 95.5 100.2 103.4 105.0 105.3 104.6
Source: Oxford Economics.
• The French economy made a healthy start to the year, with quarterly GDP growth of 0.6%, and, while growth will weaken over the rest of the year, expected 2015 expansion of 1.4% will be a marked improvement on the 0.2% rise in 2014.
• For now, the economy remains reliant on consumers spending their windfall from
growth is likely to remain subdued despite the euro’s weakness as a result of weak
over investment. We see GDP growth strengthening only gradually to 1.7% in 2016 and then averaging 1.6% a year in 2017–19.
• Risks to the outlook are balanced, but the key downside risk would be a slump in
in response to a Greek exit from the Eurozone. Given the fragility of the recovery, such a shock could be enough to push France back into recession.
Figure 23
Contributions to GDP
Source: Oxford Economics; Haver Analytics.
% year-on-year
2005 2006 2007 2008 2009 2010 2011 2012 2013 2014–5
–4
–3
–2
–1
0
1
2
3
4
5
Net exports
Private consumption
Government consumption
Investment
Figure 24
Manufacturing Purchasing Managers' Index (PMI) andbusiness sentiment
Source: Oxford Economics; Haver Analytics.
>50 = expansionLong-term average = 100
30
35
40
45
50
55
60
60
70
80
90
100
110
120
2007 2008 2009 2010 2011 2012 2013 2014 2015
Manufacturing PMI (left-hand side)
Business sentiment indicator(right-hand side)
GDP growth
2015
1.4%
France
31EY Eurozone Forecast June 2015
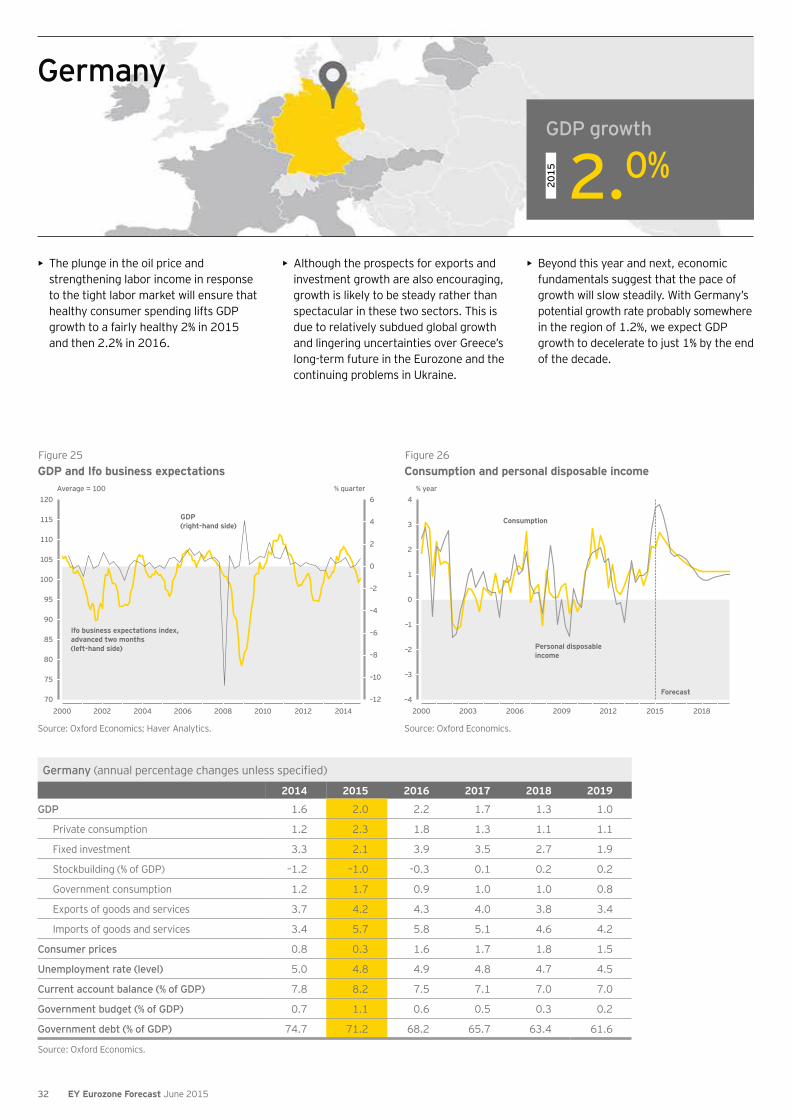
Germany (annual percentage changes unless specified)
2014 2015 2016 2017 2018 2019
GDP 1.6 2.0 2.2 1.7 1.3 1.0
Private consumption 1.2 2.3 1.8 1.3 1.1 1.1
Fixed investment 3.3 2.1 3.9 3.5 2.7 1.9
Stockbuilding (% of GDP) –1.2 –1.0 –0.3 0.1 0.2 0.2
Government consumption 1.2 1.7 0.9 1.0 1.0 0.8
Exports of goods and services 3.7 4.2 4.3 4.0 3.8 3.4
Imports of goods and services 3.4 5.7 5.8 5.1 4.6 4.2
Consumer prices 0.8 0.3 1.6 1.7 1.8 1.5
Unemployment rate (level) 5.0 4.8 4.9 4.8 4.7 4.5
Current account balance (% of GDP) 7.8 8.2 7.5 7.1 7.0 7.0
Government budget (% of GDP) 0.7 1.1 0.6 0.5 0.3 0.2
Government debt (% of GDP) 74.7 71.2 68.2 65.7 63.4 61.6
Source: Oxford Economics.
• The plunge in the oil price and strengthening labor income in response to the tight labor market will ensure that healthy consumer spending lifts GDP growth to a fairly healthy 2% in 2015 and then 2.2% in 2016.
• Although the prospects for exports and investment growth are also encouraging, growth is likely to be steady rather than spectacular in these two sectors. This is due to relatively subdued global growth and lingering uncertainties over Greece’s long-term future in the Eurozone and the continuing problems in Ukraine.
• Beyond this year and next, economic fundamentals suggest that the pace of growth will slow steadily. With Germany’s potential growth rate probably somewhere in the region of 1.2%, we expect GDP growth to decelerate to just 1% by the end of the decade.
Figure 25
Source: Oxford Economics; Haver Analytics.
GDP and Ifo business expectationsAverage = 100 % quarter
–12
–10
–8
–6
–4
–2
0
2
4
6
70
75
80
85
90
95
100
105
110
115
120
2000 2002 2004 2006 2008 2010 2012 2014
GDP (right-hand side)
Ifo business expectations index, advanced two months (left-hand side)
Figure 26
Source: Oxford Economics.
Consumption and personal disposable income% year
–4
–3
–2
–1
0
1
2
3
4
2000 2003 2006 2009 2012 2015 2018
Personal disposable income
Consumption
Forecast
GDP growth
2015
2.0%
Germany
32 EY Eurozone Forecast June 2015
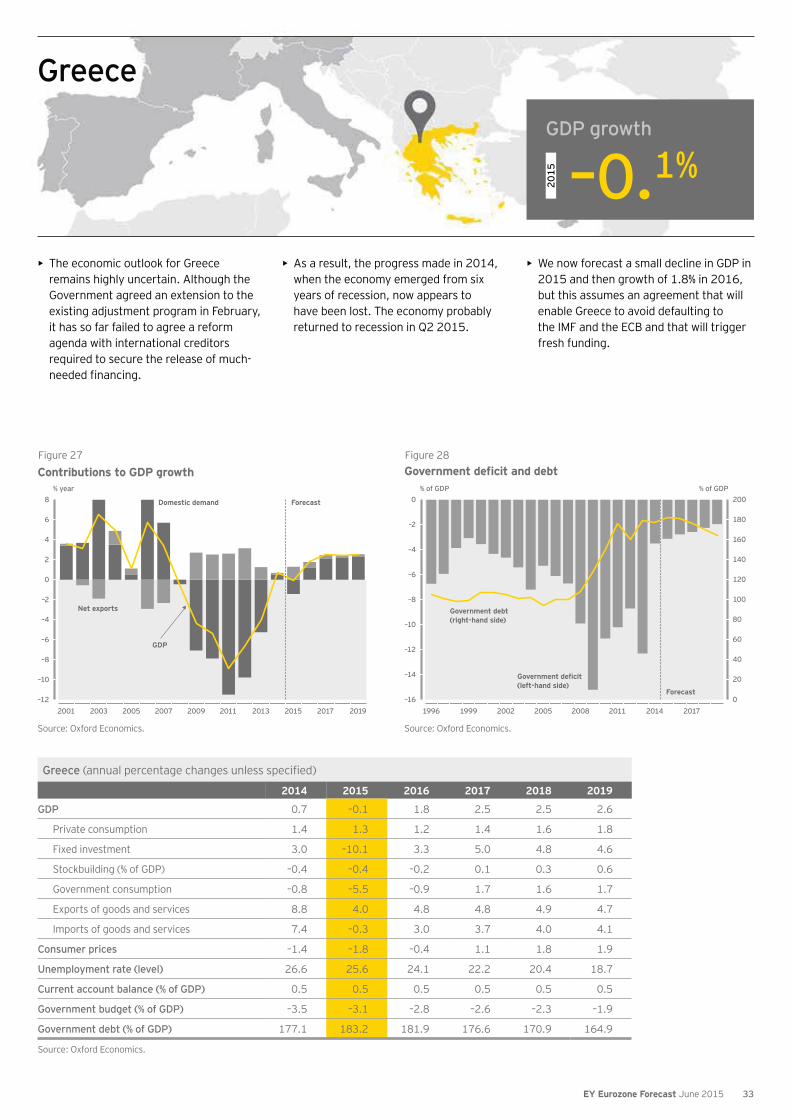
Greece (annual percentage changes unless specified)
2014 2015 2016 2017 2018 2019
GDP 0.7 –0.1 1.8 2.5 2.5 2.6
Private consumption 1.4 1.3 1.2 1.4 1.6 1.8
Fixed investment 3.0 –10.1 3.3 5.0 4.8 4.6
Stockbuilding (% of GDP) –0.4 –0.4 –0.2 0.1 0.3 0.6
Government consumption –0.8 –5.5 –0.9 1.7 1.6 1.7
Exports of goods and services 8.8 4.0 4.8 4.8 4.9 4.7
Imports of goods and services 7.4 –0.3 3.0 3.7 4.0 4.1
Consumer prices –1.4 –1.8 –0.4 1.1 1.8 1.9
Unemployment rate (level) 26.6 25.6 24.1 22.2 20.4 18.7
Current account balance (% of GDP) 0.5 0.5 0.5 0.5 0.5 0.5
Government budget (% of GDP) –3.5 –3.1 –2.8 –2.6 –2.3 –1.9
Government debt (% of GDP) 177.1 183.2 181.9 176.6 170.9 164.9
Source: Oxford Economics.
• The economic outlook for Greece remains highly uncertain. Although the Government agreed an extension to the existing adjustment program in February, it has so far failed to agree a reform agenda with international creditors required to secure the release of much-
• As a result, the progress made in 2014, when the economy emerged from six years of recession, now appears to have been lost. The economy probably returned to recession in Q2 2015.
• We now forecast a small decline in GDP in 2015 and then growth of 1.8% in 2016, but this assumes an agreement that will enable Greece to avoid defaulting to the IMF and the ECB and that will trigger fresh funding.
Figure 27
Contributions to GDP growth
Source: Oxford Economics.
% year
–12
–10
–8
–6
–4
–2
0
2
4
6
8
2001 2003 2005 2007 2009 2011 2013 2015 2017 2019
GDP
Net exports
Domestic demand Forecast
Figure 28
Source: Oxford Economics.
% of GDP % of GDP
0
20
40
60
80
100
120
140
160
180
200
1996 1999 2002 2005 2008 2011 2014 2017–16
–14
–12
–10
–8
–6
–4
–2
0
GDP growth
2015
–0.1%
Greece
33EY Eurozone Forecast June 2015
Ireland (annual percentage changes unless specified)
2014 2015 2016 2017 2018 2019
GDP 4.8 3.7 3.8 2.9 2.9 2.9
Private consumption 1.2 2.5 3.1 2.4 2.5 2.2
Fixed investment 11.7 8.4 7.2 3.7 3.3 3.1
Stockbuilding (% of GDP) 1.5 1.0 1.1 1.1 1.0 0.7
Government consumption 0.2 –0.5 0.1 0.7 0.8 0.8
Exports of goods and services 12.6 5.5 4.4 4.3 4.1 3.7
Imports of goods and services 13.2 5.0 4.4 4.3 3.8 3.1
Consumer prices 0.3 0.3 1.8 2.0 2.3 2.0
Unemployment rate (level) 11.3 9.6 9.0 8.4 8.1 8.0
Current account balance (% of GDP) 6.1 4.9 3.7 3.8 3.8 3.7
Government budget (% of GDP) –4.1 –1.9 –0.8 0.0 0.2 0.1
Government debt (% of GDP) 109.7 105.4 100.5 95.9 90.9 86.6
Source: Oxford Economics.
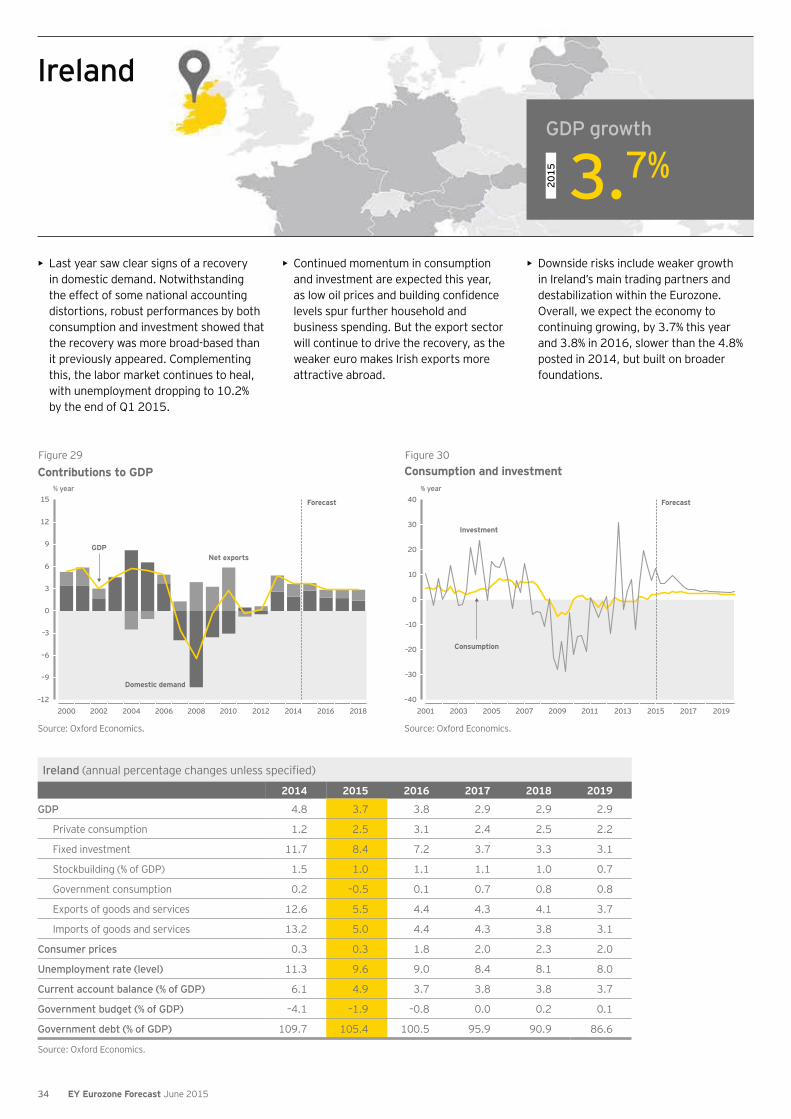
• Last year saw clear signs of a recovery in domestic demand. Notwithstanding the effect of some national accounting distortions, robust performances by both consumption and investment showed that the recovery was more broad-based than it previously appeared. Complementing this, the labor market continues to heal, with unemployment dropping to 10.2% by the end of Q1 2015.
• Continued momentum in consumption and investment are expected this year,
levels spur further household and business spending. But the export sector will continue to drive the recovery, as the weaker euro makes Irish exports more attractive abroad.
• Downside risks include weaker growth in Ireland’s main trading partners and destabilization within the Eurozone. Overall, we expect the economy to continuing growing, by 3.7% this year and 3.8% in 2016, slower than the 4.8% posted in 2014, but built on broader foundations.
Figure 29
Contributions to GDP
Source: Oxford Economics.
% year
–12
–9
–6
–3
0
3
6
9
12
15
2000 2002 2004 2006 2008 2010 2012 2014 2016 2018
Domestic demand
GDPNet exports
Forecast
Figure 30
Source: Oxford Economics.
Consumption and investment% year
–40
–30
–20
–10
0
10
20
30
40
2001 2003 2005 2007 2009 2011 2013 2015 2017 2019
Consumption
Investment
Forecast
GDP growth
2015
3.7%
Ireland
34 EY Eurozone Forecast June 2015
Italy (annual percentage changes unless specified)
2014 2015 2016 2017 2018 2019
GDP –0.4 0.5 1.0 1.1 1.0 1.0
Private consumption 0.3 0.5 0.7 0.8 0.8 0.8
Fixed investment –3.2 0.1 1.7 2.0 2.0 2.0
Stockbuilding (% of GDP) –0.1 –0.1 –0.1 0.1 0.3 0.4
Government consumption –0.9 –0.3 0.0 0.1 0.3 0.4
Exports of goods and services 2.4 4.0 4.0 3.4 3.0 3.0
Imports of goods and services 1.6 3.8 3.5 3.5 3.8 3.4
Consumer prices 0.2 0.1 0.9 1.0 1.3 1.7
Unemployment rate (level) 12.7 12.8 12.4 12.1 11.8 11.2
Current account balance (% of GDP) 1.9 2.5 2.1 1.7 1.5 1.4
Government budget (% of GDP) –3.0 –2.7 –2.0 –1.5 –1.3 –1.1
Government debt (% of GDP) 132.1 133.2 132.4 130.7 128.8 126.5
Source: Oxford Economics.
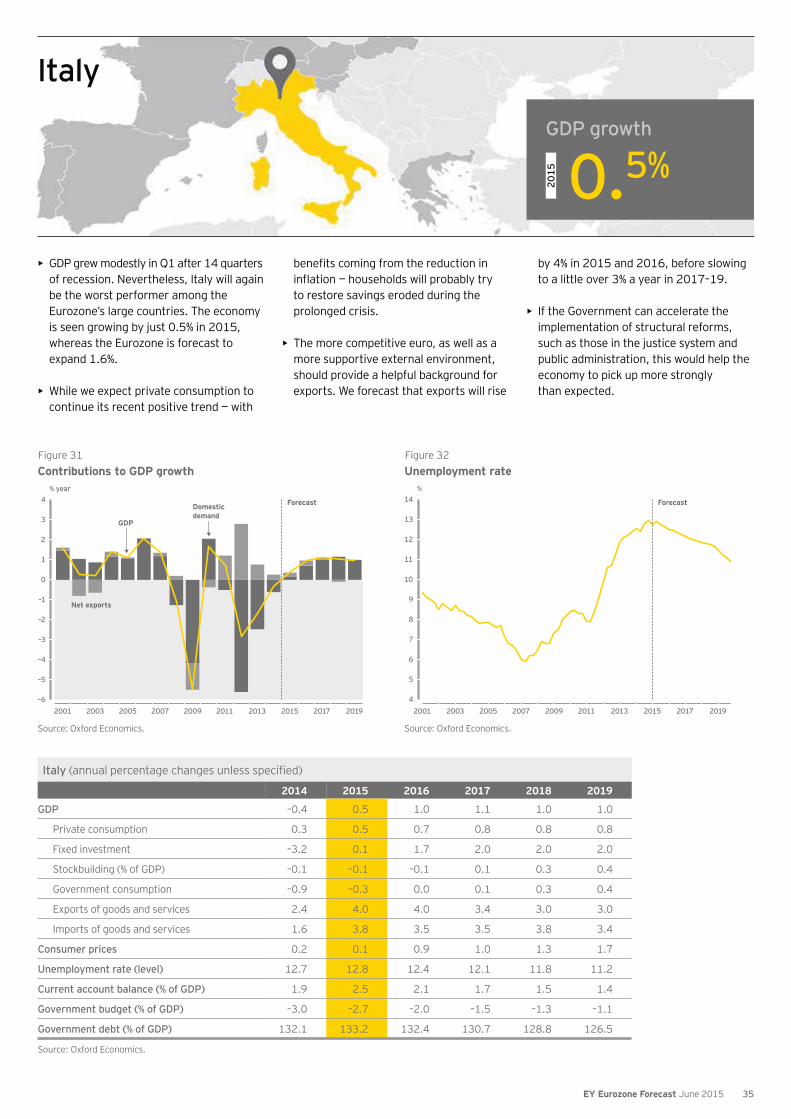
• GDP grew modestly in Q1 after 14 quarters of recession. Nevertheless, Italy will again be the worst performer among the Eurozone’s large countries. The economy is seen growing by just 0.5% in 2015, whereas the Eurozone is forecast to expand 1.6%.
• While we expect private consumption to continue its recent positive trend — with
to restore savings eroded during the prolonged crisis.
• The more competitive euro, as well as a more supportive external environment, should provide a helpful background for exports. We forecast that exports will rise
by 4% in 2015 and 2016, before slowing to a little over 3% a year in 2017–19.
• If the Government can accelerate the implementation of structural reforms, such as those in the justice system and public administration, this would help the economy to pick up more strongly than expected.
Figure 31Contributions to GDP growth
Source: Oxford Economics.
% year
–6
–5
–4
–3
–2
–1
0
1
2
3
4
2001 2003 2005 2007 2009 2011 2013 2015 2017 2019
GDP
Net exports
Domesticdemand
Forecast
Figure 32Unemployment rate
Source: Oxford Economics.
%
4
5
6
7
8
9
10
11
12
13
14
2001 2003 2005 2007 2009 2011 2013 2015 2017 2019
Forecast
GDP growth
2015
0.5%
Italy
35EY Eurozone Forecast June 2015
Latvia (annual percentage changes unless specified)
2014 2015 2016 2017 2018 2019
GDP 2.4 2.6 3.9 4.5 4.5 4.5
Private consumption 2.3 3.3 3.9 4.1 4.2 4.4
Fixed investment 1.6 2.7 4.5 4.8 4.7 4.6
Stockbuilding (% of GDP) 1.0 0.8 0.5 0.5 0.6 0.6
Government consumption 3.6 2.7 2.7 2.9 3.0 3.0
Exports of goods and services 1.9 3.0 4.9 5.5 5.5 5.8
Imports of goods and services 1.5 3.5 4.1 4.8 5.0 5.2
Consumer prices 0.7 0.7 2.4 2.4 2.4 2.4
Unemployment rate (level) 10.9 10.0 9.1 8.3 7.9 7.7
Current account balance (% of GDP) –3.1 –0.7 –0.9 –1.0 –0.9 –0.6
Government budget (% of GDP) –1.4 –1.4 –1.4 –1.4 –1.4 –1.4
Government debt (% of GDP) 35.4 35.7 35.0 34.1 33.3 32.6
Source: Oxford Economics.
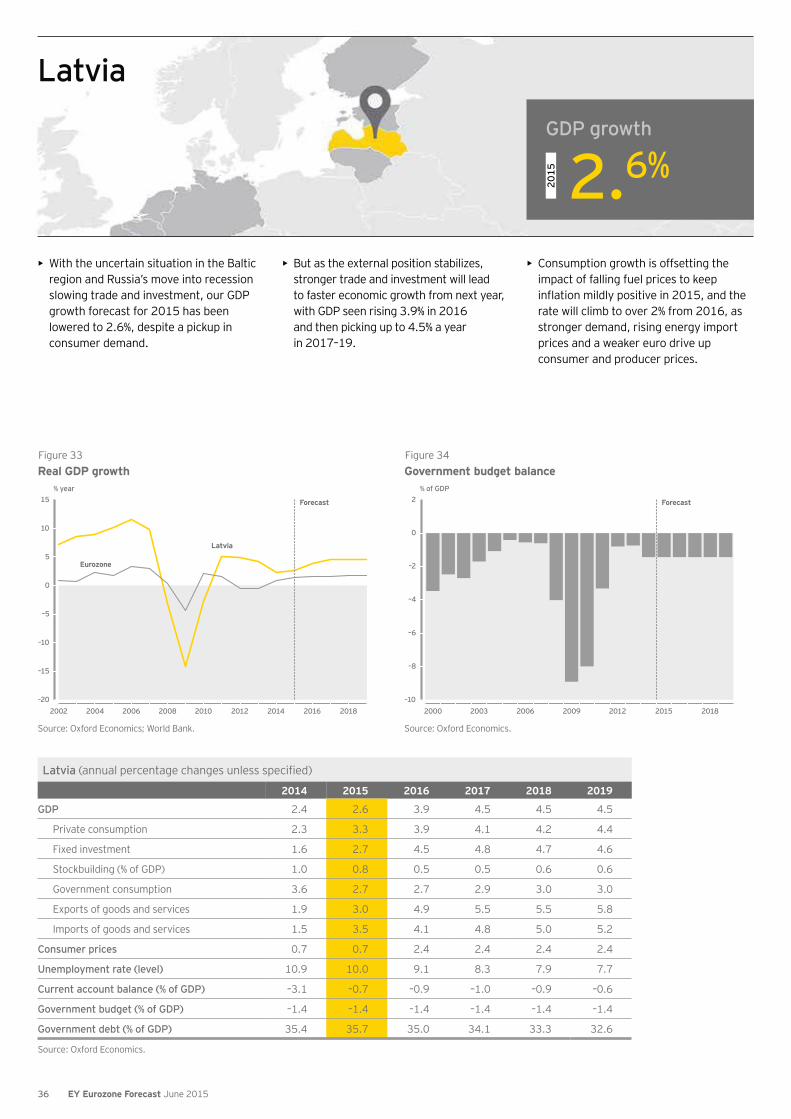
• With the uncertain situation in the Baltic region and Russia’s move into recession slowing trade and investment, our GDP growth forecast for 2015 has been lowered to 2.6%, despite a pickup in consumer demand.
• But as the external position stabilizes, stronger trade and investment will lead to faster economic growth from next year, with GDP seen rising 3.9% in 2016 and then picking up to 4.5% a year in 2017–19.
• Consumption growth is offsetting the impact of falling fuel prices to keep
rate will climb to over 2% from 2016, as stronger demand, rising energy import prices and a weaker euro drive up consumer and producer prices.
Figure 33Real GDP growth
Source: Oxford Economics; World Bank.
% year
–20
–15
–10
–5
0
5
10
15
2002 2004 2006 2008 2010 2012 2014 2016 2018
Latvia
Eurozone
Forecast
Figure 34Government budget balance
Source: Oxford Economics.
2000 2003 2006 2009 2012 2015 2018
Forecast
% of GDP
–10
–8
–6
–4
–2
0
2
GDP growth
2015
2.6%
Latvia
36 EY Eurozone Forecast June 2015
Lithuania (annual percentage changes unless specified)
2014 2015 2016 2017 2018 2019
GDP 2.9 2.6 3.9 4.4 4.4 4.3
Private consumption 5.6 3.8 4.4 4.4 4.3 4.2
Fixed investment 8.6 1.5 5.0 6.5 5.5 4.8
Stockbuilding (% of GDP) –3.4 –1.2 –1.5 –1.5 –1.2 –0.8
Government consumption 1.3 1.5 1.9 2.8 3.2 3.2
Exports of goods and services 3.2 2.0 7.5 7.5 7.2 7.0
Imports of goods and services 5.2 5.2 7.4 7.6 7.5 7.3
Consumer prices 0.1 –0.4 1.9 2.2 2.1 2.1
Unemployment rate (level) 10.7 9.9 9.1 8.2 7.3 6.5
Current account balance (% of GDP) 0.1 0.6 –0.5 –1.5 –2.0 –2.2
Government budget (% of GDP) –0.7 –0.7 –0.8 –0.6 –0.5 –0.3
Government debt (% of GDP) 37.7 37.6 36.4 34.7 33.0 31.3
Source: Oxford Economics.
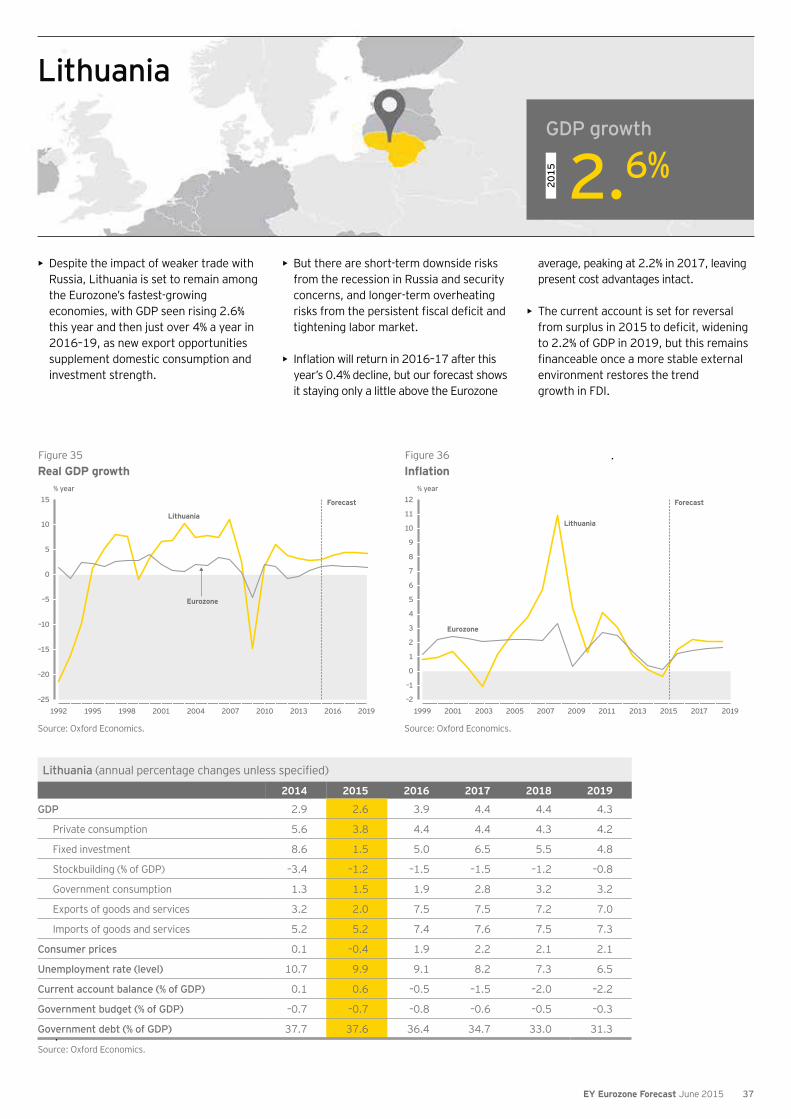
• Despite the impact of weaker trade with Russia, Lithuania is set to remain among the Eurozone’s fastest-growing economies, with GDP seen rising 2.6% this year and then just over 4% a year in 2016–19, as new export opportunities supplement domestic consumption and investment strength.
• But there are short-term downside risks from the recession in Russia and security concerns, and longer-term overheating
tightening labor market.
• year’s 0.4% decline, but our forecast shows it staying only a little above the Eurozone
average, peaking at 2.2% in 2017, leaving present cost advantages intact.
• The current account is set for reversal
to 2.2% of GDP in 2019, but this remains
environment restores the trend growth in FDI.
Figure 35Real GDP growth
Source: Oxford Economics.
% year
–25
–20
–15
–10
–5
0
5
10
15
1992 1995 1998 2001 2004 2007 2010 2013 2016 2019
Lithuania
Eurozone
Forecast
Figure 36
Source: Oxford Economics.
% year
–2
–1
0
1
2
3
4
5
6
7
8
9
10
11
12
1999 2001 2003 2005 2007 2009 2011 2013 2015 2017 2019
GDP growth
2015
2.6%
Lithuania
37EY Eurozone Forecast June 2015
Luxembourg (annual percentage changes unless specified)
2014 2015 2016 2017 2018 2019
GDP 2.8 2.6 2.9 2.9 2.8 2.7
Private consumption 2.6 2.0 2.4 2.4 2.4 2.4
Fixed investment 3.9 3.7 3.7 3.3 3.0 2.7
Stockbuilding (% of GDP) –1.5 –1.3 –2.0 –2.0 –1.5 –1.4
Government consumption 3.2 1.4 1.9 1.9 1.9 1.9
Exports of goods and services 2.4 4.6 5.8 5.0 3.3 2.9
Imports of goods and services 2.0 4.9 5.8 5.2 3.5 2.9
Consumer prices 0.7 0.3 1.9 2.0 1.9 1.9
Unemployment rate (level) 5.9 5.9 5.8 5.6 5.3 4.8
Current account balance (% of GDP) 5.3 4.5 4.9 4.5 3.8 3.5
Government budget (% of GDP) 0.6 0.1 0.0 0.0 0.0 0.0
Government debt (% of GDP) 23.6 22.7 21.6 20.3 19.3 18.5
Source: Oxford Economics.
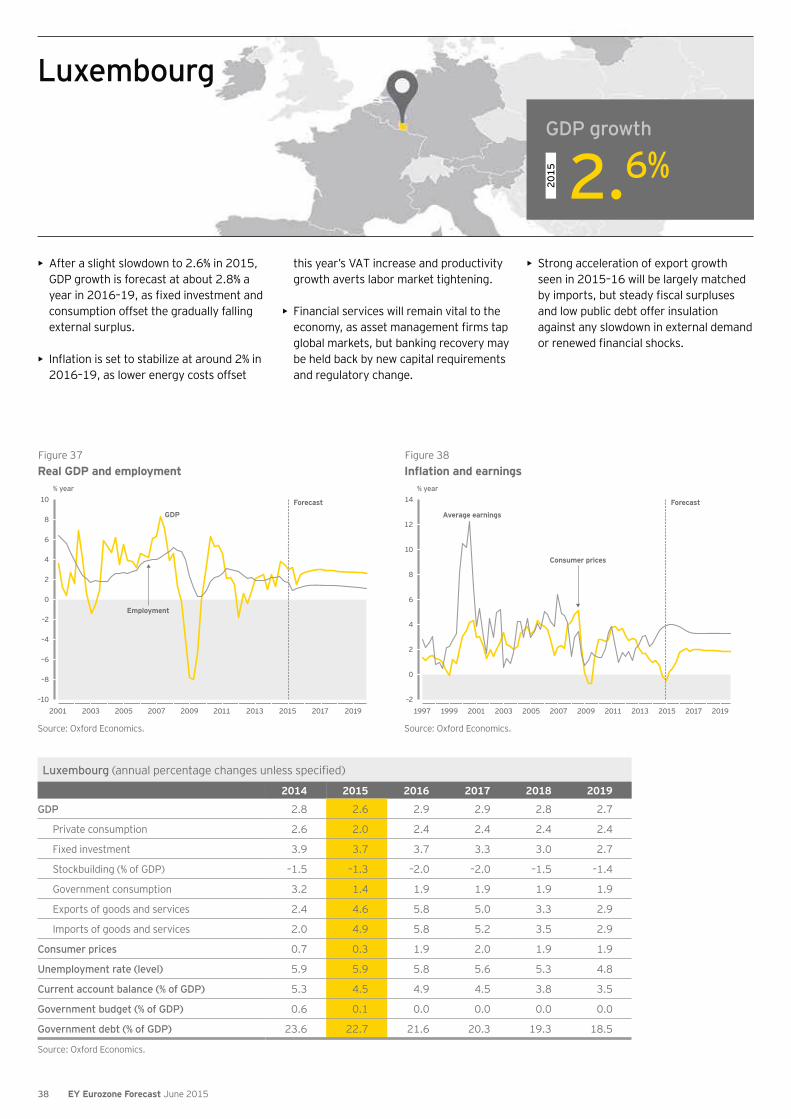
• After a slight slowdown to 2.6% in 2015, GDP growth is forecast at about 2.8% a
consumption offset the gradually falling external surplus.
• 2016–19, as lower energy costs offset
this year’s VAT increase and productivity growth averts labor market tightening.
• Financial services will remain vital to the
global markets, but banking recovery may be held back by new capital requirements and regulatory change.
• Strong acceleration of export growth seen in 2015–16 will be largely matched
and low public debt offer insulation against any slowdown in external demand
Figure 37Real GDP and employment
Source: Oxford Economics.
% year
–10
–8
–6
–4
–2
0
2
4
6
8
10
2001 2003 2005 2007 2009 2011 2013 2015 2017 2019
Employment
GDPForecast
Figure 38
Source: Oxford Economics.
% year
–2
0
2
4
6
8
10
12
14
1997 1999 2001 2003 2005 2007 2009 2011 2013 2015 2017 2019
GDP growth
2015
2.6%
Luxembourg
38 EY Eurozone Forecast June 2015
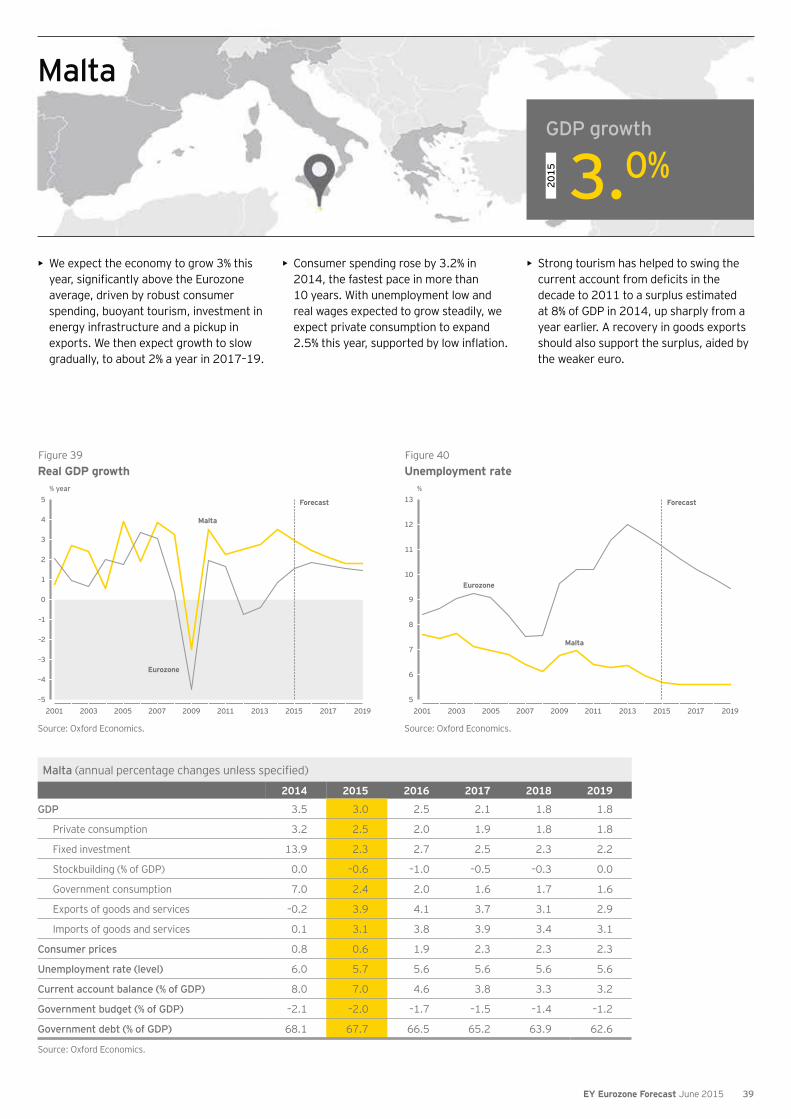
Malta (annual percentage changes unless specified)
2014 2015 2016 2017 2018 2019
GDP 3.5 3.0 2.5 2.1 1.8 1.8
Private consumption 3.2 2.5 2.0 1.9 1.8 1.8
Fixed investment 13.9 2.3 2.7 2.5 2.3 2.2
Stockbuilding (% of GDP) 0.0 –0.6 –1.0 –0.5 –0.3 0.0
Government consumption 7.0 2.4 2.0 1.6 1.7 1.6
Exports of goods and services –0.2 3.9 4.1 3.7 3.1 2.9
Imports of goods and services 0.1 3.1 3.8 3.9 3.4 3.1
Consumer prices 0.8 0.6 1.9 2.3 2.3 2.3
Unemployment rate (level) 6.0 5.7 5.6 5.6 5.6 5.6
Current account balance (% of GDP) 8.0 7.0 4.6 3.8 3.3 3.2
Government budget (% of GDP) –2.1 –2.0 –1.7 –1.5 –1.4 –1.2
Government debt (% of GDP) 68.1 67.7 66.5 65.2 63.9 62.6
Source: Oxford Economics.
• We expect the economy to grow 3% this
average, driven by robust consumer spending, buoyant tourism, investment in energy infrastructure and a pickup in exports. We then expect growth to slow gradually, to about 2% a year in 2017–19.
• Consumer spending rose by 3.2% in 2014, the fastest pace in more than 10 years. With unemployment low and real wages expected to grow steadily, we expect private consumption to expand
• Strong tourism has helped to swing the
decade to 2011 to a surplus estimated at 8% of GDP in 2014, up sharply from a year earlier. A recovery in goods exports should also support the surplus, aided by the weaker euro.
Figure 39Real GDP growth
Source: Oxford Economics.
% year
–5
–4
–3
–2
–1
0
1
2
3
4
5
2001 2003 2005 2007 2009 2011 2013 2015 2017 2019
Malta
Eurozone
Forecast
Figure 40Unemployment rate
Source: Oxford Economics.
%
5
6
7
8
9
10
11
12
13
2001 2003 2005 2007 2009 2011 2013 2015 2017 2019
Eurozone
Malta
Forecast
GDP growth
2015
3.0%
Malta
39EY Eurozone Forecast June 2015

Netherlands (annual percentage changes unless specified)
2014 2015 2016 2017 2018 2019
GDP 0.9 1.8 1.6 1.6 1.7 1.6
Private consumption 0.1 1.0 0.9 1.1 1.4 1.6
Fixed investment 3.5 2.7 2.1 2.0 2.1 2.2
Stockbuilding (% of GDP) 0.0 –0.1 –0.1 0.0 0.0 0.0
Government consumption –0.3 –0.1 0.0 0.3 0.8 1.3
Exports of goods and services 4.0 2.9 3.6 3.2 2.6 2.2
Imports of goods and services 4.0 2.1 3.1 2.9 2.5 2.3
Consumer prices 0.3 0.6 1.3 1.4 1.5 1.6
Unemployment rate (level) 7.4 6.6 6.3 6.3 6.2 6.0
Current account balance (% of GDP) 10.3 10.8 10.9 11.0 11.1 11.0
Government budget (% of GDP) –2.4 –1.9 –1.6 –1.5 –1.3 –1.0
Government debt (% of GDP) 69.7 69.9 69.6 69.2 68.6 67.7
Source: Oxford Economics.
• After a long period of economic weakness, the Dutch economy is gradually showing signs of life with GDP growth in 2014 reaching a three-year high. And various tailwinds should mean that the expansion picks up pace this year. We expect GDP growth of 1.8% for 2015, before a modest slowdown to 1.6% in 2016.
• prices, is boosting households’ real incomes and spending power. And Dutch exporters should gain from the fall in the euro, partly driven by the ECB’s bond-buying program and expansionary monetary policy.
• But high household debt, the result of weak growth in incomes impeding
austerity, means that the economy will see only a modest 1.6% average rate of growth in the coming years.
Figure 41Contributions to GDP growth
Source: Oxford Economics; Haver Analytics.
% year
–4
–3
–2
–1
0
1
2
3
4
5
2001 2003 2005 2007 2009 2011 2013 2015 2017 2019
Net exports
GDP
ForecastDomestic demand
Figure 42Prices and earnings
Source: Oxford Economics.
% year
0
1
2
3
4
5
6
2001 2003 2005 2007 2009 2011 2013 2015 2017 2019
Consumerprice index
Averageearnings
Forecast
GDP growth
2015
1.8%
Netherlands
40 EY Eurozone Forecast June 2015
Portugal (annual percentage changes unless specified)
2014 2015 2016 2017 2018 2019
GDP 0.9 1.7 1.5 1.3 1.2 1.2
Private consumption 2.1 1.3 1.0 0.9 0.9 0.9
Fixed investment 2.5 2.6 3.0 2.5 2.4 2.4
Stockbuilding (% of GDP) 0.2 0.1 0.2 0.0 0.0 0.0
Government consumption –0.3 –0.7 0.5 0.5 0.5 0.5
Exports of goods and services 3.4 6.0 4.7 4.7 3.8 3.0
Imports of goods and services 6.4 4.3 4.3 3.9 3.3 2.9
Consumer prices –0.2 0.2 0.8 1.2 1.4 1.7
Unemployment rate (level) 14.1 13.0 11.7 10.8 10.3 10.0
Current account balance (% of GDP) 0.6 2.0 2.4 2.5 2.4 2.1
Government budget (% of GDP) –4.5 –3.1 –2.5 –1.9 –1.4 –1.0
Government debt (% of GDP) 130.2 130.6 129.4 128.1 126.5 124.4
Source: Oxford Economics.
• The Portuguese economy continues to recover steadily. After a 0.4% rise in Q1, GDP is forecast to grow 1.7% in 2015, up from 0.9% last year, helped by the impact of lower oil prices and stronger Eurozone demand.
• Over the coming years, the expansion will be fairly broad-based, with gains in consumption and investment reinforcing
the impetus from net trade, although the pace of overall growth is expected to slow to 1.5% in 2016 and then about 1.2% a year in 2017–19.
• The pace of recovery in the years ahead will continue to be constrained by the high levels of public and private debt. Although the household sector has made progress in reducing its debt, public and
corporate indebtedness remains worryingly high.
• in April, the fastest since mid-2013. Assuming that oil prices recover slowly, Portugal is forecast to avoid a second
Figure 43Corporate sector deleveraging
Source: Oxford Economics; Haver Analytics.
% of GDP
100
110
120
130
140
150
160
2001 2003 2005 2007 2009 2011 2013 2015 2017 2019
Portugal
Eurozone
Forecast
Figure 44Government balance and debt
Source: Oxford Economics.
% of GDP% of GDP
Forecast40
50
60
70
80
90
100
110
120
130
140
1991 1994 1997 2000 2003 2006 2009 2012 2015 2018–12
–10
–8
–6
–4
–2
0
Government balance(left-hand side)
Government debt (right-hand side)
GDP growth
2015
1.7%
Portugal
41EY Eurozone Forecast June 2015
Slovakia (annual percentage changes unless specified)
2014 2015 2016 2017 2018 2019
GDP 2.4 2.9 3.1 3.3 3.5 3.4
Private consumption 2.2 2.5 2.7 2.7 2.7 2.5
Fixed investment 5.7 3.7 3.9 3.2 3.4 3.6
Stockbuilding (% of GDP) –0.4 0.3 0.5 1.0 1.3 1.1
Government consumption 4.4 1.9 2.3 2.4 2.6 2.4
Exports of goods and services 4.6 3.7 6.0 5.3 5.1 4.9
Imports of goods and services 5.0 4.4 6.2 5.5 4.9 4.2
Consumer prices –0.1 0.4 1.9 2.5 2.6 2.5
Unemployment rate (level) 13.2 12.1 11.6 10.9 9.9 9.2
Current account balance (% of GDP) 0.1 0.8 0.8 0.7 0.7 0.7
Government budget (% of GDP) –2.9 –2.9 –2.0 –1.9 –1.3 –1.2
Government debt (% of GDP) 53.6 54.7 53.9 53.0 51.5 49.9
Source: Oxford Economics.
• �outperform the Eurozone. Domestic demand, in the form of stronger consumption and positive investment growth, will provide the main impetus to the economy this year.
• �expected to be 3.7% for 2015, before gathering pace again in 2016. But recent
monthly data continues to indicate solid economic activity. Quarterly GDP growth is forecast to average 0.8% this year, with the economy growing by 2.9% in 2015 overall, up from 2.4% last year. We then forecast expansion of 3.1% in 2016 and around 3.4% a year in 2017–19.
• �number of longer-term challenges.
Regional inequality is very high and the labor market is hampered by aging and structural problems. Population aging will cut the labor supply and raise the cost of health and pension systems. Meanwhile, 70% of the jobless have been unemployed for more than a year, which could make
the workforce.
Figure 45Real GDP growth
Source: Oxford Economics.
% year
–6
–4
–2
0
2
4
6
8
10
12
2001 2003 2005 2007 2009 2011 2013 2015 2017 2019
Slovakia
Eurozone
Forecast
Figure 46GDP per capita by region
Source: European Commission; OECD.
€000s at purchasing power standards
0
10
20
30
40
50
60
70
80
Inne
r Lon
don
Luxe
mbo
urg
Brus
sels
Ham
burg
Osl
o
Brat
isla
va
Paris
Gro
ning
en
Stoc
khol
m
Prag
ue
Wes
t Slo
vaki
aex
. Bra
tisla
va
GDP growth
2015
2.9%
Slovakia
42 EY Eurozone Forecast June 2015
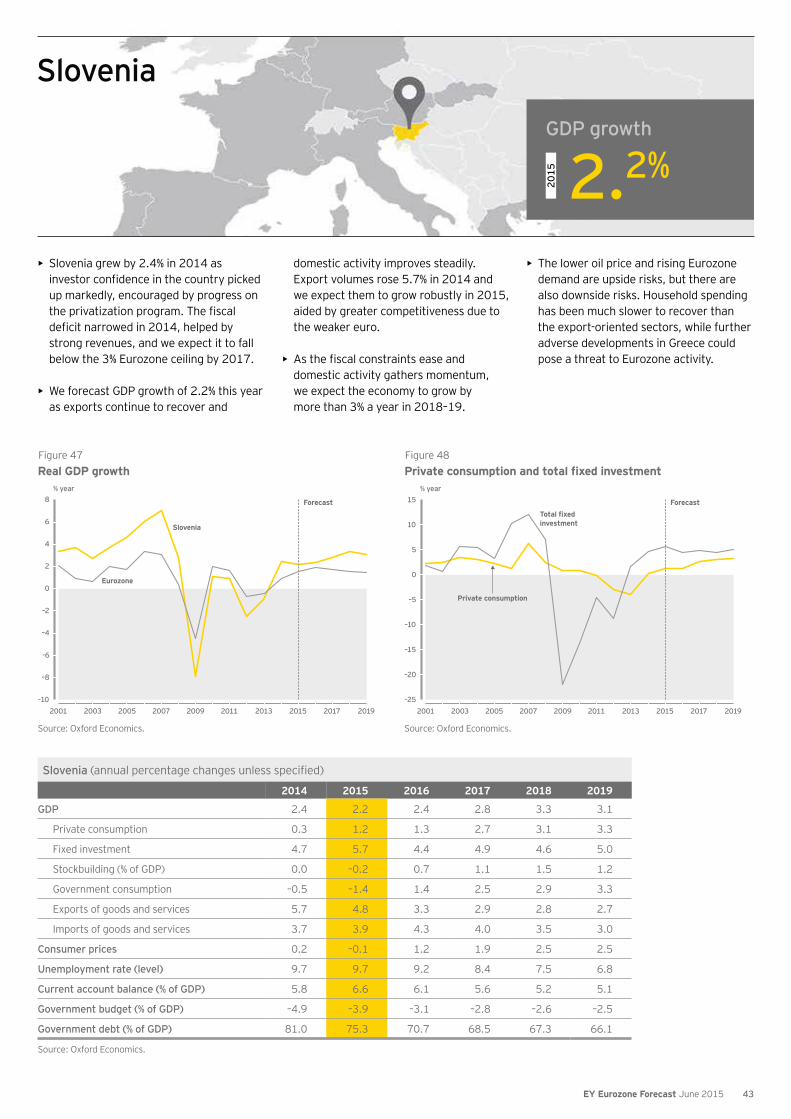
Slovenia (annual percentage changes unless specified)
2014 2015 2016 2017 2018 2019
GDP 2.4 2.2 2.4 2.8 3.3 3.1
Private consumption 0.3 1.2 1.3 2.7 3.1 3.3
Fixed investment 4.7 5.7 4.4 4.9 4.6 5.0
Stockbuilding (% of GDP) 0.0 –0.2 0.7 1.1 1.5 1.2
Government consumption –0.5 –1.4 1.4 2.5 2.9 3.3
Exports of goods and services 5.7 4.8 3.3 2.9 2.8 2.7
Imports of goods and services 3.7 3.9 4.3 4.0 3.5 3.0
Consumer prices 0.2 –0.1 1.2 1.9 2.5 2.5
Unemployment rate (level) 9.7 9.7 9.2 8.4 7.5 6.8
Current account balance (% of GDP) 5.8 6.6 6.1 5.6 5.2 5.1
Government budget (% of GDP) –4.9 –3.9 –3.1 –2.8 –2.6 –2.5
Government debt (% of GDP) 81.0 75.3 70.7 68.5 67.3 66.1
Source: Oxford Economics.
• Slovenia grew by 2.4% in 2014 as
up markedly, encouraged by progress on
strong revenues, and we expect it to fall below the 3% Eurozone ceiling by 2017.
• We forecast GDP growth of 2.2% this year as exports continue to recover and
domestic activity improves steadily. Export volumes rose 5.7% in 2014 and we expect them to grow robustly in 2015, aided by greater competitiveness due to the weaker euro.
• domestic activity gathers momentum, we expect the economy to grow by more than 3% a year in 2018–19.
• The lower oil price and rising Eurozone demand are upside risks, but there are also downside risks. Household spending has been much slower to recover than the export-oriented sectors, while further adverse developments in Greece could pose a threat to Eurozone activity.
Figure 47Real GDP growth
Source: Oxford Economics.
% year
–10
–8
-6
–4
–2
0
2
4
6
8
2001 2003 2005 2007 2009 2011 2013 2015 2017 2019
Slovenia
Eurozone
Forecast
Figure 48
Source: Oxford Economics.
% year
–25
–20
–15
–10
–5
0
5
10
15
2001 2003 2005 2007 2009 2011 2013 2015 2017 2019
Private consumption
investment
Forecast
GDP growth
2015
2.2%
Slovenia
43EY Eurozone Forecast June 2015
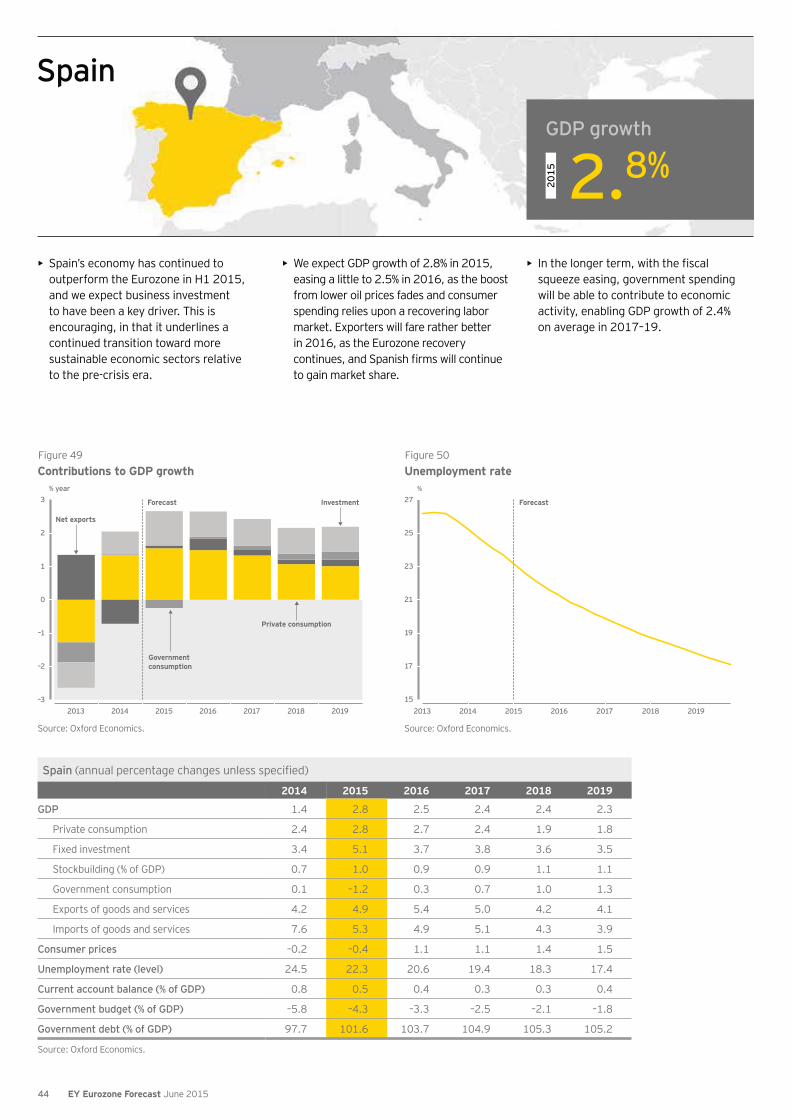
Spain (annual percentage changes unless specified)
2014 2015 2016 2017 2018 2019
GDP 1.4 2.8 2.5 2.4 2.4 2.3
Private consumption 2.4 2.8 2.7 2.4 1.9 1.8
Fixed investment 3.4 5.1 3.7 3.8 3.6 3.5
Stockbuilding (% of GDP) 0.7 1.0 0.9 0.9 1.1 1.1
Government consumption 0.1 –1.2 0.3 0.7 1.0 1.3
Exports of goods and services 4.2 4.9 5.4 5.0 4.2 4.1
Imports of goods and services 7.6 5.3 4.9 5.1 4.3 3.9
Consumer prices –0.2 –0.4 1.1 1.1 1.4 1.5
Unemployment rate (level) 24.5 22.3 20.6 19.4 18.3 17.4
Current account balance (% of GDP) 0.8 0.5 0.4 0.3 0.3 0.4
Government budget (% of GDP) –5.8 –4.3 –3.3 –2.5 –2.1 –1.8
Government debt (% of GDP) 97.7 101.6 103.7 104.9 105.3 105.2
Source: Oxford Economics.
• Spain’s economy has continued to outperform the Eurozone in H1 2015, and we expect business investment to have been a key driver. This is encouraging, in that it underlines a continued transition toward more sustainable economic sectors relative to the pre-crisis era.
• We expect GDP growth of 2.8% in 2015, easing a little to 2.5% in 2016, as the boost from lower oil prices fades and consumer spending relies upon a recovering labor market. Exporters will fare rather better in 2016, as the Eurozone recovery
to gain market share.
• squeeze easing, government spending will be able to contribute to economic activity, enabling GDP growth of 2.4% on average in 2017–19.
Figure 49Contributions to GDP growth
Source: Oxford Economics.
% year
–3
–2
–1
0
1
2
3
2013 2014 2015 2016 2017 2018 2019
Investment
Net exports
Private consumption
Forecast
Governmentconsumption
Figure 50Unemployment rate
Source: Oxford Economics.
%
Forecast
15
17
19
21
23
25
27
2013 2014 2015 2016 2017 2018 2019
GDP growth
2015
2.8%
Spain
44 EY Eurozone Forecast June 2015

Detailed tables and charts
45EY Eurozone Forecast June 2015
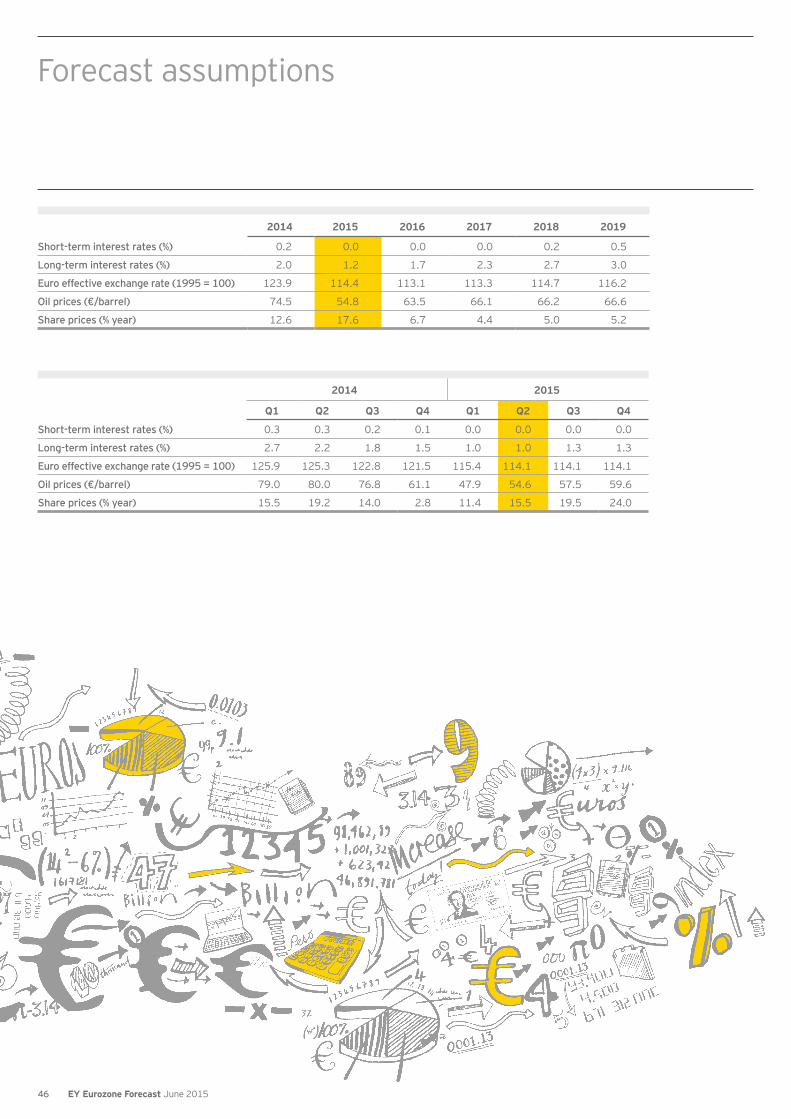
Forecast assumptions
2014 2015 2016 2017 2018 2019
Short-term interest rates (%) 0.2 0.0 0.0 0.0 0.2 0.5
Long-term interest rates (%) 2.0 1.2 1.7 2.3 2.7 3.0
Euro effective exchange rate (1995 = 100) 123.9 114.4 113.1 113.3 114.7 116.2
Oil prices (€/barrel) 74.5 54.8 63.5 66.1 66.2 66.6
Share prices (% year) 12.6 17.6 6.7 4.4 5.0 5.2
2014 2015
Q1 Q2 Q3 Q4 Q1 Q2 Q3 Q4
Short-term interest rates (%) 0.3 0.3 0.2 0.1 0.0 0.0 0.0 0.0
Long-term interest rates (%) 2.7 2.2 1.8 1.5 1.0 1.0 1.3 1.3
Euro effective exchange rate (1995 = 100) 125.9 125.3 122.8 121.5 115.4 114.1 114.1 114.1
Oil prices (€/barrel) 79.0 80.0 76.8 61.1 47.9 54.6 57.5 59.6
Share prices (% year) 15.5 19.2 14.0 2.8 11.4 15.5 19.5 24.0
46 EY Eurozone Forecast June 2015
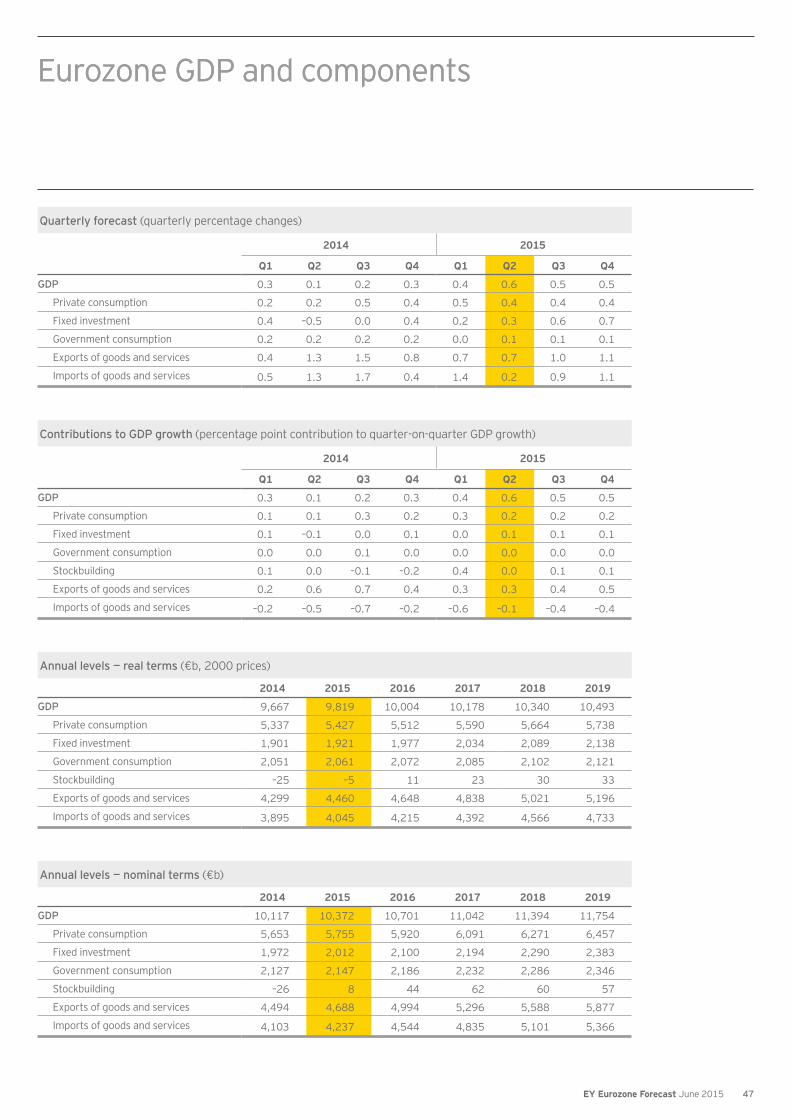
Quarterly forecast (quarterly percentage changes)
2014 2015
Q1 Q2 Q3 Q4 Q1 Q2 Q3 Q4
GDP 0.3 0.1 0.2 0.3 0.4 0.6 0.5 0.5
Private consumption 0.2 0.2 0.5 0.4 0.5 0.4 0.4 0.4
Fixed investment 0.4 –0.5 0.0 0.4 0.2 0.3 0.6 0.7
Government consumption 0.2 0.2 0.2 0.2 0.0 0.1 0.1 0.1
Exports of goods and services 0.4 1.3 1.5 0.8 0.7 0.7 1.0 1.1
Imports of goods and services 0.5 1.3 1.7 0.4 1.4 0.2 0.9 1.1
Contributions to GDP growth (percentage point contribution to quarter-on-quarter GDP growth)
2014 2015
Q1 Q2 Q3 Q4 Q1 Q2 Q3 Q4
GDP 0.3 0.1 0.2 0.3 0.4 0.6 0.5 0.5
Private consumption 0.1 0.1 0.3 0.2 0.3 0.2 0.2 0.2
Fixed investment 0.1 –0.1 0.0 0.1 0.0 0.1 0.1 0.1
Government consumption 0.0 0.0 0.1 0.0 0.0 0.0 0.0 0.0
Stockbuilding 0.1 0.0 –0.1 –0.2 0.4 0.0 0.1 0.1
Exports of goods and services 0.2 0.6 0.7 0.4 0.3 0.3 0.4 0.5
Imports of goods and services –0.2 –0.5 –0.7 –0.2 –0.6 –0.1 –0.4 –0.4
Annual levels — real terms (€b, 2000 prices)
2014 2015 2016 2017 2018 2019
GDP 9,667 9,819 10,004 10,178 10,340 10,493
Private consumption 5,337 5,427 5,512 5,590 5,664 5,738
Fixed investment 1,901 1,921 1,977 2,034 2,089 2,138
Government consumption 2,051 2,061 2,072 2,085 2,102 2,121
Stockbuilding –25 –5 11 23 30 33
Exports of goods and services 4,299 4,460 4,648 4,838 5,021 5,196
Imports of goods and services 3,895 4,045 4,215 4,392 4,566 4,733
Annual levels — nominal terms (€b)
2014 2015 2016 2017 2018 2019
GDP 10,117 10,372 10,701 11,042 11,394 11,754
Private consumption 5,653 5,755 5,920 6,091 6,271 6,457
Fixed investment 1,972 2,012 2,100 2,194 2,290 2,383
Government consumption 2,127 2,147 2,186 2,232 2,286 2,346
Stockbuilding –26 8 44 62 60 57
Exports of goods and services 4,494 4,688 4,994 5,296 5,588 5,877
Imports of goods and services 4,103 4,237 4,544 4,835 5,101 5,366
Eurozone GDP and componentsEurozone GDP and components
47EY Eurozone Forecast June 2015
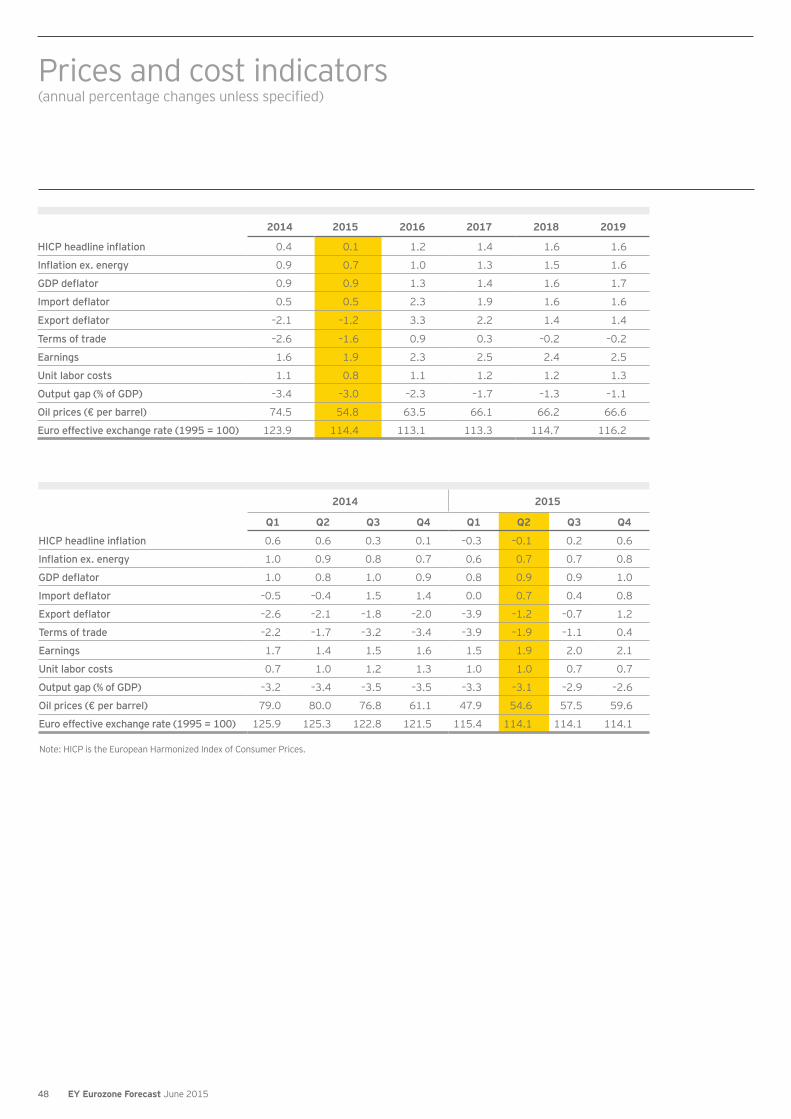
Prices and cost indicators
2014 2015 2016 2017 2018 2019
0.4 0.1 1.2 1.4 1.6 1.6
0.9 0.7 1.0 1.3 1.5 1.6
0.9 0.9 1.3 1.4 1.6 1.7
0.5 0.5 2.3 1.9 1.6 1.6
–2.1 –1.2 3.3 2.2 1.4 1.4
Terms of trade –2.6 –1.6 0.9 0.3 –0.2 –0.2
Earnings 1.6 1.9 2.3 2.5 2.4 2.5
Unit labor costs 1.1 0.8 1.1 1.2 1.2 1.3
Output gap (% of GDP) –3.4 –3.0 –2.3 –1.7 –1.3 –1.1
Oil prices (€ per barrel) 74.5 54.8 63.5 66.1 66.2 66.6
Euro effective exchange rate (1995 = 100) 123.9 114.4 113.1 113.3 114.7 116.2
2014 2015
Q1 Q2 Q3 Q4 Q1 Q2 Q3 Q4
0.6 0.6 0.3 0.1 –0.3 –0.1 0.2 0.6
1.0 0.9 0.8 0.7 0.6 0.7 0.7 0.8
1.0 0.8 1.0 0.9 0.8 0.9 0.9 1.0
–0.5 –0.4 1.5 1.4 0.0 0.7 0.4 0.8
–2.6 –2.1 –1.8 –2.0 –3.9 –1.2 –0.7 1.2
Terms of trade –2.2 –1.7 –3.2 –3.4 –3.9 –1.9 –1.1 0.4
Earnings 1.7 1.4 1.5 1.6 1.5 1.9 2.0 2.1
Unit labor costs 0.7 1.0 1.2 1.3 1.0 1.0 0.7 0.7
Output gap (% of GDP) –3.2 –3.4 –3.5 –3.5 –3.3 –3.1 –2.9 –2.6
Oil prices (€ per barrel) 79.0 80.0 76.8 61.1 47.9 54.6 57.5 59.6
Euro effective exchange rate (1995 = 100) 125.9 125.3 122.8 121.5 115.4 114.1 114.1 114.1
Note: HICP is the European Harmonized Index of Consumer Prices.
48 EY Eurozone Forecast June 2015
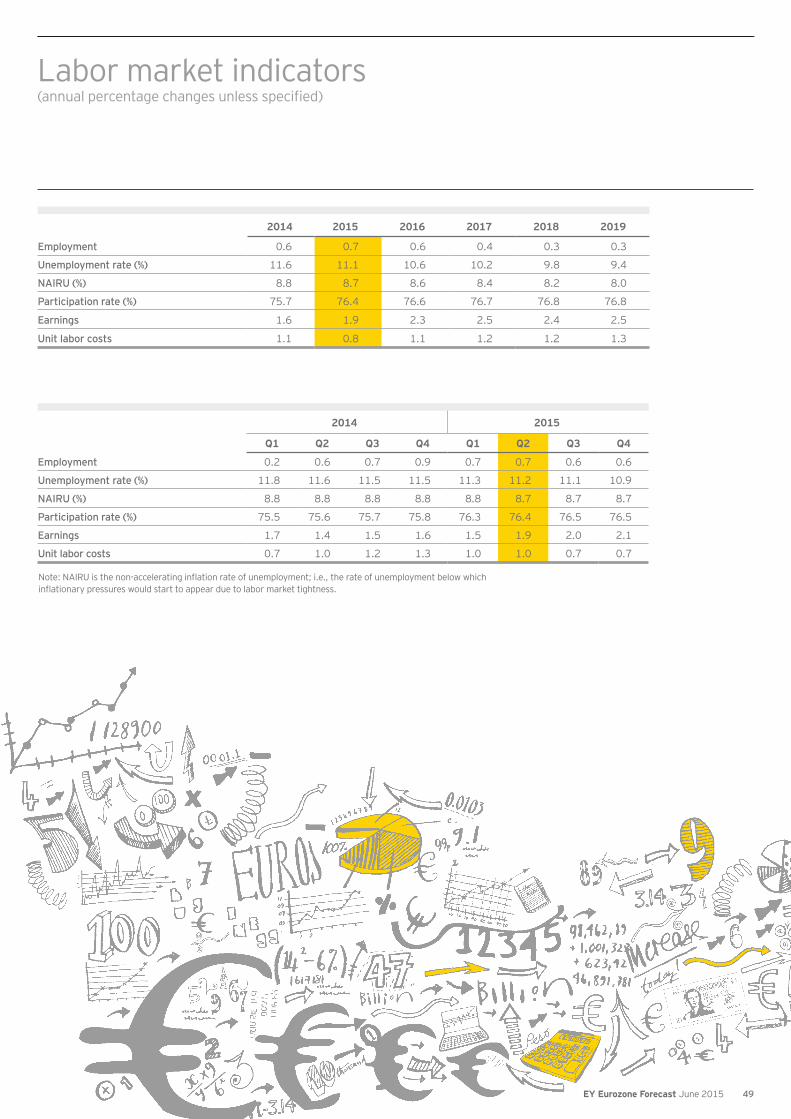
2014 2015 2016 2017 2018 2019
Employment 0.6 0.7 0.6 0.4 0.3 0.3
Unemployment rate (%) 11.6 11.1 10.6 10.2 9.8 9.4
NAIRU (%) 8.8 8.7 8.6 8.4 8.2 8.0
Participation rate (%) 75.7 76.4 76.6 76.7 76.8 76.8
Earnings 1.6 1.9 2.3 2.5 2.4 2.5
Unit labor costs 1.1 0.8 1.1 1.2 1.2 1.3
2014 2015
Q1 Q2 Q3 Q4 Q1 Q2 Q3 Q4
Employment 0.2 0.6 0.7 0.9 0.7 0.7 0.6 0.6
Unemployment rate (%) 11.8 11.6 11.5 11.5 11.3 11.2 11.1 10.9
NAIRU (%) 8.8 8.8 8.8 8.8 8.8 8.7 8.7 8.7
Participation rate (%) 75.5 75.6 75.7 75.8 76.3 76.4 76.5 76.5
Earnings 1.7 1.4 1.5 1.6 1.5 1.9 2.0 2.1
Unit labor costs 0.7 1.0 1.2 1.3 1.0 1.0 0.7 0.7
Labor market indicators
49EY Eurozone Forecast June 2015
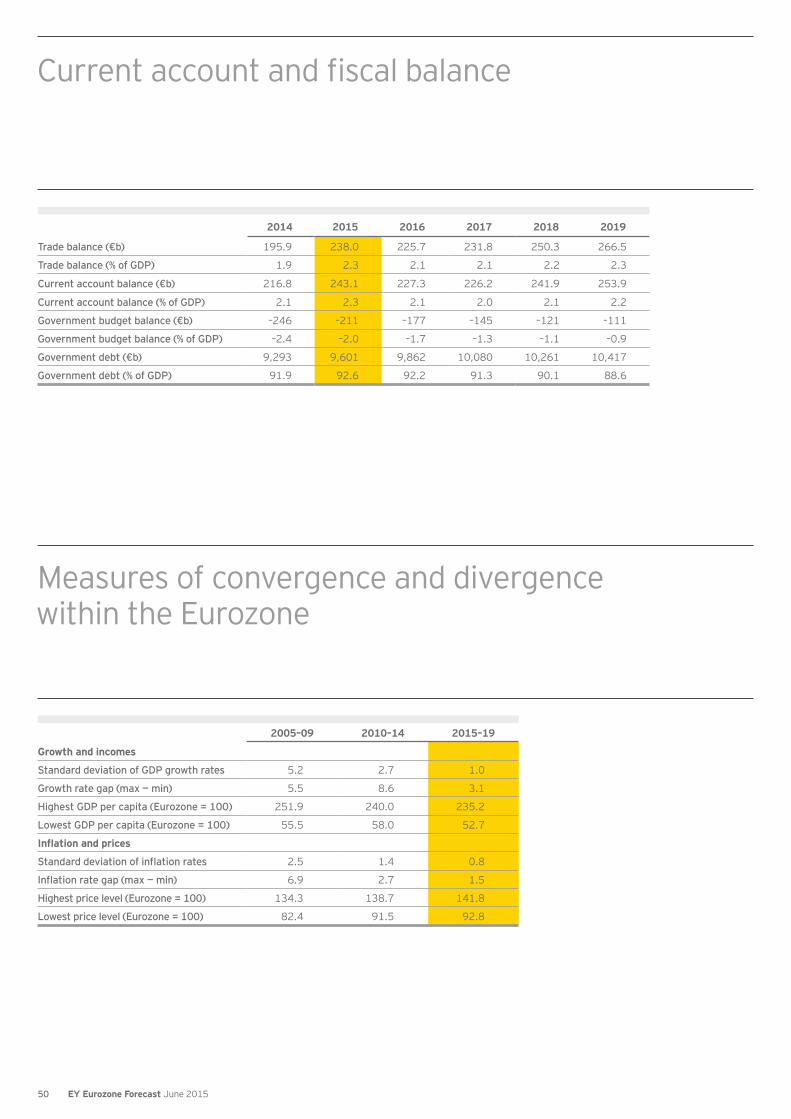
2014 2015 2016 2017 2018 2019
Trade balance (€b) 195.9 238.0 225.7 231.8 250.3 266.5
Trade balance (% of GDP) 1.9 2.3 2.1 2.1 2.2 2.3
Current account balance (€b) 216.8 243.1 227.3 226.2 241.9 253.9
Current account balance (% of GDP) 2.1 2.3 2.1 2.0 2.1 2.2
Government budget balance (€b) –246 –211 –177 –145 –121 –111
Government budget balance (% of GDP) –2.4 –2.0 –1.7 –1.3 –1.1 –0.9
Government debt (€b) 9,293 9,601 9,862 10,080 10,261 10,417
Government debt (% of GDP) 91.9 92.6 92.2 91.3 90.1 88.6
2005–09 2010–14 2015–19
Growth and incomes
Standard deviation of GDP growth rates 5.2 2.7 1.0
Growth rate gap (max — min) 5.5 8.6 3.1
Highest GDP per capita (Eurozone = 100) 251.9 240.0 235.2
Lowest GDP per capita (Eurozone = 100) 55.5 58.0 52.7
2.5 1.4 0.8
6.9 2.7 1.5
Highest price level (Eurozone = 100) 134.3 138.7 141.8
Lowest price level (Eurozone = 100) 82.4 91.5 92.8
Measures of convergence and divergence within the Eurozone
50 EY Eurozone Forecast June 2015
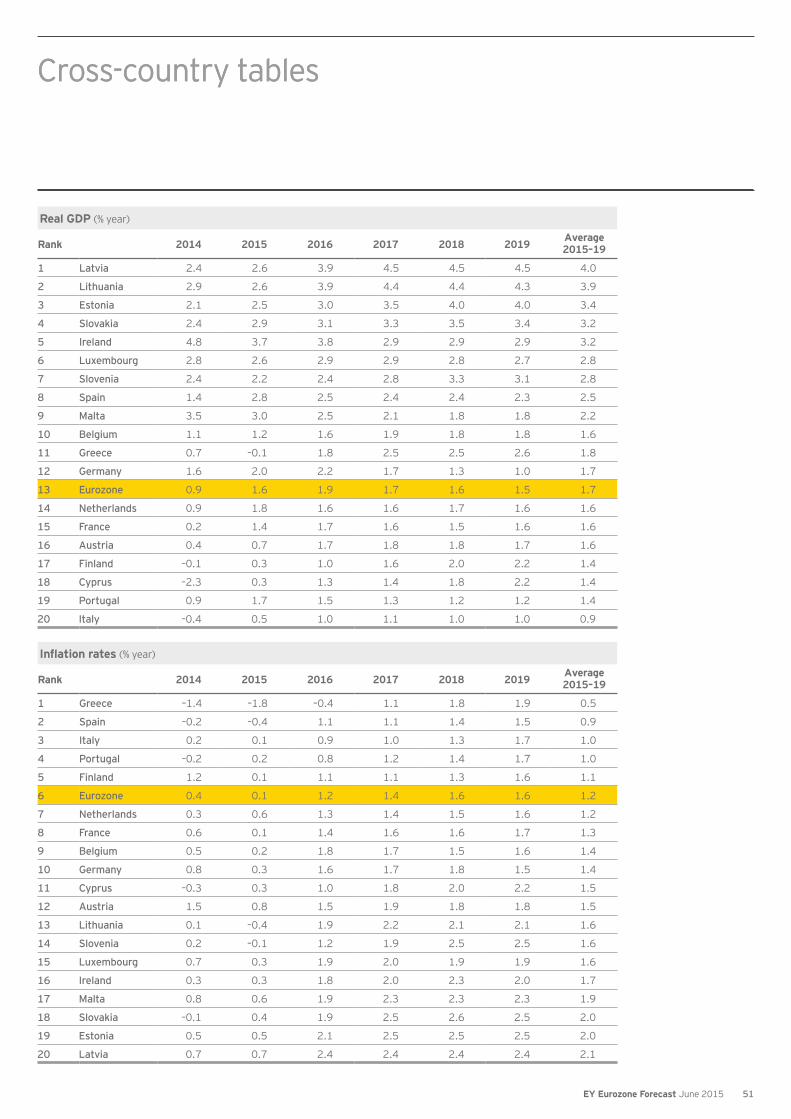
Real GDP (% year)
Rank 2014 2015 2016 2017 2018 2019 Average 2015–19
1 Latvia 2.4 2.6 3.9 4.5 4.5 4.5 4.0
2 Lithuania 2.9 2.6 3.9 4.4 4.4 4.3 3.9
3 Estonia 2.1 2.5 3.0 3.5 4.0 4.0 3.4
4 Slovakia 2.4 2.9 3.1 3.3 3.5 3.4 3.2
5 Ireland 4.8 3.7 3.8 2.9 2.9 2.9 3.2
6 Luxembourg 2.8 2.6 2.9 2.9 2.8 2.7 2.8
7 Slovenia 2.4 2.2 2.4 2.8 3.3 3.1 2.8
8 Spain 1.4 2.8 2.5 2.4 2.4 2.3 2.5
9 Malta 3.5 3.0 2.5 2.1 1.8 1.8 2.2
10 Belgium 1.1 1.2 1.6 1.9 1.8 1.8 1.6
11 Greece 0.7 –0.1 1.8 2.5 2.5 2.6 1.8
12 Germany 1.6 2.0 2.2 1.7 1.3 1.0 1.7
13 Eurozone 0.9 1.6 1.9 1.7 1.6 1.5 1.7
14 Netherlands 0.9 1.8 1.6 1.6 1.7 1.6 1.6
15 France 0.2 1.4 1.7 1.6 1.5 1.6 1.6
16 Austria 0.4 0.7 1.7 1.8 1.8 1.7 1.6
17 Finland –0.1 0.3 1.0 1.6 2.0 2.2 1.4
18 Cyprus –2.3 0.3 1.3 1.4 1.8 2.2 1.4
19 Portugal 0.9 1.7 1.5 1.3 1.2 1.2 1.4
20 Italy –0.4 0.5 1.0 1.1 1.0 1.0 0.9
Inflation rates (% year)
Rank 2014 2015 2016 2017 2018 2019 Average 2015–19
1 Greece –1.4 –1.8 –0.4 1.1 1.8 1.9 0.5
2 Spain –0.2 –0.4 1.1 1.1 1.4 1.5 0.9
3 Italy 0.2 0.1 0.9 1.0 1.3 1.7 1.0
4 Portugal –0.2 0.2 0.8 1.2 1.4 1.7 1.0
5 Finland 1.2 0.1 1.1 1.1 1.3 1.6 1.1
6 Eurozone 0.4 0.1 1.2 1.4 1.6 1.6 1.2
7 Netherlands 0.3 0.6 1.3 1.4 1.5 1.6 1.2
8 France 0.6 0.1 1.4 1.6 1.6 1.7 1.3
9 Belgium 0.5 0.2 1.8 1.7 1.5 1.6 1.4
10 Germany 0.8 0.3 1.6 1.7 1.8 1.5 1.4
11 Cyprus –0.3 0.3 1.0 1.8 2.0 2.2 1.5
12 Austria 1.5 0.8 1.5 1.9 1.8 1.8 1.5
13 Lithuania 0.1 –0.4 1.9 2.2 2.1 2.1 1.6
14 Slovenia 0.2 –0.1 1.2 1.9 2.5 2.5 1.6
15 Luxembourg 0.7 0.3 1.9 2.0 1.9 1.9 1.6
16 Ireland 0.3 0.3 1.8 2.0 2.3 2.0 1.7
17 Malta 0.8 0.6 1.9 2.3 2.3 2.3 1.9
18 Slovakia –0.1 0.4 1.9 2.5 2.6 2.5 2.0
19 Estonia 0.5 0.5 2.1 2.5 2.5 2.5 2.0
20 Latvia 0.7 0.7 2.4 2.4 2.4 2.4 2.1
Cross-country tablesCross-country tables
51EY Eurozone Forecast June 2015
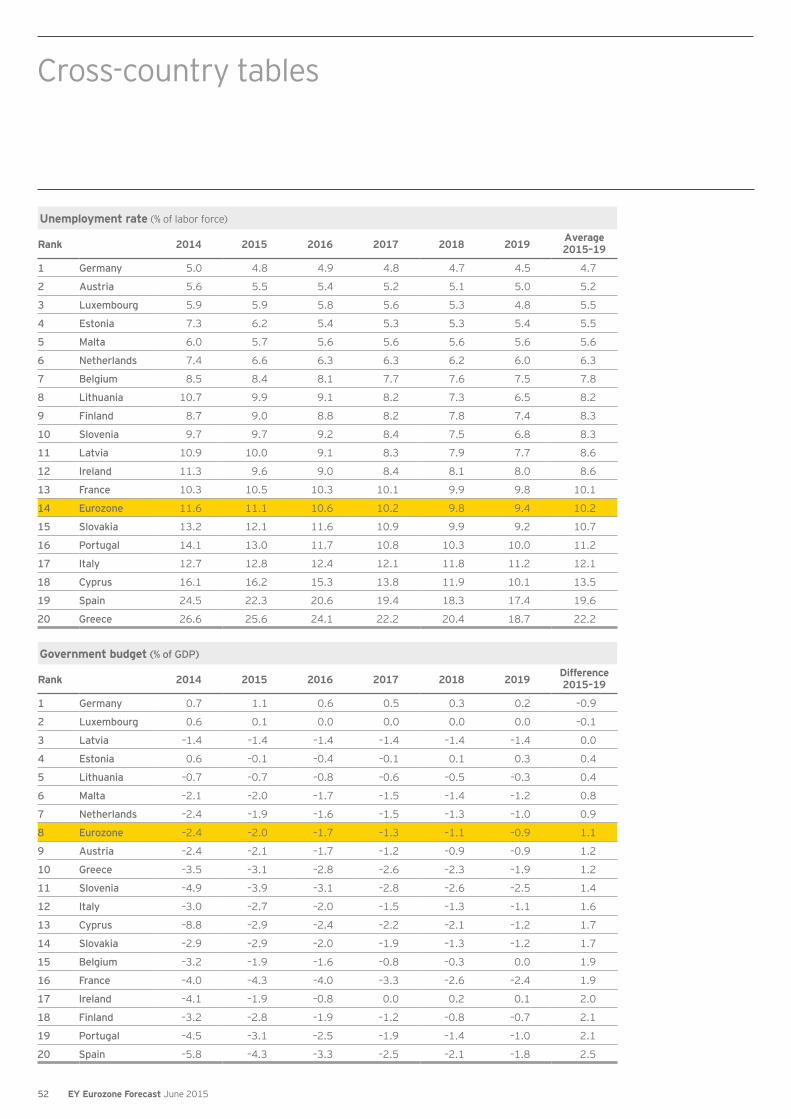
Unemployment rate (% of labor force)
Rank 2014 2015 2016 2017 2018 2019 Average 2015–19
1 Germany 5.0 4.8 4.9 4.8 4.7 4.5 4.7
2 Austria 5.6 5.5 5.4 5.2 5.1 5.0 5.2
3 Luxembourg 5.9 5.9 5.8 5.6 5.3 4.8 5.5
4 Estonia 7.3 6.2 5.4 5.3 5.3 5.4 5.5
5 Malta 6.0 5.7 5.6 5.6 5.6 5.6 5.6
6 Netherlands 7.4 6.6 6.3 6.3 6.2 6.0 6.3
7 Belgium 8.5 8.4 8.1 7.7 7.6 7.5 7.8
8 Lithuania 10.7 9.9 9.1 8.2 7.3 6.5 8.2
9 Finland 8.7 9.0 8.8 8.2 7.8 7.4 8.3
10 Slovenia 9.7 9.7 9.2 8.4 7.5 6.8 8.3
11 Latvia 10.9 10.0 9.1 8.3 7.9 7.7 8.6
12 Ireland 11.3 9.6 9.0 8.4 8.1 8.0 8.6
13 France 10.3 10.5 10.3 10.1 9.9 9.8 10.1
14 Eurozone 11.6 11.1 10.6 10.2 9.8 9.4 10.2
15 Slovakia 13.2 12.1 11.6 10.9 9.9 9.2 10.7
16 Portugal 14.1 13.0 11.7 10.8 10.3 10.0 11.2
17 Italy 12.7 12.8 12.4 12.1 11.8 11.2 12.1
18 Cyprus 16.1 16.2 15.3 13.8 11.9 10.1 13.5
19 Spain 24.5 22.3 20.6 19.4 18.3 17.4 19.6
20 Greece 26.6 25.6 24.1 22.2 20.4 18.7 22.2
Government budget (% of GDP)
Rank 2014 2015 2016 2017 2018 2019 Difference 2015–19
1 Germany 0.7 1.1 0.6 0.5 0.3 0.2 –0.9
2 Luxembourg 0.6 0.1 0.0 0.0 0.0 0.0 –0.1
3 Latvia –1.4 –1.4 –1.4 –1.4 –1.4 –1.4 0.0
4 Estonia 0.6 –0.1 –0.4 –0.1 0.1 0.3 0.4
5 Lithuania –0.7 –0.7 –0.8 –0.6 –0.5 –0.3 0.4
6 Malta –2.1 –2.0 –1.7 –1.5 –1.4 –1.2 0.8
7 Netherlands –2.4 –1.9 –1.6 –1.5 –1.3 –1.0 0.9
8 Eurozone –2.4 –2.0 –1.7 –1.3 –1.1 –0.9 1.1
9 Austria –2.4 –2.1 –1.7 –1.2 –0.9 –0.9 1.2
10 Greece –3.5 –3.1 –2.8 –2.6 –2.3 –1.9 1.2
11 Slovenia –4.9 –3.9 –3.1 –2.8 –2.6 –2.5 1.4
12 Italy –3.0 –2.7 –2.0 –1.5 –1.3 –1.1 1.6
13 Cyprus –8.8 –2.9 –2.4 –2.2 –2.1 –1.2 1.7
14 Slovakia –2.9 –2.9 –2.0 –1.9 –1.3 –1.2 1.7
15 Belgium –3.2 –1.9 –1.6 –0.8 –0.3 0.0 1.9
16 France –4.0 –4.3 –4.0 –3.3 –2.6 –2.4 1.9
17 Ireland –4.1 –1.9 –0.8 0.0 0.2 0.1 2.0
18 Finland –3.2 –2.8 –1.9 –1.2 –0.8 –0.7 2.1
19 Portugal –4.5 –3.1 –2.5 –1.9 –1.4 –1.0 2.1
20 Spain –5.8 –4.3 –3.3 –2.5 –2.1 –1.8 2.5
Cross-country tables
52 EY Eurozone Forecast June 2015

Eurozone Forecast – March 2015You can select multiple countries to display on the chart.
Clear selection
GDP
Private Consumption
Fixed Investment
Stockbuilding
Government Consumption
Exports of Goods and Services
Imports of Goods and Services
Consumer Prices
Unemployment rate
Current Account Balance
Government Budget
Government Debt
Select a year to compare: 2013 2014 2015 2016 2017 2018
Trend analysis
Country
Germany
France
Italy
Spain
Netherlands
Belgium
Austria
Greece
Finland
Ireland
Portugal
Slovakia
Luxembourg
Slovenia
C
10
0.7
1.5
2.4
3.2
4.0
0.0
1.0
2.0
3.0
4.0
- 4.0- 2.0
0.02.0
4.0
- 0.1 0.2 0.4 0.7 1.00.1
0.61.0
1.52.0
2.0
4.0
6.0
8.0
10
1.7
3.8
5.8
7.9
10
0.3
0.7
1.2
1.6
2.0
2.04.0
6.08.0
10
0.42.85.27.6- 3.1
- 2.2- 1.4
- 0.50.4
20
40
60
80
100
Macroeconomic data and analysis
Learn more about the EY Eurozone Forecast at ey.com/eurozone:
• Download the latest EY Eurozone Forecast and individual forecasts for the 19 member states.
• Use our dynamic Eurochart to compare country
• Use the trend-analysis tool to compare forecasts
19 Eurozone nations.
• Theservices explores the implications of the latest Eurozone economic forecasts for banks, asset managers and insurers.
• Our latest forecast sees improving GDP, growth in consumer spending and falling unemployment across the Eurozone.
• Learn more and download the report at ey.com/fseurozone.
• EY’s attractiveness surveys are annual reports that examine the attractiveness of selected nations and regions to foreign investors.
• EY’s attractiveness survey: Europe 2015 Europe remains the world’s top destination for foreign direct investment.
• Learn more and download the report at ey.com/attractiveness.
EY Eurozone Forecast: outlook for
— Spring 2015
EY’s attractiveness survey: Europe 2015

About EYEY is a global leader in assurance, tax, transaction and advisory services. The insights and quality services we deliver help build trust and confidence in the capital markets and in economies the world over. We develop outstanding leaders who team to deliver on our promises to all of our stakeholders. In so doing, we play a critical role in building a better working world for our people, for our clients and for our communities.
EY refers to the global organization, and may refer to one or more, of the member firms of Ernst & Young Global Limited, each of which is a separate legal entity. Ernst & Young Global Limited, a UK company limited by guarantee, does not provide services to clients. For more information about our organization, please visit ey.com.
© 2015 EYGM Limited. All Rights Reserved.
EYG no. AU3276
BMC AgencyGA 0401_01976
ED None
In line with EY’s commitment to minimize its impact on the environment, this document has been printed on paper with a high recycled content.
This material has been prepared for general informational purposes only and is not intended to be relied upon as accounting, tax, or other professional advice. Please refer to your advisors for specific advice.
The views of third parties set out in this publication are not necessarily the views of the global EY organization or its member firms. Moreover, they should be seen in the context of the time they were made.
ey.com
About Oxford EconomicsOxford Economics was founded in 1981 to provide independent forecasting and analysis tailored to the needs of economists and planners in government and business. It is now one of the world’s leading providers of economic analysis, advice and models, with over 850 clients including international organizations, government departments and central banks around the world, and a large number of multinational blue-chip companies across the whole industrial spectrum.
Oxford Economics commands a high degree of professional and technical expertise, both in its own staff of over 150, including 90 economists, based in Oxford, London, Belfast, Paris, the UAE, Singapore, New York and Philadelphia, and through its close links with Oxford University and a range of partner institutions in Europe and the US. Oxford Economics’ services include forecasting for 200 countries, 100 sectors, and 3,000 cities and
The forecasts presented in this report are based on information obtained from public sources that we consider to be reliable but we assume no liability for their completeness or accuracy. The analysis presented in this report is for information purposes only and Oxford Economics does not warrant that its forecasts, projections, advice and/or recommendations will be accurate or achievable. Oxford Economics will not be liable for the contents of any of the foregoing or for the reliance by readers on any of the foregoing.
EY | Assurance | Tax | Transactions | Advisory