Extreme rainfall signatures under changing climate … rainfall signatures under changing climate in...
20
Page 1 of 20 ATMOSPHERIC SCIENCES | RESEARCH ARTICLE Extreme rainfall signatures under changing climate in semi-arid northern highlands of Ethiopia Gebremedhin Kiros, Amba Shetty and Lakshman Nandagiri Cogent Geoscience (2017), 3: 1353719
Transcript of Extreme rainfall signatures under changing climate … rainfall signatures under changing climate in...

Page 1 of 20
ATMOSPHERIC SCIENCES | RESEARCH ARTICLE
Extreme rainfall signatures under changing climate in semi-arid northern highlands of EthiopiaGebremedhin Kiros, Amba Shetty and Lakshman Nandagiri
Cogent Geoscience (2017), 3: 1353719
Kiros et al., Cogent Geoscience (2017), 3: 1353719https://doi.org/10.1080/23312041.2017.1353719
ATMOSPHERIC SCIENCES | RESEARCH ARTICLE
Extreme rainfall signatures under changing climate in semi-arid northern highlands of EthiopiaGebremedhin Kiros1,2,3*, Amba Shetty1 and Lakshman Nandagiri1
Abstract: Statistical analysis of continuous daily climate data and extensive weath-er records are important to evaluate possible long-term, hydrologic/climatic chang-es at local and regional scales. In the present study, daily rainfall data recorded in the period 1971–2013 (43 years) at seven meteorological stations distributed in the Geba River basin, northern Ethiopia were used to study trends in extreme rainfall indices at different temporal scales. The selected rainfall indices focus on intensity, frequency, and duration of extreme rainfall measures. The Mann– Kendall trend test results show that decreasing tendencies in the rainfall indices have predominantly observed in several stations, even though most of the stations did not show statisti-cally significant trend over time at 95% significance level during the study period. In majority of the extreme rainfall indices, station Abiadi which is located at the down-stream of the basin showed statistically significant increasing trend, while decreas-ing trend in very heavy rainfall days (R20mm) for Adigrat station, and consecutive dry days (CDD) and highest rainfall amount in one-day period (RX1day) for Mek’ele
*Corresponding author: Gebremedhin Kiros, Department of Applied Mechanics and Hydraulics, National Institute of Technology Karnataka, Surathkal, Mangalore 575 025, India; Department of Soil Resources and Watershed Management, Aksum University, Shire campus: Shire Endaselassie, P.O. Box 314, Aksum, Ethiopia; Tigray Water Works Construction Enterprise, P.O. Box 1283, Mekelle, Tigray, EthiopiaE-mail: [email protected]
Reviewing editor:Nir Krakauer, City College of New York, USA
Additional information is available at the end of the article
ABOUT THE AUTHORSGebremedhin Kiros has awarded a PhD degree in Hydraulics and Water Resources Engineering in the year 2016 from National Institute of Technology Karnataka, Surathkal, India. He is currently working as an assistant professor, Aksum University, Ethiopia. He has published eight technical papers and consulted two industrial projects.
Amba Shetty, PhD, is currently working as an associate professor in the Department of Applied Mechanics & Hydraulics, National Institute of Technology Karnataka, Surathkal, India. She has awarded 3 doctoral research scholars, supervising more than 7 PhD research scholars and supervised more than 50 Master’s Students Dissertation. She has published 40+ technical papers in international/national journals and conferences and she has consulted 5+ industrial projects.
Lakshman Nandagiri, PhD, is currently serving as a professor in the Department of Applied Mechanics & Hydraulics, National Institute of Technology Karnataka, Surathkal, India. He has awarded more than 10 doctoral research scholars and supervised more than 50 Master’s Students Dissertation. He has published 100+ technical papers in international/national journals and conferences. Moreover, he has consulted 10+ industrial projects.
PUBLIC INTEREST STATEMENTExtreme rainfall events are meteorological threats that cause great destruction and many casualties in the biosphere. This paper examines the trends in extreme rainfall from seven daily time series in northern Highlands of Ethiopia. Rainfall data were converted into indices. In total, 12 indices were used for daily extreme rainfall. A Mann–Kendall non-parametric trend test for trend detection was used to evaluate the existence of monotonic trends in these rainfall data. Results showed that decreasing tendencies in the rainfall indices have predominantly detected in several stations, though most of the stations did not show statistically significant trend over time at 95% significance level during the span of the study period. These results could enhance the implementation of adaptation systems to flood risk.
Received: 09 November 2016Accepted: 04 July 2017First Published: 13 July 2017
© 2017 The Author(s). This open access article is distributed under a Creative Commons Attribution (CC-BY) 4.0 license.
Page 2 of 20
Gebremedhin Kiros
Page 3 of 20
Kiros et al., Cogent Geoscience (2017), 3: 1353719https://doi.org/10.1080/23312041.2017.1353719
showed statistically significant at the 95% level of significance. Results of this study contribute to climate change research in the region and provide inputs for better planning toward adapting to changing climate.
Subjects: Climatology; Meteorology; Earth Systems Science; Surface Hydrology; Environ-mental Studies; Environmental Change & Pollution; Statistics
Keywords: climate change; Geba catchment; Mann–Kendall; northern Ethiopia; rainfall indices; trend analysis
1. IntroductionThe changes at local, regional, and global rainfall have been experienced throughout at different time scales over the past decades, which are expected to result from changes in climate and varia-bility. Particularly, as a result of the predicted impact on the public and ecosystems, changes in ex-treme rainfall are of major concern; an extreme weather or climate occurrence is usually defined as that have extreme values of certain important meteorological variables above (or below) a given pre-existing high thresholds near the upper (or lower) climaxes of the range of detected standards of the variable (IPCC, 2012). In fact, climatic variability can be described as the annual differences in values of particular climatic variables where large areas of the earth represent inconsistency. As part of their normal climate over both limited duration and long-lasting periods and climate projections recommend that inconsistency is likely to increase extreme weather events in the future and might become more frequent in sub-Saharan Africa (Cooper et al., 2008; Field, 2012; Omondi, Awange, Forootan, Ogallo, & Barakiza, 2013). However, climate change and projections are dispiriting, chal-lenging, and complex to understand at different levels as the impacts, risks, and uncertainty with the science about the subject. At present, perhaps this is true that in the entire science of meteorology and climatology the subject of change in climate is one of the most debatable scenarios (Kalumba et al., 2013). Rainfall is the principal element of weather systems, so that examination of monthly, annual, and seasonal trend analyses of historical climatic parameter and its behavior is significant for thoughtful the climate variability. It is also crucial as baseline for the impact assessment of cli-mate changes on water resources and natural behavior of ecosystem as a whole in semi-arid envi-ronment because rainfall is highly variable spatially across the globe using various statistical procedures (Opiyo, Nyangito, Wasonga, & Omendi, 2014; Wagesho, Goel, & Jain, 2013).
At the global scale several studies have conducted for the indices of extreme rainfall and have reported consistently increasing trends, nevertheless the findings may differ at local and regional level. Unpredicted differences in rainfall characteristics and changes over small distances cannot be ignored, regardless of general trends, relevant generating mechanisms, the local rainfall arrange-ment, and other specificities. Some examples of these studies are the following: for global scale, Frich et al. (2002), Alexander et al. (2006) and IPCC (2007) for the western Indian Ocean countries, Vincent et al. (2011), Wang, Chen, and Chen (2013), Zhai, Zhang, Wan, and Pan (2005) and Jiang, Hu, Wang, Zhang, and Tong (2013) for China; Alexander et al. (2007) for Australia; Aguilar et al. (2005) for Central America and northern South America; Zhang et al. (2010) for Canada; New et al. (2006) for southern and western Africa; Klein Tank et al. (2006) for Central and southern Asia; at the European level, Moberg and Jones (2005), Moberg, Jones, Lister, and Walther (2006) and Karagiannidis, Karacostas, Maheras, and Makrogiannis (2012), Xoplaki, González-Rouco, Luterbacher, and Wanner (2004), Norrant and Douguédroit (2006) for the Mediterranean region; Van den Besselaar, Klein Tank, and Buishand (2012) and García-Barrón, Morales, and Sousa (2013) for main-land Portugal. Across eastern Africa region, there are climatic trends studied previously (Moyo et al., 2012; Mwangi & Desanker, 2007; Opiyo et al., 2014; Schreck & Semazzi, 2004; Wagesho et al., 2013) revealed that within the arid and semi-arid environments there has been high inter-annual rainfall variations in the region. Over the past decades, Deressa, Hassan, and Ringler (2011) observed a complex rainfall pattern was characterized by irregular trends for the past 50 years in southern Ethiopia. On the other hand, Afewerki (2012) discovered except one station showed increasing trend while statistically insignificant all the stations showed deceasing trends in the mean annual rainfall
Page 4 of 20
Kiros et al., Cogent Geoscience (2017), 3: 1353719https://doi.org/10.1080/23312041.2017.1353719
of analysis in the northern Ethiopia. Furthermore, Angassa and Oba (2007) revealed deceasing trends in the mean annual rainfall analysis at Borana in the southern Ethiopia.
In general there is a declining trend in most of the stations, though there is no statistically signifi-cant extreme rainfall trend have been identified for the Geba River basin except one station Abiadi which showed statistically significant increasing trend for most of the extreme rainfall indices. Hence, the findings of this study are in agreement with some other studies that examined changes in rainfall in East Africa, where some studies found a slight existence of decreasing leaning in extreme rainfall indices; Seleshi and Zanke (2004), Seleshi and Demaree (1995). In contrast, they reported that over the northwestern and southern Ethiopia there was no recent trend in rainfall for the period 1965 to 2002. Bewket and Conway (2007) reported incongruous results in the annual and seasonal rainfall trends within the stations of the region while allowing for rainfall data of the Amhara Region (northwest Ethiopia). On the other hand, other studies did not show any substantial trend in the northern and northeastern part of the nation (Cheung, Senay, & Singh, 2008; Meze-Hausken, 2004; Seleshi & Camberlin, 2006). Therefore, in the arid and semi-arid environments it was concluded that variability in rainfall at different scales is seen as normal occurrence. Comparably, in the neighboring country Kenya, in the predominantly arid and semi-arid environments different studies suggest that there is slightly significant rainfall variation from year to year and these trends may continue with increasing the wet season and at the same time offsetting decrease in the drier months (Opiyo et al., 2014).
It is crucial to mitigate the adverse impact of change in climate and variation while understanding climatic trends and magnitude and would guide the community to make strategic, long-term deci-sions that affect their future wellbeing. The aim of this study is mainly to evaluate extreme daily rainfall signatures under changing the climate in semi-arid environments of the Geba River Basin located in northern Ethiopia. The main objective of this study is detection and analysis of significant trends or fluctuations in historical extreme rainfall recorded at seven meteorological stations spanning the period 1971–2013 (43 years) within the basin using non-parametric Mann–Kendall statistical test approach.
2. Material and methods
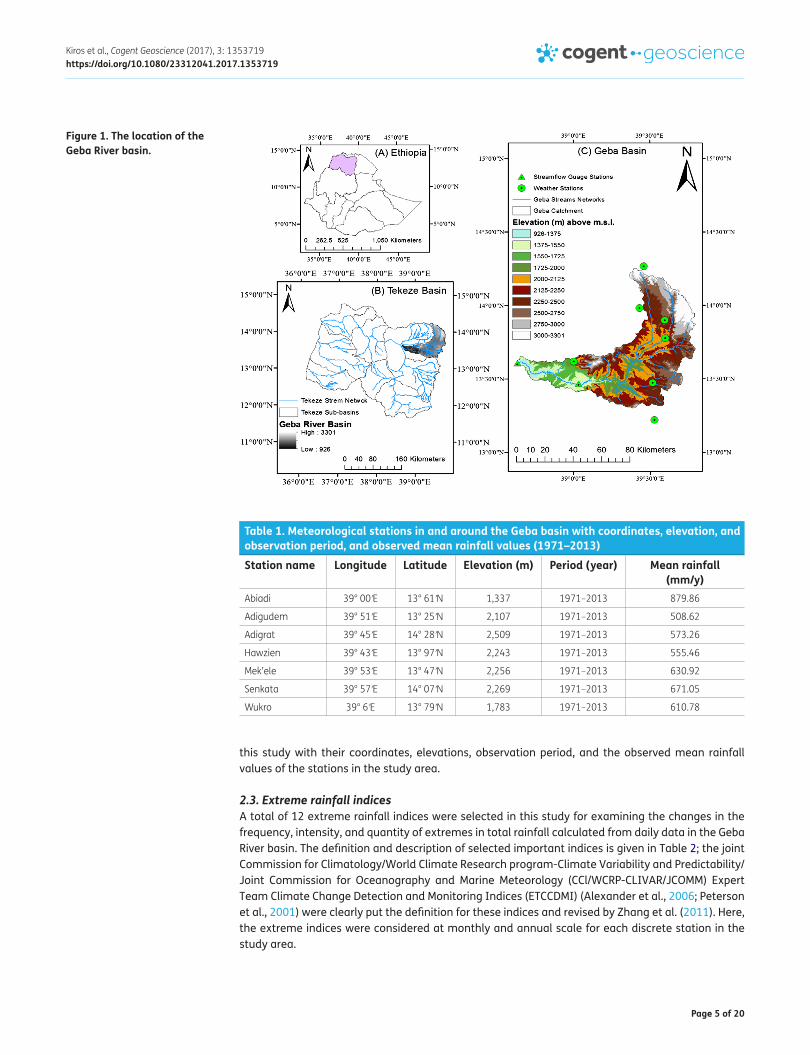
2.1. Study areaThe Geba River basin, located in northern Ethiopia between 38°38′E and 39°48′E and 13°18′N and 14°15′N, is a major tributary of the Tekeze (the Sudanese called Atbara) River, which is the last tribu-tary of the Nile (Figure 1). The basin is surrounded by the Danakil basin in the east, by the Tekeze River basin in the south and the Werie River basin in the west. The Geba River originates from the Mugulat mountains near Adigrat in the north and the Atsbi horst in the northeast and flows south and then westward to join the River Tekeze on its way to Sudan (Zenebe et al., 2013). The basin has a total area of 5,137 km2. The Geba joins the Tekeze River at the confluence known as Chemoy. The elevation ranges from 920 m above mean sea level at Chemoy valley at the last outlet point where it joins the Tekeze River to 3,301 m above mean sea level at the Mugulat Mountains near Adigrat. Climatic conditions in the study area are quite diverse due to considerable differences in the altitude and relief. About 80% of the annual rainfall in the Geba basin occurs in the Kiremt (rainy) season from June to September and 63% of the annual rainfall is the peak which is recorded in July and August. The mean temperature varies from a minimum average of 6.5°C in the Atsbi plateaus to a maximum average of 32°C at Agbe in the Avergele lowlands.
2.2. Data usedDaily rainfall data series for 18 stations in and around the Geba basin were obtained from the Ethiopia National Meteorological Agency. Only seven stations were taken for analysis after quality control which is subjected to homogeneity test and these are Abiadi, Adigudem, Adigrat, Hawzien, Mek’ele, Senkata, and Wukro for the period of 1971–2013. Table 1 lists the climate stations used in
Page 5 of 20
Kiros et al., Cogent Geoscience (2017), 3: 1353719https://doi.org/10.1080/23312041.2017.1353719
this study with their coordinates, elevations, observation period, and the observed mean rainfall values of the stations in the study area.
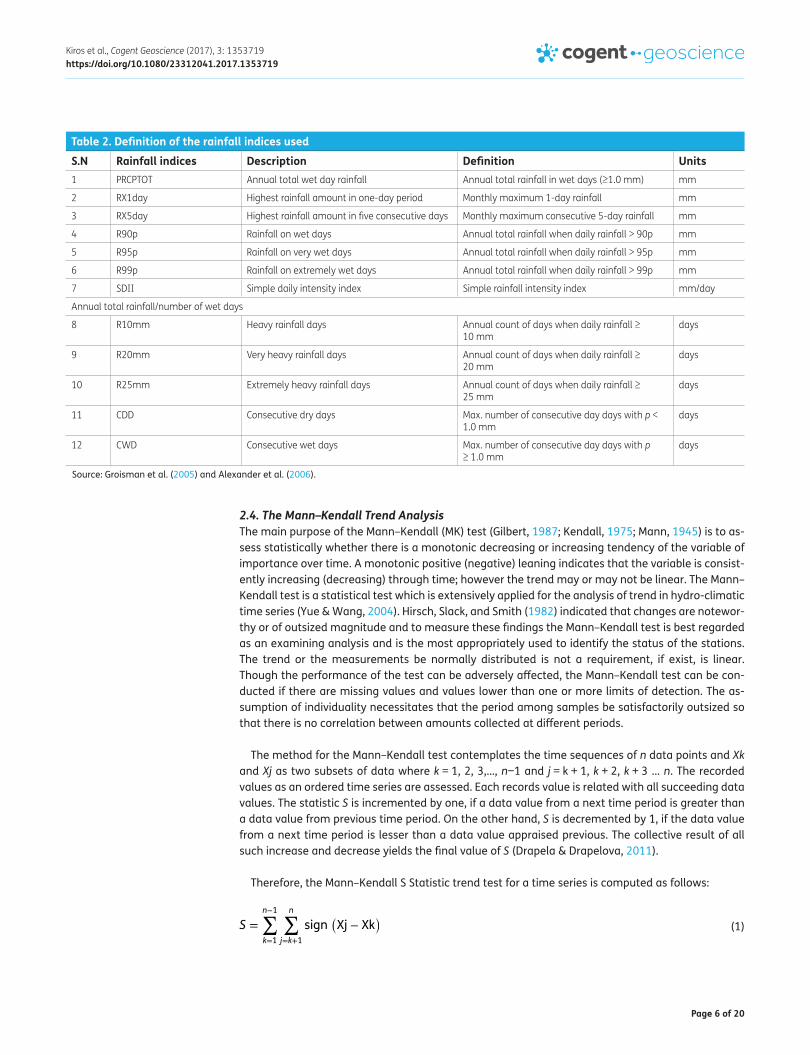
2.3. Extreme rainfall indicesA total of 12 extreme rainfall indices were selected in this study for examining the changes in the frequency, intensity, and quantity of extremes in total rainfall calculated from daily data in the Geba River basin. The definition and description of selected important indices is given in Table 2; the joint Commission for Climatology/World Climate Research program-Climate Variability and Predictability/Joint Commission for Oceanography and Marine Meteorology (CCl/WCRP-CLIVAR/JCOMM) Expert Team Climate Change Detection and Monitoring Indices (ETCCDMI) (Alexander et al., 2006; Peterson et al., 2001) were clearly put the definition for these indices and revised by Zhang et al. (2011). Here, the extreme indices were considered at monthly and annual scale for each discrete station in the study area.
Figure 1. The location of the Geba River basin.
Table 1. Meteorological stations in and around the Geba basin with coordinates, elevation, and observation period, and observed mean rainfall values (1971–2013)Station name Longitude Latitude Elevation (m) Period (year) Mean rainfall
(mm/y)Abiadi 39° 00ʹE 13° 61ʹN 1,337 1971–2013 879.86
Adigudem 39° 51ʹE 13° 25ʹN 2,107 1971–2013 508.62
Adigrat 39° 45ʹE 14° 28ʹN 2,509 1971–2013 573.26
Hawzien 39° 43ʹE 13° 97ʹN 2,243 1971–2013 555.46
Mek’ele 39° 53ʹE 13° 47ʹN 2,256 1971–2013 630.92
Senkata 39° 57ʹE 14° 07ʹN 2,269 1971–2013 671.05
Wukro 39° 6ʹE 13° 79ʹN 1,783 1971–2013 610.78
Page 6 of 20
Kiros et al., Cogent Geoscience (2017), 3: 1353719https://doi.org/10.1080/23312041.2017.1353719
2.4. The Mann–Kendall Trend AnalysisThe main purpose of the Mann–Kendall (MK) test (Gilbert, 1987; Kendall, 1975; Mann, 1945) is to as-sess statistically whether there is a monotonic decreasing or increasing tendency of the variable of importance over time. A monotonic positive (negative) leaning indicates that the variable is consist-ently increasing (decreasing) through time; however the trend may or may not be linear. The Mann–Kendall test is a statistical test which is extensively applied for the analysis of trend in hydro-climatic time series (Yue & Wang, 2004). Hirsch, Slack, and Smith (1982) indicated that changes are notewor-thy or of outsized magnitude and to measure these findings the Mann–Kendall test is best regarded as an examining analysis and is the most appropriately used to identify the status of the stations. The trend or the measurements be normally distributed is not a requirement, if exist, is linear. Though the performance of the test can be adversely affected, the Mann–Kendall test can be con-ducted if there are missing values and values lower than one or more limits of detection. The as-sumption of individuality necessitates that the period among samples be satisfactorily outsized so that there is no correlation between amounts collected at different periods.
The method for the Mann–Kendall test contemplates the time sequences of n data points and Xk and Xj as two subsets of data where k = 1, 2, 3,…, n−1 and j = k + 1, k + 2, k + 3 … n. The recorded values as an ordered time series are assessed. Each records value is related with all succeeding data values. The statistic S is incremented by one, if a data value from a next time period is greater than a data value from previous time period. On the other hand, S is decremented by 1, if the data value from a next time period is lesser than a data value appraised previous. The collective result of all such increase and decrease yields the final value of S (Drapela & Drapelova, 2011).
Therefore, the Mann–Kendall S Statistic trend test for a time series is computed as follows:
(1)S =
n−1∑k=1
n∑j=k+1
sign(Xj − Xk
)
Table 2. Definition of the rainfall indices used
Source: Groisman et al. (2005) and Alexander et al. (2006).
S.N Rainfall indices Description Definition Units1 PRCPTOT Annual total wet day rainfall Annual total rainfall in wet days (≥1.0 mm) mm
2 RX1day Highest rainfall amount in one-day period Monthly maximum 1-day rainfall mm
3 RX5day Highest rainfall amount in five consecutive days Monthly maximum consecutive 5-day rainfall mm
4 R90p Rainfall on wet days Annual total rainfall when daily rainfall > 90p mm
5 R95p Rainfall on very wet days Annual total rainfall when daily rainfall > 95p mm
6 R99p Rainfall on extremely wet days Annual total rainfall when daily rainfall > 99p mm
7 SDII Simple daily intensity index Simple rainfall intensity index mm/day
Annual total rainfall/number of wet days
8 R10mm Heavy rainfall days Annual count of days when daily rainfall ≥ 10 mm
days
9 R20mm Very heavy rainfall days Annual count of days when daily rainfall ≥ 20 mm
days
10 R25mm Extremely heavy rainfall days Annual count of days when daily rainfall ≥ 25 mm
days
11 CDD Consecutive dry days Max. number of consecutive day days with p < 1.0 mm
days
12 CWD Consecutive wet days Max. number of consecutive day days with p ≥ 1.0 mm
days
Page 7 of 20
Kiros et al., Cogent Geoscience (2017), 3: 1353719https://doi.org/10.1080/23312041.2017.1353719
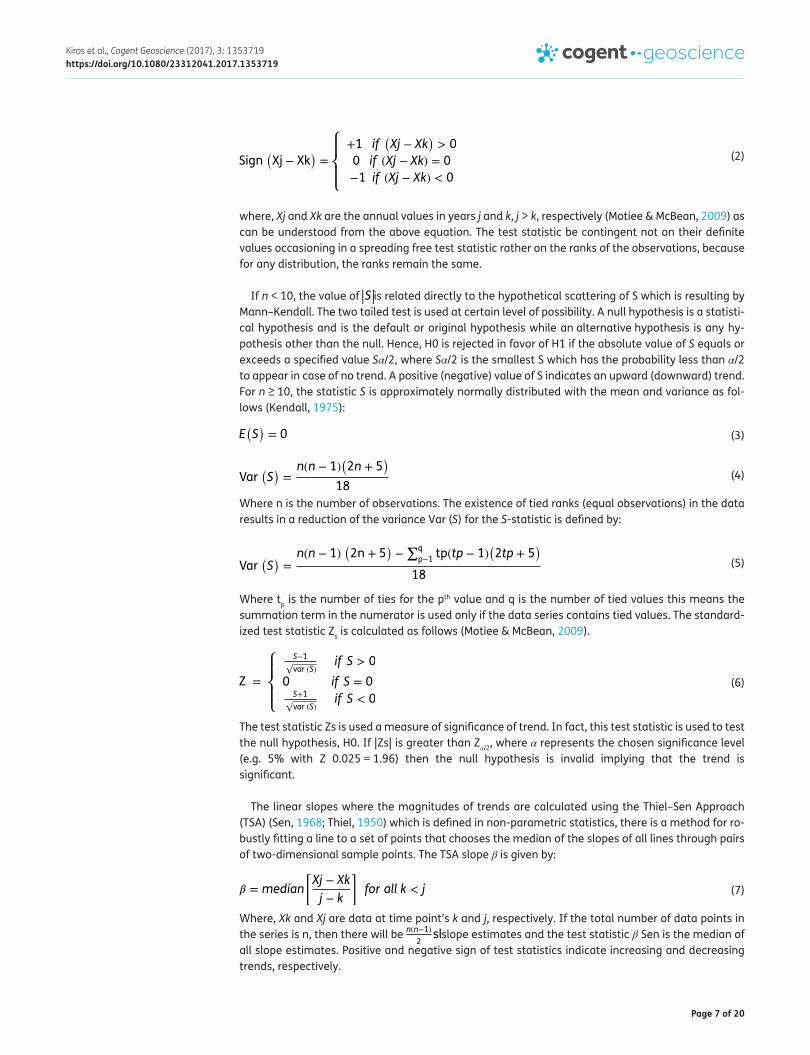
where, Xj and Xk are the annual values in years j and k, j > k, respectively (Motiee & McBean, 2009) as can be understood from the above equation. The test statistic be contingent not on their definite values occasioning in a spreading free test statistic rather on the ranks of the observations, because for any distribution, the ranks remain the same.
If n < 10, the value of ||S||is related directly to the hypothetical scattering of S which is resulting by Mann–Kendall. The two tailed test is used at certain level of possibility. A null hypothesis is a statisti-cal hypothesis and is the default or original hypothesis while an alternative hypothesis is any hy-pothesis other than the null. Hence, H0 is rejected in favor of H1 if the absolute value of S equals or exceeds a specified value Sα/2, where Sα/2 is the smallest S which has the probability less than α/2 to appear in case of no trend. A positive (negative) value of S indicates an upward (downward) trend. For n ≥ 10, the statistic S is approximately normally distributed with the mean and variance as fol-lows (Kendall, 1975):
Where n is the number of observations. The existence of tied ranks (equal observations) in the data results in a reduction of the variance Var (S) for the S-statistic is defined by:
Where tp is the number of ties for the pth value and q is the number of tied values this means the summation term in the numerator is used only if the data series contains tied values. The standard-ized test statistic Zs is calculated as follows (Motiee & McBean, 2009).
The test statistic Zs is used a measure of significance of trend. In fact, this test statistic is used to test the null hypothesis, H0. If |Zs| is greater than Zα/2, where α represents the chosen significance level (e.g. 5% with Z 0.025 = 1.96) then the null hypothesis is invalid implying that the trend is significant.
The linear slopes where the magnitudes of trends are calculated using the Thiel–Sen Approach (TSA) (Sen, 1968; Thiel, 1950) which is defined in non-parametric statistics, there is a method for ro-bustly fitting a line to a set of points that chooses the median of the slopes of all lines through pairs of two-dimensional sample points. The TSA slope β is given by:
Where, Xk and Xj are data at time point’s k and j, respectively. If the total number of data points in the series is n, then there will be n(n−1)
2slslope estimates and the test statistic β Sen is the median of
all slope estimates. Positive and negative sign of test statistics indicate increasing and decreasing trends, respectively.
(2)Sign�Xj − Xk
�=
⎧⎪⎨⎪⎩
+1 if�Xj − Xk
�> 0
0 if (Xj − Xk) = 0
−1 if (Xj − Xk) < 0
(3)E(S)= 0
(4)Var(S)=n(n − 1)
(2n + 5
)18
(5)Var�S�=n(n − 1)
�2n + 5
�−∑q
p−1tp(tp − 1)
�2tp + 5
�
18
(6)Z =
⎧⎪⎨⎪⎩
S−1√var (S)
if S > 0
0 if S = 0S+1√var (S)
if S < 0
(7)𝛽 = median
[Xj − Xk
j − k
]for all k < j
Page 8 of 20
Kiros et al., Cogent Geoscience (2017), 3: 1353719https://doi.org/10.1080/23312041.2017.1353719
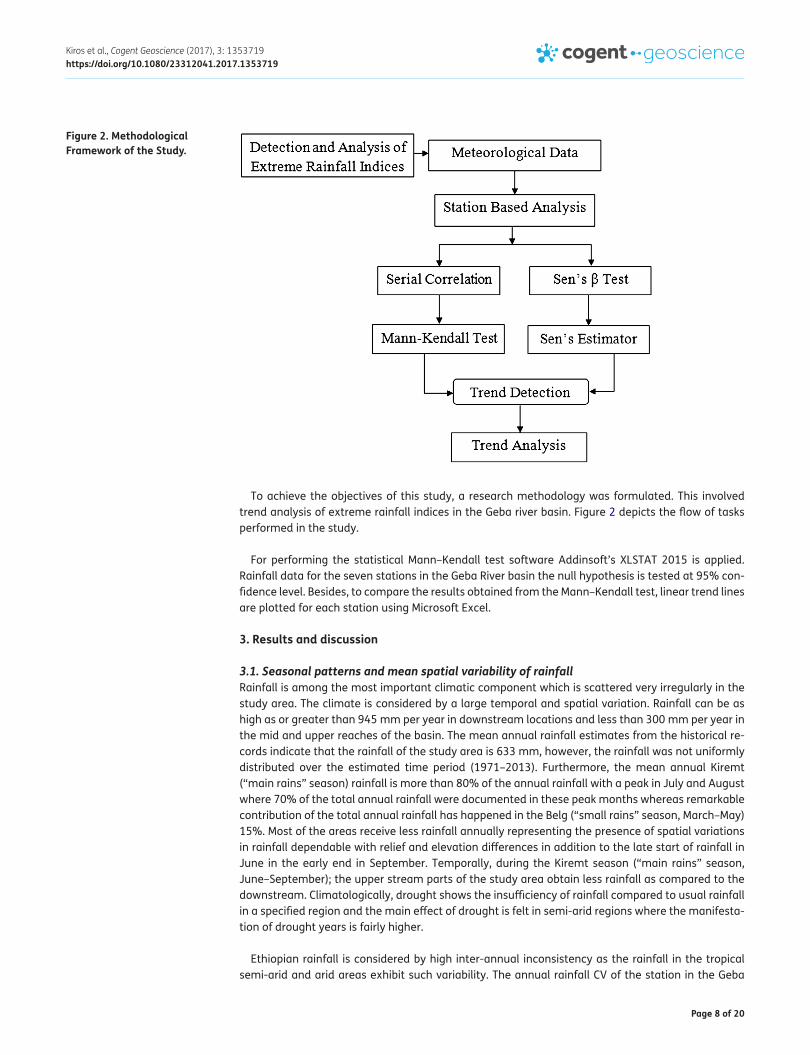
To achieve the objectives of this study, a research methodology was formulated. This involved trend analysis of extreme rainfall indices in the Geba river basin. Figure 2 depicts the flow of tasks performed in the study.
For performing the statistical Mann–Kendall test software Addinsoft’s XLSTAT 2015 is applied. Rainfall data for the seven stations in the Geba River basin the null hypothesis is tested at 95% con-fidence level. Besides, to compare the results obtained from the Mann–Kendall test, linear trend lines are plotted for each station using Microsoft Excel.
3. Results and discussion
3.1. Seasonal patterns and mean spatial variability of rainfallRainfall is among the most important climatic component which is scattered very irregularly in the study area. The climate is considered by a large temporal and spatial variation. Rainfall can be as high as or greater than 945 mm per year in downstream locations and less than 300 mm per year in the mid and upper reaches of the basin. The mean annual rainfall estimates from the historical re-cords indicate that the rainfall of the study area is 633 mm, however, the rainfall was not uniformly distributed over the estimated time period (1971–2013). Furthermore, the mean annual Kiremt (“main rains” season) rainfall is more than 80% of the annual rainfall with a peak in July and August where 70% of the total annual rainfall were documented in these peak months whereas remarkable contribution of the total annual rainfall has happened in the Belg (“small rains” season, March–May) 15%. Most of the areas receive less rainfall annually representing the presence of spatial variations in rainfall dependable with relief and elevation differences in addition to the late start of rainfall in June in the early end in September. Temporally, during the Kiremt season (“main rains” season, June–September); the upper stream parts of the study area obtain less rainfall as compared to the downstream. Climatologically, drought shows the insufficiency of rainfall compared to usual rainfall in a specified region and the main effect of drought is felt in semi-arid regions where the manifesta-tion of drought years is fairly higher.
Ethiopian rainfall is considered by high inter-annual inconsistency as the rainfall in the tropical semi-arid and arid areas exhibit such variability. The annual rainfall CV of the station in the Geba
Figure 2. Methodological Framework of the Study.
Page 9 of 20
Kiros et al., Cogent Geoscience (2017), 3: 1353719https://doi.org/10.1080/23312041.2017.1353719
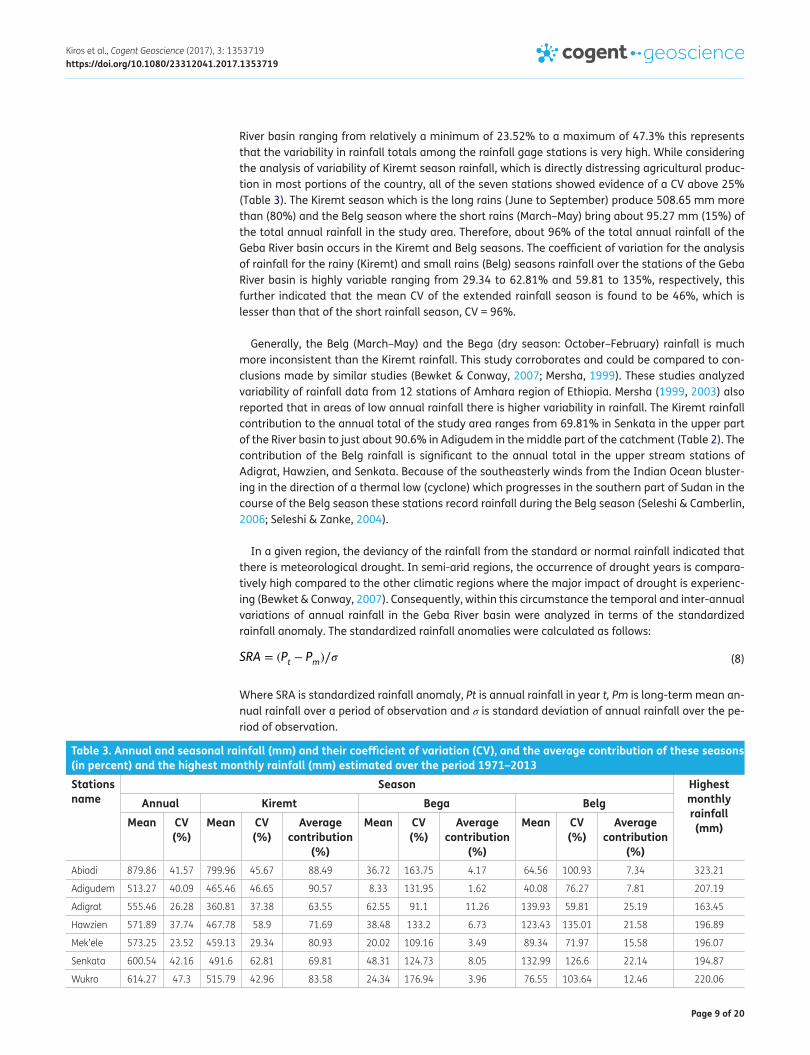
River basin ranging from relatively a minimum of 23.52% to a maximum of 47.3% this represents that the variability in rainfall totals among the rainfall gage stations is very high. While considering the analysis of variability of Kiremt season rainfall, which is directly distressing agricultural produc-tion in most portions of the country, all of the seven stations showed evidence of a CV above 25% (Table 3). The Kiremt season which is the long rains (June to September) produce 508.65 mm more than (80%) and the Belg season where the short rains (March–May) bring about 95.27 mm (15%) of the total annual rainfall in the study area. Therefore, about 96% of the total annual rainfall of the Geba River basin occurs in the Kiremt and Belg seasons. The coefficient of variation for the analysis of rainfall for the rainy (Kiremt) and small rains (Belg) seasons rainfall over the stations of the Geba River basin is highly variable ranging from 29.34 to 62.81% and 59.81 to 135%, respectively, this further indicated that the mean CV of the extended rainfall season is found to be 46%, which is lesser than that of the short rainfall season, CV = 96%.
Generally, the Belg (March–May) and the Bega (dry season: October–February) rainfall is much more inconsistent than the Kiremt rainfall. This study corroborates and could be compared to con-clusions made by similar studies (Bewket & Conway, 2007; Mersha, 1999). These studies analyzed variability of rainfall data from 12 stations of Amhara region of Ethiopia. Mersha (1999, 2003) also reported that in areas of low annual rainfall there is higher variability in rainfall. The Kiremt rainfall contribution to the annual total of the study area ranges from 69.81% in Senkata in the upper part of the River basin to just about 90.6% in Adigudem in the middle part of the catchment (Table 2). The contribution of the Belg rainfall is significant to the annual total in the upper stream stations of Adigrat, Hawzien, and Senkata. Because of the southeasterly winds from the Indian Ocean bluster-ing in the direction of a thermal low (cyclone) which progresses in the southern part of Sudan in the course of the Belg season these stations record rainfall during the Belg season (Seleshi & Camberlin, 2006; Seleshi & Zanke, 2004).
In a given region, the deviancy of the rainfall from the standard or normal rainfall indicated that there is meteorological drought. In semi-arid regions, the occurrence of drought years is compara-tively high compared to the other climatic regions where the major impact of drought is experienc-ing (Bewket & Conway, 2007). Consequently, within this circumstance the temporal and inter-annual variations of annual rainfall in the Geba River basin were analyzed in terms of the standardized rainfall anomaly. The standardized rainfall anomalies were calculated as follows:
Where SRA is standardized rainfall anomaly, Pt is annual rainfall in year t, Pm is long-term mean an-nual rainfall over a period of observation and σ is standard deviation of annual rainfall over the pe-riod of observation.
(8)SRA = (Pt − Pm)∕�
Table 3. Annual and seasonal rainfall (mm) and their coefficient of variation (CV), and the average contribution of these seasons (in percent) and the highest monthly rainfall (mm) estimated over the period 1971–2013Stations name
Season Highest monthly rainfall (mm)
Annual Kiremt Bega BelgMean CV
(%)Mean CV
(%)Average
contribution (%)
Mean CV (%)
Average contribution
(%)
Mean CV (%)
Average contribution
(%)Abiadi 879.86 41.57 799.96 45.67 88.49 36.72 163.75 4.17 64.56 100.93 7.34 323.21
Adigudem 513.27 40.09 465.46 46.65 90.57 8.33 131.95 1.62 40.08 76.27 7.81 207.19
Adigrat 555.46 26.28 360.81 37.38 63.55 62.55 91.1 11.26 139.93 59.81 25.19 163.45
Hawzien 571.89 37.74 467.78 58.9 71.69 38.48 133.2 6.73 123.43 135.01 21.58 196.89
Mek’ele 573.25 23.52 459.13 29.34 80.93 20.02 109.16 3.49 89.34 71.97 15.58 196.07
Senkata 600.54 42.16 491.6 62.81 69.81 48.31 124.73 8.05 132.99 126.6 22.14 194.87
Wukro 614.27 47.3 515.79 42.96 83.58 24.34 176.94 3.96 76.55 103.64 12.46 220.06
Page 10 of 20
Kiros et al., Cogent Geoscience (2017), 3: 1353719https://doi.org/10.1080/23312041.2017.1353719
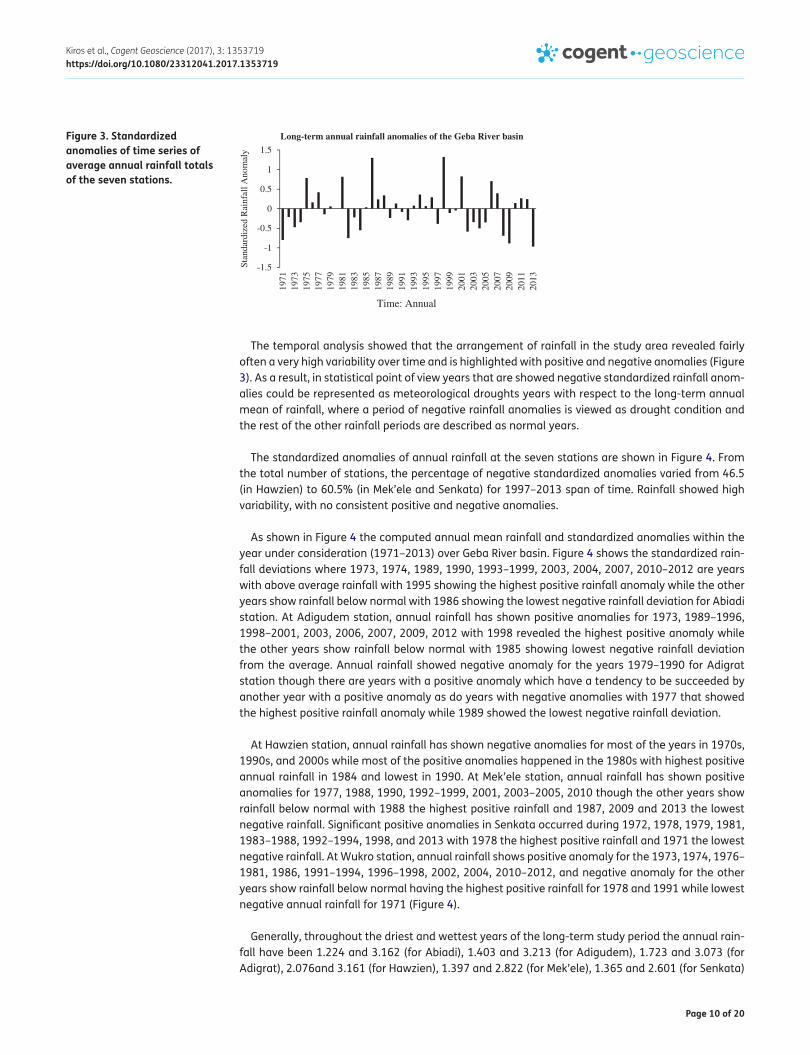
The temporal analysis showed that the arrangement of rainfall in the study area revealed fairly often a very high variability over time and is highlighted with positive and negative anomalies (Figure 3). As a result, in statistical point of view years that are showed negative standardized rainfall anom-alies could be represented as meteorological droughts years with respect to the long-term annual mean of rainfall, where a period of negative rainfall anomalies is viewed as drought condition and the rest of the other rainfall periods are described as normal years.
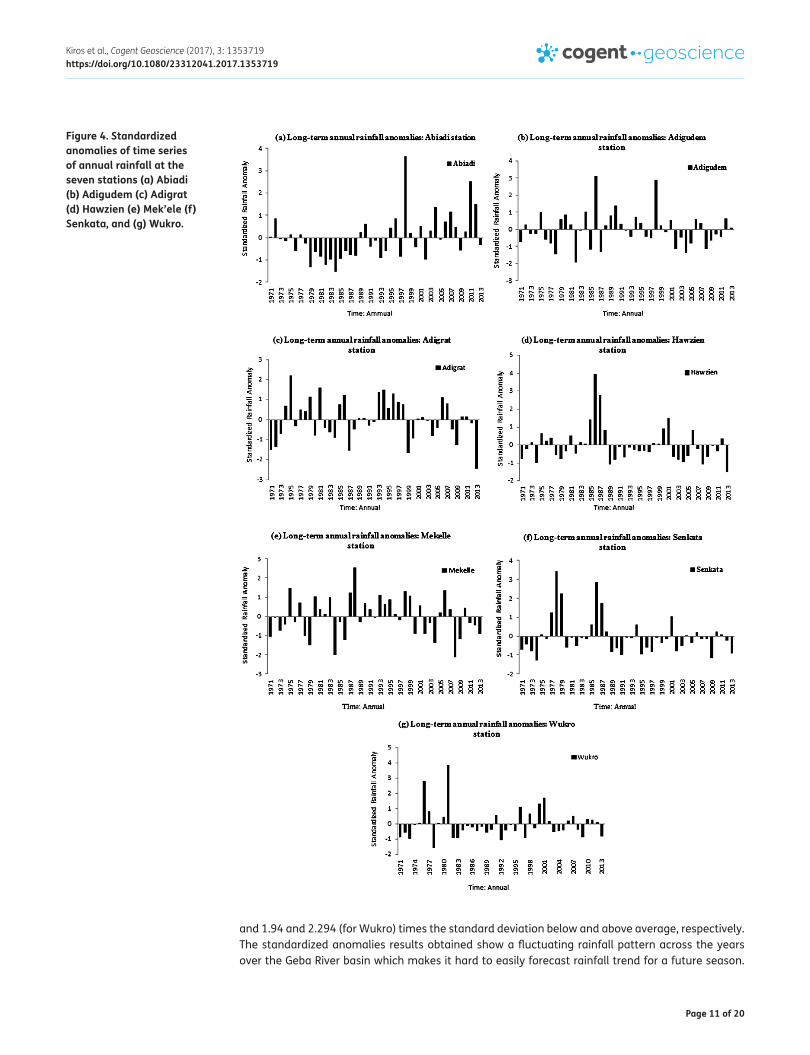
The standardized anomalies of annual rainfall at the seven stations are shown in Figure 4. From the total number of stations, the percentage of negative standardized anomalies varied from 46.5 (in Hawzien) to 60.5% (in Mek’ele and Senkata) for 1997–2013 span of time. Rainfall showed high variability, with no consistent positive and negative anomalies.
As shown in Figure 4 the computed annual mean rainfall and standardized anomalies within the year under consideration (1971–2013) over Geba River basin. Figure 4 shows the standardized rain-fall deviations where 1973, 1974, 1989, 1990, 1993–1999, 2003, 2004, 2007, 2010–2012 are years with above average rainfall with 1995 showing the highest positive rainfall anomaly while the other years show rainfall below normal with 1986 showing the lowest negative rainfall deviation for Abiadi station. At Adigudem station, annual rainfall has shown positive anomalies for 1973, 1989–1996, 1998–2001, 2003, 2006, 2007, 2009, 2012 with 1998 revealed the highest positive anomaly while the other years show rainfall below normal with 1985 showing lowest negative rainfall deviation from the average. Annual rainfall showed negative anomaly for the years 1979–1990 for Adigrat station though there are years with a positive anomaly which have a tendency to be succeeded by another year with a positive anomaly as do years with negative anomalies with 1977 that showed the highest positive rainfall anomaly while 1989 showed the lowest negative rainfall deviation.
At Hawzien station, annual rainfall has shown negative anomalies for most of the years in 1970s, 1990s, and 2000s while most of the positive anomalies happened in the 1980s with highest positive annual rainfall in 1984 and lowest in 1990. At Mek’ele station, annual rainfall has shown positive anomalies for 1977, 1988, 1990, 1992–1999, 2001, 2003–2005, 2010 though the other years show rainfall below normal with 1988 the highest positive rainfall and 1987, 2009 and 2013 the lowest negative rainfall. Significant positive anomalies in Senkata occurred during 1972, 1978, 1979, 1981, 1983–1988, 1992–1994, 1998, and 2013 with 1978 the highest positive rainfall and 1971 the lowest negative rainfall. At Wukro station, annual rainfall shows positive anomaly for the 1973, 1974, 1976–1981, 1986, 1991–1994, 1996–1998, 2002, 2004, 2010–2012, and negative anomaly for the other years show rainfall below normal having the highest positive rainfall for 1978 and 1991 while lowest negative annual rainfall for 1971 (Figure 4).
Generally, throughout the driest and wettest years of the long-term study period the annual rain-fall have been 1.224 and 3.162 (for Abiadi), 1.403 and 3.213 (for Adigudem), 1.723 and 3.073 (for Adigrat), 2.076and 3.161 (for Hawzien), 1.397 and 2.822 (for Mek’ele), 1.365 and 2.601 (for Senkata)
Figure 3. Standardized anomalies of time series of average annual rainfall totals of the seven stations.
-1.5
-1
-0.5
0
0.5
1
1.5
1971
1973
1975
1977
1979
1981
1983
1985
1987
1989
1991
1993
1995
1997
1999
2001
2003
2005
2007
2009
2011
2013
Stan
dard
ized
Rai
nfal
l Ano
mal
y
Time: Annual
Long-term annual rainfall anomalies of the Geba River basin
Page 11 of 20
Kiros et al., Cogent Geoscience (2017), 3: 1353719https://doi.org/10.1080/23312041.2017.1353719
and 1.94 and 2.294 (for Wukro) times the standard deviation below and above average, respectively. The standardized anomalies results obtained show a fluctuating rainfall pattern across the years over the Geba River basin which makes it hard to easily forecast rainfall trend for a future season.
Figure 4. Standardized anomalies of time series of annual rainfall at the seven stations (a) Abiadi (b) Adigudem (c) Adigrat (d) Hawzien (e) Mek’ele (f) Senkata, and (g) Wukro.
Page 12 of 20
Kiros et al., Cogent Geoscience (2017), 3: 1353719https://doi.org/10.1080/23312041.2017.1353719
The lower rainfall amounts in the meteorological drought years might have serious agricultural im-plications as most crops planted during this time have been adversely affected by this drought.
3.2. Observed trends and extreme rainfall indicesInformation regarding the extreme rainfall indices, such as in terms of rainfall type, frequency, in-tensity and extremes, etc., is specified in the Expert Team for Climate Change Detection Monitoring and Indices (ETCCDMI) (Alexander et al., 2006). The extreme rainfall indices can be categorized into two groups: one group calculates the frequency (number of cases) of the index exceeding or not exceeding its defined threshold (CDD, CWD, R10mm, R20mm and R25mm), while the second one measures the rainfall depth (mm) or intensity (mm per day) (RX1day, RX5day, PRCPTOT, SDII, R90P, R95P and R99P).The partition of magnitude and frequency is expected that can give an additional insight into the often slight differences of the climatic regions across the northern highlands of Ethiopia. In addition, it is likely obvious that these indices are also important for the probable impact assessment of climate changes on semi-arid and arid activities related to agriculture, water re-sources, sustainable development, and other sectors.
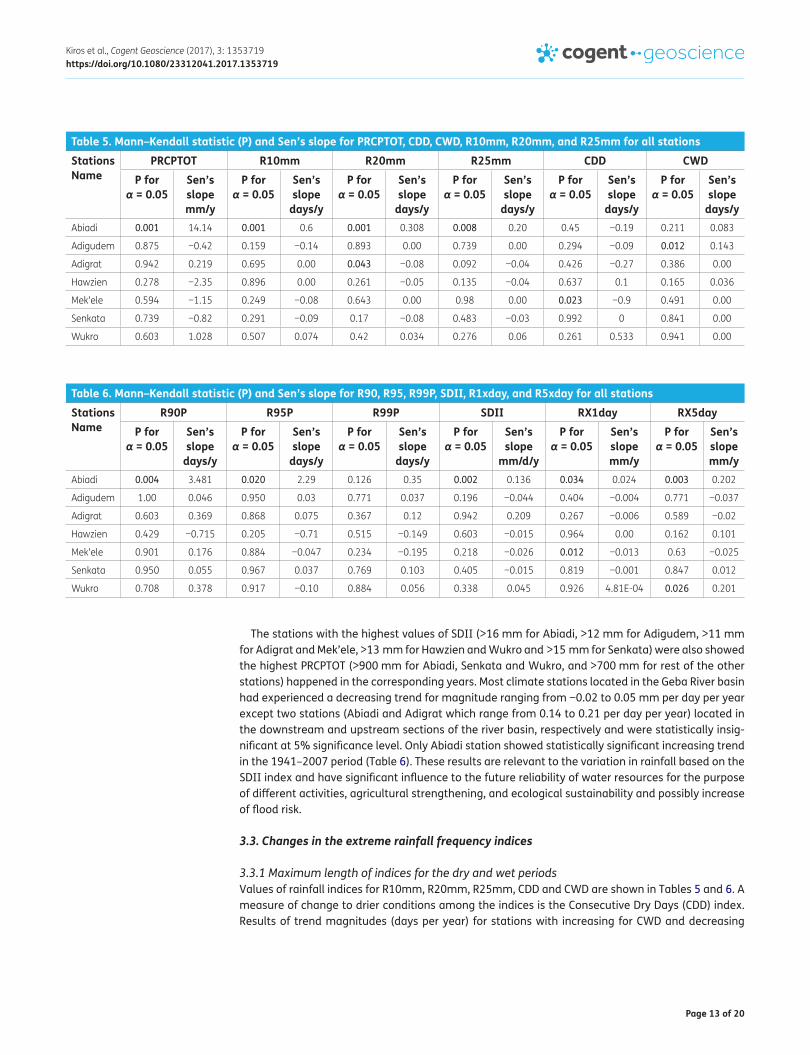
The time series trend analyses results of 12 extreme rainfall indices estimated over the period of 1971–2013 are summarized in Tables 4 and 5. Table 4 shows the frequency (number of cases) of the index exceeding or not exceeding its defined threshold in rainfall indices calculated individually for the 7 station’s data and the corresponding statistically significant results at the 5% significance level and the Sen’s magnitude. In addition, Table 5 shows the trends in the rainfall depth (mm) or inten-sity (mm per day) of the extreme rainfall indices and their corresponding Sen’s magnitude.
3.2.1. Trends in the wet-day annual total rainfall (PRECTOT) and simple daily rainfall intensity (SDII) IndicesGenerally any discussion on changes to extremes of rainfall begins with changes of PRCPTOT index at local and regional levels. This is probably the most important parameter reflecting rainfall varia-tions over the entire year which is one of twelve rainfall indices analyzed in this study. Positive trends in PRCPTOT occurred on stations Abiadi, Adigrat and Wukro indicated by the Sen’s slope that ranged from 0.21 to 14.14 mm per year (Table 5). However, only one station Abiadi that showed statistically significant positive trend at a 5% significance level. The remaining four stations showed decreasing trends and none of the stations showed statistically significant rainfall totals in the 1971 to 2013 period which decreased on average 1.2 mm per year.
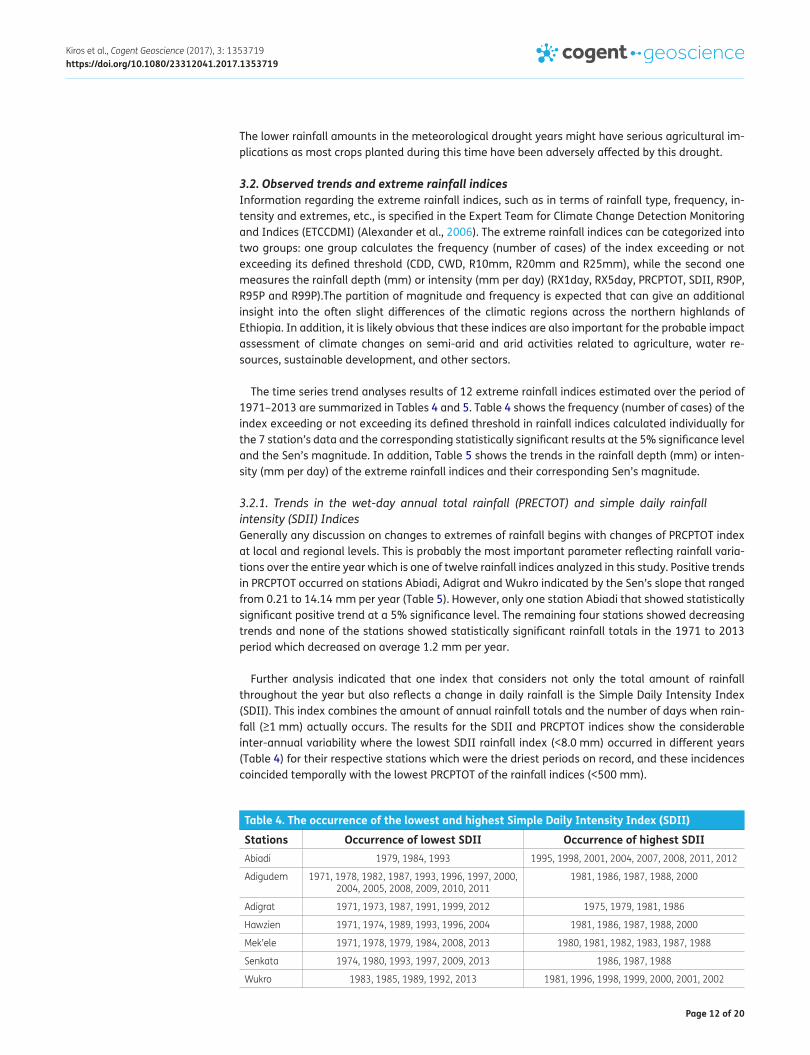
Further analysis indicated that one index that considers not only the total amount of rainfall throughout the year but also reflects a change in daily rainfall is the Simple Daily Intensity Index (SDII). This index combines the amount of annual rainfall totals and the number of days when rain-fall (≥1 mm) actually occurs. The results for the SDII and PRCPTOT indices show the considerable inter-annual variability where the lowest SDII rainfall index (<8.0 mm) occurred in different years (Table 4) for their respective stations which were the driest periods on record, and these incidences coincided temporally with the lowest PRCPTOT of the rainfall indices (<500 mm).
Table 4. The occurrence of the lowest and highest Simple Daily Intensity Index (SDII)Stations Occurrence of lowest SDII Occurrence of highest SDIIAbiadi 1979, 1984, 1993 1995, 1998, 2001, 2004, 2007, 2008, 2011, 2012
Adigudem 1971, 1978, 1982, 1987, 1993, 1996, 1997, 2000, 2004, 2005, 2008, 2009, 2010, 2011
1981, 1986, 1987, 1988, 2000
Adigrat 1971, 1973, 1987, 1991, 1999, 2012 1975, 1979, 1981, 1986
Hawzien 1971, 1974, 1989, 1993, 1996, 2004 1981, 1986, 1987, 1988, 2000
Mek’ele 1971, 1978, 1979, 1984, 2008, 2013 1980, 1981, 1982, 1983, 1987, 1988
Senkata 1974, 1980, 1993, 1997, 2009, 2013 1986, 1987, 1988
Wukro 1983, 1985, 1989, 1992, 2013 1981, 1996, 1998, 1999, 2000, 2001, 2002
Page 13 of 20
Kiros et al., Cogent Geoscience (2017), 3: 1353719https://doi.org/10.1080/23312041.2017.1353719
The stations with the highest values of SDII (>16 mm for Abiadi, >12 mm for Adigudem, >11 mm for Adigrat and Mek’ele, >13 mm for Hawzien and Wukro and >15 mm for Senkata) were also showed the highest PRCPTOT (>900 mm for Abiadi, Senkata and Wukro, and >700 mm for rest of the other stations) happened in the corresponding years. Most climate stations located in the Geba River basin had experienced a decreasing trend for magnitude ranging from −0.02 to 0.05 mm per day per year except two stations (Abiadi and Adigrat which range from 0.14 to 0.21 per day per year) located in the downstream and upstream sections of the river basin, respectively and were statistically insig-nificant at 5% significance level. Only Abiadi station showed statistically significant increasing trend in the 1941–2007 period (Table 6). These results are relevant to the variation in rainfall based on the SDII index and have significant influence to the future reliability of water resources for the purpose of different activities, agricultural strengthening, and ecological sustainability and possibly increase of flood risk.
3.3. Changes in the extreme rainfall frequency indices
3.3.1 Maximum length of indices for the dry and wet periodsValues of rainfall indices for R10mm, R20mm, R25mm, CDD and CWD are shown in Tables 5 and 6. A measure of change to drier conditions among the indices is the Consecutive Dry Days (CDD) index. Results of trend magnitudes (days per year) for stations with increasing for CWD and decreasing
Table 5. Mann–Kendall statistic (P) and Sen’s slope for PRCPTOT, CDD, CWD, R10mm, R20mm, and R25mm for all stationsStations Name
PRCPTOT R10mm R20mm R25mm CDD CWDP for
α = 0.05Sen’s slope mm/y
P for α = 0.05
Sen’s slope
days/y
P for α = 0.05
Sen’s slope
days/y
P for α = 0.05
Sen’s slope
days/y
P for α = 0.05
Sen’s slope
days/y
P for α = 0.05
Sen’s slope
days/yAbiadi 0.001 14.14 0.001 0.6 0.001 0.308 0.008 0.20 0.45 −0.19 0.211 0.083
Adigudem 0.875 −0.42 0.159 −0.14 0.893 0.00 0.739 0.00 0.294 −0.09 0.012 0.143
Adigrat 0.942 0.219 0.695 0.00 0.043 −0.08 0.092 −0.04 0.426 −0.27 0.386 0.00
Hawzien 0.278 −2.35 0.896 0.00 0.261 −0.05 0.135 −0.04 0.637 0.1 0.165 0.036
Mek’ele 0.594 −1.15 0.249 −0.08 0.643 0.00 0.98 0.00 0.023 −0.9 0.491 0.00
Senkata 0.739 −0.82 0.291 −0.09 0.17 −0.08 0.483 −0.03 0.992 0 0.841 0.00
Wukro 0.603 1.028 0.507 0.074 0.42 0.034 0.276 0.06 0.261 0.533 0.941 0.00
Table 6. Mann–Kendall statistic (P) and Sen’s slope for R90, R95, R99P, SDII, R1xday, and R5xday for all stationsStations Name
R90P R95P R99P SDII RX1day RX5dayP for
α = 0.05Sen’s slope
days/y
P for α = 0.05
Sen’s slope
days/y
P for α = 0.05
Sen’s slope
days/y
P for α = 0.05
Sen’s slope
mm/d/y
P for α = 0.05
Sen’s slope mm/y
P for α = 0.05
Sen’s slope mm/y
Abiadi 0.004 3.481 0.020 2.29 0.126 0.35 0.002 0.136 0.034 0.024 0.003 0.202
Adigudem 1.00 0.046 0.950 0.03 0.771 0.037 0.196 −0.044 0.404 −0.004 0.771 −0.037
Adigrat 0.603 0.369 0.868 0.075 0.367 0.12 0.942 0.209 0.267 −0.006 0.589 −0.02
Hawzien 0.429 −0.715 0.205 −0.71 0.515 −0.149 0.603 −0.015 0.964 0.00 0.162 0.101
Mek’ele 0.901 0.176 0.884 −0.047 0.234 −0.195 0.218 −0.026 0.012 −0.013 0.63 −0.025
Senkata 0.950 0.055 0.967 0.037 0.769 0.103 0.405 −0.015 0.819 −0.001 0.847 0.012
Wukro 0.708 0.378 0.917 −0.10 0.884 0.056 0.338 0.045 0.926 4.81E-04 0.026 0.201
Page 14 of 20
Kiros et al., Cogent Geoscience (2017), 3: 1353719https://doi.org/10.1080/23312041.2017.1353719
trends for CDD at α = 0.05 significant level (Table 5). Decreasing trends of the CDD index was de-tected for Abiadi, Adigudem, Adigrat and Mek’ele stations examined in this study with a Sen’s slope ranged from −0.09 to −0.9 days per year contraindicating. Seleshi and Camberlin (2006) found no trend on the dry spell of extreme intensity. Out of 7 stations, two stations, Hawzien and Wukro showed positive trend and one station showed no trend at all. Although there is high variability in trends for all the stations only Mek’ele showed statistically significant positive trend indicating in-crease in CDD. If the CDD is a measure of dryness; whereas the CWD index, on the contrary, revealed the time-series variations that can direct to wetter conditions. CWD over the Geba River basin in-creased at stations Abiadi, Adigudem and Hawzien however, only one station Adigudem showed statistically significant trends in magnitude that ranged between 0.036 and 0.143 days per year (Table 5). Further analysis indicated that annual rainfall indices for CWD showed the lowest values (<5 mm) in 1971 for Wukro, 1971, 1980 and 1982 for Senkata, 1985 for Adigudem and Mek’ele, 1990 for Hawzien, 2001 for Abiadi and 2009 for Adigrat.
3.3.2. Daily rainfall of absolute threshold indicesResults of trend magnitudes days per year for stations with statistically significant changes to R10mm and R20mm at α = 0.05 significant level are shown in (Table 5). The number of cases (annual count number of days) with daily rainfall equal to or exceeding the 10, 20 and 25 mm limits is the measure of persistence of intense rainfall, defined as the R10mm, R20mm and R25mm indices. The R10mm decreased in the stations Adigudem, Mek’ele, and Senkata with a trends magnitude ranging from −0.08 to −0.14 days per year, but the trend is not statistically significant. In addition, in stations Abiadi and Wukro the R10mm index showed increasing trends having a trends magnitude 0.6 and 0.074 days per year, respectively, however only Abiadi revealed statistically significant trend. Further analysis revealed that there are more stations with a significant change to R20mm than to R10mm and R25mm. Only two stations showed a significant change to R20mm with a mixture of decreasing and increasing trends, ranging from −0.05 to 0.308 days per year (Table 5). Over the Geba River basin stations Abiadi and Wukro showed positive trend however, only Abiadi showed statistically signifi-cant trend. There are three stations Adigrat, Hawzien, and Senkata which are located in the up-stream of the catchment revealed a decreasing trend, but only Adigrat showed statistically significant trend at the 95% confidence level. This is consistent with the decreasing and increasing trends detected for the 25 mm index where three stations showed decreasing two stations showed increasing and two with no trend at all.
3.4. Changes in the extreme rainfall depth and intensity indices
3.4.1. Extreme rainfall Indices for 1-day and 5-day event durationsOn the basis of results obtained for the RX1day index (Table 6); the monthly maximum one-day rainfall of four stations located in the Geba River basin decreased with the magnitudes of change ranging from −0.001 to −0.013 mm per year. Some positive changes were seen for stations Abiadi and Wukro. Abiadi station showed statistically significant increasing trend and also Mek’ele station showed decreasing statistically significant trends and one station showed no trend. The trend mag-nitudes for stations with increasing changes are ranging from 0.024 to 4.81−04 mm per year. For the RX5day index which corresponds to the maximum consecutive 5-day rainfall amount (a potential indicator of flood producing events), four out of the seven stations in the study area showed positive changes (Table 6) of which two stations showed statistically significant change. Three stations (Adigudem, Adigrat, and Mek’ele) also show negative change, but none of them showed statistically significant. The trend magnitude for stations showed decreasing trend ranged from −0.02 to −0.037 and increasing changes ranged from 0.012 to 0.202 mm per year.
Page 15 of 20
Kiros et al., Cogent Geoscience (2017), 3: 1353719https://doi.org/10.1080/23312041.2017.1353719
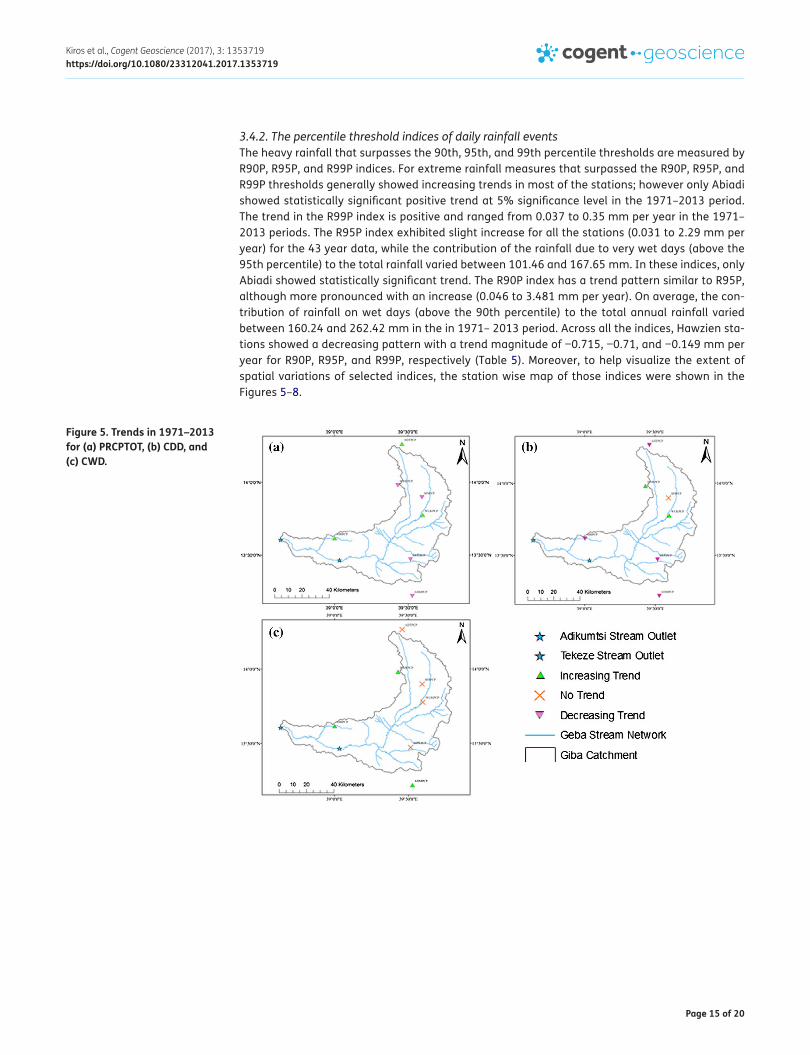
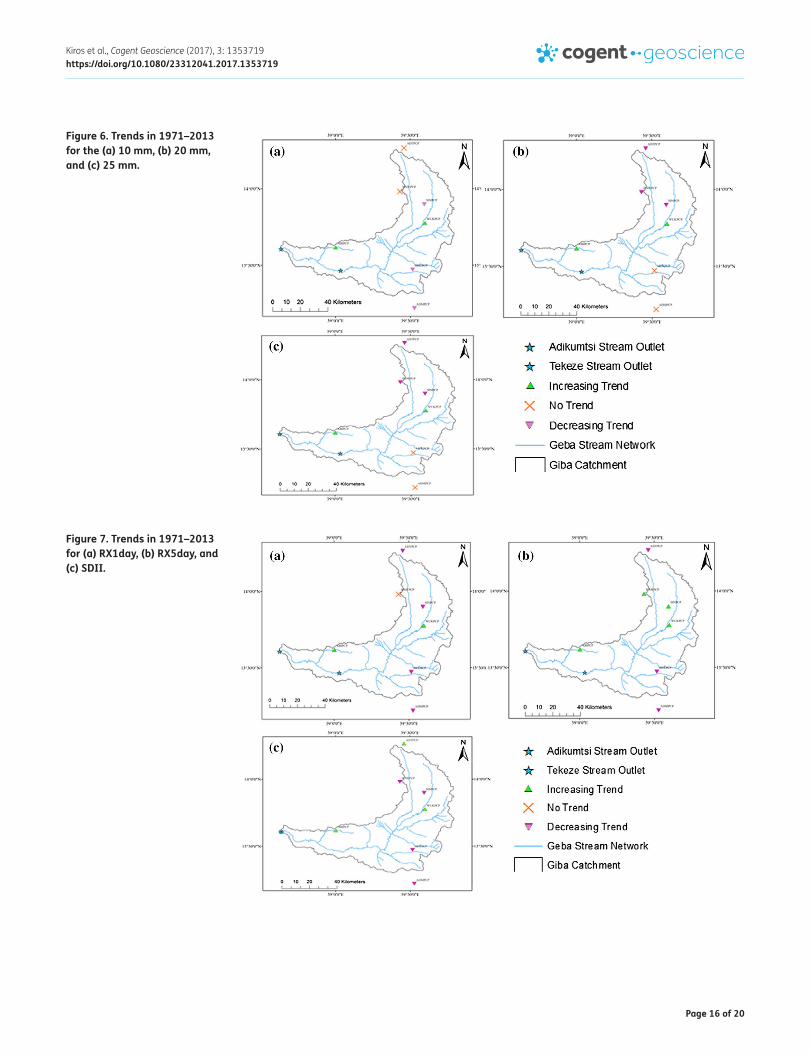
3.4.2. The percentile threshold indices of daily rainfall eventsThe heavy rainfall that surpasses the 90th, 95th, and 99th percentile thresholds are measured by R90P, R95P, and R99P indices. For extreme rainfall measures that surpassed the R90P, R95P, and R99P thresholds generally showed increasing trends in most of the stations; however only Abiadi showed statistically significant positive trend at 5% significance level in the 1971–2013 period. The trend in the R99P index is positive and ranged from 0.037 to 0.35 mm per year in the 1971–2013 periods. The R95P index exhibited slight increase for all the stations (0.031 to 2.29 mm per year) for the 43 year data, while the contribution of the rainfall due to very wet days (above the 95th percentile) to the total rainfall varied between 101.46 and 167.65 mm. In these indices, only Abiadi showed statistically significant trend. The R90P index has a trend pattern similar to R95P, although more pronounced with an increase (0.046 to 3.481 mm per year). On average, the con-tribution of rainfall on wet days (above the 90th percentile) to the total annual rainfall varied between 160.24 and 262.42 mm in the in 1971– 2013 period. Across all the indices, Hawzien sta-tions showed a decreasing pattern with a trend magnitude of −0.715, −0.71, and −0.149 mm per year for R90P, R95P, and R99P, respectively (Table 5). Moreover, to help visualize the extent of spatial variations of selected indices, the station wise map of those indices were shown in the Figures 5–8.
Figure 5. Trends in 1971–2013 for (a) PRCPTOT, (b) CDD, and (c) CWD.
Page 16 of 20
Kiros et al., Cogent Geoscience (2017), 3: 1353719https://doi.org/10.1080/23312041.2017.1353719
Figure 6. Trends in 1971–2013 for the (a) 10 mm, (b) 20 mm, and (c) 25 mm.
Figure 7. Trends in 1971–2013 for (a) RX1day, (b) RX5day, and (c) SDII.
Page 17 of 20
Kiros et al., Cogent Geoscience (2017), 3: 1353719https://doi.org/10.1080/23312041.2017.1353719
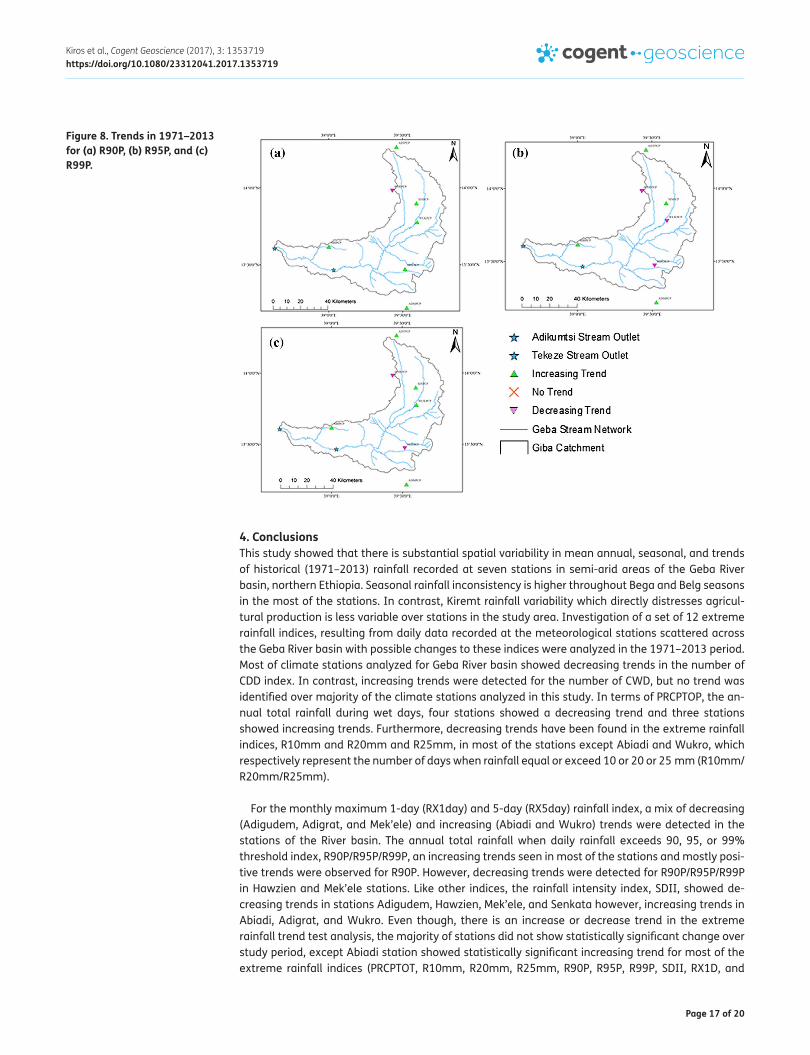
4. ConclusionsThis study showed that there is substantial spatial variability in mean annual, seasonal, and trends of historical (1971–2013) rainfall recorded at seven stations in semi-arid areas of the Geba River basin, northern Ethiopia. Seasonal rainfall inconsistency is higher throughout Bega and Belg seasons in the most of the stations. In contrast, Kiremt rainfall variability which directly distresses agricul-tural production is less variable over stations in the study area. Investigation of a set of 12 extreme rainfall indices, resulting from daily data recorded at the meteorological stations scattered across the Geba River basin with possible changes to these indices were analyzed in the 1971–2013 period. Most of climate stations analyzed for Geba River basin showed decreasing trends in the number of CDD index. In contrast, increasing trends were detected for the number of CWD, but no trend was identified over majority of the climate stations analyzed in this study. In terms of PRCPTOP, the an-nual total rainfall during wet days, four stations showed a decreasing trend and three stations showed increasing trends. Furthermore, decreasing trends have been found in the extreme rainfall indices, R10mm and R20mm and R25mm, in most of the stations except Abiadi and Wukro, which respectively represent the number of days when rainfall equal or exceed 10 or 20 or 25 mm (R10mm/R20mm/R25mm).
For the monthly maximum 1-day (RX1day) and 5-day (RX5day) rainfall index, a mix of decreasing (Adigudem, Adigrat, and Mek’ele) and increasing (Abiadi and Wukro) trends were detected in the stations of the River basin. The annual total rainfall when daily rainfall exceeds 90, 95, or 99% threshold index, R90P/R95P/R99P, an increasing trends seen in most of the stations and mostly posi-tive trends were observed for R90P. However, decreasing trends were detected for R90P/R95P/R99P in Hawzien and Mek’ele stations. Like other indices, the rainfall intensity index, SDII, showed de-creasing trends in stations Adigudem, Hawzien, Mek’ele, and Senkata however, increasing trends in Abiadi, Adigrat, and Wukro. Even though, there is an increase or decrease trend in the extreme rainfall trend test analysis, the majority of stations did not show statistically significant change over study period, except Abiadi station showed statistically significant increasing trend for most of the extreme rainfall indices (PRCPTOT, R10mm, R20mm, R25mm, R90P, R95P, R99P, SDII, RX1D, and
Figure 8. Trends in 1971–2013 for (a) R90P, (b) R95P, and (c) R99P.
Page 18 of 20
Kiros et al., Cogent Geoscience (2017), 3: 1353719https://doi.org/10.1080/23312041.2017.1353719
RX5D) at the 95% confidence level. In general, the findings of this study are in agreement with other studies that examined changes in rainfall in East Africa. Thus, results of this study contribute to cli-mate change research in the region and provide inputs for better planning toward adapting to changing climate. Further research is needed to obtain a better understanding of regional and sea-sonal changes of rainfall in relation to other climatic factors, especially temperature, and how such changes will potentially impact on water resources, agricultural productivity, and the environment in northern Ethiopia.
FundingThe authors received no direct funding for this research.
Author detailsGebremedhin Kiros1,2,3
E-mail: [email protected] Shetty1
E-mail: [email protected] ID: http://orcid.org/0000-0002-3633-5254Lakshman Nandagiri1
E-mail: [email protected] Department of Applied Mechanics and Hydraulics, National
Institute of Technology Karnataka, Surathkal, Mangalore 575 025, India.
2 Department of Soil Resources and Watershed Management, Aksum University, Shire campus: Shire Endaselassie, P.O. Box 314, Aksum, Ethiopia.
3 Tigray Water Works Construction Enterprise, P.O. Box 1283, Mekelle, Tigray, Ethiopia.
Citation informationCite this article as: Extreme rainfall signatures under changing climate in semi-arid northern highlands of Ethiopia, Gebremedhin Kiros, Amba Shetty & Lakshman Nandagiri, Cogent Geoscience (2017), 3: 1353719.
Cover imageThe Source of this image is ASTER Global Digital Elevation Model and downloaded the ASTER DEM data for free from the USGS Earth Explorer and clipped for the purpose of this study.
ReferencesAfewerki, H. G. (2012). Modeling of hydrological processes in the
Geba River Basin, Ethiopia (304 pp., PhD Thesis). Vrije Universiteit Brussel, Brussels.
Aguilar, E., Peterson, T. C., Ramírez, O. P., Frutos, R., Retana, J. A., Solera, M., … Mayorga, R. (2005). Changes in precipitation and temperature extremes in Central America and northern South America, 1961–2003. Journal of Geophysical Research, 110, D23107. doi:10.1029/2005JD006119
Alexander, L. V., Hope, P., Collins, D., Trewin, B., Lynch, A., & Nicholls, N. (2007). Trends in Australia’s climate means and extremes: A global context. Australia Meteorological Management, 56, 1–18.
Alexander, L. V., Zhang, X., Peterson, T. C., Caesar, J., Gleason, B., Klein Tank, A. M. G., … Vazquez-Aguirre, J. L. (2006). Global observed changes in daily climate extremes of temperature and precipitation. Journal of Geophysical Research, 111, D05109.
Angassa, A., & Oba, G. (2007). Relating long-term rainfall variability to cattle population dynamics in communal rangelands and a government ranch in southern Ethiopia. Agricultural Systems, 94, 715–725. https://doi.org/10.1016/j.agsy.2007.02.012
Bewket, W., & Conway, D. (2007). A note on the temporal and spatial variability of rainfall in the drought-prone Amhara region of Ethiopia. International Journal of Climatology, 27, 1467–1477. doi:10.1002/joc.1481
Cheung, W., Senay, G., & Singh, A. (2008). Trends and spatial distribution of annual and seasonal rainfall in Ethiopia. International Journal of Climatology, 28, 1723–1734. doi:10.1002/joc.1623
Cooper, P. J. M., Dimes, J., Rao, K. P. C., Shapiro, B., Shiferaw, B., & Twomlow, S. (2008). Coping better with current climatic variability in the rain-fed farming systems of sub-Saharan Africa: An essential first step in adapting to future climate change. Agricultural Ecosystem and Environment, 12, 24–35. https://doi.org/10.1016/j.agee.2008.01.007
Deressa, T. T., Hassan, R. M., & Ringler, C. (2011). Perception of and adaptation to climate change by farmers in the Nile basin of Ethiopia. The Journal of Agricultural Science, 149, 23–31. doi:10.1017/S0021859610000687
Drapela, K., & Drapelova, I. (2011). Application of Mann-Kendall test and the Sen’s slope estimates for trend detection in deposition data from Bíly Kriz (Beskydy Mts., the Czech Republic) 1997–2010. Beskdy Mendel University in Brno, 4, 133–146.
Field, C. B. (2012). Managing the risks of extreme events and disasters to advance climate change adaptation: Special report of the intergovernmental panel on climate change (582 pp.). Cambridge: Cambridge University Press. ISBN 9781107025066. https://doi.org/10.1017/CBO9781139177245
Frich, P., Alexander, L. V., Della-Marta, P., Gleason, B., Haylock, M., Klein Tank, A. M. G., & Peterson, T. (2002). Observed coherent changes in climatic extremes during the second half of the twentieth century. Climate Research, 19, 193–212. https://doi.org/10.3354/cr019193
García-Barrón, L., Morales, J., & Sousa, A. (2013). Characterisation of the intraannual rainfall and its evolution (1837–2010) in the southwest of the Iberian Peninsula. Theoretical Applied Climatology, 114, 445–457. doi:10.1007/s00704-0130855-7
Gilbert, R. O. (1987). Statistical methods for environmental pollution monitoring (336 pp.). New York, NY: Wiley. ISBN: 9780471288787.
Groisman, P. Y., Knight, R. W., Easterling, D. R., Karl, T. R., Hegerl, G. C., & Razuvaev, V. N. (2005). Trends in intense precipitation in the climate record. Journal of Climate, 18, 1326–1350. https://doi.org/10.1175/JCLI3339.1
Hirsch, R. M., Slack, J. R., & Smith, R. A. (1982). Techniques of trend analysis for monthly water quality data. Water Resources Research, 18, 107–121. https://doi.org/10.1029/WR018i001p00107
IPCC. (2007). Fourth assessment report: Climate change 2007 (Synthesis Report). Geneva: World Meteorological Organization.
IPCC. (2012). Managing the risks of extreme events and disasters to advance climate change adaptation (582 pp). A Special Report of Working Groups I and II of the Intergovernmental Panel on Climate Change [C. B. Field, V. Barros, T. F. Stocker, D. Qin, D. J. Dokken, K. L. Ebi, … P. M. Midgley (eds.)]. Cambridge: Cambridge University Press https://doi.org/10.1017/CBO9781139177245
Jiang, F. Q., Hu, R. J., Wang, S. P., Zhang, Y. W., & Tong, L. (2013). Trends of precipitation extremes during 1960–2008 in Xinjiang, the Northwest China. Theoretical and Applied Climatology, 111, 133–148. https://doi.org/10.1007/s00704-012-0657-3
Page 19 of 20
Kiros et al., Cogent Geoscience (2017), 3: 1353719https://doi.org/10.1080/23312041.2017.1353719
Kalumba, A. M., Olwoch, J. M., Van Aardt, I., Botai, O. J., Tsela, P., Nsubuga, F. W. N., & Adeola, A. M. (2013). Trend Analysis of Climate Variability over the West Bank-East London Area, South Africa (1975–2011). Journal of Geography and Geology, 5, 131–147.
Karagiannidis, A. F., Karacostas, T., Maheras, P., & Makrogiannis, T. (2012). Climatological aspects of extreme precipitation in Europe, related to mid-latitude cyclonic systems. Theoretical Applied Climatology, 107, 165–174. https://doi.org/10.1007/s00704-011-0474-0
Kendall, M. G. (1975). Rank correlation methods (4th ed.). London: Charles Griffin. ISBN 0195205723.
Klein Tank, A. M. G., Peterson, T. C., Quadir, D. A., Dorji, S., Zou, X., Tang, H., …Specktorman, T. (2006). Changes in daily temperature and precipitation extremes in central and south Asia. Journal of Geophysical Research, 111, D23107. https://doi.org/10.1029/2005JD006316
Mann, H. B. (1945). Nonparametric tests against trend. Econometrica, 13, 245–259. https://doi.org/10.2307/1907187
Mersha, E. (1999). Annual rainfall and potential evapotranspiration in Ethiopia. Ethiopian Journal of Natural Resources, 1, 137–154.
Mersha, E. (2003). Assessment of moisture availability over semi-arid and arid zones of Ethiopia. Ethiopian Journal of Natural Resources, 5, 165–191.
Meze-Hausken, E. (2004). Contrasting climate variability and meteorological drought with perceived drought and climate change in northern Ethiopia. Climate Research, 27, 19–31. https://doi.org/10.3354/cr027019
Moberg, A., & Jones, P. D. (2005). Trends in indices for extremes in daily temperature and precipitation in central and western Europe 1901–1999. International Journal of Climatology, 25, 1149–1171. https://doi.org/10.1002/(ISSN)1097-0088
Moberg, A., Jones, P. D., Lister, D., & Walther, A. (2006). Indices for daily temperature and precipitation extremes in Europe analyzed for the period 1901–2000. Journal of Geophysical Research, 111, D05109. https://doi.org/10.1029/2006JD007103
Motiee, H., & McBean, E. (2009). An assessment of long-term trends in hydrologic components and implications for water levels in Lake Superior. Hydrology Research, 40, 564–579. https://doi.org/10.2166/nh.2009.061
Moyo, M., Mvumi, B. M., Kunzekweguta, M., Mazvimavi, K., Craufurd, P., & Dorward, P. (2012). Farmer perceptions on climate change and variability in semi-arid Zimbabwe in relation to climatology evidence. Africa Crop Science Journal, 20, 317–335.
Mwangi, M. N., & Desanker, P. V. (2007). Changing climate, disrupted livelihoods: The case of vulnerability of nomadic maasai pastoralism to recurrent droughts in Kajiado district, Kenya. Retrieved from https://adsabs.harvard.edu/abs/2007AGUFMGC12A.02 M
New, M., Hewitson, B., Stephenson, D. B., Tsiga, A., Kruger, A., Manhique, A., … Lajoie, R. (2006). Evidence of trends in daily climate extremes over southern and west Africa. Journal of Geophysical Research, 111, D23107. https://doi.org/10.1029/2005JD006289
Norrant, C., & Douguédroit, A. (2006). Monthly and daily precipitation trends in the Mediterranean (1950–2000). Theoretical Applied Climatology, 83, 89–106. https://doi.org/10.1007/s00704-005-0163-y
Omondi, P. A., Awange, J. L., Forootan, E., Ogallo, L. A., & Barakiza, R. (2013). Changes in temperature and precipitation extremes over the Greater Horn of Africa
region from 1961 to 2010. International Journal of Climatology, 34, 1262–1277.
Opiyo, F., Nyangito, M., Wasonga, O. V., & Omendi, P. (2014). Trend Analysis of Rainfall and Temperature in Arid Environment of Turkana, Kenya. Environment Research Journal, 8, 30–43.
Peterson, T. C., Folland, C., Gruza, G., Hogg, W., Mokssit, A., & Plummer, N. (2001). Report on the activities of the working group on climate change detection and related rapporteurs 1998–2001 (143 pp.). Report WCDMP-47, WMOTD 1071, Geneva.
Schreck, C. J., & Semazzi, F. H. (2004). Variability of the recent climate of eastern Africa. International Journal of Climatology, 24, 681–701. doi:10.1002/joc.1019
Seleshi, Y., & Camberlin, P. (2006). Recent changes in dry spell and extreme rainfall events in Ethiopia. Theoretical and Applied Climatology, 83, 181–191. doi:10.1007/s00704-005-0134-3
Seleshi, Y., & Demaree, G. R. (1995). Rainfall variability in the Ethiopian and Eritrean highlands and its links with the southern oscillation index. Journal of Biogeography, 22, 945–952. https://doi.org/10.2307/2845995
Seleshi, Y., & Zanke, U. (2004). Recent changes in rainfall and rainy days in Ethiopia. International Journal of Climatology, 24, 973–983. https://doi.org/10.1002/(ISSN)1097-0088
Sen, P. K. (1968). Estimate of the regression coefficient based on Kendall’s tau. Journal of the American Statistical Association, 63, 1379–1389. https://doi.org/10.1080/01621459.1968.10480934
Thiel, H. (1950). A rank-invariant method of linear and polynomial analysis, part 3. Nederlandse Akademie van Wettenschappen, Proceedings, 53, 1397–1412.
Van den Besselaar, E. J. M., Klein Tank, A. M. G., & Buishand, T. A. (2012). Trends in European precipitation extremes over 1951–2010. International Journal of Climatology, 33, 2682–2689. doi:10.1002/joc.3619
Vincent, L. A., Aguilar, E., Saindou, M., Hassane, A. F., Jumaux, G., Roy, D., …Montfraix, B. (2011). Observed trends in indices of daily and extreme temperature and precipitation for the countries of the western Indian Ocean, 1961–2008. Journal of Geophysical Research, 116, D23107. https://doi.org/10.1029/2010JD015303
Wagesho, N., Goel, N. K., & Jain, M. K. (2013). Temporal and spatial variability of annual and seasonal rainfall over Ethiopia. Hydrological Sciences Journal, 58, 354–373. https://doi.org/10.1080/02626667.2012.754543
Wang, H., Chen, Y., & Chen, Z. (2013). Spatial distribution and temporal trends of mean precipitation and extremes in the arid region, northwest of China, during 1960–2010. Hydrological Processes, 27, 1807–1818. https://doi.org/10.1002/hyp.v27.12
Xoplaki, E., González-Rouco, J. F., Luterbacher, J., & Wanner, H. (2004). Wet season Mediterranean precipitation variability: Influence of largescale dynamics and trends. Climate Dynamics, 23, 63–78. doi:10.1007/s00382-004-0422-0
Yue, S., & Wang, C. (2004). The Mann-Kendall test modified by effective sample size to detect trend in serially correlated hydrological series. Water Resources Management, 18, 201–218. https://doi.org/10.1023/B:WARM.0000043140.61082.60
Zhai, P., Zhang, X., Wan, H., & Pan, X. (2005). Trends in total precipitation and frequency of daily precipitation extremes over China. Journal of Climate, 18, 1096–1108. https://doi.org/10.1175/JCLI-3318.1
Page 20 of 20
Kiros et al., Cogent Geoscience (2017), 3: 1353719https://doi.org/10.1080/23312041.2017.1353719
© 2017 The Author(s). This open access article is distributed under a Creative Commons Attribution (CC-BY) 4.0 license.You are free to: Share — copy and redistribute the material in any medium or format Adapt — remix, transform, and build upon the material for any purpose, even commercially.The licensor cannot revoke these freedoms as long as you follow the license terms.
Under the following terms:Attribution — You must give appropriate credit, provide a link to the license, and indicate if changes were made. You may do so in any reasonable manner, but not in any way that suggests the licensor endorses you or your use. No additional restrictions You may not apply legal terms or technological measures that legally restrict others from doing anything the license permits.
Cogent Geoscience (ISSN: 2331-2041) is published by Cogent OA, part of Taylor & Francis Group. Publishing with Cogent OA ensures:• Immediate, universal access to your article on publication• High visibility and discoverability via the Cogent OA website as well as Taylor & Francis Online• Download and citation statistics for your article• Rapid online publication• Input from, and dialog with, expert editors and editorial boards• Retention of full copyright of your article• Guaranteed legacy preservation of your article• Discounts and waivers for authors in developing regionsSubmit your manuscript to a Cogent OA journal at www.CogentOA.com
Zhang, X., Alexander, L., Hegerl, C., Jones, P., Klein, T. A., Peterson, C., … Zwiers, F. W. (2011). Indices for monitoring changes in extremes based on daily temperature and precipitation data. WIREs Climate Change, 2011. doi:10.1002/wcc.147
Zhang, X., Brown, R., Vincent, L., Skinner, W., Feng, Y., & Mekis, E. (2010). Canadian climate trends, 1950–2007. Canadian Biodiversity: Ecosystem Status and Trends 2010. Technical
Thematic Report Series No. 5. Canadian Councils of Resource Minister.
Zenebe, A., Vanmaercke, M., Poesen, J., Verstraeten, G., Haregeweyn, N., Haile, M., … Nyssen, J. (2013). Spatial and temporal variability of river flows in the degraded semi-arid tropical mountains of northern Ethiopia. Zeitschrift für Geomorphologie, 57, 143–169. https://doi.org/10.1127/0372-8854/2012/0080