
Extreme Discharge Events in the Paraná River and … Papers... · Extreme Discharge Events in the...
26
Extreme Discharge Events in the Paraná River and their Climate Forcing Ines A. Camilloni* and Vicente R. Barros AIACC Working Paper No. 2 December 2003 *Corresponding Author. Email address: [email protected] An electronic publication of the AIACC project available at www.aiaccproject.org.
Transcript of Extreme Discharge Events in the Paraná River and … Papers... · Extreme Discharge Events in the...
Extreme Discharge Events in the Paraná Riverand their Climate Forcing
Ines A. Camilloni* and Vicente R. Barros
AIACC Working Paper No. 2December 2003
*Corresponding Author. Email address: [email protected]
An electronic publication of the AIACC project available at www.aiaccproject.org.

AIACC Working Papers, published on the web by Assessments of Impacts andAdaptations to Climate Change (AIACC), is a series of working papers produced byresearchers participating in the AIACC project. The papers published in AIACC WorkingPapers have been peer reviewed and accepted for publication as being (i) fundamentallysound in their methods and implementation, (ii) informative about the methods and/orfindings of new research, and (iii) clearly written for a broad, multi-disciplinaryaudience. The purpose of the series is to circulate results and descriptions ofmethodologies from the AIACC project and elicit feedback to the authors. Becausemany of the papers report preliminary results from ongoing research, thecorresponding author should be contacted for permission before citing or quotingpapers in this series.
The AIACC project is funded by the Global Environment Facility, the U.S. Agency forInternational Development, the Canadian International Development Agency, and theU.S. Environmental Protection Agency. The project is co-executed on behalf of theUnited Nations Environment Programme by the global change SysTem for AnalysisResearch and Training (START) and the Third World Academy of Sciences (TWAS).AIACC seeks to enhance capabilities in the developing world for responding to climatechange by building scientific and technical capacity, advancing scientific knowledge,and linking scientific knowledge to development and adaptation planning. AIACCsupports 24 regional studies in Africa, Asia, the Caribbean, Latin America and Oceaniawith funding, mentoring, training and technical assistance. The studies are active in 46developing countries and engage approximately 300 developing country scientists andstudents, 40 developed country scientists, and institutions in both the developing anddeveloped world.
For more information about the AIACC project, and to obtain copies of other paperspublished in AIACC Working Papers, please visit our website at www.aiaccproject.org.
1
Extreme discharge events in the Paraná Riverand their climate forcing*
Inés A. Camilloni1 and Vicente R. Barros2
1Departamento de Ciencias de la Atmósfera y los Océanos. Universidad de Buenos AiresCentro de Investigaciones del Mar y la Atmósfera (CIMA/CONICET-UBA), Buenos Aires, Argentina, E-mail:[email protected]
2Departamento de Ciencias de la Atmósfera y los Océanos. Universidad de Buenos AiresConsejo Nacional de Investigaciones Científicas y Técnicas (CONICET), Buenos Aires, Argentina, E-mail:[email protected]
Abstract reprinted from Journal of Hydrology, Vol 278, Camilloni, I.A. and Barros, V.R., Extremedischarge events in the Parana River and their climate forcing, pp. 94-106, Copyright (2003), withpermission from Elsevier. The Journal of Hydrology Homepage can be found athttp://www.sciencedirect.com/science/journal/00221694.
Abstract
The largest discharge anomalies of the Paraná River were examined focusing on thecontribution from the sub-basins and on the climate forcing of these events. Major dischargeanomalies at Corrientes originated in the central and southern Upper Paraná basin with relativelysmall contributions from the Paraguay River and the northern Upper Paraná basin.
About two thirds of the major discharge anomalies in Corrientes occurred during El Niñoevents while none was registered during La Niña events. Major discharge anomalies related to ElNiño occurred either in the spring of the year of El Niño onset or in autumn of the following year(autumn (+)) accompanying the precipitation signal of El Niño in eastern subtropical SouthAmerica. The signal during autumn (+) is the most relevant as five out the six top discharges ofthe Paraná River at Corrientes occurred in this season. The remaining third of the majordischarges not related to El Niño took place during the austral spring or austral summer ofneutral periods. In each of these seasons, they share a common sea surface temperature anomalypattern in the proximity of the South American coasts.
Key words: flood; El Niño; Paraná; river discharge
*Abstract reprinted from Journal of Hydrology, Vol 278, Camilloni, I.A. and Barros, V.R., Extreme discharge events in theParana River and their climate forcing, pp. 94-106, Copyright (2003), with permission from Elsevier. The Journal of HydrologyHomepage can be found at http://www.sciencedirect.com/science/journal/00221694. The body of the paper is a pre-publicationversion of the final paper published in the Journal of Hydrology. The paper reports on results from research supported in part bygrant number LA26 from the AIACC project.

2
1. Introduction
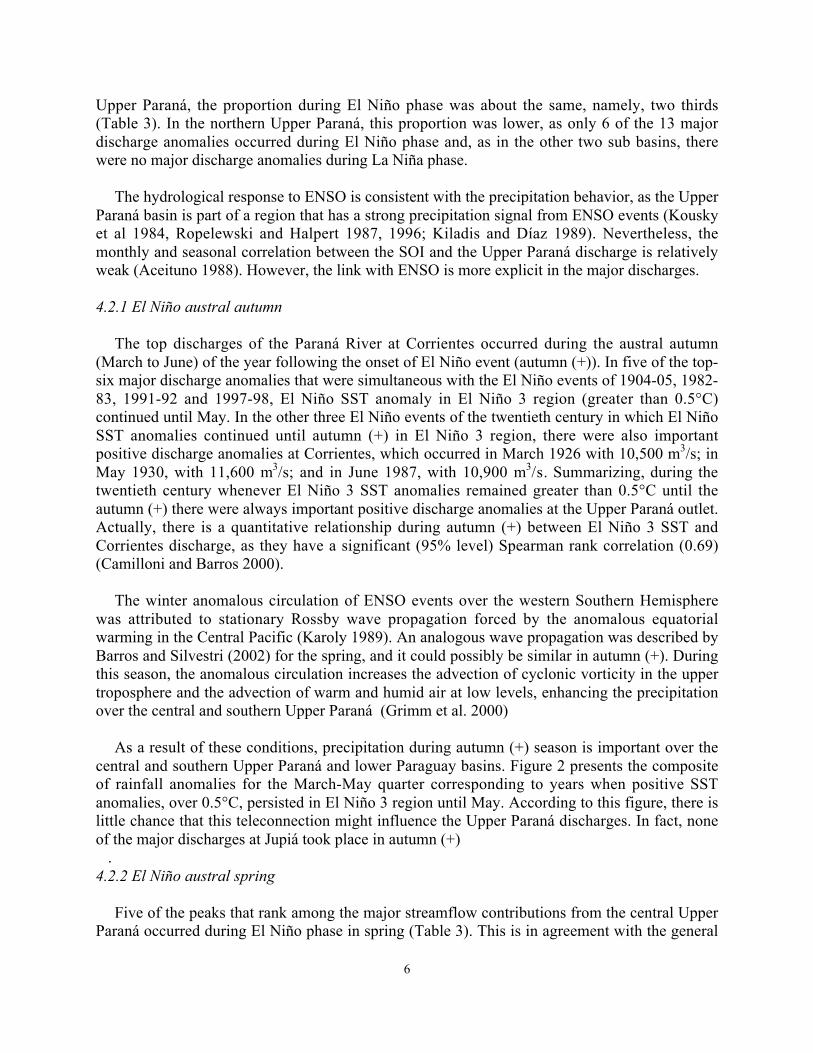
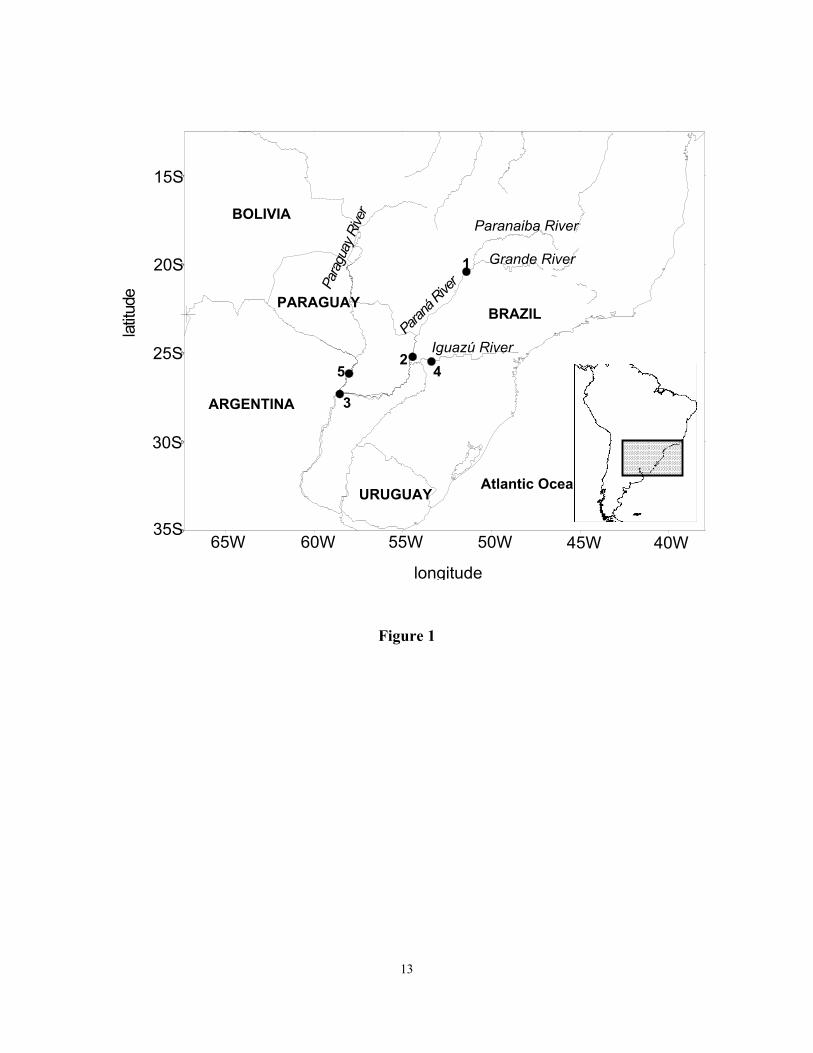
The Paraná River, the most important tributary of the Río de la Plata, has a drainage basin of2.6 x 106 km2 and contributes with more than 80 % to Río de la Plata streamflow. It begins at theconfluence of the Grande and Paranaíba rivers and its main tributaries are the Paranápanema,Iguazú, and Paraguay rivers (Fig. 1). Upstream from the confluence with the Paraguay atCorrientes, the river is known as Upper Paraná, and from this city down to 32°S as MiddleParaná. Downstream this point, it is called Lower Paraná.
The Upper Paraná flows mostly in areas with steep terrain that favors runoff (Tossini 1959)while the Middle and Lower Paraná flows in a gently sloping plain. The last river stretchbecomes a delta and together with the Uruguay River forms the Río de la Plata. Large areas ofland along the Middle and Lower Paraná margins are frequently subject to extended floods,which cause considerable damage. For instance, during the 1983 flood more than 100,000 peoplehad to be evacuated (Anderson et al. 1993), with losses that amounted more than one billionAmerican dollars
The mean discharge of the Upper Paraná is about 16,000 m3/s and only increases less than1,000 m3/s downstream from Corrientes (Secretaría de Energía, 1994). During the highest floods,monthly discharges at Corrientes exceed twice, and even three times, the mean discharge while,as shown by monthly data (http://www.mecon.gov.ar/hidricos/mapashidricos/mapageneral.htm),contributions from the Middle and Lower Paraná basins to extreme discharges are relativelysmall. The only important exception to this fact occurred during the 1998 autumn flood when theMiddle Paraná had an important contribution due to extraordinary rainfalls.
Literature about the Paraná streamflows has mainly dealt with the statistical analyses ofdischarges, remote climate forcing, or descriptions of individual events. For instance, García andVargas (1996, 1998) and Genta et al (1998) have identified a positive trend in the Paranádischarges and its tributaries since 1976, and Robertson and Mechoso (1998) analyzed decadalteleconnections between sea surface temperature (SST) and the Paraguay and Paranástreamflows.
Consistent evidences of the link between the Paraná discharge and the El Niño-SouthernOscillation (ENSO) have been found as well. For example, Aceituno (1988) found a weaknegative correlation between discharges at Corrientes and the southern oscillation index (SOI)during November-April, and Amarasekera et al (1997) reported a positive correlation betweenthe annual discharge at Corrientes and the equatorial Pacific SST averaged on quarters laggingahead of the discharge year. Depetris et al (1996) reported a significant coherence-squarebetween SST at the equatorial Pacific and discharge at Corrientes in the neighborhood of the 2.5years period. They reported the extraordinary magnitude of the 1982/83 flood, which coincidedwith the strong El Niño event of 1982, and commented that four other large floods also occurredin coincidence with El Niño events. Camilloni and Barros (2000) studied the river dischargesresulting from the 1982-83 and 1997-98 El Niño events. Robertson et al (2001) analyzed theinterannual to decadal predictability of the Paraná River extracting near-cycling components ofthe summer river streamflow. They found that the ENSO oscillatory component was associatedto changes in the probability distribution of monthly flows and that the decadal modulation of
3
ENSO may be important although the predictability due to ENSO at interannual lead times issmall. Berri et al. (2002) showed that averaged flows observed during El Niño events are alwayslarger than those observed during La Niña events. More details on the variability of the Río de laPlata basin climate and hydrology can be found in a recent report of the Climate VariabilityProgram (CLIVAR) (Mechoso et al 2001) and the references therein.
Despite the aforementioned contributions, a complete description of the highest floods andtheir causes is still lacking. Therefore, this article focuses on the contribution from the sub-basinsupstream from Corrientes to the major discharges of the Paraná, and on the possible climateforcings of such events. Major discharges at the Middle and Lower Paraná themselves are notpart of this study due to the lack of long-term series at stations downstream from Corrientes.However, since the Middle and Lower Paraná discharges are mostly determined, with a certainlag, by the Upper Paraná discharge, the conclusions are also useful for the understanding offloods in these sectors of the river.
2. Data
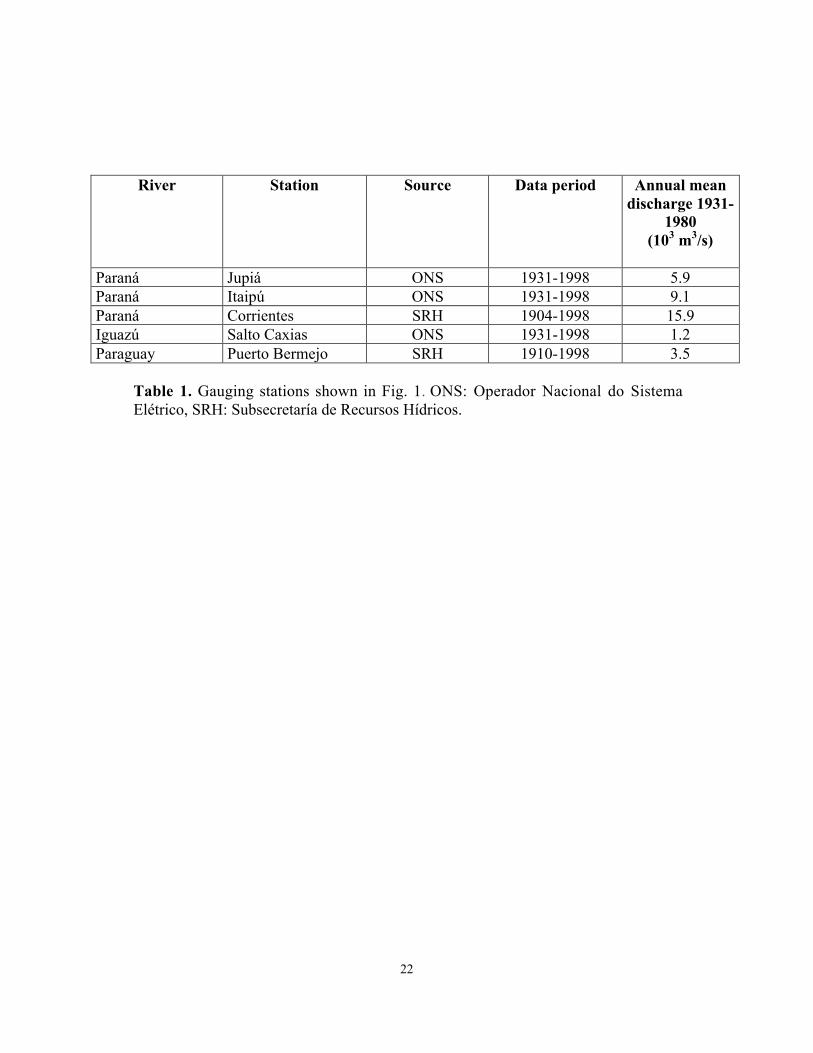
The study is based on monthly discharges at 5 gauging stations. This allows the estimate somesub-basins contributions to the Upper Paraná River discharge (Fig, 1). Table 1 shows their recordperiods and average annual discharges.
Natural discharges at the Brazilian gauging stations of Jupiá, Itaipú, and Salto Caxias wereobtained from the Operador Nacional do Sistema Elétrico (ONS). Data from the Argentinestations, namely Corrientes and Puerto Bermejo, were taken from the Subsecretaría de RecursosHídricos (SRH). Puerto Bermejo discharges do not require corrections because there are no damson the Paraguay River. On the other hand, dams upstream from Itaipú affect Corrientesstreamflow. Comparison between regulated and natural monthly flows at Itaipú indicates that theregulation upstream from this location has ranged from -7,000 m3/s to +4,600 m3/s, beingnegative in summer and positive in winter and spring. However, in the case of large positivedischarge anomalies, these differences were smaller, about 5% -or even less- of the Corrientesdischarge anomalies, with only one exception that rose close to 10%. Downstream from Itaipú,the large dams of Itaipú and Yaciretá do not introduce important alterations in the river flow.
Monthly rainfall series were taken from a data set assembled by Willmott and Matsura (2001).These data are available in a 0.5º x 0.5º grid for the period 1950-99. The relation between SSTand river discharges was studied using the monthly SST data set GISST version 2.3b obtainedfrom the British Atmospheric Data Center (2002). The starting and end months of El Niño andLa Niña events that occurred after 1950 were taken from Trenberth (1997) and ENSO eventsbefore 1950 from Kiladis and Diaz (1989).
3. Major discharge events
Table 2 shows the largest discharge anomalies at Corrientes calculated with respect to the1931-80 monthly mean. The sixteen events listed correspond to the 1904-2000 period, and wereselected based on the criterion that their discharge anomalies were at least three times the

4
standard deviation of the respective month. If two consecutive months met this requirement, onlythe one with the largest anomaly was retained. Hereinafter, these discharge anomalies will bereferred to as the major discharge anomalies. The magnitude of these extraordinary discharges atCorrientes minimizes the possible impact of water management by the upstream dams.
The cases listed in Table 2 constitute events that were necessarily caused by considerablemonthly precipitation anomalies over a large area of the upstream basin. Because of their sizeand time scale, these precipitation anomalies could be likely linked to a common large-scaleclimate forcing. To facilitate the discussion of this aspect, Table 2 includes a classification of theevents according to the season and the phase of ENSO.
The monthly discharge anomalies at the gauging stations of Jupiá and Puerto Bermejorepresent respectively the northern Upper Paraná, and the Paraguay discharges. In the case ofJupiá, the discharge anomalies corresponding to the month before the event in Corrientes werealso included due to the possibility of a zero to one-month lag in the streamflows between thesestations (Camilloni and Barros 2000). Table 2 also shows the contribution from the basincorresponding to the central sector of Upper Paraná and of the Iguazú rivers, calculated bysubtracting the discharges at Jupiá from the sum of the discharges at the gauging stations of SaltoCaxias and Itaipú. This basin will hereinafter be referred to as the central Upper Paraná basin.Similarly, the difference between the Corrientes discharges and streamflows at Itaipú, PuertoCaxias, and Puerto Bermejo represents the contribution from the Upper Paraná basin between theconfluence of the Iguazú and Paraguay rivers with the Paraná. Its respective basin will beaddressed in this paper as the southern Upper Paraná basin. Regulated discharges at Itaipú wereutilized in this latter case because dams upstream from Itaipú regulate Corrientes discharges.
An accurate quantitative balance between the monthly discharges at Corrientes and upstreamcontributions shown in Table 2 cannot be expected since the discharge propagation cannot becorrectly captured with one-month time resolution. In addition, the lag time between rainfall inthe different sub-basins and the discharge response at the gauging stations at their outlet rangesfrom less than a month to one or more months (Camilloni and Barros 2000). Therefore, Table 2allows to assess only the bulk magnitude from the sub-basin contributions to every majordischarge event in Corrientes.
The largest contributions to the major discharge anomalies at Corrientes came from thecentral and southern Upper Paraná basins, especially from the first one. In general, thesecontributions constituted about two thirds or more of the discharge anomaly at Corrientes.Though always positive, discharge anomalies at Puerto Bermejo were considerably smaller thanthose of the Upper Paraná. Thus, the contribution from the Paraguay River to the majordischarge anomalies at Corrientes adds to the contribution from the Upper Paraná, although in arelatively low proportion. The only cases with important contributions from the northern UpperParaná occurred during the extraordinary El Niño 1982/83 or a few months after its end. Thesmall contribution from the northern Upper Paraná to the major discharges at Corrientes ispeculiar, considering that this basin contributes with almost 40% of the annual mean discharge atCorrientes, and with little less than 50% of the Upper Paraná discharge.
5
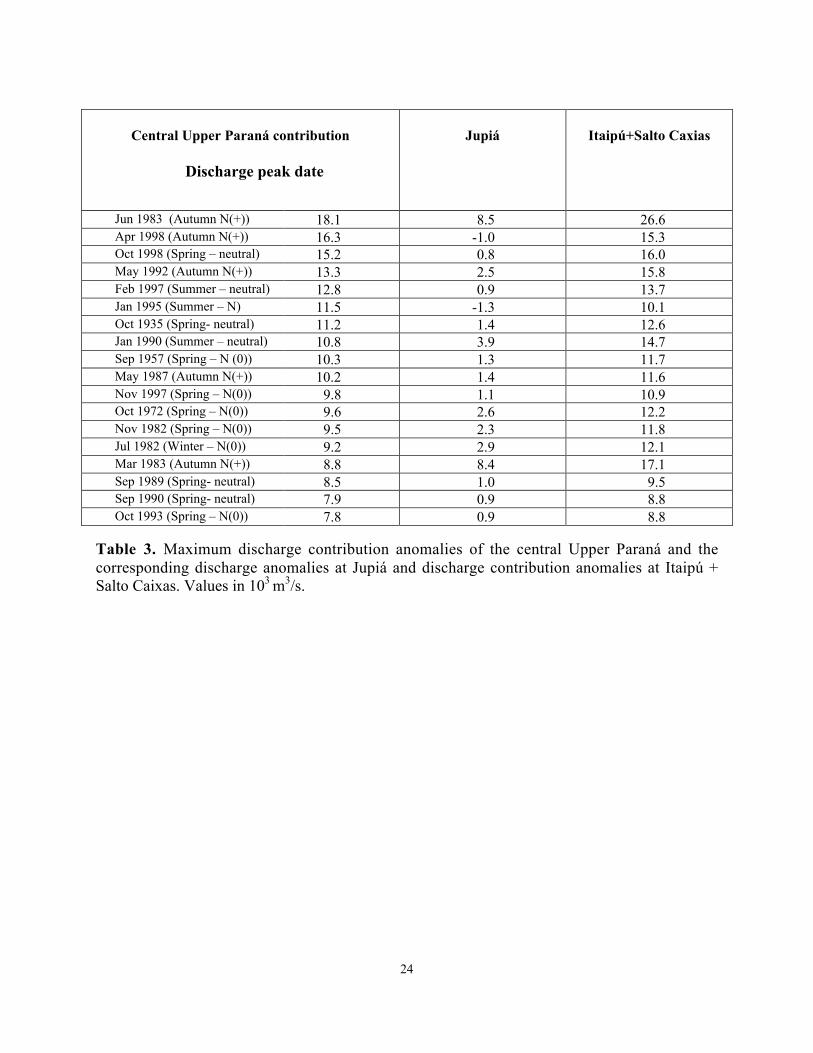
Since with few exceptions, the major discharge events in Corrientes originate in the centraland southern Upper Paraná basin, and especially in the first one, Table 3 presents the majoranomaly contributions corresponding to this part of the basin [Itaipú + Salto Caxias - Jupiá] forthe period 1931-98. The table includes a classification of these events according to the seasonand the phase of the ENSO. The 18 events listed are those whose anomalies were higher thanthree times the standard deviation for the respective month. As in the case of the Corrientesdischarges, the largest anomaly was registered in June 1983, but the rest of the events are notequally ranked as in the Corrientes case (Tables 2 and 3). However, there is a goodcorrespondence between the highest discharge anomalies at Corrientes and those shown in Table3.
Contributions from the northern Upper Paraná to the major discharge anomalies in the centralUpper Paraná are generally small -less than 25 %- or even negative, except for a few casesduring 1982 and 1983 (Table 3). Actually, the correlation between the contributions of monthlydischarge anomalies from the northern and central Upper Paraná is only 0.25, which, thoughsignificant at the 95% level, indicates a weak relation between the precipitation variability overthese two neighboring basins.
4. Climatic forcing of the major discharge anomalies
4.1 The annual cycleThe rainfall regime in the Upper Paraná basin changes from a pronounced annual cycle in the
north to a less defined cycle over the Iguazú, southern Upper Paraná and Lower Paraguay basins(Camilloni and Barros 2000; Grimm et al. 2000). Over these regions, the impact of the SouthAtlantic Convergence Zone (SACZ) in summer is smaller than it is in the northern Paraná basin,and there is an important frequency of cyclogenesis during winter and spring (Gan and Rao1991; Rao et al 1996). In the Pantanal, rainfall presents a very pronounced annual cycle with asummer maximum. However, due to the extreme flatness of this region and the small runoffassociated thereto, the maximum in the streamflow at Puerto Bermejo occurs with a lag of 5-8months (Camilloni and Barros 2000). Because of these features, the river discharge at Corrienteshas an attenuated mean annual cycle as compared with upstream discharges, but even so, duringthe 1931-1980 period, the mean discharge ranged from 12,000m3/s during August and Septemberto around 21,000 m3/s during February and March.
In spite of this well-marked annual cycle in the streamflow, the frequency of occurrence ofmajor discharge anomalies at Corrientes was higher in autumn and spring (Table 2). This is aconsequence of the seasonal variation of the precipitation response to El Niño in the Paraná basin(Grimm et al 2000) and the link between most of these anomalies and El Niño. This was alsoobserved in the central Upper Paraná, where only 3 of the 18 major contributions to dischargeanomalies correspond to the December-February period (Table 3).
4.2 ENSO relationship
There is a clear relationship between ENSO phases and the major discharge anomalies in theParaná River. In Corrientes, 11 out of 16 occurred during El Niño events (Table 2) and none ofthem occurred during La Niña phase. In the case of the major contributions from the central
6
Upper Paraná, the proportion during El Niño phase was about the same, namely, two thirds(Table 3). In the northern Upper Paraná, this proportion was lower, as only 6 of the 13 majordischarge anomalies occurred during El Niño phase and, as in the other two sub basins, therewere no major discharge anomalies during La Niña phase.
The hydrological response to ENSO is consistent with the precipitation behavior, as the UpperParaná basin is part of a region that has a strong precipitation signal from ENSO events (Kouskyet al 1984, Ropelewski and Halpert 1987, 1996; Kiladis and Díaz 1989). Nevertheless, themonthly and seasonal correlation between the SOI and the Upper Paraná discharge is relativelyweak (Aceituno 1988). However, the link with ENSO is more explicit in the major discharges.
4.2.1 El Niño austral autumn
The top discharges of the Paraná River at Corrientes occurred during the austral autumn(March to June) of the year following the onset of El Niño event (autumn (+)). In five of the top-six major discharge anomalies that were simultaneous with the El Niño events of 1904-05, 1982-83, 1991-92 and 1997-98, El Niño SST anomaly in El Niño 3 region (greater than 0.5°C)continued until May. In the other three El Niño events of the twentieth century in which El NiñoSST anomalies continued until autumn (+) in El Niño 3 region, there were also importantpositive discharge anomalies at Corrientes, which occurred in March 1926 with 10,500 m3/s; inMay 1930, with 11,600 m3/s; and in June 1987, with 10,900 m3/s. Summarizing, during thetwentieth century whenever El Niño 3 SST anomalies remained greater than 0.5°C until theautumn (+) there were always important positive discharge anomalies at the Upper Paraná outlet.Actually, there is a quantitative relationship during autumn (+) between El Niño 3 SST andCorrientes discharge, as they have a significant (95% level) Spearman rank correlation (0.69)(Camilloni and Barros 2000).
The winter anomalous circulation of ENSO events over the western Southern Hemispherewas attributed to stationary Rossby wave propagation forced by the anomalous equatorialwarming in the Central Pacific (Karoly 1989). An analogous wave propagation was described byBarros and Silvestri (2002) for the spring, and it could possibly be similar in autumn (+). Duringthis season, the anomalous circulation increases the advection of cyclonic vorticity in the uppertroposphere and the advection of warm and humid air at low levels, enhancing the precipitationover the central and southern Upper Paraná (Grimm et al. 2000)
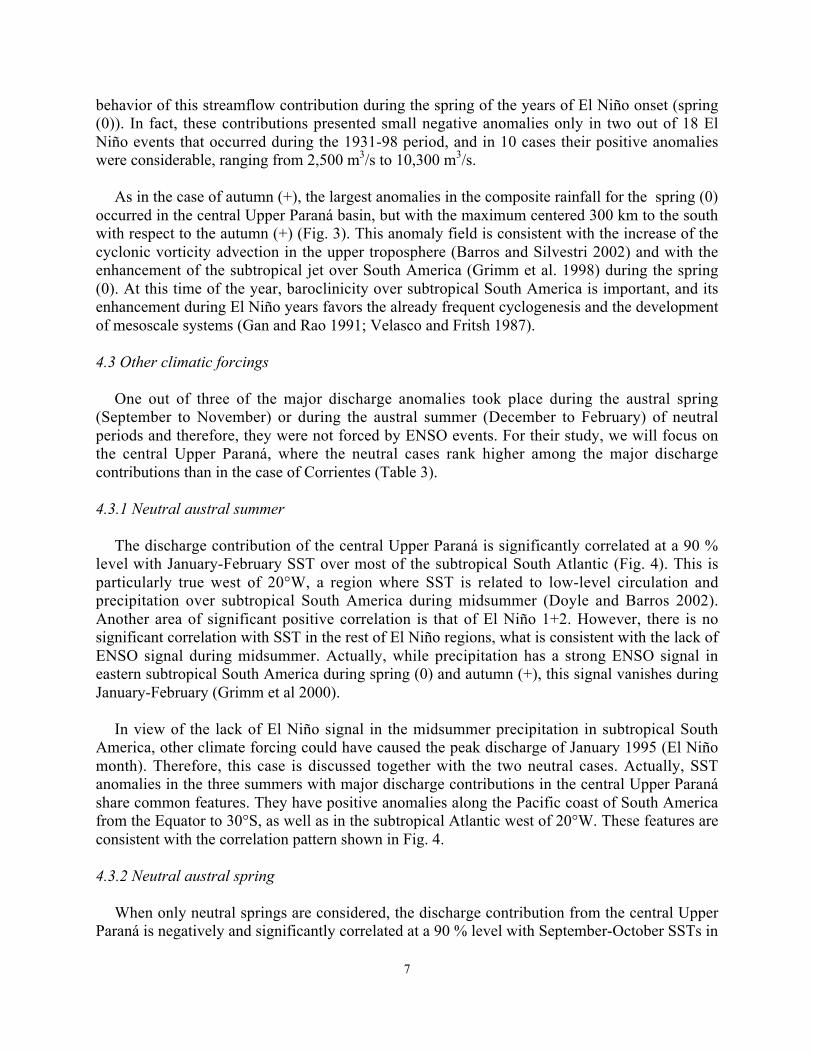
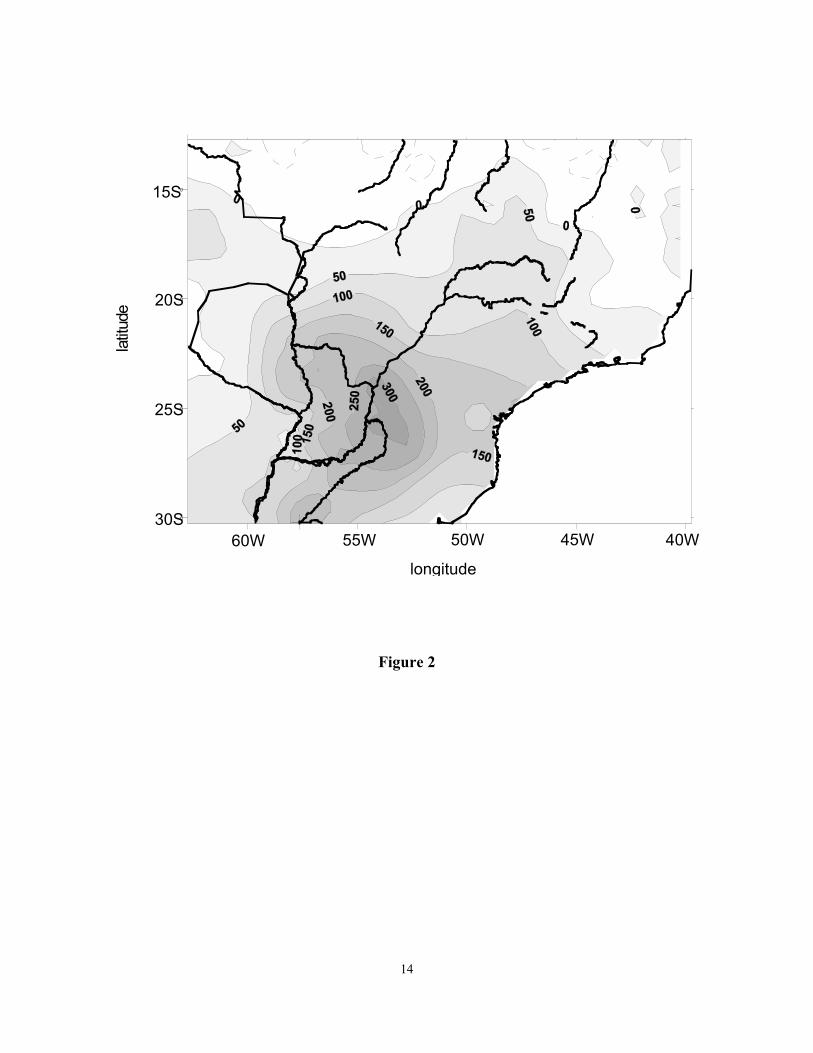
As a result of these conditions, precipitation during autumn (+) season is important over thecentral and southern Upper Paraná and lower Paraguay basins. Figure 2 presents the compositeof rainfall anomalies for the March-May quarter corresponding to years when positive SSTanomalies, over 0.5°C, persisted in El Niño 3 region until May. According to this figure, there islittle chance that this teleconnection might influence the Upper Paraná discharges. In fact, noneof the major discharges at Jupiá took place in autumn (+) .4.2.2 El Niño austral spring
Five of the peaks that rank among the major streamflow contributions from the central UpperParaná occurred during El Niño phase in spring (Table 3). This is in agreement with the general
7
behavior of this streamflow contribution during the spring of the years of El Niño onset (spring(0)). In fact, these contributions presented small negative anomalies only in two out of 18 ElNiño events that occurred during the 1931-98 period, and in 10 cases their positive anomalieswere considerable, ranging from 2,500 m3/s to 10,300 m3/s.
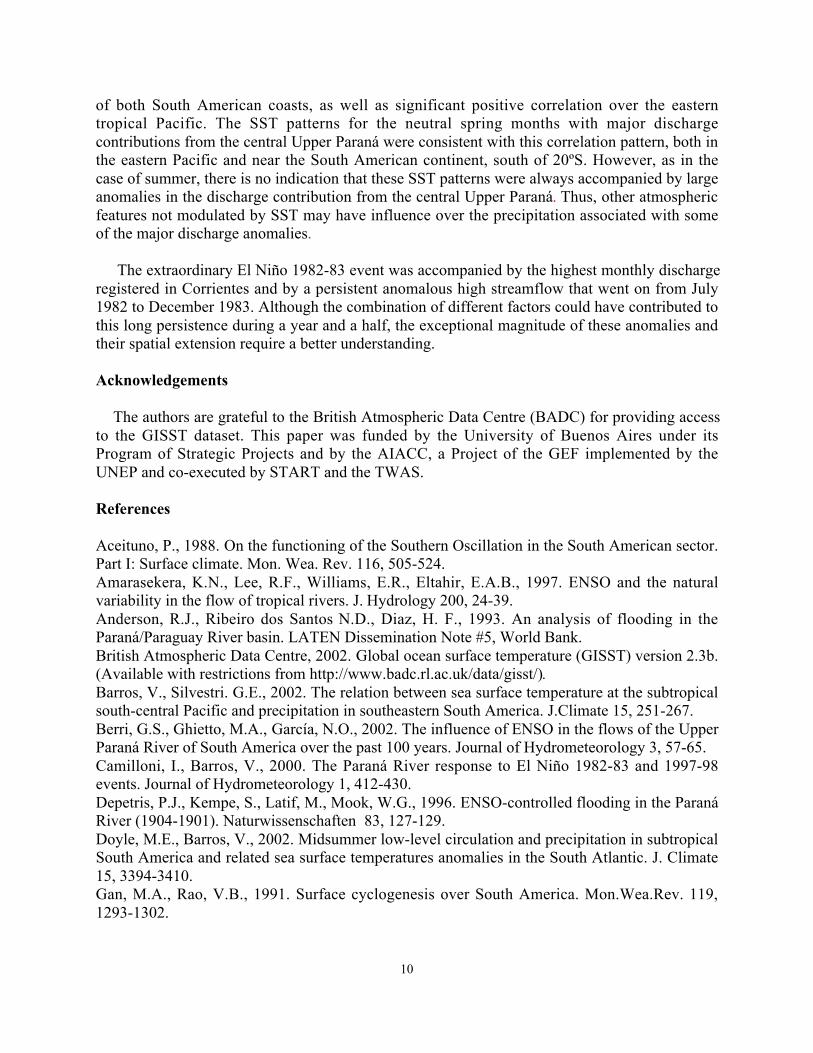
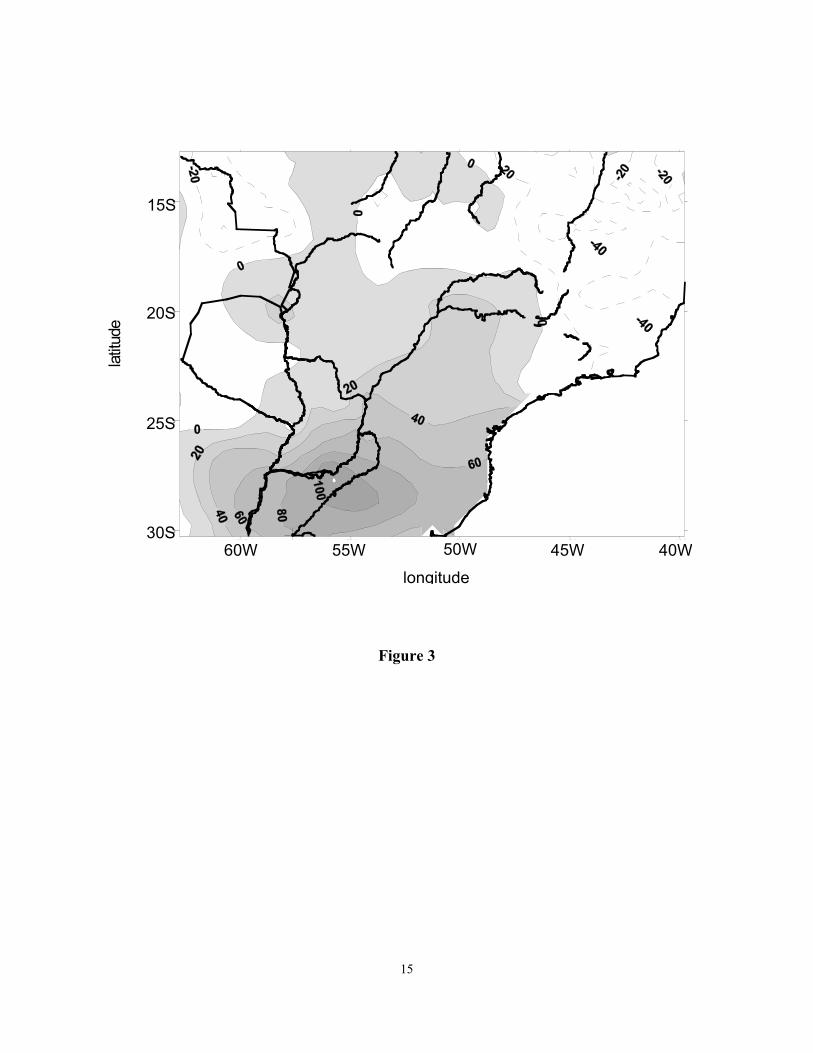
As in the case of autumn (+), the largest anomalies in the composite rainfall for the spring (0)occurred in the central Upper Paraná basin, but with the maximum centered 300 km to the southwith respect to the autumn (+) (Fig. 3). This anomaly field is consistent with the increase of thecyclonic vorticity advection in the upper troposphere (Barros and Silvestri 2002) and with theenhancement of the subtropical jet over South America (Grimm et al. 1998) during the spring(0). At this time of the year, baroclinicity over subtropical South America is important, and itsenhancement during El Niño years favors the already frequent cyclogenesis and the developmentof mesoscale systems (Gan and Rao 1991; Velasco and Fritsh 1987).
4.3 Other climatic forcings
One out of three of the major discharge anomalies took place during the austral spring(September to November) or during the austral summer (December to February) of neutralperiods and therefore, they were not forced by ENSO events. For their study, we will focus onthe central Upper Paraná, where the neutral cases rank higher among the major dischargecontributions than in the case of Corrientes (Table 3).
4.3.1 Neutral austral summer
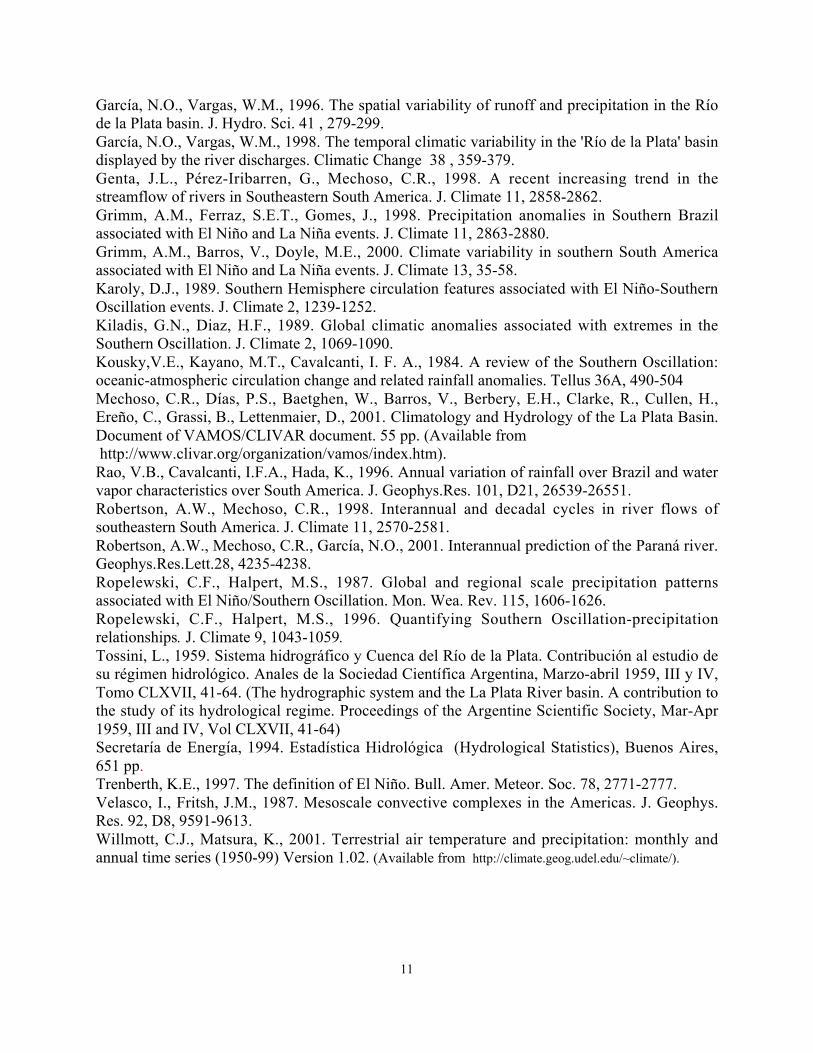
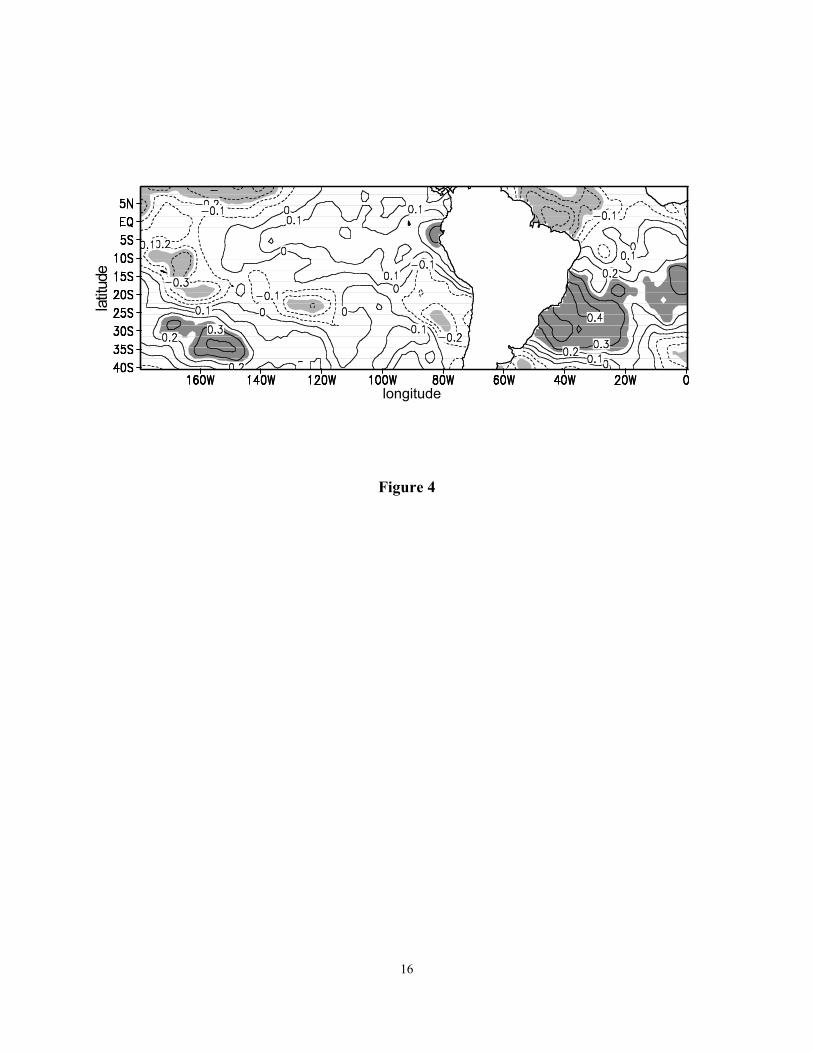
The discharge contribution of the central Upper Paraná is significantly correlated at a 90 %level with January-February SST over most of the subtropical South Atlantic (Fig. 4). This isparticularly true west of 20°W, a region where SST is related to low-level circulation andprecipitation over subtropical South America during midsummer (Doyle and Barros 2002).Another area of significant positive correlation is that of El Niño 1+2. However, there is nosignificant correlation with SST in the rest of El Niño regions, what is consistent with the lack ofENSO signal during midsummer. Actually, while precipitation has a strong ENSO signal ineastern subtropical South America during spring (0) and autumn (+), this signal vanishes duringJanuary-February (Grimm et al 2000).
In view of the lack of El Niño signal in the midsummer precipitation in subtropical SouthAmerica, other climate forcing could have caused the peak discharge of January 1995 (El Niñomonth). Therefore, this case is discussed together with the two neutral cases. Actually, SSTanomalies in the three summers with major discharge contributions in the central Upper Paranáshare common features. They have positive anomalies along the Pacific coast of South Americafrom the Equator to 30°S, as well as in the subtropical Atlantic west of 20°W. These features areconsistent with the correlation pattern shown in Fig. 4.
4.3.2 Neutral austral spring
When only neutral springs are considered, the discharge contribution from the central UpperParaná is negatively and significantly correlated at a 90 % level with September-October SSTs in

8
both oceans near the coasts of South America, south of 20°S (Fig. 5). Over the eastern tropicalPacific, positive significant correlations predominate to the south of the Equator.
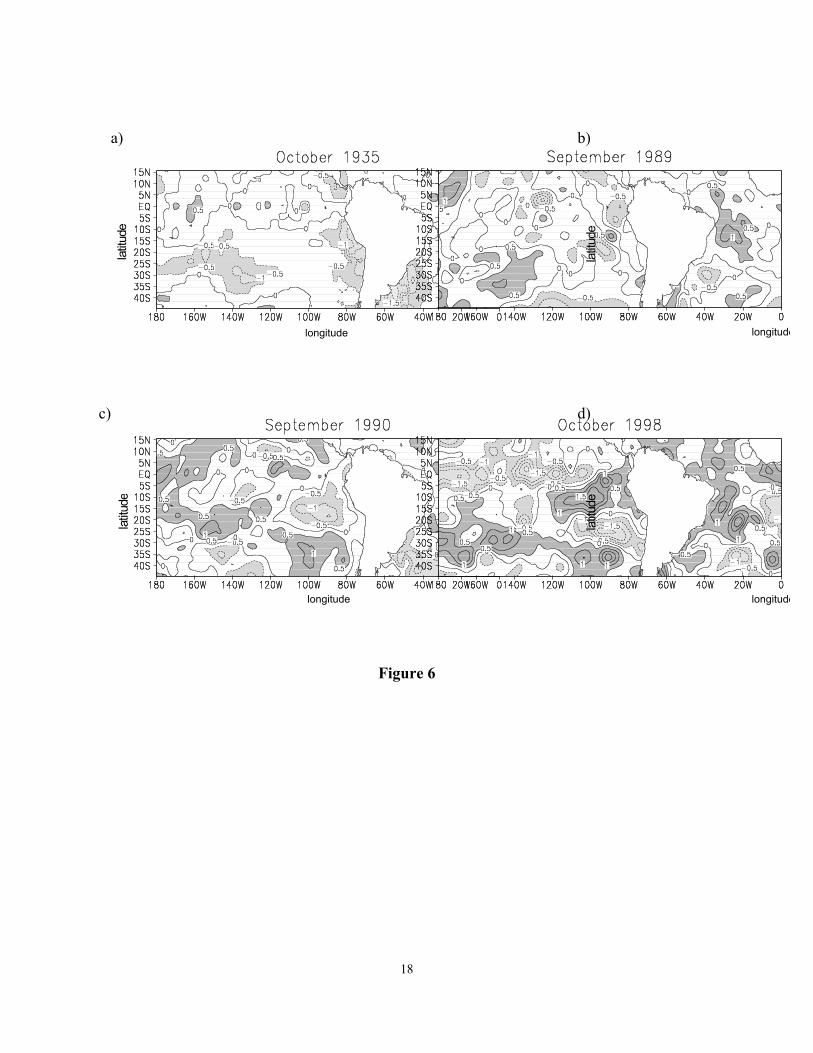
The SST anomalies corresponding to the four neutral spring cases of the major dischargecontribution in the central Upper Paraná are shown in Fig. 6. October 1935 and September 1990present cold anomalies off the coast of South America in both oceans, in accordance with thecorrelation pattern (Fig 6a and 6c). In the case of September 1989, the pattern in these regions issimilar, although the anomalies are smaller (Fig 6b). Thus, these features, which according to thecorrelation pattern (Fig. 5) favor positive discharge anomalies, were observed during the monthsof the neutral spring cases of major anomalies in the central Upper Paraná contribution. Theanomaly pattern over the eastern tropical and subtropical Pacific of October 1998 (Fig. 6d) wasconsistent with the correlation pattern that indicates that warm anomalies in the tropical easternPacific south of the equator are predominantly associated with greater than normal precipitationover the Upper Paraná basin.
5. The extraordinary 1982-83 event
The impact of the strong El Niño 1982-83 event in the Paraná streamflow was the greatestrecorded. The river anomaly discharge in Corrientes exceeded 10,000 m3/s from July 1982 toDecember 1983 (Camilloni and Barros 2000). In that period occurred five out of the 16 majordischarge anomalies, i.e. in July and December 1982 and in March, June and October 1983(Table 2). In June 1983 was registered the largest monthly discharge of the record started in1904. The spatial extension of this impact was also exceptional, reaching the northern UpperParaná, where 3 out of the 13 major discharges occurred during 1982-83 including the top oneregistered in February 1983.
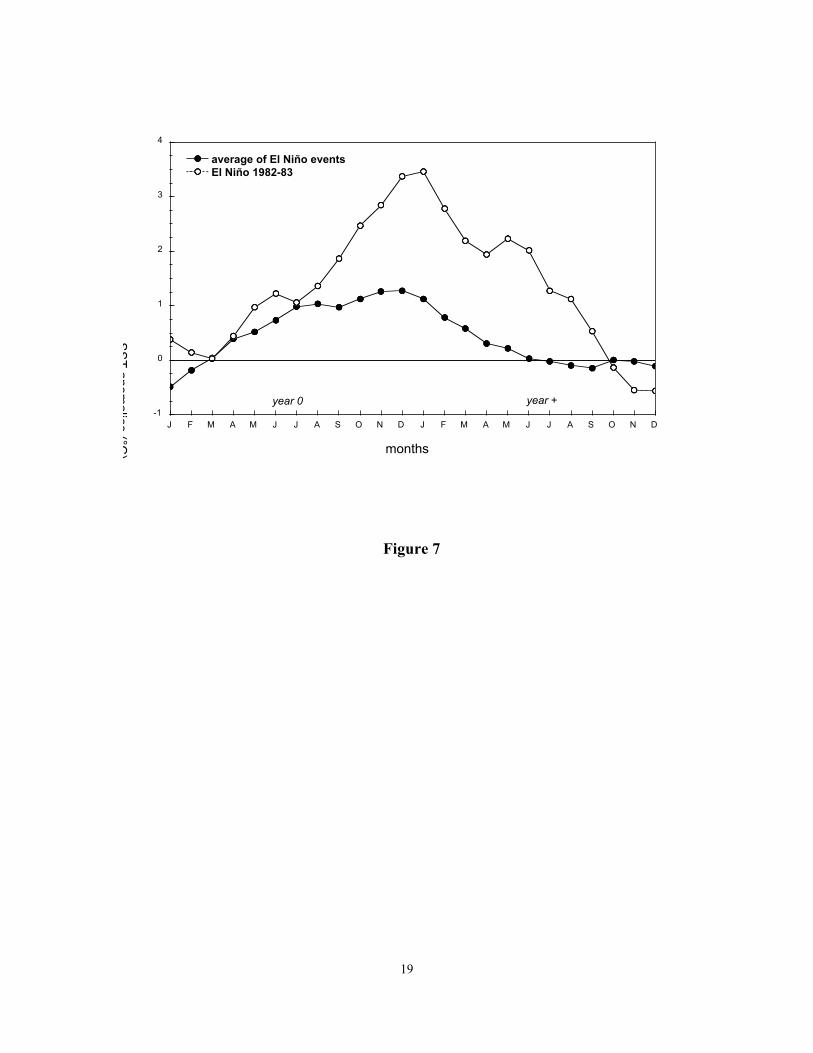
The peaks of March and June 1983 occurred during the autumn (+) of El Niño phase. DuringJune 1983, the magnitude of the SST positive anomaly at El Niño 3 region was the highest of theentire record, and it was considerably higher than the average for El Niño events (Fig. 7).Therefore, according to the positive Spearman rank correlation mentioned earlier, this peakshould be expected to be the highest among autumn (+) discharges at Corrientes (Table 2).
The peak of December 1982 originated in November 1982 in the upper Middle Paraná basin,but it received contributions from the other basins, including the central Upper Paraná basin.This case fits into the category of the spring (0) events that were associated with large positivedischarge anomalies.
Other factors must have influenced the extraordinary precipitation during the austral winter of1982, because in other El Niño cases with greater SST anomalies during the winter(0) thedischarge response was smaller. Considering only the months when El Niño had already started,the rainfall anomalies during winter (0) were considerably large and positive over the centralUpper Paraná basin (Fig. 8). This feature was also observed during the 1982 winter as can beinferred from Table 2. On the other hand, half of El Niño cases that took place during the 1951-1998 period had a SST positive anomaly in El Niño 3 region during the austral winter (0) thatwas equal to or greater than observed in the 1982 event. For instance, in the case of the 1997event, the positive anomaly in the discharge contribution from the central Upper Paraná was only

9
of 6,300 m3/s in July, contrasting with 9,200 m3/s in 1982, although the respective SST at ElNiño 3 region was almost 2º C higher than in 1982.
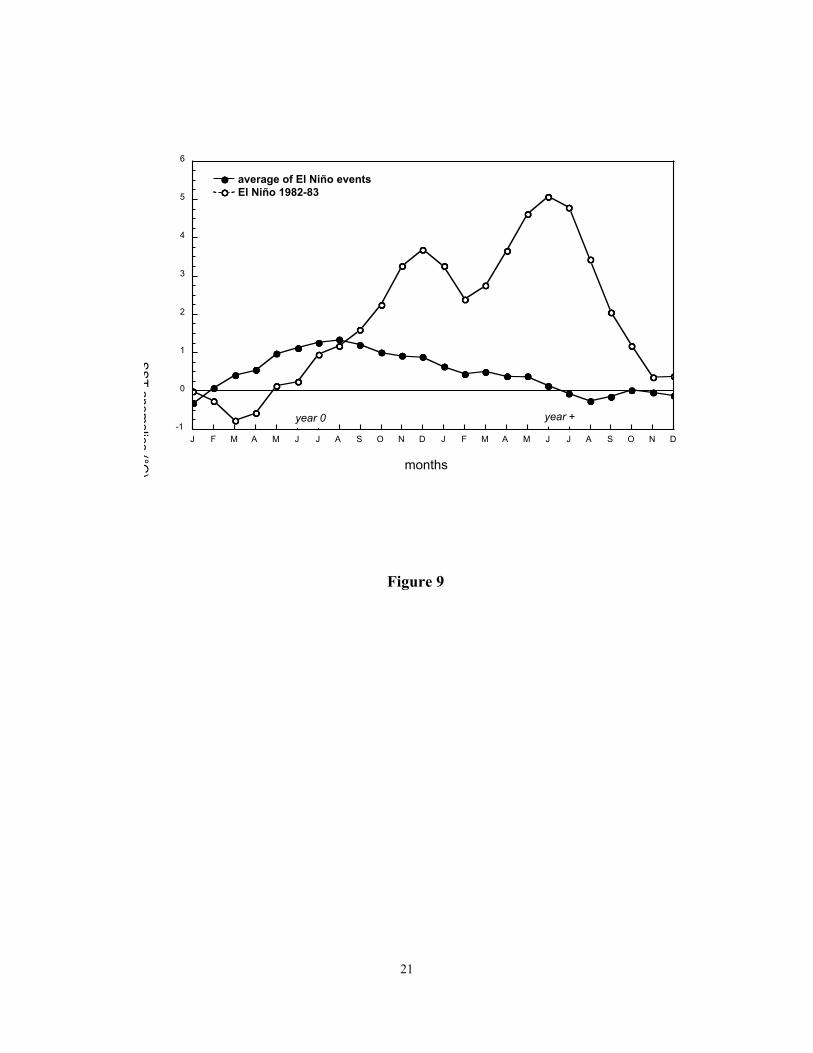
In the case of the October 1983 peak, the anomalous SST at El Niño 1+2 region was stillextremely high (1.5º C) after the end of the El Niño episode (Fig. 9). For neutral springs, thecorrelation between the central Upper Paraná discharge contribution and SST at El Niño 1+2region is significant and positive (Fig. 5). However, in October 1983, the contribution to themajor discharge at Corrientes came also from the northern and the southern Upper Paraná basinindicating that, as in winter (0), other climatic factors could be responsible for the extremehydrological response of the Paraná River.
Although the conjunction of different factors could have contributed to the anomalousprecipitation in the Paraná basin during the 1982-1983 period, the exceptional magnitude ofthese anomalies, and particularly their spatial extension and persistence before, during, and afterEl Niño event could need an additional and more comprehensive explanation.
6. Conclusions
Although the contribution from the central and southern Upper Paraná is only about 40% ofthe Corrientes mean discharge, the major discharges at Corrientes usually originated in thesebasins, especially in the central Upper Paraná. The contribution from the Paraguay Riverenhances the Upper Paraná major discharges, but in a relatively small proportion. On the otherhand, the anomaly contribution from the northern Upper Paraná to the major discharge anomaliesin Corrientes is, not only generally small, but also negative in some cases.
There is a clear relationship between the phases of ENSO and the major discharge anomalies inthe Upper Paraná. About two thirds of the major discharge anomalies in Corrientes and of themajor anomalous contributions from the central Upper Paraná occurred during El Niño events. Inaddition, none of these major anomalies occurred during La Niña phase. This contrasts with theweak monthly or seasonal correlation between the SOI and discharges at Corrientes, indicatingthat the major discharge anomalies were more related to El Niño phase than the rest of thedischarge anomalies. The major discharge anomalies in Corrientes and major discharge contributions from thecentral Upper Paraná that were related to El Niño occurred either in spring (0) or in autumn (+),accompanying the seasonal variation of El Niño precipitation signal in eastern subtropical SouthAmerica. During the twentieth century, the top discharges of the Paraná River at Corrientesoccurred in the autumn (+). In all of these events, SST anomalies in El Niño 3 region persisteduntil May (+) and also, whenever El Niño 3 SST anomalies continued until the autumn (+), therewas an important positive discharge anomaly in the Upper Paraná.
The remaining third of the major discharge contributions from the Upper Paraná took placeduring the austral spring or the austral summer of neutral periods. During the summer cases,there were positive anomalies along the Pacific coast of South America from the Equator to30°S, as well as predominant positive anomalies in the subtropical Atlantic west of 20°W.During neutral springs, the discharge contributions from the upper part of the Upper Paraná havesignificant negative correlation with the September-October SSTs south of 20°S in the proximity
10
of both South American coasts, as well as significant positive correlation over the easterntropical Pacific. The SST patterns for the neutral spring months with major dischargecontributions from the central Upper Paraná were consistent with this correlation pattern, both inthe eastern Pacific and near the South American continent, south of 20ºS. However, as in thecase of summer, there is no indication that these SST patterns were always accompanied by largeanomalies in the discharge contribution from the central Upper Paraná. Thus, other atmosphericfeatures not modulated by SST may have influence over the precipitation associated with someof the major discharge anomalies.
The extraordinary El Niño 1982-83 event was accompanied by the highest monthly dischargeregistered in Corrientes and by a persistent anomalous high streamflow that went on from July1982 to December 1983. Although the combination of different factors could have contributed tothis long persistence during a year and a half, the exceptional magnitude of these anomalies andtheir spatial extension require a better understanding.
Acknowledgements
The authors are grateful to the British Atmospheric Data Centre (BADC) for providing accessto the GISST dataset. This paper was funded by the University of Buenos Aires under itsProgram of Strategic Projects and by the AIACC, a Project of the GEF implemented by theUNEP and co-executed by START and the TWAS.
References
Aceituno, P., 1988. On the functioning of the Southern Oscillation in the South American sector.Part I: Surface climate. Mon. Wea. Rev. 116, 505-524.Amarasekera, K.N., Lee, R.F., Williams, E.R., Eltahir, E.A.B., 1997. ENSO and the naturalvariability in the flow of tropical rivers. J. Hydrology 200, 24-39.Anderson, R.J., Ribeiro dos Santos N.D., Diaz, H. F., 1993. An analysis of flooding in theParaná/Paraguay River basin. LATEN Dissemination Note #5, World Bank.British Atmospheric Data Centre, 2002. Global ocean surface temperature (GISST) version 2.3b.(Available with restrictions from http://www.badc.rl.ac.uk/data/gisst/).Barros, V., Silvestri. G.E., 2002. The relation between sea surface temperature at the subtropicalsouth-central Pacific and precipitation in southeastern South America. J.Climate 15, 251-267.Berri, G.S., Ghietto, M.A., García, N.O., 2002. The influence of ENSO in the flows of the UpperParaná River of South America over the past 100 years. Journal of Hydrometeorology 3, 57-65.Camilloni, I., Barros, V., 2000. The Paraná River response to El Niño 1982-83 and 1997-98events. Journal of Hydrometeorology 1, 412-430.Depetris, P.J., Kempe, S., Latif, M., Mook, W.G., 1996. ENSO-controlled flooding in the ParanáRiver (1904-1901). Naturwissenschaften 83, 127-129.Doyle, M.E., Barros, V., 2002. Midsummer low-level circulation and precipitation in subtropicalSouth America and related sea surface temperatures anomalies in the South Atlantic. J. Climate15, 3394-3410.Gan, M.A., Rao, V.B., 1991. Surface cyclogenesis over South America. Mon.Wea.Rev. 119,1293-1302.
11
García, N.O., Vargas, W.M., 1996. The spatial variability of runoff and precipitation in the Ríode la Plata basin. J. Hydro. Sci. 41 , 279-299.García, N.O., Vargas, W.M., 1998. The temporal climatic variability in the 'Río de la Plata' basindisplayed by the river discharges. Climatic Change 38 , 359-379.Genta, J.L., Pérez-Iribarren, G., Mechoso, C.R., 1998. A recent increasing trend in thestreamflow of rivers in Southeastern South America. J. Climate 11, 2858-2862.Grimm, A.M., Ferraz, S.E.T., Gomes, J., 1998. Precipitation anomalies in Southern Brazilassociated with El Niño and La Niña events. J. Climate 11, 2863-2880.Grimm, A.M., Barros, V., Doyle, M.E., 2000. Climate variability in southern South Americaassociated with El Niño and La Niña events. J. Climate 13, 35-58.Karoly, D.J., 1989. Southern Hemisphere circulation features associated with El Niño-SouthernOscillation events. J. Climate 2, 1239-1252.Kiladis, G.N., Diaz, H.F., 1989. Global climatic anomalies associated with extremes in theSouthern Oscillation. J. Climate 2, 1069-1090.Kousky,V.E., Kayano, M.T., Cavalcanti, I. F. A., 1984. A review of the Southern Oscillation:oceanic-atmospheric circulation change and related rainfall anomalies. Tellus 36A, 490-504Mechoso, C.R., Días, P.S., Baetghen, W., Barros, V., Berbery, E.H., Clarke, R., Cullen, H.,Ereño, C., Grassi, B., Lettenmaier, D., 2001. Climatology and Hydrology of the La Plata Basin.Document of VAMOS/CLIVAR document. 55 pp. (Available from http://www.clivar.org/organization/vamos/index.htm).Rao, V.B., Cavalcanti, I.F.A., Hada, K., 1996. Annual variation of rainfall over Brazil and watervapor characteristics over South America. J. Geophys.Res. 101, D21, 26539-26551.Robertson, A.W., Mechoso, C.R., 1998. Interannual and decadal cycles in river flows ofsoutheastern South America. J. Climate 11, 2570-2581.Robertson, A.W., Mechoso, C.R., García, N.O., 2001. Interannual prediction of the Paraná river.Geophys.Res.Lett.28, 4235-4238.Ropelewski, C.F., Halpert, M.S., 1987. Global and regional scale precipitation patternsassociated with El Niño/Southern Oscillation. Mon. Wea. Rev. 115, 1606-1626.Ropelewski, C.F., Halpert, M.S., 1996. Quantifying Southern Oscillation-precipitationrelationships. J. Climate 9, 1043-1059.Tossini, L., 1959. Sistema hidrográfico y Cuenca del Río de la Plata. Contribución al estudio desu régimen hidrológico. Anales de la Sociedad Científica Argentina, Marzo-abril 1959, III y IV,Tomo CLXVII, 41-64. (The hydrographic system and the La Plata River basin. A contribution tothe study of its hydrological regime. Proceedings of the Argentine Scientific Society, Mar-Apr1959, III and IV, Vol CLXVII, 41-64)Secretaría de Energía, 1994. Estadística Hidrológica (Hydrological Statistics), Buenos Aires,651 pp.Trenberth, K.E., 1997. The definition of El Niño. Bull. Amer. Meteor. Soc. 78, 2771-2777.Velasco, I., Fritsh, J.M., 1987. Mesoscale convective complexes in the Americas. J. Geophys.Res. 92, D8, 9591-9613.Willmott, C.J., Matsura, K., 2001. Terrestrial air temperature and precipitation: monthly andannual time series (1950-99) Version 1.02. (Available from http://climate.geog.udel.edu/~climate/).

12
FIGURE CAPTIONS
Figure 1. Gauging stations and rivers, 1: Jupiá, 2: Itaipú, 3: Corrientes, 4: Salto Caxias and5: Puerto Bermejo.
Figure 2. Composite of rainfall anomalies for March (+) to May (+) of El Niño events thatpersisted until May in El Niño 3 region.
Figure 3. As in Figure 2, but for September to November of El Niño (0) years.
Figure 4. January-February field of the linear correlation between the central Upper Paranádischarge and SST. Significant correlation coefficients at the 90% level are shaded.
Figure 5. As in Figure 4, but for September-October of neutral years.
Figure 6. SST anomalies for (a) October 1935, (b) September 1989, (c) September 1990 and (d)October 1998.
Figure 7. SST anomalies in El Niño 3 region for the 1982-83 event and for the average of thetwentieth century El Niño events.
Figure 8. As Figure 2, but for June to August of El Niño (0) years.
Figure 9. As in Figure 7, but for SST anomalies in El Niño 1+2 region.
13
Figure 1
-65.0 -60.0 -55.0 -50.0 -45.0 -40.0
longitude
-35.0
-30.0
-25.0
-20.0
-15.0
l atit
u de
ARGENTINA
PARAGUAY
URUGUAY
BRAZIL
BOLIVIA
Atlantic Ocean
Paraná
Rive
r
Paranaiba River
Grande River
Para
guay
Riv
erIguazú River
1
2
3
45
15S
20S
25S
30S
35S65W 60W 55W 50W 45W 40W
14
Figure 2
-60.0 -55.0 -50.0 -45.0 -40.0
longitude
-30.0
-25.0
-20.0
-15.0
l at it
u de
15S
20S
25S
30S60W 55W 50W 45W 40W
15
Figure 3
-60.0 -55.0 -50.0 -45.0 -40.0
longitude
-30.0
-25.0
-20.0
-15.0
l ati t
u de
15S
20S
25S
30S60W 55W 50W 45W 40W
16
Figure 4
lati t
u de
longitude

17
Figure 5
longitude
lati t
u de
18
Figure 6
a) b)
c) d)
l at i t
u de
l at i t
ude
lati t
ude
l at i t
ude
longitude longitude
longitude longitude
19
Figure 7
months
SS
T anom
alies (°C)
-1
0
1
2
3
4
J F M A M J J A S O N D J F M A M J J A S O N D
average of El Niño eventsEl Niño 1982-83
year 0 year +

20
-60.0 -55.0 -50.0 -45.0 -40.0
longitude
-30.0
-25.0
-20.0
-15.0
latit
ude
15S
20S
25S
30S
20
2020
60W 55W 50W 45W 40W
Figure 8
21
Figure 9
months
SS
T anom
alies (°C)
-1
0
1
2
3
4
5
6
J F M A M J J A S O N D J F M A M J J A S O N D
average of El Niño eventsEl Niño 1982-83
year 0 year +
22
River Station Source Data period Annual meandischarge 1931-
1980(103 m3/s)
Paraná Jupiá ONS 1931-1998 5.9Paraná Itaipú ONS 1931-1998 9.1Paraná Corrientes SRH 1904-1998 15.9Iguazú Salto Caxias ONS 1931-1998 1.2Paraguay Puerto Bermejo SRH 1910-1998 3.5
Table 1. Gauging stations shown in Fig. 1. ONS: Operador Nacional do SistemaElétrico, SRH: Subsecretaría de Recursos Hídricos.

23
Corrientes
Discharge peak date
Jupiá(Northern
Upper Paraná)
Central UpperParaná
contribution
SouthernUpperParaná
contribution
Puerto Bermejo(Paraguay)
Jun 1983 (Autumn - N(+)) 38.3 8.5 (5.4) 18.1 (13.3) 6.1 5.6Jun 1992 (Autumn - N(+) 26.8 0.5 (2.5) 10.5 (13.3) 11.3 4.4
Dec 1982 (Spring/Summer - N(0)) 26.1 4.4 (2.3) 9.4 (9.5) 7.6 4.6Mar 1983 (Autumn - N(+)) 24.2 8.4 (13.2) 8.8 (3.6) 3.8 3.4Jun 1905 (Autumn - N(+)) 24.2 N/A (N/A) N/A (N/A) N/A N/AMay 1998 (Autumn-N(+)) 23.0 0.4 (-1.0) 9.4 (16.3) 8.6
4.6(*)Oct 1998 (Spring - neutral) 21.0 0.8 (-0.4) 15.2 (12.2) 1.0 4.1(*)Oct 1983 (Spring - neutral) 20.5 5.9 (5.4) 6.4 (7.0) 6.0 2.2
Jul 1982 (Winter - N(0)) 18.8 2.9 (3.7) 9.2 (2.9) 3.6 3.1Feb 1997 (Summer - neutral) 17.7 0.9 (7.4) 12.8 (-2.0) 2.2 1.8Sep 1989 (Spring - neutral) 16.7 1.0 (1.1) 8.5 (4.5) 3.8 3.4Sep 1990 (Spring - neutral) 16.4 0.9 (0.7) 7.9 (5.2) 5.7 1.9Jan 1912 (Summer – N(+)) 15.9 N/A (N/A) N/A (N/A) N/A N/ANov 1997 (Spring - N(0)) 15.6 1.1 (0.3) 9.8 (9.2) 1.6 3.1Jan 1966 (Summer - N(+)) 15.4 3.3 (2.4) 2.6 (3.8) 6.5 3.0Sep 1957 (Spring - N(0)) 15.0 1.3 (0.9) 10.3 (8.4) 1.3 2.0
Table 2. Maximum discharge anomalies at Corrientes and the correspondingdischarge anomalies at Jupiá and Puerto Bermejo and discharge contributionanomalies of two sectors of the Upper Paraná. Previous month discharge orcontribution anomaly is indicated in brackets. Values in 103 m3/s. (*) Discharge datafor 1995-98 were estimated considering river level data.
24
Central Upper Paraná contribution
Discharge peak date
Jupiá Itaipú+Salto Caxias
Jun 1983 (Autumn N(+)) 18.1 8.5 26.6Apr 1998 (Autumn N(+)) 16.3 -1.0 15.3Oct 1998 (Spring – neutral) 15.2 0.8 16.0May 1992 (Autumn N(+)) 13.3 2.5 15.8Feb 1997 (Summer – neutral) 12.8 0.9 13.7Jan 1995 (Summer – N) 11.5 -1.3 10.1Oct 1935 (Spring- neutral) 11.2 1.4 12.6Jan 1990 (Summer – neutral) 10.8 3.9 14.7Sep 1957 (Spring – N (0)) 10.3 1.3 11.7May 1987 (Autumn N(+)) 10.2 1.4 11.6Nov 1997 (Spring – N(0)) 9.8 1.1 10.9Oct 1972 (Spring – N(0)) 9.6 2.6 12.2Nov 1982 (Spring – N(0)) 9.5 2.3 11.8Jul 1982 (Winter – N(0)) 9.2 2.9 12.1Mar 1983 (Autumn N(+)) 8.8 8.4 17.1Sep 1989 (Spring- neutral) 8.5 1.0 9.5Sep 1990 (Spring- neutral) 7.9 0.9 8.8Oct 1993 (Spring – N(0)) 7.8 0.9 8.8
Table 3. Maximum discharge contribution anomalies of the central Upper Paraná and thecorresponding discharge anomalies at Jupiá and discharge contribution anomalies at Itaipú +Salto Caixas. Values in 103 m3/s.