Extraordinary Network Discover Asia’s New
33
Discover Asia’s New Extraordinary Network SLC:ASX H1 FY20 Results & Market Update Tuesday 18th February 2020 SINGAPORE
Transcript of Extraordinary Network Discover Asia’s New

Discover Asia’s New Extraordinary Network
SLC:ASX H1 FY20 Results & Market Update
Tuesday 18th February 2020
SINGAPORE

No relianceTo the maximum extent permitted by law, the information contained in this presentation is given without any liability whatsoever being accepted by Superloop Limited (Superloop) or any of its related bodies corporate or their respective directors, officers, partners, employees, advisors and agents (Relevant Parties). The information contained in this presentation is not intended to constitute legal, tax or accounting advice or opinion. No representation or warranty, expressed or implied, is made as to the accuracy, completeness or thoroughness of the information, whether as to the past or future. Recipients of the document must make their own independent investigations, consideration and evaluation.
Limited disclosureThis presentation contains summary information about Superloop and its activities which is current at the date of this presentation. The information in this presentation is of a general nature. The presentation does not purport to contain all the information that a prospective investor may require in evaluating a possible investment in Superloop, nor does it contain all the information which would be required in a disclosure document prepared in accordance with the requirements of the Corporations Act 2001 (Cth) and should not be used in isolation as a basis to invest in Superloop. It should be read in conjunction with Superloop’s other periodic and continuous disclosure announcements lodged with the Australian Securities Exchange, which are available at www.asx.com.au.
Seek your own adviceIn providing this presentation, Superloop has not considered the objectives, financial position or needs of the recipient. The recipient should consult with its own legal, tax or accounting advisers as to the accuracy and application of the information contained herein, and conduct its own due diligence and other enquiries in relation to such information and any investment in Superloop and the recipient’s objectives, financial position or needs.
No offer to acquire Superloop sharesThe information in this presentation is not an offer or recommendation to purchase or subscribe for securities in Superloop or to retain or sell any securities that are currently held. In particular, this document does not constitute any part of any offer to sell, or the solicitation of an offer to buy, any securities in the United States or to, or for the account or benefit of any ‘US person’ as defined in Regulation S under the U.S. Securities Act of 1993 (Securities Act). Superloop shares have not been, and will not be, registered under the Securities Act or the securities laws of any state or other jurisdiction of the United States, and may not be offered or sold in the United States or to any US person without being so registered or pursuant to an exemption from registration.
Forward-looking statementsTo the maximum extent permitted by law, Superloop and the Relevant Parties disclaim any responsibility for any errors or omissions in such information, including the financial calculations, projections and forecasts and indications of, and guidance on, future earnings and performance and financial position set forth herein. This presentation contains certain ‘forward-looking statements’. The words “forecast”, “estimate”, “like”, “anticipate”, “project”, “opinion”, “should”, “could”, “may”, “target” and other similar expressions are intended to identify forward-looking statements. Such forward-looking statements are not guarantees of future performance and involve known and unknown risks, uncertainties and other factors and are subject to significant business, economic and competitive uncertainties and contingencies associated with exploration and/or production, many of which are beyond the control of Superloop, that may cause actual results to differ materially from those predicted or implied by any forward-looking statements. No representation or warranty is made by or on behalf of Superloop or the Relevant Parties that any projection, forecast, calculation, forward-looking statement, assumption or estimate contained in this presentation should or will be achieved or that actual outcomes will not differ materially from any forward-looking statements.
CurrencyAll references to “$” are to Australian currency (AUD) unless otherwise noted.
Disclaimer
H1 FY20 Update2

ADELAIDE
SLC:ASX H1 FY20 Results: Agenda
H1 FY20 Performance: EBITDA $4.1m in line with our expectations
Connectivity Growth: Customers buying more and we are delivering quicker
Customer Proof Points: Strong multi-year, annuity style large contracts signed in H1 prove portfolio is compelling
Platforms Leveraging Network: Full suite offering appealing to businesses & homes
Targeted Investments: Capex & Opex lowering, partially offset by COGS investments
Outlook: FY20 Guidance revised to $12m - $15m reflecting the timing of delivery of large executed contracts and uncertainty relating to the international trade impact of Coronavirus
H1 FY20 Performance Connectivity Growth Customer Success Platforms Leveraging Network Investments in Our Strategy Outlook Appendix H1 FY20 Update3
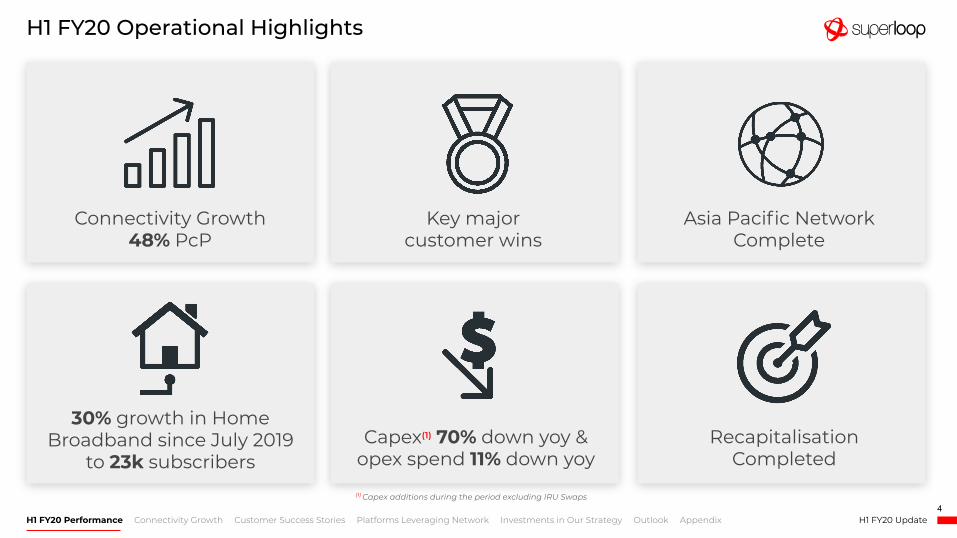
(1) Capex additions during the period excluding IRU Swaps
H1 FY20 Operational Highlights
Asia Pacific Network Complete
Key major customer wins
30% growth in Home Broadband since July 2019
to 23k subscribersRecapitalisation
Completed
Connectivity Growth48% PcP
Capex(1) 70% down yoy & opex spend 11% down yoy
H1 FY20 Performance Connectivity Growth Customer Success Stories Platforms Leveraging Network Investments in Our Strategy Outlook Appendix H1 FY20 Update4

Overview of Superloop’s portfolio connecting Asia Pacific
Total SLC Group
Asia Pacific Core Fibre Network
Fibre networks connecting key hubs in Singapore, Australia & Hong Kong
and INDIGO subsea cable
1
48%Revenue PcP(1)
Platforms leveraging APAC Fibre Network
Fixed Wireless (Connectivity), Guest WiFi (Broadband), Home Broadband (NBN & FW) CyberHound Security (Services)
2
7%Revenue PcP(2)
Non-core CMS being retired
Cloud Managed Services providing hosted IT & equipment procurement
to small businesses
3
31%Revenue PcP
(1)Core Fibre Connectivity revenues excluding INDIGO development revenue, includes installation revenues and construction revenues.(2)Excluding Divestment Gx2 US/UK and Gx2 non-recurring installation revenue.
H1 FY20 Performance Connectivity Growth Customer Success Stories Platforms Leveraging Network Investments in Our Strategy Outlook Appendix H1 FY20 Update
19%Gross Margin PcP(2)
22%Gross Margin PcP
$51.3m H1 FY20 Total Revenue
$26.5m Gross Margin52% Margin
$4.1m H1 FY20 EBITDA
5
50%Gross Margin PcP(1)

Core Fibre Connectivity+50% growth in gross margin as recurring revenue from young network is onboarded and billed
Fixed Wireless Connectivity+$1.0m gross margin with lower COGS (incl. AASB16 impact of rooftop leases) offsetting lower procurement revenue
Subsea Cable DevelopmentPrior year contained $2.9m margin from one-off development revenues whilst INDIGO being built
Guest WiFiFewer installs in APAC, coupled with Dec 18 sale of non-core US/UK WiFi customer base
Home BroadbandStrong margin growth now customers are ‘on-net’, with 30% subscriber growth since Jul 2019
Services inc. CMS & CybersecurityRetirement of non-core low- bandwidth cloud managed services
H1 FY20 Performance by Segment
$m AUD Core Fibre Connectivity
Subsea Cable Dev.
Fixed Wireless Connectivity
APAC Guest WiFi
Non APAC Guest WiFi
Home Broadband
CMS + Cybersecurity
H1 FY20
Revenue $17.2 $ - $9.1 $5.8 $ - $8.8 $10.0
Gross Margin $6.3 $ - $7.7 $3.2 $ - $3.8 $5.0
Gross Margin % 37% - % 85% 55% - % 43% 50%
H1 FY19
Revenue $11.6 $3.0 $10.5 $9.3 $2.3 $8.7 $14.1
Gross Margin $4.2 $2.9 $6.7 $4.4 $1.5 $2.9 $6.4
Gross Margin % 36% 97% 64% 47% 65% 33% 45%
GM HoH $2.1 $(2.9) $1.0 $(1.2) $(1.5) $0.9 $(1.4)
GM Growth +50% -100% +15% -27% -100% +31% -22%
1 2 3
BroadbandConnectivity Services
Fibre networks Platforms Services
H1 FY20 Update6
H1 FY20 Performance Connectivity Growth Customer Success Stories Platforms Leveraging Network Investments in Our Strategy Outlook Appendix
Divisional performance reflects our refinement of focus to core segments announced in 2019

$4.5mH1 FY19 EBITDA
$2.1m
Opex savings
(incl. AASB16 impact)$(2.9)m
Subsea develop.margin
from prior year
$(1.6)m
WiFi margin from non
APAC customer
divestment (US/UK)
$(1.5)m
Net Services decline
Margin growth on Core Fibre
Connectivity
$0.5m
$0.9m
Margin growth in
Home Broadband
$4.1mH1 FY20 EBITDA
$2.3m
Employee costs
savings
1 2 3Fibre networks Platforms Non Core Services being retired
H1 FY20 EBITDA Movements on Prior H1 FY19
$1.0m
Fixed Wireless Connectivity
margin (inc AASB16
impact)
$(1.2)m
Wifi Installs margin
H1 FY20 Performance Connectivity Growth Customer Success Stories Platforms Leveraging Network Investments in Our Strategy Outlook Appendix H1 FY20 Update
H1 EBITDA Growth Drivers
$2.1m growth in core Connectivity Revenues
$1.0m Fixed Wireless incl AASB16
$0.9m Home Broadband margin growth on-net
$2.3m Labour savings
Anticipated H1 Headwinds
$(2.9)m absence of subsea dev. now INDIGO complete
$(1.5)m from Dec 18 sale of non APAC WiFi customer base
$(1.6)m decline from retiring non-core CMS segment
7

(1)Impairment of non-core CMS services segment includes $43.3m goodwill, PP&E and accelerated amortisation of contracts
H1 FY20 Update
$4.1m EBITDA in line with our expectations
Strong underlying margin growth in our core portfolio, offset by reduction in non-core margins from CMS, non APAC (US/UK) WiFi base sold, and absence of INDIGO development revenues from prior year
11% lower Operational Costs from FY19 labour savings
H1 FY20 Performance Connectivity Growth Customer Success Stories Platforms Leveraging Network Investments in Our Strategy Outlook Appendix
H1 FY20 Group Profit & Loss Performance
Total Revenue
Revenue excl. subsea dev.
Direct Costs
Gross Margin
Gross Margin excl. subsea dev.
Gross Margin %
Operational Costs
EBITDA
EBITDA excl. subsea dev.
Depreciation & Amortisation(1)
Non-Cash Impairment(1)
Net profit/ (loss) before tax
$51.3
$51.3
$(24.8)
$26.5
$26.5
52%
$(22.4)
$4.1
$4.1
$(21.7)
-
$(20.5)
(15)%
(10)%
19%
(11)%
(1)%
3pp
11%
(9)%
156%
(58)%
(74)%
$51.3
$47.7
$(23.6)
$27.6
$24.1
54%
$(20.1)
$7.5
$3.9
$(9.7)
-
$(3.7)
H1 FY18
$66.9
$56.6
$(27.5)
$39.4
$29.1
59%
$(24.9)
$14.6
$4.3
$(12.4)
-
$0.9
H2 FY18 H1 FY19
$60.3
$57.3
$(30.6)
$29.7
$26.8
49%
$(25.2)
$4.5
$1.6
$(13.7)
-
$(11.8)
$59.5
$58.9
$(30.8)
$28.7
$28.1
48%
$(24.7)
$4.0
$3.4
$(22.8)
$(50.7)
$(72.6)
H2 FY19 H1 FY20 PcP
8

Cash Flow ($m)
Operating cash flows
Investing cash flows
Financing cash flows
Net cash flows
Balance Sheet ($m)
Cash & cash equivalents
Property, plant & equipment
Network IRUs intangible assets
Goodwill from acquisitions
Other intangible assets
Total Assets
Net debt(1)
Total Liabilities
Net Assets
H1 FY19
2.0
(34.3)
25.3
(7.1)
30/6/19
18.9
228.7
47.3
135.1
51.8
529.5
70.3
183.3
346.2
Change
4.0
(10.6)
10.7
4.1
Change
(3.1)
9.1
17.8
-
(5.7)
3.6
(41.8)
(64.3)
67.9
Financial Position at 31 December 2019
H1 FY20
6.0
(44.9)*
36.0
(3.0)
31/12/19
15.8
237.8
65.1
135.1
46.1
533.1
28.5
119.0
414.1
(1) Net debt = short-term & long-term interest-bearing borrowings (excluding Operating Leases) less cash & cash equivalents.(2) Gearing ratio = net debt (excluding operating leases) / (net debt + equity).(3)Leverage ratio = 12 month rolling Adjusted EBITDA / Net Financial Indebtedness.
H1 FY20 UpdateH1 FY20 Performance Connectivity Growth Customer Success Stories Platforms Leveraging Network Investments in Our Strategy Outlook Appendix
*Includes ~$22m H2 FY19 AP balance as indicated in FY 2019 Annual Report
$183.3m Liabilities
$346.2mNet
Assets
$414.1mNet
Assets
$119.0mLiabilities
Jun 2019 Dec 2019
9
Cash Flows+$4m operating cash flows year on year
+ Investing cash flows includes payments for capital expenditure incurred in FY 2019 with cash outlay in H1 FY20.
+ Financing cash flows PcP includes equity funds (net of fees) offset by net debt repaid.
Balance SheetSeptember recapitalisation resulted in net debt reduction from $70.3m to $28.5m and a net asset increase from $346.2m to $414.1m
Book Value of Net Assets $1.14/share
Gearing ratio(2) 6.3%
Leverage Ratio(3)
3.1x
$2.0m OperatingCashflow
$6.0m Operating Cashflow
H1 FY19 H2 FY19

PERTH
Connectivity Growth
H1 FY20 Performance Connectivity Growth Customer Success Stories Platforms Leveraging Network Investments in Our Strategy Outlook Appendix H1 FY20 Update10

Customers are buying more and we are delivering quicker
H1 FY20 Performance Connectivity Growth Customer Success Stories Platforms Leveraging Network Investments in Our Strategy Outlook Appendix H1 FY20 Update
(1) Weighted average calendar days from order received to service commencing, based on what has already been delivered from H2 FY19 order pipeline
$1.9m
H1 FY18
H2 FY18
H1 FY19
H2 FY19
H1 FY20
$6.6m$5.9m
$5.3m
$7.8m
158 days
104 days
88 days
59(1) days
H1 FY18
H2 FY18
H1 FY19
H2 FY19
H1 FY20
NEW FIBRE CONNECTIVITY ANNUALISEDREVENUE SOLD
(excluding IRUs & swaps)
CONNECTIVITY DELIVERY TURNAROUND TIME
Factors impacting “Turnaround Time”:
- Customer readiness to activate services- Supplier lead times for build (e.g. NBN)- Superloop Team Throughput Productivity- Automation of process flow, incl. automated network provisioning
Weighted average
calendar days from order received to
service commenced
11

H1 FY18
Hong Kong
Australia
Singapore
Core Fibre Connectivity Revenues(1)
$17.2m
Higher sales & quicker delivery translating to strong growth
$7.4
$8.2
$1.6
$11.6m
$4.9
$5.6
$1.1
H1 FY19
H1 FY20
$9.5m
$2.8
$6.3
$0.4
H1 FY20 Performance Connectivity Growth Customer Success Stories Platforms Leveraging Network Investments in Our Strategy Outlook Appendix H1 FY20 Update
(1) Core Fibre Connectivity Revenues excluding INDIGO development revenue, includes installation revenues and construction revenue
FIBRE CONNECTIVITY VOLUMES CORE FIBRE CONNECTIVITY REVENUE
12
KPI Jun 2018 Dec 2018 Jun 2019 Dec 2019
# Services being billed 1,827 2,100 2,679 3,063
Services Growth YOY +47% +46%
# Accounts being billed 531 623 762 940
Accounts Growth YOY +44% +51%
Average # Services per Account 3.4 3.4 3.5 3.3

SYDNEY
Customer Success Stories
H1 FY20 Performance Connectivity Growth Customer Success Stories Platforms Leveraging Network Investments in Our Strategy Outlook Appendix H1 FY20 Update13

Super network for super customers across Asia Pacific
Content & cloud providers
Global & local service providers (wholesale)
Managed Service Providersrequiring NBN access and
Services
Multinationals including financial institutions
Lodging providers including hotels & student accommodation
Government departments including Education, Health
& Tourism
Cloud & Content Providers
Multinational Companies
Global Service Providers Key verticals for Superloop
Disclaimer: any brands and trademarks are the property of their respective owners
+ the major OTT players
H1 FY20 Update14
H1 FY20 Performance Connectivity Growth Customer Success Stories Platforms Leveraging Network Investments in Our Strategy Outlook Appendix

Superloop’s high-bandwidth network is being chosen for mission critical networks for major customers
H1 FY20 Update
VALIDATION OF OUR MARKET OPPORTUNITY
Cloud First
Asia Coverage
Price
Flexible
Preferred Partner
Customer Value
Designed to deliver cloud experienceto enterprise building
Pan Asia coverage of major strategicdata centres and buildings
Ownership economics and high capacity allows more price flexibility encouraging demand
Products designed to allow flexible delivery options for customers
Focused product set and seen as a connectivity partner for providers
Superloop Advantage
Originally designed to deliver voice/data from telephone exchanges
Limited coverage outside home market
High overhead and risk of product cannibalisation removes competitive options
Products generally rigid and restrictivein terms of options
Seen as a competitor and only used as a last resort
Legacy Networks
15H1 FY20 Performance Connectivity Growth Customer Success Stories Platforms Leveraging Network Investments in Our Strategy Outlook Appendix
KEY NEW WINS IN H1 FY20
Aurizon (ASX:AZJ) selected Superloop to provide high-bandwidth nationwide connectivity across SLC fibre, fixed wireless and NBN on a 5 year + 5 year contract
MSP Comscentre supporting their growing customer base
Build commenced on WA Government “Digital Farms” fixed wireless network in Great Southern Region
Partnering with managed services provider Comscentre to provide connectivity services for their growing customer base

MELBOURNE
Platforms Leveraging Our Network
H1 FY20 Performance Connectivity Growth Customer Success Stories Platforms Leveraging Network Investments in Our Strategy Outlook Appendix H1 FY20 Update16

Fibre Networks in Singapore, Australia & Hong Kong
Subsea cable network connecting Asia Pacific
Fixed Wireless Network across Australia
Residential & small business Broadband across Australia
Guest WiFi platform for leisure, health & education campuses
CyberHound secure internet
Platforms leveraging our Asia Pacific network
(Connectivity)
(Reporting segment)
(Connectivity)
(Services)
(Broadband)
(Broadband)
(Connectivity)
H1 FY20 UpdateH1 FY20 Performance Connectivity Growth Customer Success Stories Platforms Leveraging Network Investments in Our Strategy Outlook Appendix17

(1) Guest Wifi excludes revenue from GX2 US entity due to divestment and installation revenue.
Fixed Wireless Connectivity Revenue reduction of 13% PcP due to net churn, predominantly due to a small number of high value contracts.
Guest WiFi Broadband Underlying recurring revenue reduction of 5% due to re-pricing.
Home Broadband Subscription growth of 30% from July 2019, coupled with increased margin (33% to 43%) achieved through transitioning of the SkyMesh acquired customer base onto Superloop on-net backhaul.
H1 FY20 Performance Connectivity Growth Customer Success Stories Platforms Leveraging Network Investments in Our Strategy Outlook Appendix H1 FY20 Update
H2 FY18 H1 FY19 H2 FY19$m Revenue by Half
Fixed Wireless (Connectivity)
Guest WiFi (1) (Broadband)
Home Broadband (Broadband)
$8.2
$5.9
$10.1
$8.7
$10.5
H1 FY20
$8.8
$5.6
$9.1
H1 FY18
$10.6
$6.0
$1.9
$11.1
$5.9
$5.5
$5.9
43%
55%
85%
Margin %
$3.9 $3.5$1.3
Guest WiFi Installation Revenue
Platforms leveraging our fibre connectivity foundation
18
Non APAC Guest WiFi (US/UK) Revenue sold
$0.6$1.5 $2.2
$1.2

Strong lead indicators for guests on WiFi and homes on Superloop Home Broadband leveraging our network & platforms
Home Broadband
Subscription growth rate of 30% from July 2019, with strong exit run-rate from FY20 Q2 subs.
Gross margin increased from 33% to 43% PcP, as acquired SkyMesh customer base transitioned onto Superloop on-net backhaul.
Guest WiFi
Guests transitioned to new platform improving customer experience contributing to retention and now growth.
H1 FY20 UpdateH1 FY20 Performance Connectivity Growth Customer Success Stories Platforms Leveraging Network Investments in Our Strategy Outlook Appendix19
Guest WiFi subscribers migrated to new platform
which enables future expansion
Superloop Home Broadband subscribers have grown 30%
since July 2019
On-net HomeBB subscribers Off-net HomeBB
subscribers (acq June 2019)
25,000
20,000
15,000
10,000
5,000
0
Jul-1
8
Dec
-18
Jun
-19
Dec
-19
30% growth since JuL 2019
New platform Legacy Platforms
100%
80%
60%
40%
20%
0
Jun
-19
Sep
-19
Dec
-19

AUCKLAND
Investments in Our Strategy
H1 FY20 Performance Connectivity Growth Customer Success Stories Platforms Leveraging Network Investments in Our Strategy Outlook Appendix H1 FY20 Update20

APACSUBSEA CABLE
NETWORK
Superloop’s international subsea network connecting Asia Pacific to Europe and North America
H1 FY20 Update21
H1 FY20 Performance Connectivity Growth Customer Success Stories Platforms Leveraging Network Investments in Our Strategy Outlook Appendix

CapEx & OpEx reducing, with COGS investments from expansion
22
Capital ExpenditureReduction in capital expenditure due to completion of Network infrastructure in H2 FY2019.
FY20 capital expenditure is on track with forecast ($25m) as previously stated, with spend to date $12m (excluding IRU swaps).
Operational ExpenditureA 14% reduction in employee costs PcP.
Fibre Network Direct CostsCore connectivity COGS per period spend has been maintained.
Incremental Core connectivity COGS PcP relate to the Australian NBN POI network, which was completed January 2019 and COGS associated with the enablement of International capacity swaps.
H1 FY20 Update
(1) Excludes construction COGS.
Property, Plant & Equipment Additions
Intangible Additions
H2 FY19
H1 FY20
$55m
$40m $40m
$30m
H2 FY18
H1 FY19
$29m $37m $26m
$10m
$4m$3m
$4m
$22m
$10m
IRU Additions (swaps)
$18m
$37m$17.0m
$37m $37m
H2 FY19
H1 FY20
H2 FY18
H1 FY19
$16.6m $14.9m$14.7m
Employee Expenses
$2m
$55m Capital Expenditure Operational Expenses
H2 FY19
H1 FY20
H2 FY18
H1 FY19
$7.3m
Baseline Fibre COGS (1)
NBN & International cables COGS
$7.5m $7.6m $7.6m
00$2.2m $3.2m
Fibre Network Direct Costs
H1 FY20 Performance Connectivity Growth Customer Success Stories Platforms Leveraging Network Investments in Our Strategy Outlook Appendix

H1 FY20 Outlook
HONG KONG
H1 FY20 UpdateH1 FY20 Performance Connectivity Growth Customer Success Stories Platforms Leveraging Network Investments in Our Strategy Outlook Appendix23

FY20 Focus Areas
Execute further master service agreements, contracts and orders to provide connectivity to major bandwidth customers acrossour on-net footprint
Exploit unique Superloop national backbone extension of NBN to Australian service providers and enterprises
Continue to drive operational efficiencies with particular focus on shortening delivery cycle for customer benefits and revenue realisation
Leverage core fibre networks to extend Superloop’s platform penetration for campuses and enterprises across Asia Pacific
16 new Master Service Agreements signed in H1 FY20 with new customers including a major international data centre operator and Aurizon
H1
FY20
Pro
gres
s Aurizon Fibre + Fixed Wireless + NBN holistic solution
Comscentre & other global service providers
Reduction in Employee benefits costs of 14% PcP, lowering of Broadband COGS with transition to Superloop on-net network.
Book to Bill cycle reduction from 104 days to 59 days.
Focu
s A
rea
FY20
H1 FY20 Update
All Superloop Home Broadband customers migrated to on-net and majority of Guest WiFi customers have migrated to new platform enabling scalable future growth, with new hospitals & campuses coming online
24H1 FY20 Performance Connectivity Growth Customer Success Stories Platforms Leveraging Network Investments in Our Strategy Outlook Appendix

FY20 EBITDA Outlook $12-$15m calling out downside risk
$4.1mH1 FY20 EBITDA
$6m
Exit Run-Rate EBITDA
$14m-$16m
FY20 EBITDAGuidance as
at 1st Aug 2019
$3m
H1 Sales not yet
Provisioned & new sales H2.
H1 FY20 Update
(1) FY20 EBITDA guidance excluding infrastructure transactions that are anticipated, and including adoption of AASB16 (Leases) from 1st July 2019
$2m
$12m-$15m
FY20 EBITDAGuidance as at 18th Feb
2020
FY20 Guidance revised to
$12m-$15m EBITDA(1)
reflecting timing of delivery of large
executed contracts and uncertainty relating to
international trade impact of coronavirus
outbreak
25H1 FY20 Performance Connectivity Growth Customer Success Stories Platforms Leveraging Network Investments in Our Strategy Outlook Appendix
$1-$3m
Net other growth and savings incl.
Delivery timing of new
contracts
Potential downside risk
of macro environment
limiting international
travel & related Guest WiFi and
Connectivity Revenues

Major capital investment program is complete. Incremental capex predominantly success-based projects and process automation
Proof points in sales pipeline converting into new customers and future revenue growth on Superloop owned core fibre connectivity
Our on-net footprint in Australia and Asia Pacific is positioned to take advantage of the burgeoning demand for connectivity and broadband
Superloop is well-positioned to deliver significant long-term growth
Superloop is Well Positioned for Future Value Creation
H1 FY20 Update26
H1 FY20 Performance Connectivity Growth Customer Success Stories Platforms Leveraging Network Investments in Our Strategy Outlook Appendix

Appendix
Historical Performance by sub-segment
Direct & Indirect Operating Cost performance
H1 FY20 UpdateH1 FY20 Performance Connectivity Growth Customer Success Stories Platforms Leveraging Network Investments in Our Strategy Outlook Appendix27
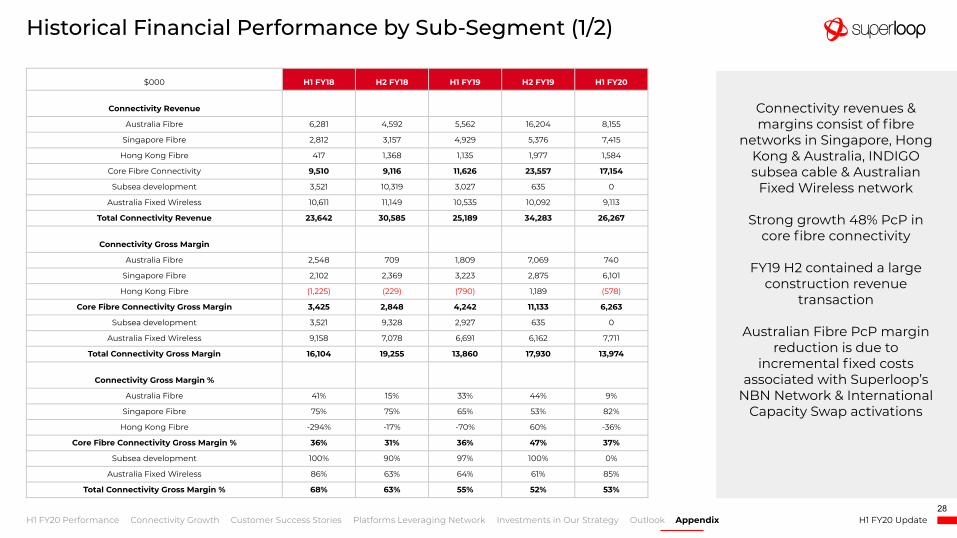
Historical Financial Performance by Sub-Segment (1/2)
$000 H1 FY18 H2 FY18 H1 FY19 H2 FY19 H1 FY20
Connectivity Revenue
Australia Fibre 6,281 4,592 5,562 16,204 8,155
Singapore Fibre 2,812 3,157 4,929 5,376 7,415
Hong Kong Fibre 417 1,368 1,135 1,977 1,584
Core Fibre Connectivity 9,510 9,116 11,626 23,557 17,154
Subsea development 3,521 10,319 3,027 635 0
Australia Fixed Wireless 10,611 11,149 10,535 10,092 9,113
Total Connectivity Revenue 23,642 30,585 25,189 34,283 26,267
Connectivity Gross Margin
Australia Fibre 2,548 709 1,809 7,069 740
Singapore Fibre 2,102 2,369 3,223 2,875 6,101
Hong Kong Fibre (1,225) (229) (790) 1,189 (578)
Core Fibre Connectivity Gross Margin 3,425 2,848 4,242 11,133 6,263
Subsea development 3,521 9,328 2,927 635 0
Australia Fixed Wireless 9,158 7,078 6,691 6,162 7,711
Total Connectivity Gross Margin 16,104 19,255 13,860 17,930 13,974
Connectivity Gross Margin %
Australia Fibre 41% 15% 33% 44% 9%
Singapore Fibre 75% 75% 65% 53% 82%
Hong Kong Fibre -294% -17% -70% 60% -36%
Core Fibre Connectivity Gross Margin % 36% 31% 36% 47% 37%
Subsea development 100% 90% 97% 100% 0%
Australia Fixed Wireless 86% 63% 64% 61% 85%
Total Connectivity Gross Margin % 68% 63% 55% 52% 53%
H1 FY20 Update
Connectivity revenues & margins consist of fibre
networks in Singapore, Hong Kong & Australia, INDIGO subsea cable & Australian
Fixed Wireless network
Strong growth 48% PcP in core fibre connectivity
FY19 H2 contained a large construction revenue
transaction
Australian Fibre PcP margin reduction is due to
incremental fixed costs associated with Superloop’s
NBN Network & International Capacity Swap activations
28H1 FY20 Performance Connectivity Growth Customer Success Stories Platforms Leveraging Network Investments in Our Strategy Outlook Appendix

‘Rest of business’ contains Broadband and Services
segment
Broadband includes Guest WiFi provided to education, health & leisure campuses &
Home Broadband to Australian homes
Services segment includes CyberHound cybersecurity
and non-core cloud managed services
Operational costs are contained at a group level,
now that Superloop has integrated all acquisitions
Historical Financial Performance by Sub-Segment (2/2)
$000 H1 FY18 H2 FY18 H1 FY19 H2 FY19 H1 FY20
Rest of Business Revenue
Guest WiFi Revenue 7,866 11,387 11,590 7,117 5,792
Home Broadband Revenue 1,934 5,465 8,706 8,173 8,761
Total Broadband Revenue 9,800 16,852 20,296 15,290 14,554
Services Revenue 18,002 18,581 14,083 10,595 10,001
Other Revenue (190) 886 757 (648) 513
Total Group Revenue 51,254 66,904 60,325 59,520 51,335
Rest of Business Gross Margin
Guest WiFi 2,541 6,510 5,925 3,952 3,202
Home Broadband 1,453 3,742 2,853 3,098 3,833
Total Broadband Gross Margin 3,994 10,252 8,778 7,050 7,036
Services Gross Margin 7,471 8,902 6,363 4,389 4,996
Other Gross Margin 47 992 757 (648) 513
Total Group Gross Margin 27,616 39,402 29,758 28,721 26,519
Rest of Business Gross Margin %
Guest WiFi 32% 57% 51% 56% 55%
Home Broadband 75% 68% 33% 38% 44%
Total Broadband Gross Margin % 41% 61% 43% 46% 48%
Services Gross Margin % 42% 48% 45% 41% 50%
Other Gross Margin % -25% 112% 100% 100% 100%
Total Group Gross Margin % 54% 59% 49% 48% 52%
Employee Expenses (exc exit costs) (13,641) (16,592) (16,989) (14,923) (14,715)
Exit costs 0 (1,000)
Professional fees (1,741) (2,279) (1,670) (2,325) (1,598)
Marketing costs (827) (1,060) (1,144) (1,343) (1,267)
Administrative and other expenses (3,866) (4,920) (5,446) (5,140) (4,841)
Total Operating Costs (20,075) (24,851) (25,249) (24,731) (22,421)
EBITDA 7,541 14,551 4,509 3,990 4,097
EBITDA exc. subsea dev 4,020 5,222 1,582 3,355 4,097
H1 FY20 Update29
H1 FY20 Performance Connectivity Growth Customer Success Stories Platforms Leveraging Network Investments in Our Strategy Outlook Appendix

H1 FY20 Direct & Indirect Operating Costs Performance
$(7.5)
$ (5.8)
$(10.5)
$0.2
$(23.6)
$(13.6)
-
$(1.7)
$(0.8)
$(3.9)
$(20.1)
Connectivity Direct Costs
Broadband Direct Costs
Services Direct Costs
Other Direct Costs
Total Direct Costs
Employee Costs (exc exit costs)
Exit costs
Professional fees
Marketing costs
Admin. and other expenses
Total Operating Costs
$(16.4)
$(8.2)
$(6.2)
-
$(30.8)
$(14.9)
$(1.0)
$(2.3)
$(1.3)
$(5.1)
$(24.7)
(9%)
35%
35%
-
19%
14%
-
5%
(18%)
11%
11%
H1 FY18 H2 FY19 HoH
$(11.3)
$(11.5)
$(7.7)
-
$(30.6)
$(17.0)
-
$(1.7)
$(1.1)
$(5.4)
$(25.2)
H1 FY19
$(11.3)
$(6.6)
$(9.7)
$0.1
$(27.5)
$(16.6)
-
$(2.3)
$(1.1)
$(4.9)
$(24.9)
H2 FY18
$(12.3)
$(7.5)
$(5.0)
-
$(24.8)
$(14.7)
-
$(1.6)
$(1.3)
$(4.8)
$(22.4)
H1 FY20
H1 FY20 Update
Direct Costs Reduction of Direct costs of 19%, transitioning of Home broadband customers on-net, tight cost control through the divestment of CMS.
Operating CostsDown 14% due to Employee cost reduction from restructure in February 2019.
30H1 FY20 Performance Connectivity Growth Customer Success Stories Platforms Leveraging Network Investments in Our Strategy Outlook Appendix

H2 FY18 H1 FY19 H2 FY19$m Revenue by Half
Services Segment includes non-core CMS + core Cyberhound
Cloud Managed Services
Cybersecurity (Services)
$2.9 $3.3 $1.6
$9.0$10.8
H1 FY20
$2.6
$7.4
H1 FY18
$3.2
$14.8 $15.7
Cloud Managed Services
In 2019, SLC notified investors and customers that CMS would be discontinued, and customers migrated to other providers on a case-by-case basis.
As per the impairment of all goodwill relating to the CMS segment in the FY19 Results, we anticipate CMS to decline to zero.
CyberHound Security Superloop CyberHound (from the 2016 acquisition of Big Air) provides ability for schools to securely manage WiFi & Internet access to filter negative content and activity on the school network. Future growth in this product will expand to other sectors including enterprise clients alongside core connectivity.80%
39%
Margin %
H1 FY20 Update31
H1 FY20 Performance Connectivity Growth Customer Success Stories Platforms Leveraging Network Investments in Our Strategy Outlook Appendix

50% HoH growth
$58m Invested Cap
$67m Invested (IRUs)
16% Utilisation
3.5yrs Avg. Asset Age
29.5yrs Avg. Asset Life
233 Fibre Kms
60 No. of Buildings
Fibre Scale Economics
REVENUE H1 FY20Australia
48% HoH growth
$94m Invested Cap
$88m Invested (IRUs)
28.2% Utilisation
1.5yrs Avg. Asset Age
16.5yrs Avg. Asset Life
511 Fibre Kms
325 No. of Buildings
$8.2million
REVENUE H1 FY20Singapore
$7.4million
REVENUE H1 FY20Hong Kong
40% HoH growth
$68m Invested Cap
$83m Invested (IRUs)
3.6% Utilisation
2.7yrs Avg. Asset Age
25.5yrs Avg. Asset Life
253 Fibre Kms
33 No. of Buildings
$1.6million
H1 FY20 Update32
H1 FY20 Performance Connectivity Growth Customer Success Stories Platforms Leveraging Network Investments in Our Strategy Outlook Appendix