Extraction of Sensory Parameters from a Neural Map by Primary
10
Extraction of Sensory Parameters from a Neural Map by Primary Sensory Interneurons Gwen A. Jacobs 1 and Frederic E. Theunissen 2 1 Center for Computational Biology, Montana State University, Bozeman, Montana 59717, and 2 Department of Psychology, University of California, Berkeley, California 94720 We examine the anatomical basis for the representation of stimulus parameters within a neural map and examine the extraction of these parameters by sensory interneurons (INs) in the cricket cercal sensory system. The extraction of air current direction by these sensory interneurons can be understood largely in terms of the anatomy of the system. There are two critical anatomical constraints. (1) The arborizations of afferents with similar directional tuning properties are located near each other within the neural map. Therefore, a continuous variation in stimulus direction causes a continuous variation in the spatial pattern of activation. (2) The restriction of the synaptic connec- tions of an interneuron to a unique set of afferents results from the unique anatomy of that interneuron: its dendritic arbors are located within restricted regions of the afferent map containing afferents with a limited subset of directional sensitivities. The functional organization of the set of four interneurons studied here is equivalent to a Cartesian coordinate system for com- puting the stimulus direction vector. For any air current stimulus direction, the firing rates of the active interneurons could be decoded as Cartesian coordinates by neurons at successive processing stages. The implications of this Cartesian coordi- nate system are discussed with respect to optimal coding strategies and developmental constraints on the cellular imple- mentation of this coding scheme. Key words: sensory maps; insect; functional neuroanatomy; sensory interneurons; spatiotemporal patterns; neural coding In most sensory systems, neurons form a map of sensory space through the organized projection pattern of their axon terminals. One consequence of this anatomical organization is that the ensemble response of a population of neurons to a particular sensory stimulus will be represented as a unique spatiotemporal pattern of activity within that region of the brain. To understand how these spatiotemporal patterns of activity emerge from the ensemble activity, and how the information contained in the patterns is accessed and encoded by higher levels of the nervous system, the f unctional architecture of the constituent neurons must be determined. This is an exceedingly difficult task in most sensory systems. However, in the cricket cercal system, it has been possible to collect adequate anatomical and physiological data about individual neurons in sufficient numbers to create a com- prehensive database representing the functional organization of one entire processing stage of this system (Troyer et al., 1994). We have used this database to address two specific questions related to the computation and transfer of stimulus parameters between layers of neurons within a sensory system. (1) What is the algorithm for transmitting information encoded by one pop- ulation of neurons to another? (2) How is the algorithm imple- mented within the network of neurons, and what are the struc- tural constraints on that implementation? The primary afferent input to the cricket cercal sensory system comes from an ensemble of mechanosensory afferents that inner- vate filiform hairs on two sensory appendages, called cerci, lo- cated at the rear of the animal’s abdomen (see Fig. 1 A). Filiform hairs are displaced by air motion and constrained by a cuticular socket to move in a single plane with respect to the cercal surface. The mechanoreceptors are sensitive to both the direction and the dynamics (frequency, velocity) of air currents (Shimozawa and Kanou, 1984a,b; Landolfa and Miller, 1995; Roddey and Jacobs, 1996). The mechanoreceptors project their axons into the CNS and provide direct excitatory input to an ensemble of sensory interneurons (INs) (see Fig. 1 B) (Bacon and Murphey, 1984). These afferents and interneurons are sensitive to the direction and dynamics of air currents (see Fig. 1C,D) (Theunissen et al., 1996). The mechanosensory afferents arborize in specific locations in the CNS according to their directional tuning properties (Bacon and Murphey, 1984). Afferents tuned to similar air current direc- tions overlap extensively in the neuropil, whereas those tuned to opposite directions are spatially segregated. This organized pro- jection pattern creates a continuous map of air current direction in the CNS (see Fig. 2) (Jacobs and Theunissen, 1996; Paydar et al., 1999). There are two hemimaps of air current direction in the terminal abdominal ganglion, each one formed by afferents from each cercus. Each map contains a complete representation of air current direction, and the two maps are mirror images of one another. The structure of this map and the structure of the interneurons imbedded within this map are the primary determi- nants of the functional sensitivity of those interneurons. MATERIALS AND METHODS Histolog ical staining techniques Adult female crickets were used within 24 hr of their imaginal molt (Bassetts Cricket Ranch, Visalia, CA). Each individual afferent was stained with cobalt chloride and silver-intensified using methods devel- oped by Bacon and Altman (1977) that were f urther modified by Johnson Received Sept. 29, 1999; revised Jan. 27, 2000; accepted Feb. 7, 2000. This work was supported by grants from the National Institute for Mental Health (RO158525) and the National Science Foundation (IBN 9421185). We thank John Miller for valuable discussions, and Sandy Pittendrigh, Ben Livingood, and Alex Dimitrov for technical assistance. Correspondence should be addressed to Dr. Gwen A. Jacobs, Center for Com- putational Biology, 30 AJM Johnson Hall, Montana State University, Bozeman, Montana 59717-3505. E-mail: [email protected]. Copyright © 2000 Society for Neuroscience 0270-6474/00/202934-10$15.00/0 The Journal of Neuroscience, April 15, 2000, 20(8):2934–2943
Transcript of Extraction of Sensory Parameters from a Neural Map by Primary
Extraction of Sensory Parameters from a Neural Map by PrimarySensory Interneurons
Gwen A. Jacobs1 and Frederic E. Theunissen2
1Center for Computational Biology, Montana State University, Bozeman, Montana 59717, and 2Department ofPsychology, University of California, Berkeley, California 94720
We examine the anatomical basis for the representation ofstimulus parameters within a neural map and examine theextraction of these parameters by sensory interneurons (INs) inthe cricket cercal sensory system. The extraction of air currentdirection by these sensory interneurons can be understoodlargely in terms of the anatomy of the system. There are twocritical anatomical constraints. (1) The arborizations of afferentswith similar directional tuning properties are located near eachother within the neural map. Therefore, a continuous variation instimulus direction causes a continuous variation in the spatialpattern of activation. (2) The restriction of the synaptic connec-tions of an interneuron to a unique set of afferents results fromthe unique anatomy of that interneuron: its dendritic arbors are
located within restricted regions of the afferent map containingafferents with a limited subset of directional sensitivities. Thefunctional organization of the set of four interneurons studiedhere is equivalent to a Cartesian coordinate system for com-puting the stimulus direction vector. For any air current stimulusdirection, the firing rates of the active interneurons could bedecoded as Cartesian coordinates by neurons at successiveprocessing stages. The implications of this Cartesian coordi-nate system are discussed with respect to optimal codingstrategies and developmental constraints on the cellular imple-mentation of this coding scheme.
Key words: sensory maps; insect; functional neuroanatomy;sensory interneurons; spatiotemporal patterns; neural coding
In most sensory systems, neurons form a map of sensory spacethrough the organized projection pattern of their axon terminals.One consequence of this anatomical organization is that theensemble response of a population of neurons to a particularsensory stimulus will be represented as a unique spatiotemporalpattern of activity within that region of the brain. To understandhow these spatiotemporal patterns of activity emerge from theensemble activity, and how the information contained in thepatterns is accessed and encoded by higher levels of the nervoussystem, the functional architecture of the constituent neuronsmust be determined. This is an exceedingly difficult task in mostsensory systems. However, in the cricket cercal system, it has beenpossible to collect adequate anatomical and physiological dataabout individual neurons in sufficient numbers to create a com-prehensive database representing the functional organization ofone entire processing stage of this system (Troyer et al., 1994).
We have used this database to address two specific questionsrelated to the computation and transfer of stimulus parametersbetween layers of neurons within a sensory system. (1) What isthe algorithm for transmitting information encoded by one pop-ulation of neurons to another? (2) How is the algorithm imple-mented within the network of neurons, and what are the struc-tural constraints on that implementation?
The primary afferent input to the cricket cercal sensory systemcomes from an ensemble of mechanosensory afferents that inner-
vate filiform hairs on two sensory appendages, called cerci, lo-cated at the rear of the animal’s abdomen (see Fig. 1A). Filiformhairs are displaced by air motion and constrained by a cuticularsocket to move in a single plane with respect to the cercal surface.The mechanoreceptors are sensitive to both the direction and thedynamics (frequency, velocity) of air currents (Shimozawa andKanou, 1984a,b; Landolfa and Miller, 1995; Roddey and Jacobs,1996). The mechanoreceptors project their axons into the CNSand provide direct excitatory input to an ensemble of sensoryinterneurons (INs) (see Fig. 1B) (Bacon and Murphey, 1984).These afferents and interneurons are sensitive to the directionand dynamics of air currents (see Fig. 1C,D) (Theunissen et al.,1996).
The mechanosensory afferents arborize in specific locations inthe CNS according to their directional tuning properties (Baconand Murphey, 1984). Afferents tuned to similar air current direc-tions overlap extensively in the neuropil, whereas those tuned toopposite directions are spatially segregated. This organized pro-jection pattern creates a continuous map of air current directionin the CNS (see Fig. 2) (Jacobs and Theunissen, 1996; Paydar etal., 1999). There are two hemimaps of air current direction in theterminal abdominal ganglion, each one formed by afferents fromeach cercus. Each map contains a complete representation of aircurrent direction, and the two maps are mirror images of oneanother. The structure of this map and the structure of theinterneurons imbedded within this map are the primary determi-nants of the functional sensitivity of those interneurons.
MATERIALS AND METHODSHistological staining techniquesAdult female crickets were used within 24 hr of their imaginal molt(Bassetts Cricket Ranch, Visalia, CA). Each individual afferent wasstained with cobalt chloride and silver-intensified using methods devel-oped by Bacon and Altman (1977) that were further modified by Johnson
Received Sept. 29, 1999; revised Jan. 27, 2000; accepted Feb. 7, 2000.This work was supported by grants from the National Institute for Mental Health
(RO158525) and the National Science Foundation (IBN 9421185). We thank JohnMiller for valuable discussions, and Sandy Pittendrigh, Ben Livingood, and AlexDimitrov for technical assistance.
Correspondence should be addressed to Dr. Gwen A. Jacobs, Center for Com-putational Biology, 30 AJM Johnson Hall, Montana State University, Bozeman,Montana 59717-3505. E-mail: [email protected] © 2000 Society for Neuroscience 0270-6474/00/202934-10$15.00/0
The Journal of Neuroscience, April 15, 2000, 20(8):2934–2943

and Murphey (1985) and Jacobs and Nevin (1991). The interneuronswere stained with cobalt chloride and developed using the same methods.
Computer reconstruction of stained neuronsA computer-controlled digitizing light microscope was used as the data-entry device. Tissue containing a single dye-filled nerve cell was mountedon the microscope stage, and the operator controlled the precise move-ment of the neuron in three dimensions by means of three high-precisionmotors, each mounted on a different axis of the mechanical microscopestage. The neuron was moved under the microscope so that its brancheswere traced under a video cursor, superimposed over a frame-grabbedvideo image of the tissue. Movements of the microscope stage weremonitored by linear encoders mounted to the stage, each encoder havinga resolution of 0.2 mm. A set of x, y, and z coordinates was recorded forthe endpoints of each dendritic segment, along with the mean diameterof the segment between the endpoints. These microscopy and computertechniques have been described in detail elsewhere (Jacobs and Nevin,1991).
Database of identified neuronsAll of the reconstructed afferents and interneurons were scaled andaligned to a common coordinate system and entered into a databaseusing a suite of software programs called NeuroSys that was developed inour laboratory (http://www.nervana.montana.edu/NeuroSys). The datacurrently in the database consist of more than 200 primary afferents andseveral identified primary sensory interneurons.
Estimating the total surface area of the varicosity membrane ofan afferentThree to five examples of each type of identified afferent were selectedfrom the database. The terminal varicosities of each cell were trans-formed into a continuous function representing the anatomical locationand distribution of the varicosity membrane surface area. Specifically, wecalculated the varicosity membrane surface area per unit volume ofneuropil, which is equivalent to the surface area density. The densityfunctions for each set of three to five afferents were averaged into a meandensity function for that afferent type. These density functions werevisualized as three-dimensional (3-D) space-filling clouds of points.Details of the statistical methods used for this procedure are described byJacobs and Theunissen (1996).
Ensemble map of the entire afferent projectionThe ensemble density function of the entire set of afferents was deter-mined by calculating the linear sum of all individual density functionsdescribed above. To do so, the space corresponding to the cercal glo-merulus was divided into cubical voxels that were 7 mm on each side, andthe net density was calculated for each voxel. Because there was asubstantial degree of overlap between the density functions of afferentshaving similar directional sensitivities (Jacobs and Theunissen, 1996),the net density function in many voxels corresponded to synaptic vari-cosity surface area from afferents having different directional sensitivi-ties. The mean directional sensitivity of each voxel was calculated bycomputing the vector sum of the peak directional sensitivities of allafferents projecting into that voxel, weighted by the relative densities ofthose afferents. For visualization, each voxel was displayed as a popula-tion of dots, with the relative density of the synaptic membrane coded bythe density of the dots and the mean directional sensitivity coded withcolor.
Predictions of steady-state activity patterns from the databasePresentation of a unidirectional air current stimulus to a cricket changesthe activity of each cercal filiform afferent: its activity either increasesabove or decreases below its baseline activity level. The change inactivity is proportional to the cosine of the angle between the stimulusdirection and the peak sensitivity direction of the afferent (Landolfa andMiller, 1995). We derived predictions of the ensemble activity patternthat would emerge from stimulation of the entire ensemble of afferentsfrom the database. To do so, we calculated the contribution of eachindividual afferent to each voxel in the ensemble map by scaling itspredicted physiological response by its varicosity density within thatvoxel. The physiological response of the afferent was calculated as thecosine of the difference in angle between the peak directional tuning ofthe afferent and the angle of the stimulus with respect to the animal’sbody. The response of the entire system of afferents was then calculated
as the sum of responses from all afferents in the database at each voxel.The predicted response patterns were imaged as changes in the levels ofactivity in the neural map relative to the baseline level of activity. A grayscale was used to indicate relative levels of activity, with white indicatingmaximum activity and black indicating minimum activity. The baselineactivity level in the afferents was represented as midgray (see Fig. 3,inset). In this manner, images could be generated to predict the relativeresponse levels throughout the map for any given stimulus.
Predictions of connectivity relationships between neuronsFor this analysis, we were interested in the varicosity surface density nearthe dendritic arborizations of the chosen interneuron. A method wasderived to calculate the effective overlap between the membrane of theinterneuron dendrites and the afferent terminal varicosities. Note thatthis operation is equivalent to multiplying a spatial filter (in the shape ofan interneuron) with the structure of the afferent map. To do so, the localafferent varicosity surface density was computed at all points along thedendritic arbor of the digitized interneuron, excluding branches .2 mmin diameter. The net directional tuning of these afferents was thencalculated, and the dendrites of the interneuron were color-coded ac-cording to the net directional tuning.
Predictions of relative levels of activity in interneuronsTo predict the relative levels of afferent input onto an interneuron inresponse to a specific sensory stimulus, the “image” of the stimulus-evoked response across the entire afferent ensemble was masked onto thedendritic structure of the interneuron as follows. The spatial pattern ofactivity within the afferent population in response to a stimulus was firstpredicted. Next, this pattern of afferent activity was mapped onto thedendritic structure of the interneuron, as described in the precedingsection. Each of the dendritic segments of the interneuron was assigneda gray scale value corresponding to the activation level of the afferentterminals in the voxels overlapping with that dendritic segment. Thesepredictions represent the level of excitatory input to each dendritic regionof the interneuron, relative to the baseline level of activation thatsegment would get in the absence of any stimulation. A dendritic segmentwith increased activation over baseline would appear lighter than thebaseline gray level, and a segment with decreased activation wouldappear darker than the baseline gray level.
Directional tuning curvesSeveral figures show directional tuning curves for afferents and/or inter-neurons. In this study, only the shapes of the tuning curves are relevantand not their absolute amplitudes. All tuning curves shown in thesefigures were derived from experimental measurements published earlier,as follows.
Afferents. All afferent directional tuning curves presented in this reportwere derived from averaging the directional tuning curves measuredfrom 60 receptors, as described in Landolfa and Miller (1995). For eachreceptor, a unidirectional air current was presented eight times at each of16 different directions around the animal’s body in the horizontal plane.The responses were recorded at each stimulus direction and quantified asthe number of spikes generated in response to the stimulus. The direc-tional tuning curve of each afferent was plotted as the fraction of itsmaximum response (i.e., the response elicited at the direction of its peaksensitivity) versus stimulus direction. Thus, all tuning curves were scaledto the same maximum value of 1.0, regardless of the actual number ofspikes elicited at their peak response directions. The tuning curves fromthe 60 afferents were then shifted with respect to their actual peaksensitivity directions, so as to align their peaks. The curves were thenaveraged. This average curve resembles a cosine function, with slightdeviations from the pure cosine at the peak and trough. Note that theseafferents, all associated with “long” filiform hairs (;1 mm in length), firespontaneously in the absence of any stimulus. Therefore, the response ateach direction is either an elevation above baseline or depression belowbaseline; this baseline activity is indicated by the thick horizontal linethrough the center of the curves.
Interneurons. All interneuron directional tuning curves presented inthis report were derived from averaging the directional tuning curvesmeasured from 18 interneurons of this type, as described elsewhere(Miller et al., 1991.) For each interneuron, a unidirectional air currentwas presented eight times at each of 16 different directions around theanimal’s body in the horizontal plane. The responses were recorded ateach stimulus direction and quantified as the number of spikes generatedin response to the stimulus. The directional tuning curve of each inter-
Jacobs and Theunissen • Extraction of Sensory Parameters from a Neural Map J. Neurosci., April 15, 2000, 20(8):2934–2943 2935

neuron was plotted as the fraction of its maximum response (i.e., theresponse elicited at the direction of its peak sensitivity) versus stimulusdirection. Thus, all tuning curves were scaled to the same maximumvalue of 1.0, regardless of the actual number of spikes elicited at theirpeak response directions. The curves were then averaged. The distribu-tions of the individual responses around this mean curve were shown tobe extremely small, indicating that the mean curve was a statisticallyacceptable representation of the individual cells’ directional tuningcurves. The equation for a truncated cosine function was then fit to thesedata points and found to fit the data as well as the mean curve. For thestudies reported here, we use this best-fit truncated cosine to representthe mean directional tuning curves of the interneurons.
RESULTSRepresentation of sensory stimuli within theneural mapOn each cricket cercus, there are ;1000 cercal filiform mech-anosensory hairs, each of which is innervated by a single mech-anosensory receptor neuron. The primary afferents that inner-vate the long (;1 mm) filiform hairs fire action potentialsspontaneously in the absence of air current stimuli. Each afferent
responds to unidirectional air currents with either an increase ora decrease in its firing rate, relative to its baseline rate. Theresponse amplitude depends on stimulus direction: each afferenthas a direction of peak sensitivity, and stimuli from other direc-tions elicit responses that decrease in amplitude by an amountproportional to the cosine between the stimulus direction and thedirection of peak sensitivity of the afferent (Figs. 1, 2) (Landolfaand Miller, 1995).
The different afferents innervating mechanosensory hairs oneach cercus have a wide range of peak tuning directions that span360° in the horizontal plane. Any air current stimulus in thehorizontal plane will deflect all of the mechanosensory hairs oneach of the two cerci to some extent, depending on the axes ofmovement of the hairs. As a direct consequence, activity levels insome afferents will increase, whereas the activity in others willdecrease. Because the sensory afferents project into the cercalglomerulus to form a continuous spatial map of stimulus direc-tion, then these differential afferent firing patterns elicited by
Figure 1. Functional organization of the cricket cercal sen-sory system. A, Schematic diagram of the common housecricket, Acheta domestica, showing the location of the abdom-inal nerve cord. The cerci are two abdominal appendagesprojecting from the rear of the animal’s body. Both cerci arecovered with mechanosensory hairs, each of which is inner-vated with a single sensory neuron. The axons of the sensoryneurons project into the terminal abdominal ganglion, lo-cated at the caudal end of the abdominal nerve cord. B, Animage from the database, showing the outline of the terminalabdominal ganglion and segments of four different recon-structed neurons. Three of the neurons are primary sensoryafferents, whose axons can be seen entering the terminalganglion through the cercal nerves. The fourth neuron is aprimary sensory interneuron, the axon of which projectsanterior to higher centers of the nervous system. Display of itscell body has been suppressed to prevent obscuration of thedendrites. C, Directional tuning curves of the three primarysensory afferents shown in B, plotted as relative responseamplitude versus stimulus direction. The center horizontal line indicates baseline activity level. Stimuli directed at the front of the animal’s body isindicated by 0°, and angles increase clockwise. The response curves are approximately sinusoidal and were derived from physiological measurementsdescribed in Materials and Methods. D, Directional tuning curve of the primary sensory interneuron shown in B, plotted as relative response amplitudeversus stimulus direction. Conventions are as in C. This tuning curve was derived from physiological measurements described in Materials and Methodsand is approximated here by a truncated cosine curve fit to the actual stimulus–response data.
Figure 2. Mapping of stimulus direction in the cricket cercal system. A, Spatial relationships between three primary afferents and one Right 10-2 (R10-2)sensory interneuron. Primary afferents have been color-coded according to the peak of their directional tuning, indicated by the color wheel in D, inset.B, Relative positions of the terminal arbors of three primary afferents within the terminal abdominal ganglion. Afferents have been color-coded accordingto their peak directional tuning, according to the color wheel in D, inset. Each colored cloud represents an average density function of the membranesurface area of the synaptic varicosities of one afferent, calculated from five examples of the same identified afferent. C, Combined image of the entireensemble of sensory afferents that innervate the long filiform mechanoreceptor hairs on both cerci. This represents a dorsal view of the terminalabdominal ganglion. The color of each cloud in the ensemble indicates the peak sensitivity direction of the corresponding afferent. Afferents from eachcercus form a hemimap on one side of the ganglion. The two hemimaps are mirror images of each other across the midline of the ganglion. D, Map ofair current direction, as in C, viewed from the ventral lateral aspect of the ganglion. Inset, Color wheel indicating the color coding for stimulus directionwith respect to the cricket’s body. In all figures, the distance between ticks on the cross hairs is 40 mm.
2936 J. Neurosci., April 15, 2000, 20(8):2934–2943 Jacobs and Theunissen • Extraction of Sensory Parameters from a Neural Map

stimuli originating from different directions will result in differentensemble spatial patterns of activity within the cercal glomerulus.
Figure 3 shows the spatial patterns of activity that we predictedin the entire ensemble of long-hair afferents in the database, forunidirectional air current stimuli originating from eight differentdirections. The relative level of activity at each point in the mapis shown in gray scale. The background gray corresponds to thespontaneous activity level of the afferents (i.e., in the absence ofany stimulus, there would be no visible pattern.) Lighter graysindicate a net excitation of afferents above the baseline, anddarker grays represent a net suppression of activity below thebaseline. Maximal excitation of an afferent by an air currentdirected along its peak tuning axis would cause its contribution tothe overall pattern to be indicated as white. A stimulus from 90°away from its peak tuning direction would set its tone to midgray;a stimulus from the anti-preferred (180°) direction would set itstone to black. Each afferent responds to the stimulus according toits specific directional tuning curve.
A unique pattern of activity is generated within the populationof afferents for each stimulus direction. Note that each of thesepatterns is actually a three-dimensional pattern but is presentedhere as a projection in two dimensions. The patterns vary con-tinuously as a function of the stimulus direction. Stimuli that aresimilar in direction elicit activity in similar regions of the map,whereas stimuli from opposite directions are represented by pat-terns that are tonal inverses of one another. Each spatial patternhas approximately the same net amount of excitatory area; it isthe shape and position of the areas of peak excitation and inhi-bition that vary with air current direction.
Computation of stimulus direction by interneuronsThe spatial patterns of activity produced by the afferents consti-tute the neural images of sensory stimuli that must be decoded bythe network of postsynaptic neurons. Thus, it is the anatomicalarrangement of the primary afferent arborization that sets up thesubsequent computations of stimulus direction by the primarysensory interneurons. Previous work on this system has shownthat several primary sensory interneurons in this system aredirectionally tuned to air currents (Bacon and Murphey, 1984;Jacobs et al., 1986; Miller et al., 1991). The tuning curves of atleast four of these cells are very similar to those of the afferentsand are well approximated as truncated cosine functions (Milleret al., 1991).
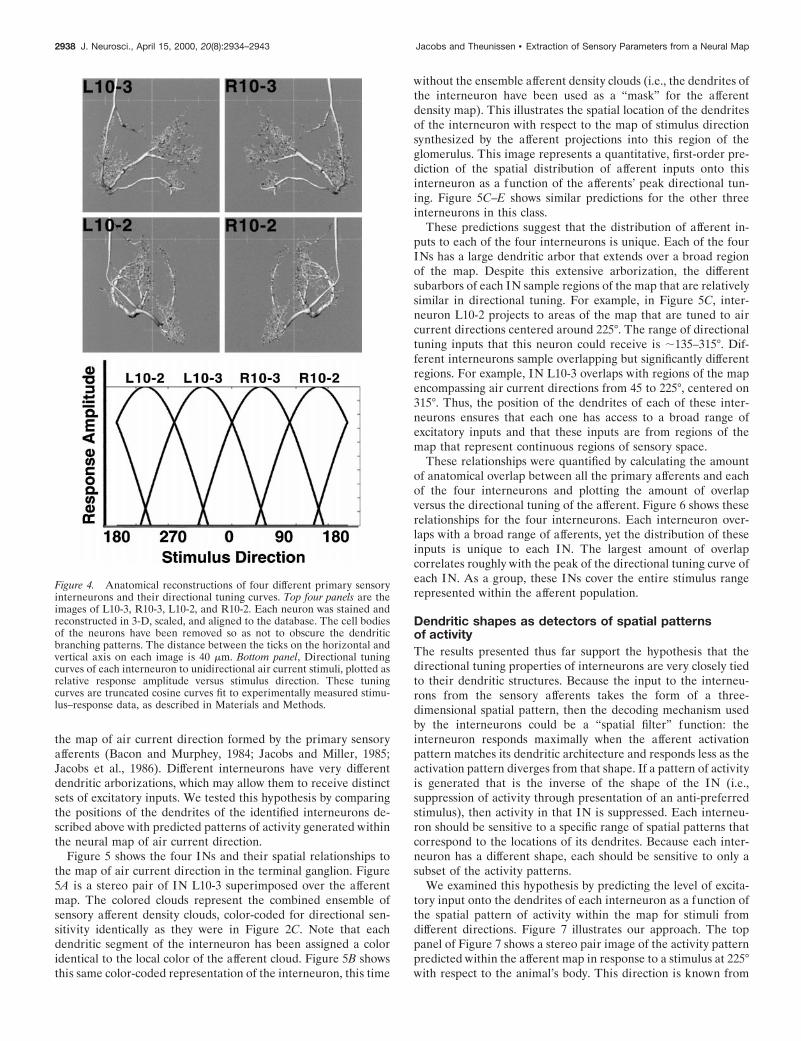
Figure 4 shows these four identified sensory interneurons: left(L)10-2, right (R)10-2, L10-3, and R10-3. Also shown are trun-cated cosine functions fit to their experimentally measured direc-tional tuning curves, elicited in response to unidirectional aircurrent stimuli (Miller et al., 1991). All cell types have tuningcurves that are statistically indistinguishable in shape but areshifted from each other at 90° intervals around the horizontalplane. Together, the tuning curves of these four interneuronsspan the entire range of stimulus directions in the horizontalplane.
How do these interneurons derive their directional tuningcharacteristics from the neural map of air current direction? Ourworking hypothesis is that the directional tuning properties ofprimary sensory interneurons can be explained primarily on thebasis of the anatomical overlap between their dendritic trees and
Figure 3. Predictions of the spatial pat-terns of activity that would be elicitedwithin the neural map by unidirectional,steady-state air currents from eight differentdirections. This is a dorsal view, exactly asin Figure 2C, but with the relative level ofactivity among the ensemble of sensory af-ferents indicated by a gray scale. The activ-ity level of each afferent in the ensemblewill be modulated up or down from its base-line level as a function of the stimulus di-rection, resulting in a unique activation pat-tern for each different stimulus angle. Thedirection of the air current is indicated inthe top lef t corner of each image. The max-imum level of activity is indicated as white,baseline activity as midgray, and a decreasebelow baseline activity as dark gray to black.The inset shows the gray scale, aligned witha cosine function to represent an afferentdirectional tuning curve.
Jacobs and Theunissen • Extraction of Sensory Parameters from a Neural Map J. Neurosci., April 15, 2000, 20(8):2934–2943 2937
the map of air current direction formed by the primary sensoryafferents (Bacon and Murphey, 1984; Jacobs and Miller, 1985;Jacobs et al., 1986). Different interneurons have very differentdendritic arborizations, which may allow them to receive distinctsets of excitatory inputs. We tested this hypothesis by comparingthe positions of the dendrites of the identified interneurons de-scribed above with predicted patterns of activity generated withinthe neural map of air current direction.
Figure 5 shows the four INs and their spatial relationships tothe map of air current direction in the terminal ganglion. Figure5A is a stereo pair of IN L10-3 superimposed over the afferentmap. The colored clouds represent the combined ensemble ofsensory afferent density clouds, color-coded for directional sen-sitivity identically as they were in Figure 2C. Note that eachdendritic segment of the interneuron has been assigned a coloridentical to the local color of the afferent cloud. Figure 5B showsthis same color-coded representation of the interneuron, this time
without the ensemble afferent density clouds (i.e., the dendrites ofthe interneuron have been used as a “mask” for the afferentdensity map). This illustrates the spatial location of the dendritesof the interneuron with respect to the map of stimulus directionsynthesized by the afferent projections into this region of theglomerulus. This image represents a quantitative, first-order pre-diction of the spatial distribution of afferent inputs onto thisinterneuron as a function of the afferents’ peak directional tun-ing. Figure 5C–E shows similar predictions for the other threeinterneurons in this class.
These predictions suggest that the distribution of afferent in-puts to each of the four interneurons is unique. Each of the fourINs has a large dendritic arbor that extends over a broad regionof the map. Despite this extensive arborization, the differentsubarbors of each IN sample regions of the map that are relativelysimilar in directional tuning. For example, in Figure 5C, inter-neuron L10-2 projects to areas of the map that are tuned to aircurrent directions centered around 225°. The range of directionaltuning inputs that this neuron could receive is ;135–315°. Dif-ferent interneurons sample overlapping but significantly differentregions. For example, IN L10-3 overlaps with regions of the mapencompassing air current directions from 45 to 225°, centered on315°. Thus, the position of the dendrites of each of these inter-neurons ensures that each one has access to a broad range ofexcitatory inputs and that these inputs are from regions of themap that represent continuous regions of sensory space.
These relationships were quantified by calculating the amountof anatomical overlap between all the primary afferents and eachof the four interneurons and plotting the amount of overlapversus the directional tuning of the afferent. Figure 6 shows theserelationships for the four interneurons. Each interneuron over-laps with a broad range of afferents, yet the distribution of theseinputs is unique to each IN. The largest amount of overlapcorrelates roughly with the peak of the directional tuning curve ofeach IN. As a group, these INs cover the entire stimulus rangerepresented within the afferent population.
Dendritic shapes as detectors of spatial patternsof activityThe results presented thus far support the hypothesis that thedirectional tuning properties of interneurons are very closely tiedto their dendritic structures. Because the input to the interneu-rons from the sensory afferents takes the form of a three-dimensional spatial pattern, then the decoding mechanism usedby the interneurons could be a “spatial filter” function: theinterneuron responds maximally when the afferent activationpattern matches its dendritic architecture and responds less as theactivation pattern diverges from that shape. If a pattern of activityis generated that is the inverse of the shape of the IN (i.e.,suppression of activity through presentation of an anti-preferredstimulus), then activity in that IN is suppressed. Each interneu-ron should be sensitive to a specific range of spatial patterns thatcorrespond to the locations of its dendrites. Because each inter-neuron has a different shape, each should be sensitive to only asubset of the activity patterns.
We examined this hypothesis by predicting the level of excita-tory input onto the dendrites of each interneuron as a function ofthe spatial pattern of activity within the map for stimuli fromdifferent directions. Figure 7 illustrates our approach. The toppanel of Figure 7 shows a stereo pair image of the activity patternpredicted within the afferent map in response to a stimulus at 225°with respect to the animal’s body. This direction is known from
Figure 4. Anatomical reconstructions of four different primary sensoryinterneurons and their directional tuning curves. Top four panels are theimages of L10-3, R10-3, L10-2, and R10-2. Each neuron was stained andreconstructed in 3-D, scaled, and aligned to the database. The cell bodiesof the neurons have been removed so as not to obscure the dendriticbranching patterns. The distance between the ticks on the horizontal andvertical axis on each image is 40 mm. Bottom panel, Directional tuningcurves of each interneuron to unidirectional air current stimuli, plotted asrelative response amplitude versus stimulus direction. These tuningcurves are truncated cosine curves fit to experimentally measured stimu-lus–response data, as described in Materials and Methods.
2938 J. Neurosci., April 15, 2000, 20(8):2934–2943 Jacobs and Theunissen • Extraction of Sensory Parameters from a Neural Map

earlier electrophysiological studies to be the optimal stimulusdirection for IN L10-2 (Miller et al., 1991.) As in Figure 3, therelative activity levels in the map are coded with a gray scale. Inthe center stereo pair, the 3-D structure of IN L10-2 (shown inblack) is superimposed with this afferent response pattern. Notethat areas of the map that show high levels of activity (whiteregions) are located in the same regions as most of the dendritesof the IN. In the lower stereo pair, the dendrites of the interneu-ron have been used to mask the afferent activity pattern. That is,each dendritic segment of the interneuron has been assigned atone of gray identical to the local color of the afferent activitylevel within the map. Here, the distribution and level of activitycan be seen to vary over the different dendritic regions. Most ofthe dendrites appear white, which indicates that the afferent inputto these dendritic regions is maximally activated by the stimulus.Other dendritic regions show lower levels of activation, as indi-cated by darker gray levels. Qualitatively, the spatial filter formedby the dendritic architecture of this IN is well matched to thepattern of activity that we predict would be elicited by a stimulusat the optimal direction of that IN.
Just as the spatial pattern of activity in the map changes as afunction of stimulus direction, so does the level of excitatoryinput to the different dendritic regions of the interneuron. Figure8 shows the predictions of the level of excitatory input to IN L10-2for four orthogonal stimulus directions: 45, 135, 225, and 315°.
These images are shown for qualitative comparison to the trun-cated cosine curve corresponding to the average directional tun-ing curve of this type of IN. For stimuli at 225°, which is the peaksensitivity direction for this IN, a large portion of the dendriticarbor is activated maximally. At the opposite (anti-preferred)direction, most of the dendritic segments are black, indicatingthat most of the afferent input is totally suppressed. At interme-diate directions, there is some balance between excitation andsuppression.
Similar functional relationships hold true for the three othertypes of interneurons studied here. Figure 9 shows the levels ofexcitation in the dendritic trees of the four interneurons, for eachof four different stimulus directions. These four directions (45,135, 225, and 315°) correspond to the peak tuning directions ofthe different interneurons. Note that the best match between thestructure of each interneuron and the different predicted patternsof afferent activation corresponds to the peak tuning direction ofthat IN (IN L10-3, 45°; IN R10-2, 135°; IN L10-2, 225°; IN R10-3,315°). Each shows the greatest suppression at a direction oppositeto its peak tuning direction.
DISCUSSIONThe algorithm for the computation of stimulus direction at thisprimary processing stage in the cercal system is very straightfor-ward. The afferents are broadly tuned to air current direction and
Figure 5. Prediction of the distribution of excitatory inputs to the dendrites of four identified interneurons. A, Stereo image of IN L10-3 in register withthe map of air current direction formed by the primary sensory afferents. The dendrites of the interneuron have been color-coded according to theirspatial location within the map. The color coding represents a quantitative prediction of the distribution of excitatory input to each dendritic region. Bshows this distribution of inputs on R10-3, but without the afferent density clouds. C–E show similar predictions for the remaining three types of sensoryinterneurons (C, R10-3; D, L10-2; E, R10-2). Note that each interneuron may receive input from sensory afferents tuned to a wide range of directions.However, the distribution of these inputs is unique to each interneuron. The distance between ticks on the horizontal and vertical axis on each imageis 40 mm.
Jacobs and Theunissen • Extraction of Sensory Parameters from a Neural Map J. Neurosci., April 15, 2000, 20(8):2934–2943 2939

have directional response curves that are well estimated by cosinefunctions. These afferent tuning curves form the basis functionset from which the interneuron tuning curves are derived. Thestimulus–response curves of the four interneurons studied hereappear to be synthesized through linear summation and subse-quent thresholding of restricted subsets of these afferent tuningcurves. Because the subset of afferents to which each interneuronconnects have a very restricted range of peak tuning directions,then the response of each interneuron also displays directionalsensitivity. The net directional sensitivity of the interneuron isthe weighted (and thresholded) average of the tuning curves ofthe afferents that synapse onto that interneuron.
The extraction of air current direction by these sensory inter-neurons can be understood largely in terms of the anatomy of thesystem. First, the afferent projection is arranged in such a way
Figure 6. Extent of anatomical overlap between primary sensory inter-neurons and primary afferents, as a function of the peak directionalsensitivity of the afferents. The top four panels show the percentage ofanatomical overlap between each primary sensory interneuron and thewhole range of sensory afferents from both cerci. Each interneuronoverlaps differentially with the afferent ensemble and has a great dealmore overlap with some afferents than with others. The bottom panelshows the truncated cosine functions that are the best-fit approximationsto the directional tuning curves of the sensory interneurons, determinedas described in Materials and Methods. It is clear that the directionaltuning curve of each interneuron is centered at a stimulus direction thatcorresponds to the peak in the distribution of afferents with which it hasthe greatest anatomical overlap.
Figure 7. Prediction of the relative levels of excitatory input onto thedendrites of an interneuron, in response to a stimulus from that cell’soptimal stimulus direction. Top, Stereo pair image of the predicted spatialpattern of activity within the afferent map in response to an air currentdirected at the animal at 225°. For each population of afferents tuned toa specific direction, the maximum level of activity is indicated as white andbaseline activity as midgray, and a decrease below baseline activity isindicated as dark gray to black. Middle, Stereo pair image of IN L10-2imbedded within this activation pattern. Note that the dendrites occupyregions of relatively high activity within the map (white areas). Bottom,Stereo pair image of the dendrites of the interneuron, in the absence ofthe activity-coded afferent density clouds. Here, the structure of thedendrites of the IN has been used to mask the afferent activity pattern.That is, each dendritic segment of the interneuron has been assigned atone of gray identical to the local color of the afferent activity level withinthe map. This gray scale-coding therefore represents a first-order predic-tion of the relative level of excitatory input to the dendrites from afferentsactivated by the stimulus.
2940 J. Neurosci., April 15, 2000, 20(8):2934–2943 Jacobs and Theunissen • Extraction of Sensory Parameters from a Neural Map

that the arborizations from afferents with similar directionaltuning properties are located near one another. Second, theafferent projection pattern is continuous with respect to stimulusdirection: a continuous variation in stimulus direction causes acontinuous variation in the activation pattern. Third, the restric-tion of the synaptic connections of an interneuron to a unique setof afferents having a limited range of directional sensitivitiesresults from the unique anatomy of that interneuron: its dendriticarbors are located within restricted regions of the afferent mapcontaining afferents with a limited subset of directionalsensitivities.
Is this anatomically derived restriction to a subset of afferentssufficient to explain the directional tuning curves of the interneu-rons, or is it necessary to assume the operation of some additionalconstraints? To a first approximation, Figures 5 and 6 are consis-tent with the hypothesis that anatomical overlap between affer-ents and interneurons is an adequate indicator for their synapticconnectivity. That is, all essential features of the interneurontuning curves can be understood under the assumptions that (1)each interneuron synapses with afferents that overlap with itsdendritic arbors and (2) the relative synaptic weights of theconnections between an interneuron and the different afferentsare proportional to the relative overlap with those afferents.
We note that other interneurons in the cercal system showmore complex directional response characteristics, including non-sinusoidal and bi-lobal directional tuning curves. Such directionaltuning curves would not be predictable from linear summation ofcosine basis functions. These complex response properties mayemerge from various factors, including voltage-dependent con-ductances in the dendrites of the interneurons (Horner et al.,1997), complex properties of synaptic conductances and/or dif-ferential connectivity between interneurons, afferents of differentlength classes (Kanou and Shimozawa, 1984; Chiba et al., 1988;
Davis and Murphey, 1993), and synaptic interconnections withlocal interneurons.
Functional significance of the structural organizationof this systemThe functional organization of the set of four interneurons stud-ied here is equivalent to a Cartesian coordinate system for com-puting the stimulus direction vector: the four interneurons projecttheir cosine response sensitivity functions onto two perpendicularcoordinate axes. For any air current stimulus direction, the firingrates of the two active interneurons could be decoded as Carte-sian coordinates by neurons at successive processing stages. Fourinterneurons are required to cover all directions, because nega-tive coordinates cannot be encoded within the region of thereceptive field of a cell where its response is suppressed belowfiring threshold.
What is the functional significance of this Cartesian scheme?In an earlier study, we demonstrated that any variation in thespacing of the peaks of sensitivity of the four tuning curves awayfrom perfect orthogonality would decrease encoding efficiency inthis system, as measured by the mutual information betweendirectional stimuli and the four-cell ensemble responses(Theunissen and Miller, 1991). Subsequently, Salinas and Abbott(1994) demonstrated that these four cells actually operate as an“optimal linear estimator” of stimulus direction. They showedthat this Cartesian scheme is optimal in the sense that, onaverage, it provides the best possible linear reconstruction of thestimulus direction vector and works as well as more complexstatistical methods that require more detailed information aboutthe responses of the coding neurons.
Considering the functional significance of this arrangement,the developmental basis for the establishment of this Cartesianorthogonality of the directional sensitivity curves of these four
Figure 8. Prediction of the relative level of excitatory input to IN L10-2 in response to air currents from four orthogonal directions. The dendrites havebeen gray scale-coded according to the predicted level of excitatory input from the population of afferents, as in Figure 7. For each direction, the spatialpattern of activity elicited within the map is different, and thus the activation pattern masked onto the dendrites of the interneuron will appear different.The maximum level of activation occurs for 225°; the minimum level occurs for 45°. These directions correspond to the peak and trough, respectively,of the directional tuning curve of the cell. The response amplitude in the cell to directions 315 and 135° is the same; however, the distribution of excitatoryinput to the cell is quite different for these two stimulus directions. The directional tuning curve of the cell is presented in right panel for reference. Thistuning curve is a truncated cosine curve fit to physiologically measured tuning curves, as described in Materials and Methods.
Jacobs and Theunissen • Extraction of Sensory Parameters from a Neural Map J. Neurosci., April 15, 2000, 20(8):2934–2943 2941

cells is extremely interesting. Certainly, this orthogonality isnontrivial: as shown in earlier work, the population of mech-anosensory afferents on the cerci are not uniform with respect tothe distribution of directional sensitivity curves (Landolfa andJacobs, 1995). There are extreme peaks and valleys in the distri-bution of sensitivity curves, and the peaks are not coincident withthe natural Cartesian axes established by the interneurons. Thus,for the interneurons to establish an orthogonal axis set, they maysample the set of afferent basis functions with a more complexsynaptic weighting scheme that also meets the criteria of Salinasand Abbott (1994) for optimal linear estimation.
What factors might contribute to (or constrain) the establish-ment of this Cartesian system during development? To whatextent is the connectivity scheme “hard-wired,” and to what
extent might it be activity dependent? On one hand, it seemsreasonable to speculate that natural selection might have opti-mized a hard-wired, genetically preprogrammed configurationfor this system that maximizes information processing capabili-ties under the constraints of limited resources. This system does,indeed, play a crucial role in defensive and reproductive behav-iors. Alternatively, the orthogonal configuration of these fourinterneurons might be established and refined in an activity-dependent manner during development. Although these two pos-sibilities are impossible to distinguish on the basis of the datapresented here, we note that the observed orthogonal configura-tion must correspond to a global minimum in the net covariancein activity across the set of four interneurons. This derives di-rectly from the theoretical results of Salinas and Abbott (1994).
Figure 9. Predictions of the relative levels of excitatory input onto four interneurons in response to air currents from four orthogonal directions. Imageswere derived exactly as in Figures 7 and 8. Each panel of four images corresponds to the relative level of excitatory input to a single type of interneuron,in response to four different air current directions (45, 135, 225, and 315°). For each direction, one interneuron receives the greatest excitatory input,as follows: L10-3, 45°; R10-2, 135°; L10-2, 225°; R10-3, 315°. These directions correspond to the peaks of the tuning curve, respectively, of each IN.
2942 J. Neurosci., April 15, 2000, 20(8):2934–2943 Jacobs and Theunissen • Extraction of Sensory Parameters from a Neural Map

To understand this at a more conceptual level, consider a case inwhich the tuning curve of one of the four interneurons was shifted“clockwise” with respect to the three other curves by 45°. Theaverage covariance between its responses and those of its closestneighbor would increase significantly, and the degree of thenegative covariance with its former polar opposite would decreasesignificantly. It is therefore conceivable that Hebbian-likeactivity-dependent plasticity mechanisms that follow correlationrules might play a role in fine-tuning the structural and/or func-tional parameters of this system.
The implementation of the coding scheme for the sensorimotortouch system in the leech is almost identical, in a functional sense,to the cercal system (Lewis and Kristan, 1998). Leeches respond toa touch on the body with a local bending reflex. The touch-sensitiveP neurons have cosine tuning curves that have peaks at 45, 135, 225,and 315° with respect to the body axis, which are the same set ofpeak tuning angles of the four sensory interneurons in the cricket.Both of these systems are implemented around a Cartesian coor-dinate system, rotated with respect to the body axis by 45°.
Although the optimality of an orthogonal configuration can bederived from a functional standpoint, there are no known func-tional constraints that would favor the observed 45° off-axisconfigurations. From the standpoint of our earlier information-theoretic analysis or by the analysis of optimal linear estimatorsof Salinas and Abbott (1994), any set of four interneurons havingappropriately shaped tuning curves should do as well as the actualset, as long as the peaks of the tuning curves of this alternate setare spaced at 90° intervals around the sensory range. Whatadditional constraints might “break the symmetry” in this caseand select for the particular set of Cartesian coordinate axes seenin the cricket and leech systems? Here again, although mecha-nisms cannot be identified through our work, our results suggestone possibility: constraints might exist that are related to theestablishment of bilateral symmetry of nervous systems. Each ofthe four interneurons that we studied has a homolog that ismirror symmetric across the ganglionic midplane. If we imposethe constraint that any linear encoder must be constructed frombilaterally symmetric pairs of cells, then the observed 45° config-uration is the only truly optimal linear encoder, because it is theonly configuration that can be constructed with only four cells.For any other orientation of the coordinate axes, a four-celloptimal linear estimator would have to include nonbilaterallysymmetric cells. Alternatively, any other linear estimator that wasconstrained to use bilaterally symmetric cell pairs would requiremore than four (and therefore functionally redundant) neurons.
REFERENCESBacon JP, Altman JS (1977) A silver intensification method for cobalt
filled neurons in whole mount preparations. Brain Res 138:359–363.Bacon JP, Murphey RK (1984) Receptive fields of cricket (Acheta do-
mesticus) are determined by their dendritic structure. J Physiol (Lond)352:601–613.
Chiba A, Shepherd D, Murphey RK (1988) Synaptic rearrangementduring postembryonic development in the cricket. Science 240:901–905.
Davis G, Murphey RK (1993) A role for postsynaptic neurons in deter-mining presynaptic release properties in the cricket CNS: evidence forretrograde control of facilitation. J Neurosci 13:3827–3838.
Horner M, Kloppenburg P, Heblich R (1997) Characterization of ioniccurrents from identified cricket giant interneurons in primary cellculture. Proceedings of the 25th Gottingen Neurobiology Conference,Vol 2, p 780.
Jacobs GA, Miller JP (1985) Functional properties of individual neuro-nal branches isolated in situ by laser photoinactivation. Science228:344–346.
Jacobs GA, Nevin R (1991) Anatomical relationships between sensoryafferent arborizations in the cricket cercal system. Anat Rec231:563–572.
Jacobs GA, Theunissen FE (1996) Functional organization of a neuralmap in the cricket cercal sensory system. J Neurosci 16:769–784.
Jacobs GA, Miller JP, Murphey RK (1986) Cellular mechanisms under-lying directional sensitivity of an identified sensory interneuron. J Neu-rosci 6:2298–2311.
Johnson SE, Murphey RK (1985) The afferent projection of mesotho-racic bristle hairs in the cricket Acheta domesticus. J Comp Physiol156:369–379.
Kanou M, Shimozawa TA (1984) Threshold analysis of cricket cercalinterneurons by an alternating air-current stimulus. J Comp Physiol [A]154:357–365.
Landolfa M, Jacobs GA (1995) Direction sensitivity of the filiform hairpopulation of the cricket cercal system. J Comp Physiol [A]177:759–766.
Landolfa MA, Miller JP (1995) Stimulus/response properties of cricketcercal filiform hair receptors. J Comp Physiol [A] 177:749–757.
Lewis JE, Kristan WB (1998) A neuronal network of computing popu-lation vectors in the leech. Nature 391:76–79.
Miller JP, Jacobs GA, Theunissen FE (1991) Representation of sensoryinformation in the cricket cercal sensory system. I. Response propertiesof the primary interneurons. J Neurophysiol 66:1680–1689.
Paydar S, Doan CA, Jacobs GA (1999) Neural mapping of direction andfrequency in the cricket cercal sensory system. J Neurosci19:1771–1781.
Roddey JC, Jacobs GA (1996) Information theoretic analysis of dynam-ical encoding by filiform mechanoreceptors in the cricket cercal systemJ Neurophysiol 75:1365–1476.
Salinas E, Abbott LF (1994) Vector reconstruction from firing rates.J Comput Neurosci 1:89–107.
Shimozawa T, Kanou M (1984a) Varieties of filiform hairs: range frac-tionation by sensory afferents and cercal interneurons of a cricket.J Comp Physiol [A] 155:485–493.
Shimozawa T, Kanou M (1984b) The aerodynamics and sensory physi-ology of range fractionation in the cercal filiform sensilla of the cricketGryllus bimaculatus. J Comp Physiol [A] 155:495–505.
Theunissen FE, Miller JP (1991) Representation of sensory informationin the cricket cercal sensory system. II. Information theoretic calcula-tion of system accuracy and optimal tuning-curve widths of four pri-mary interneurons. J Neurophysiol 66:1690–1703.
Theunissen FE, Roddey JC, Stufflebeam S, Clague H, Miller JP (1996)Information theoretic analysis of dynamical encoding by four primarysensory interneurons in the cricket cercal system. J Neurophysiol75:1345–1376.
Troyer TW, Levin JE, Jacobs GA (1994) Construction and analysis of adata base representing a neural map. Microsc Res Tech 29:329–343.
Jacobs and Theunissen • Extraction of Sensory Parameters from a Neural Map J. Neurosci., April 15, 2000, 20(8):2934–2943 2943