![Gas Chromatography-Mass Spectrometric Analysis of Forensic … · 2017-10-28 · benzodiazepines in blood [12-14]. Using liquid-liquid extraction, gas chromatography with tandem mass](https://static.fdocuments.net/doc/165x107/5e3b4516665f2b635c6b48a7/gas-chromatography-mass-spectrometric-analysis-of-forensic-2017-10-28-benzodiazepines.jpg)
Extraction-High Performance Liquid Chromatography-Tandem ...
15
Quantification of Urinary Mono-hydroxylated Metabolites of Polycyclic Aromatic Hydrocarbons by on-line Solid Phase Extraction-High Performance Liquid Chromatography-Tandem Mass Spectrometry Yuesong Wang * , Lei Meng, Erin N. Pittman, Alisha Etheredge, Kendra Hubbard, Debra A. Trinidad, Kayoko Kato, Xiaoyun Ye, and Antonia M. Calafat Division of Laboratory Sciences, National Center for Environmental Health, Centers for Disease Control and Prevention, Atlanta 30341, Georgia, USA Abstract Human exposure to polycyclic aromatic hydrocarbons (PAHs) can be assessed through monitoring of urinary mono-hydroxylated PAHs (OH-PAHs). Gas chromatography (GC) has been widely used to separate OH-PAHs before quantification by mass spectrometry in biomonitoring studies. However, because GC requires derivatization, it can be time consuming. We developed an on-line solid phase extraction coupled to isotope dilution-high performance liquid chromatography- tandem mass spectrometry (on-line-SPE-HPLC-MS/MS) method for the quantification in urine of 1-OH-naphthalene, 2-OH-naphthalene, 2-OH-fluorene, 3-OH-fluorene, 1-OH-phenanthrene, the sum of 2-OH and 3-OH-phenanthrene, 4-OH-phenanthrene, and 1-OH-pyrene. The method, which employed a 96-well plate platform and on-line SPE, showed good sensitivity (i.e., limits of detection ranged from 0.007 to 0.09 ng/mL) and used only 100 μL of urine. Accuracy, calculated from the recovery percentage at three spiking levels, varied from 94% to 113%, depending on the analyte. The inter- and intra-day precision, calculated from 20 repeated measurements of two quality control materials, varied from 5.2% to 16.7%. Adequate method performance was also confirmed by acceptable recovery (83–102%) of two NIST standard reference materials (3672 and 3673). This high-throughput online-SPE-HPLC-MS/MS method can be applied in large scale epidemiological studies. Keywords polycyclic aromatic hydrocarbons (PAHs); OH-PAHs; exposure; HPLC-MS/MS; urine * Corresponding author: Yuesong Wang, Centers for Disease Control and Prevention, 4770 Buford Hwy, Mailstop F53, Atlanta, Georgia 30341, USA, Telephone: 770-488-0336, Fax: 770-488-0333, [email protected]. Compliance with Ethical Standards The authors declare that they have no conflict of interest. This research involved human participants. The Centers for Disease Control and Prevention (CDC) Institutional Review Board approved the anonymous collection of urine, and waived informed consent under 45 CFR46.116 (d). Disclaimer: The findings and conclusions in this report are those of the author(s) and do not necessarily represent the views of the Centers for Disease Control and Prevention (CDC). Use of trade names is for identification only and does not imply endorsement by the CDC, the Public Health Service, or the US Department of Health and Human Services. The authors declare they have no actual or potential competing financial interests. The authors complied with all needed research requirements regarding human subjects. HHS Public Access Author manuscript Anal Bioanal Chem. Author manuscript; available in PMC 2017 August 23. Published in final edited form as: Anal Bioanal Chem. 2017 February ; 409(4): 931–937. doi:10.1007/s00216-016-9933-x. Author Manuscript Author Manuscript Author Manuscript Author Manuscript
Transcript of Extraction-High Performance Liquid Chromatography-Tandem ...

Quantification of Urinary Mono-hydroxylated Metabolites of Polycyclic Aromatic Hydrocarbons by on-line Solid Phase Extraction-High Performance Liquid Chromatography-Tandem Mass Spectrometry
Yuesong Wang*, Lei Meng, Erin N. Pittman, Alisha Etheredge, Kendra Hubbard, Debra A. Trinidad, Kayoko Kato, Xiaoyun Ye, and Antonia M. CalafatDivision of Laboratory Sciences, National Center for Environmental Health, Centers for Disease Control and Prevention, Atlanta 30341, Georgia, USA
Abstract
Human exposure to polycyclic aromatic hydrocarbons (PAHs) can be assessed through monitoring
of urinary mono-hydroxylated PAHs (OH-PAHs). Gas chromatography (GC) has been widely used
to separate OH-PAHs before quantification by mass spectrometry in biomonitoring studies.
However, because GC requires derivatization, it can be time consuming. We developed an on-line
solid phase extraction coupled to isotope dilution-high performance liquid chromatography-
tandem mass spectrometry (on-line-SPE-HPLC-MS/MS) method for the quantification in urine of
1-OH-naphthalene, 2-OH-naphthalene, 2-OH-fluorene, 3-OH-fluorene, 1-OH-phenanthrene, the
sum of 2-OH and 3-OH-phenanthrene, 4-OH-phenanthrene, and 1-OH-pyrene. The method, which
employed a 96-well plate platform and on-line SPE, showed good sensitivity (i.e., limits of
detection ranged from 0.007 to 0.09 ng/mL) and used only 100 μL of urine. Accuracy, calculated
from the recovery percentage at three spiking levels, varied from 94% to 113%, depending on the
analyte. The inter- and intra-day precision, calculated from 20 repeated measurements of two
quality control materials, varied from 5.2% to 16.7%. Adequate method performance was also
confirmed by acceptable recovery (83–102%) of two NIST standard reference materials (3672 and
3673). This high-throughput online-SPE-HPLC-MS/MS method can be applied in large scale
epidemiological studies.
Keywords
polycyclic aromatic hydrocarbons (PAHs); OH-PAHs; exposure; HPLC-MS/MS; urine
*Corresponding author: Yuesong Wang, Centers for Disease Control and Prevention, 4770 Buford Hwy, Mailstop F53, Atlanta, Georgia 30341, USA, Telephone: 770-488-0336, Fax: 770-488-0333, [email protected].
Compliance with Ethical StandardsThe authors declare that they have no conflict of interest. This research involved human participants. The Centers for Disease Control and Prevention (CDC) Institutional Review Board approved the anonymous collection of urine, and waived informed consent under 45 CFR46.116 (d).
Disclaimer: The findings and conclusions in this report are those of the author(s) and do not necessarily represent the views of the Centers for Disease Control and Prevention (CDC). Use of trade names is for identification only and does not imply endorsement by the CDC, the Public Health Service, or the US Department of Health and Human Services. The authors declare they have no actual or potential competing financial interests. The authors complied with all needed research requirements regarding human subjects.
HHS Public AccessAuthor manuscriptAnal Bioanal Chem. Author manuscript; available in PMC 2017 August 23.
Published in final edited form as:Anal Bioanal Chem. 2017 February ; 409(4): 931–937. doi:10.1007/s00216-016-9933-x.
Author M
anuscriptA
uthor Manuscript
Author M
anuscriptA
uthor Manuscript
Introduction
Polycyclic aromatic hydrocarbons (PAHs) are ubiquitous environmental pollutants linked to
a variety of adverse health effects (1–3). Humans may be exposed to PAHs through
occupation, such as in work involving diesel fuels and coal tars (4, 5), as well as through diet
and other lifestyle activities (e.g., smoking) (6–8). The urinary concentrations of PAH
metabolites, specifically mono-hydroxylated PAHs (OH-PAHs), have been used as
biomarkers of human exposure to PAHs (7, 9, 10).
The pioneering quantification of OH-PAHs in urine was conducted by high performance
liquid chromatography (HPLC) coupled with fluorescence detection (4). Thanks in part to
technology advances of the last few decades, isotope dilution gas chromatography-mass
spectrometry (GC-MS) became widely used for the determination of urinary OH-PAHs (11–
16). GC-MS showed improved accuracy, sensitivity, and precision, mainly because of the
high specificity of mass spectrometry detection. However, sample preparation involved
derivatization and solvent evaporation steps, and was, therefore, labor intensive and time
consuming. More recently, HPLC-tandem MS (HPLC-MS/MS), introduced to measure OH-
PAHs (17–26), eliminated the derivatization step and yet maintained the high specificity of
mass spectrometry. Still, a relatively large volume of urine, e.g., 2–5 mL, was required in
HPLC-MS/MS methods, and automated sample preparation was not fully applied (20, 21).
These conditions have limited HPLC-MS from application in large scale biomonitoring
studies when matrix volume is often limited.
For the present study, we developed a fully automatic on-line solid phase extraction coupled
with isotope dilution-high performance liquid chromatography-tandem mass spectrometry
(on-line SPE HPLC-MS/MS) method for the accurate and reliable measurement of nine OH-
PAHs in human urine.
EXPERIMENTAL SECTION
Materials and Methods
All solvents were HPLC grade, and chemicals were reagent grade. We purchased
acetonitrile, ethanol, 0.1% formic acid in water, methanol, water, and ammonium fluoride
from Thermo Fisher Scientific (Waltham, MA, USA); ascorbic acid, sodium acetate, and
Helix pomatia β-glucuronidase type H-1 (β-glucuronidase ≥300,000 units/g, sulfatase
≥10,000 units/g) from Sigma-Aldrich (St. Louis, MO, USA). We obtained 1-
hydroxynaphthalene (1-OH-NAP), 2-hydroxynaphthalene (2-OH-NAP), 2-hydroxyfluorene
(2-OH-FLU), 3-hydroxyfluorene (3-OH-FLU), 1-hydroxyphenanthrene (1-OH-PHE), 2-
hydroxyphenanthrene, 3-hydroxyphenanthrene, 4-hydroxyphenanthrene (4-OH-PHE), 1-
hydroxypyrene (1-OH-PYR), and their corresponding 13C-labeled internal standards (IS,
listed in Table 1) from Cambridge Isotope Laboratories (Andover, MA, USA).
We purchased smokers’ urine samples from BioreclamationIVT (Westbury, NY, USA). We
also collected urine anonymously in 2015 from non-smoker adult volunteers with no
documented occupational exposure to PAHs in Atlanta, GA. We obtained two Standard
Reference Materials® (SRMs), SRM 3672 (smoker urine) and SRM 3673 (non-smoker
Wang et al. Page 2
Anal Bioanal Chem. Author manuscript; available in PMC 2017 August 23.
Author M
anuscriptA
uthor Manuscript
Author M
anuscriptA
uthor Manuscript

urine), from the US National Institute of Standards and Technology (NIST) (Gaithersburg,
MD, USA). All urine specimens were stored upon collection or arrival at −70 °C until use.
Appropriate safety control measures (including engineering, administrative, and personal
protective equipment) were used for all procedures based on a site-specific risk assessment
that identified physical, health, and procedural hazards.
Preparation of standard stock solutions and quality control materials—We
prepared the stock solutions of individual analytical standard in ethanol. Standards with all
nine OH-PAHs were generated by serial dilution of the individual stock in 40% ethanol/60%
water. The final concentrations of the mixed stock standards ranged from 0.08 – 200 ng/mL
(1-OH-NAP and 2-OH-NAP) and 0.005 – 50 ng/mL (all other analytes). The standard
solutions were aliquoted into 2 mL silanized amber glass vials and stored at 4 °C until use.
The internal standard solution with 13C-labeled analytes was prepared in water with 0.2%
acetonitrile so that a 50 μL spike would result in approximate concentrations of 32 ng/mL
(13C-1-OH-NAP and 13C-2-OH-NAP) or 8 ng/mL (other 13C-labeled analytes). Internal
standards were aliquoted into 15 mL amber glass vials and stored at −70 °C.
Two levels of quality control (QC) materials, QC low (QCL) and QC high (QCH), were
prepared by pooling urines from smokers and non-smokers. The QC concentrations were
fortified, as needed, with native target compounds to encompass the ranges described for the
U.S. general population (27). All QC materials were stored in 4 mL amber glass vials at
−70 °C until used. The stability of spiked material stored at −70 °C has been previously
evaluated for up to one year (data not shown), and no obvious degradation of OH-PAHs was
observed. The QC materials stored at −70 °C for more than one year will be re-evaluated for
their stability.
Sample Preparation—Urine samples were thawed and mixed at room temperature. QC
samples, reagent blanks, and standards were processed the same way as urine samples,
going through all of the sample preparation steps. Sample preparation was automatically
conducted on a Perkin-Elmer Staccato® System (controlled by the Perkin Elmer iLink and
Maestro software) (Waltham, MA, USA). The robotic system included six main
components: Sciclone G3/G3T, Fluidx CESD-24PRO decapper, Hettich Rotanta 460
centrifuge, ThermoScienfic ALPS 3000 sealer, IVD Inheco Incubator shaker DWP, and
Mitsubishi robotic arm. We programmed this system to aliquot urine samples, standards,
QCs and reagent blanks (100 μL) into a 96-well plate (Corning, NY, USA), and
subsequently add ascorbic acid solution (20 μL, ~12.5 mg/mL), internal standards solution
(50 μL), and sodium acetate buffer (50 μL, ~1 mol/L, pH 5.5) containing ~10 mg/mL β-
glucuronidase/arylsulfatase. The accuracy and precision of automatic aliquating by Sciclone
robotic system was previously evaluated, and good aliquoting accuracy (recovery rate from
95% to 105%) and precision (CV<3 %) were achieved from current procedures. Details
regarding enzymatic de-conjugation were previously described (16). The robotic system then
sealed and transferred the plate for overnight incubation at 37±2 °C. After enzymatic
hydrolysis, the robotic system automatically added methanol (175 μL) to all sample wells,
mixed the solution, resealed the plate, and centrifuged for ~15 minutes at 5000 rpm (5900
rcf). Finally, the robotic system transferred 200 μL of the supernatant in each well to a new
Wang et al. Page 3
Anal Bioanal Chem. Author manuscript; available in PMC 2017 August 23.
Author M
anuscriptA
uthor Manuscript
Author M
anuscriptA
uthor Manuscript
96-well plate, and added 350 μL of water to each well before on-line SPE-HPLC-MS/MS
analysis. Non-spiked and spiked synthetic urine (28) used for determining the limit of
detection (LOD) was prepared as study samples.
Online SPE-HPLC-MS/MS—The on-line SPE-HPLC-MS/MS system consisted of a
Sciex 5500 or 6500 triple quadrupole mass spectrometer (Foster City, CA, USA) equipped
with an electrospray ion source and controlled by AB Sciex AnalystTM software, and one
Agilent 1260 pump and one degasser (Santa Clara, CA, USA), and an on-line SPE Spark
Holland system (Glassboro, NJ, USA) controlled by the Sparklink® software (iChrom
Symbiosis system).
After injection (300 μL), the sample was loaded onto an Oasis WAX on-line SPE cartridge
with 0.1% formic acid in water (1.5 mL), and the cartridge was washed with acetonitrile/
methanol/water (~0.4 mL, 1/1/2, v/v/v). The target analytes were eluted with methanol (350
μL), and focused on a Chromolith HighResolution RP-18 endcapped guard column (5×4.6
mm, Merck KGaA, Darmstadt, Germany) with the initial HPLC gradient.
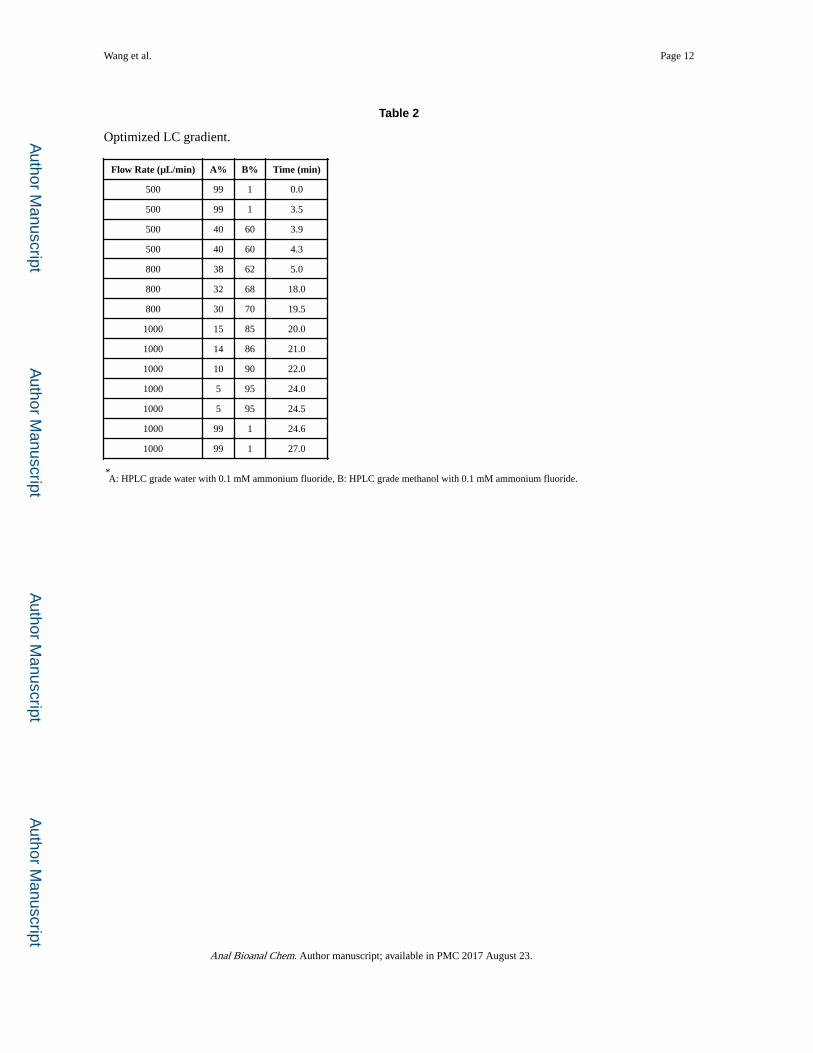
We separated the target analytes on a pair of Chromolith HighResolution RP-18 endcapped
HPLC columns (100×4.6 mm, Merck KGaA) by a programmed HPLC gradient (Table 2).
The mobile phases were water with 0.1 mM ammonium fluoride (A) and methanol with 0.1
mM ammonium fluoride (B).
The ionspray voltage and source temperature were −3.0 kV and 500 °C, respectively.
Curtain gas, ion source gas 1, ion source gas 2, and collision gas were 35 psi, 50 psi, 70 psi,
and 9 psi, respectively. The representative decluster, entrance and exit potentials were −120
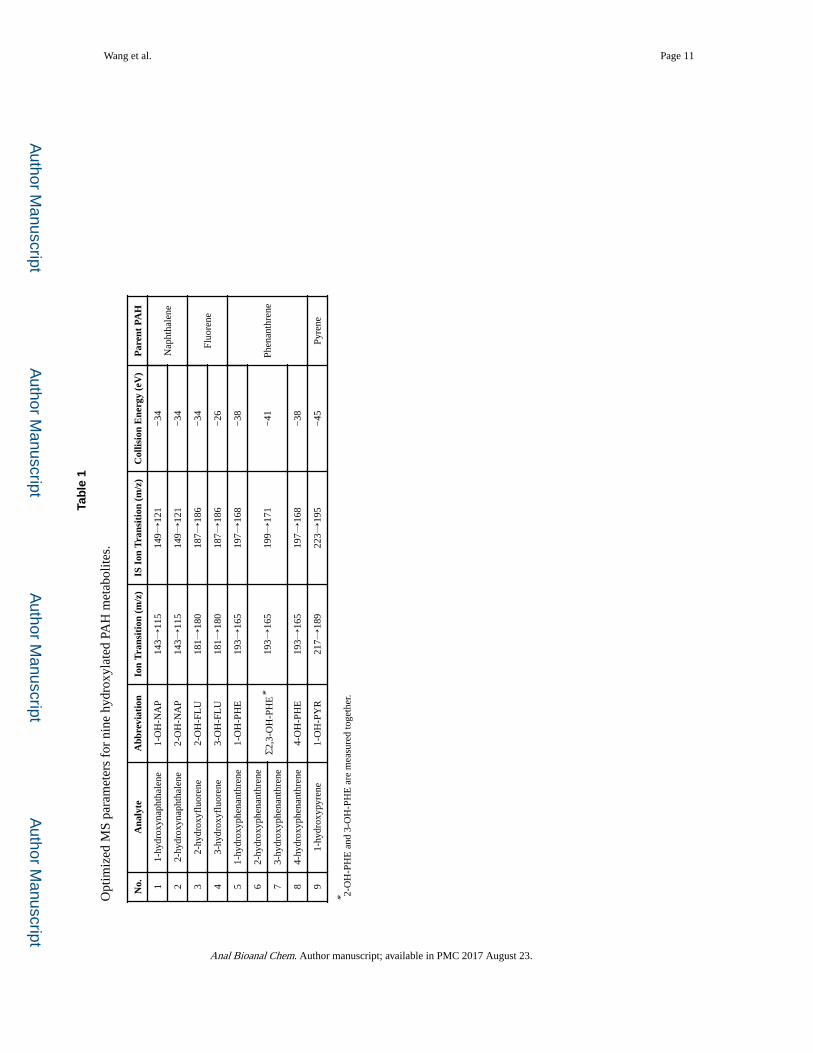
V, −3 V and −12 V, respectively. We quantified OH-PAHs by selected reaction monitoring in
the negative ion mode by the ion transitions listed in Table 1, and optimized the collision
energies for all ion transitions (Table 1).
Data Analysis—We used Analyst (version 1.6.2, Sciex, Foster City, CA, USA) and
MultiQuant (version 3.0, Sciex, Foster City, CA, USA) for data processing. We defined
quality control limits, and evaluated analytical runs using SAS (version 9.3, SAS Institute
Inc.; Cary, NC, USA) with a multi-rule quality control approach (29).
Results and discussion
OH-PAHs were enriched and extracted from the urine matrix by on-line SPE. We separated
the target analytes on a pair of monolithic RP-18 column by using a gradient of water and
methanol, including ammonium fluoride (0.1 mM) in both mobile phases. We used
ammonium fluoride to improve method sensitivity in the negative ion mode (30). An
example of LC-MS/MS selected ion chromatogram is shown in Figure 1. Within 27 mins,
we were able to separate several pair of isomers: 2-OH-NAP, 1-OH-NAP, 3-OH-FLU, 2-OH-
FLU, 1-OH-PHE, 4-OH-PHE, and 1-OH-PYR, but 2-OH-PHE and 3-OH-PHE were eluted
together so we had to measure these two analytes as a sum (Σ2,3-OH-PHE). 9-
hydroxyphenanthrene and 3-hydroxyfluoranthene could also be separated from the other
target metabolites (data not shown).
Wang et al. Page 4
Anal Bioanal Chem. Author manuscript; available in PMC 2017 August 23.
Author M
anuscriptA
uthor Manuscript
Author M
anuscriptA
uthor Manuscript
Method accuracy was assessed by repeated analyses (n=7) of synthetic urine spiked with the
target analytes at three spiking concentrations. Accuracy, expressed as a percentage of
recovery, was 105–113% (level 1), 94–100% (level 2), and 98–102% (level 3), depending on
the analyte (Table 3). Furthermore, accuracy was evaluated by analyzing two NIST SRMs,
SRM 3672 and SRM 3673. The calculated OH-PAHs concentrations were in good
agreement with the certified concentrations (31), and accuracy ranged from 83 to 102%,
depending on the analyte (Table 3).
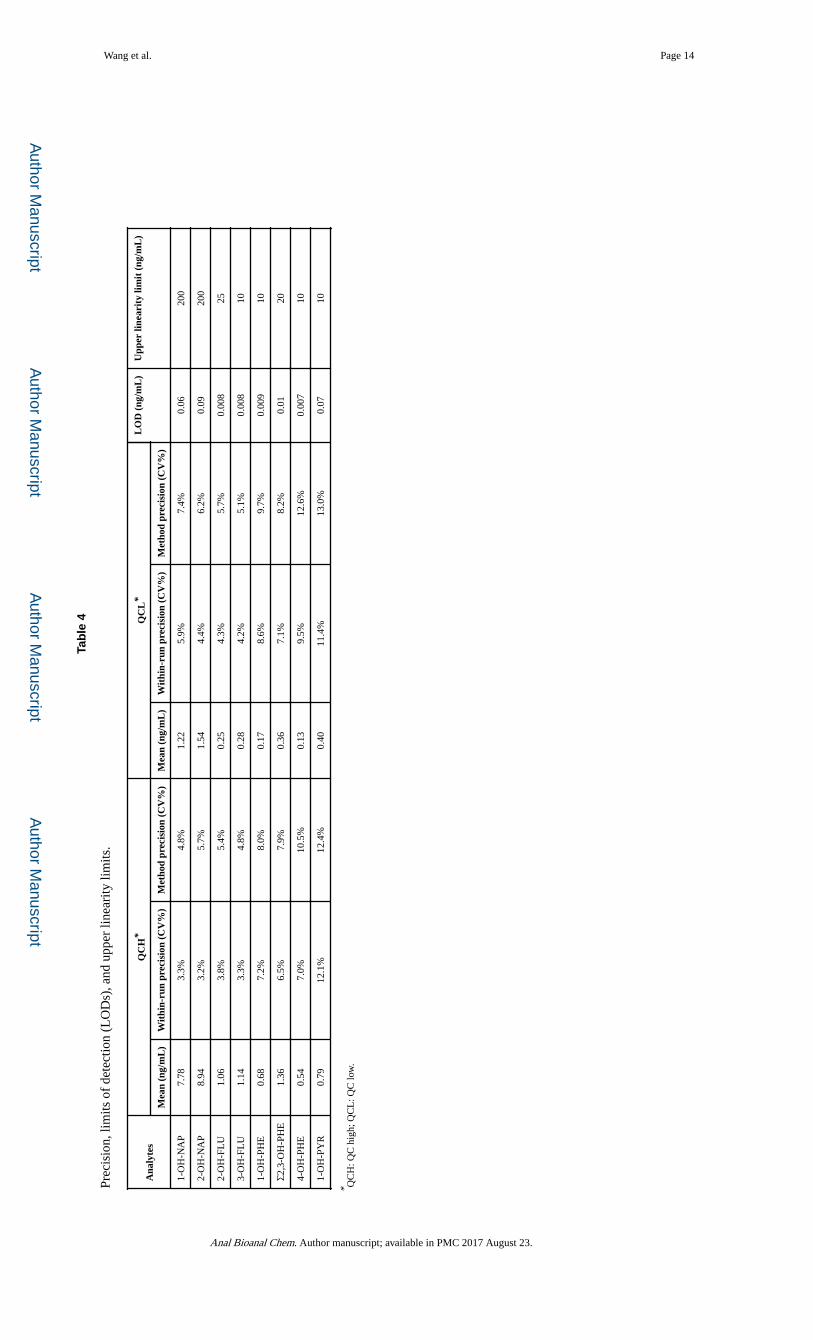
We determined the method precision from repeated measurements of low and high QC pools
by following the CLSI protocol EP5-A2 (32) on 51 different days (two results from each of
two daily runs) over a period of 8 months that involved multiple analysts. The relative
standard deviations (RSDs), which reflect the within- and between-run variability, ranged
from 3.2% to 12.1% (within-run) and 4.8% to 13.0% (within and between runs) for all
analytes (Table 4).
The LOD was determined according to procedures previously described (33) from 60
repeated measurements of non-spiked and spiked synthetic urine analyzed by multiple
operators and using four different mass spectrometers (Sciex 5500 or 6500). The LODs
ranged from 0.007 ng/mL to 0.09 ng/mL for all analytes (Table 4), indicating the good
sensitivity of the method, especially considering the relatively low volume of urine used
(100 μL). The method also provided wide dynamic ranges, with upper linearity of the
method at 200 ng/mL (2-OH-NAP, 1-OH-NAP); 25 ng/mL (2-OH-FLU); 20 ng/mL (Σ2,3-
OH-PHE); and 10 ng/mL (3-OH-FLU, 1-OH-PHE, 4-OH-PHE, 1-OH-PYR).
SPE recovery was calculated as previously described (34). The mean recoveries of three
repeated measurements were 67±4% (2-OH-NAP), 67±5% (1-OH-NAP), 81±4% (3-OH-
FLU), 64±2% (2-OH-FLU), 63±2% (Σ2,3-OH-PHE), 72±5% (1-OH-PHE), 55±2% (4-OH-
PHE), and 49±6% (1-OH-PYR). These recoveries, which are comparable with those
reported before using a GC-MS method (16), are adequate for quantitative measurement of
OH-PAHs in urine from both smokers and non-smokers. We also evaluated matrix effects
using a matrix factor, defined as the ratio of IS peak area in the presence of urine matrix to
the IS peak area in the absence of urine matrix (34). The matrix factor, calculated from 2
different QC concentrations of three repeated measurements varied from 63% to 101%,
depending on the analyte.
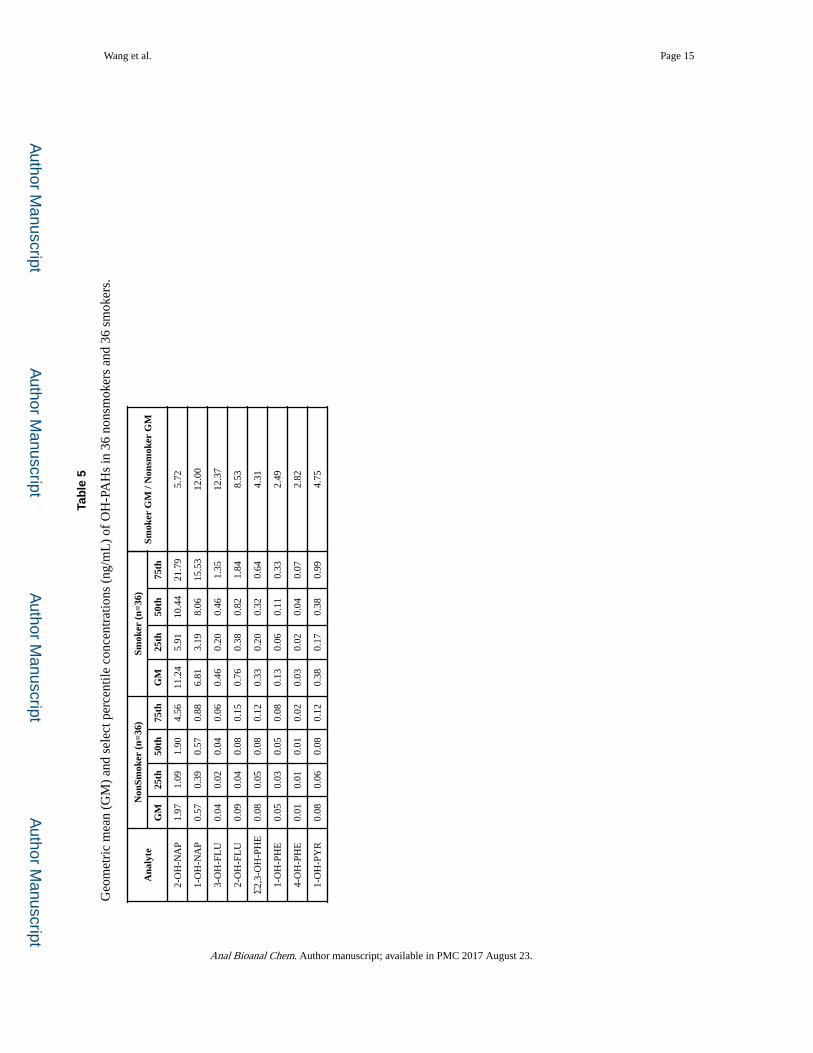
To validate the method, we measured OH-PAHs in 36 non-smokers and 36 self-identified
smokers’ urine samples (Table 5). Among non-smokers, detection frequencies were 56% for
1-OH-PYR, 14% for 4-OH-PHE, 94% for 3-OH-FLU, and 100% for the other analytes. For
smokers, detection frequencies were 97% for 1-OH-PYR, 53% for 4-OH-PHE, and 100%
for the rest of analytes. The geometric mean concentrations of OH-PAHs were 2.5–12.4
(average 6.6) times higher in smokers than non-smokers (Table 5). 2- and 3-OH-FLU and 1-
and 2-OH-NAP showed the largest concentration differences between smokers and non-
smokers.
Compared with our previous GC-MS method (13, 16), the current approach eliminated the
derivatization and solvent evaporation steps, simplified the sample processing procedure,
Wang et al. Page 5
Anal Bioanal Chem. Author manuscript; available in PMC 2017 August 23.
Author M
anuscriptA
uthor Manuscript
Author M
anuscriptA
uthor Manuscript

and greatly improved throughput, while using 10 times less urine volume (0.1 vs 1.0 mL).
This robust, sensitive, and highly automated on-line SPE-HPLC-MS/MS method is suitable
for the quick analysis of human samples in national surveys and other large epidemiological
studies to evaluate human exposure to PAHs.
References
1. Toxicological Profile for Polycyclic Aromatic Hydrocarbons. Agency for Toxic Substances and Disease Registry; Atlanta, GA: 1995. http://www.atsdr.cdc.gov/toxprofiles/tp69.pdf
2. Polycyclic Aromatic Hydrocarbons - Occurrence in Foods, Dietary Exposure, and Health Effects. European Commission, Scientific Committee on Food; 2002. http://ec.europa.eu/food/fs/sc/scf/out154_en.pdf
3. IARC Monographs on the Evaluation of Carcinogenic Risks to Humans Vol 100 F. International Agency for Research on Cancer; 2012. A Review of Human Carcinogens: Chemical Agents and Related Occupations. http://monographs.iarc.fr/ENG/Monographs/vol100F/
4. Jongeneelen FJ, Anzion RB, Leijdekkers CM, Bos RP, Henderson PT. 1-hydroxypyrene in human urine after exposure to coal tar and a coal tar derived product. Int Arch Occup Environ Health. 1985; 57(1):47–55. [PubMed: 4077281]
5. Rodrigues EG, Smith K, Maule AL, Sjodin A, Li Z, Romanoff L, et al. Urinary polycyclic aromatic hydrocarbon (OH-PAH) metabolite concentrations and the effect of GST polymorphisms among US Air Force personnel exposed to jet fuel. J Occup Environ Med. 2014; 56(5):465–71. [PubMed: 24806557]
6. Jacob J, Grimmer G, Dettbarn G. Profile of urinary phenanthrene metabolites in smokers and non-smokers. Biomarkers. 1999; 4(5):319–27. [PubMed: 23902352]
7. Suwan-ampai P, Navas-Acien A, Strickland PT, Agnew J. Involuntary tobacco smoke exposure and urinary levels of polycyclic aromatic hydrocarbons in the United States, 1999 to 2002. Cancer Epidemiol Biomarkers Prev. 2009; 18(3):884–93. [PubMed: 19258471]
8. Hagedorn HW, Scherer G, Engl J, Riedel K, Cheung F, Errington G, et al. Urinary excretion of phenolic polycyclic aromatic hydrocarbons (OH-PAH) in nonsmokers and in smokers of cigarettes with different ISO tar yields. J Anal Toxicol. 2009; 33(6):301–9. [PubMed: 19653933]
9. Huang W, Caudill SP, Grainger J, Needham LL, Patterson DG Jr. Levels of 1-hydroxypyrene and other monohydroxy polycyclic aromatic hydrocarbons in children: a study based on U.S. reference range values. Toxicol Lett. 2006; 163(1):10–9. [PubMed: 16466866]
10. Li Z, Sandau CD, Romanoff LC, Caudill SP, Sjodin A, Needham LL, et al. Concentration and profile of 22 urinary polycyclic aromatic hydrocarbon metabolites in the US population. Environ Res. 2008; 107(3):320–31. [PubMed: 18313659]
11. Smith CJ, Huang W, Walcott CJ, Turner W, Grainger J, Patterson DG Jr. Quantification of monohydroxy-PAH metabolites in urine by solid-phase extraction with isotope dilution-GC-MS. Anal Bioanal Chem. 2002; 372(1):216–20. [PubMed: 11939197]
12. Smith CJ, Walcott CJ, Huang W, Maggio V, Grainger J, Patterson DG Jr. Determination of selected monohydroxy metabolites of 2-, 3- and 4-ring polycyclic aromatic hydrocarbons in urine by solid-phase microextraction and isotope dilution gas chromatography-mass spectrometry. J Chromatogr B Analyt Technol Biomed Life Sci. 2002; 778(1–2):157–64.
13. Li Z, Romanoff LC, Trinidad DA, Hussain N, Jones RS, Porter EN, et al. Measurement of urinary monohydroxy polycyclic aromatic hydrocarbons using automated liquid-liquid extraction and gas chromatography/isotope dilution high-resolution mass spectrometry. Anal Chem. 2006; 78(16):5744–51. [PubMed: 16906719]
14. Romanoff LC, Li Z, Young KJ, Blakely NC 3rd, Patterson DG Jr, Sandau CD. Automated solid-phase extraction method for measuring urinary polycyclic aromatic hydrocarbon metabolites in human biomonitoring using isotope-dilution gas chromatography high-resolution mass spectrometry. J Chromatogr B Analyt Technol Biomed Life Sci. 2006; 835(1–2):47–54.
15. Campo L, Rossella F, Fustinoni S. Development of a gas chromatography/mass spectrometry method to quantify several urinary monohydroxy metabolites of polycyclic aromatic hydrocarbons
Wang et al. Page 6
Anal Bioanal Chem. Author manuscript; available in PMC 2017 August 23.
Author M
anuscriptA
uthor Manuscript
Author M
anuscriptA
uthor Manuscript
in occupationally exposed subjects. J Chromatogr B Analyt Technol Biomed Life Sci. 2008; 875(2):531–40.
16. Li Z, Romanoff LC, Trinidad DA, Pittman EN, Hilton D, Hubbard K, et al. Quantification of 21 metabolites of methylnaphthalenes and polycyclic aromatic hydrocarbons in human urine. Anal Bioanal Chem. 2014; 406(13):3119–29. [PubMed: 24714969]
17. Xu X, Zhang J, Zhang L, Liu W, Weisel CP. Selective detection of monohydroxy metabolites of polycyclic aromatic hydrocarbons in urine using liquid chromatography/triple quadrupole tandem mass spectrometry. Rapid Commun Mass Spectrom. 2004; 18(19):2299–308. [PubMed: 15384151]
18. Fan R, Dong Y, Zhang W, Wang Y, Yu Z, Sheng G, et al. Fast simultaneous determination of urinary 1-hydroxypyrene and 3-hydroxybenzo[a]pyrene by liquid chromatography-tandem mass spectrometry. J Chromatogr B Analyt Technol Biomed Life Sci. 2006; 836(1–2):92–7.
19. Pigini D, Cialdella AM, Faranda P, Tranfo G. Comparison between external and internal standard calibration in the validation of an analytical method for 1-hydroxypyrene in human urine by high-performance liquid chromatography/tandem mass spectrometry. Rapid Commun Mass Spectrom. 2006; 20(6):1013–8. [PubMed: 16479558]
20. Onyemauwa F, Rappaport SM, Sobus JR, Gajdosova D, Wu R, Waidyanatha S. Using liquid chromatography-tandem mass spectrometry to quantify monohydroxylated metabolites of polycyclic aromatic hydrocarbons in urine. J Chromatogr B Analyt Technol Biomed Life Sci. 2009; 877(11–12):1117–25.
21. Ramsauer B, Sterz K, Hagedorn HW, Engl J, Scherer G, McEwan M, et al. A liquid chromatography/tandem mass spectrometry (LC-MS/MS) method for the determination of phenolic polycyclic aromatic hydrocarbons (OH-PAH) in urine of non-smokers and smokers. Anal Bioanal Chem. 2011; 399(2):877–89. [PubMed: 21046075]
22. Fan R, Ramage R, Wang D, Zhou J, She J. Determination of ten monohydroxylated polycyclic aromatic hydrocarbons by liquid-liquid extraction and liquid chromatography/tandem mass spectrometry. Talanta. 2012; 93:383–91. [PubMed: 22483926]
23. Zhao G, Chen Y, Wang S, Yu J, Wang X, Xie F, et al. Simultaneous determination of 11 monohydroxylated PAHs in human urine by stir bar sorptive extraction and liquid chromatography/tandem mass spectrometry. Talanta. 2013; 116:822–6. [PubMed: 24148480]
24. Liu M, Zhao S, Wang Z, Wang Y, Liu T, Li S, et al. Identification of metabolites of deoxyschizandrin in rats by UPLC-Q-TOF-MS/MS based on multiple mass defect filter data acquisition and multiple data processing techniques. J Chromatogr B Analyt Technol Biomed Life Sci. 2014; 949–950:115–26.
25. Zhang X, Hou H, Xiong W, Hu Q. Development of a method to detect three monohydroxylated polycyclic aromatic hydrocarbons in human urine by liquid chromatographic tandem mass spectrometry. J Anal Methods Chem. 2015; 2015:514320. [PubMed: 25973283]
26. Lankova D, Urbancova K, Sram RJ, Hajslova J, Pulkrabova J. A novel strategy for the determination of polycyclic aromatic hydrocarbon monohydroxylated metabolites in urine using ultra-high-performance liquid chromatography with tandem mass spectrometry. Anal Bioanal Chem. 2016
27. CDC. 2015. http://www.cdc.gov/exposurereport/Page last updated: February 2015
28. Gustafsson JE, Uzqueda HR. The influence of citrate and phosphate on the Mancini single radial immunodiffusion technique and suggested improvements for the determination of urinary albumin. Clin Chim Acta. 1978; 90(3):249–57. [PubMed: 103661]
29. Caudill SP, Schleicher RL, Pirkle JL. Multi-rule quality control for the age-related eye disease study. Stat Med. 2008; 27(20):4094–106. [PubMed: 18344178]
30. Fiers T, Casetta B, Bernaert B, Vandersypt E, Debock M, Kaufman JM. Development of a highly sensitive method for the quantification of estrone and estradiol in serum by liquid chromatography tandem mass spectrometry without derivatization. J Chromatogr B Analyt Technol Biomed Life Sci. 2012; 893–894:57–62.
31. Schantz MM, Benner BA Jr, Heckert NA, Sander LC, Sharpless KE, Vander Pol SS, et al. Development of urine standard reference materials for metabolites of organic chemicals including
Wang et al. Page 7
Anal Bioanal Chem. Author manuscript; available in PMC 2017 August 23.
Author M
anuscriptA
uthor Manuscript
Author M
anuscriptA
uthor Manuscript
polycyclic aromatic hydrocarbons, phthalates, phenols, parabens, and volatile organic compounds. Anal Bioanal Chem. 2015; 407(11):2945–54. [PubMed: 25651899]
32. CLSI. Evaluation of Precision Performance of Quantitative Measurement Methods; Approved Guideline—Second Edition. 2004. NCCLS document EP5-A2
33. Taylor, J. Quality Assurance of Chemical Measurements. CRC-Press; 1987.
34. Zhou X, Kramer JP, Calafat AM, Ye X. Automated on-line column-switching high performance liquid chromatography isotope dilution tandem mass spectrometry method for the quantification of bisphenol A, bisphenol F, bisphenol S, and 11 other phenols in urine. J Chromatogr B Analyt Technol Biomed Life Sci. 2014; 944:152–6.
Wang et al. Page 8
Anal Bioanal Chem. Author manuscript; available in PMC 2017 August 23.
Author M
anuscriptA
uthor Manuscript
Author M
anuscriptA
uthor Manuscript
Novel aspect
We developed a fully automated and high throughput on-line SPE-HPLC-MS/MS method
for concurrent quantification of nine urinary OH-PAH metabolites.
Wang et al. Page 9
Anal Bioanal Chem. Author manuscript; available in PMC 2017 August 23.
Author M
anuscriptA
uthor Manuscript
Author M
anuscriptA
uthor Manuscript
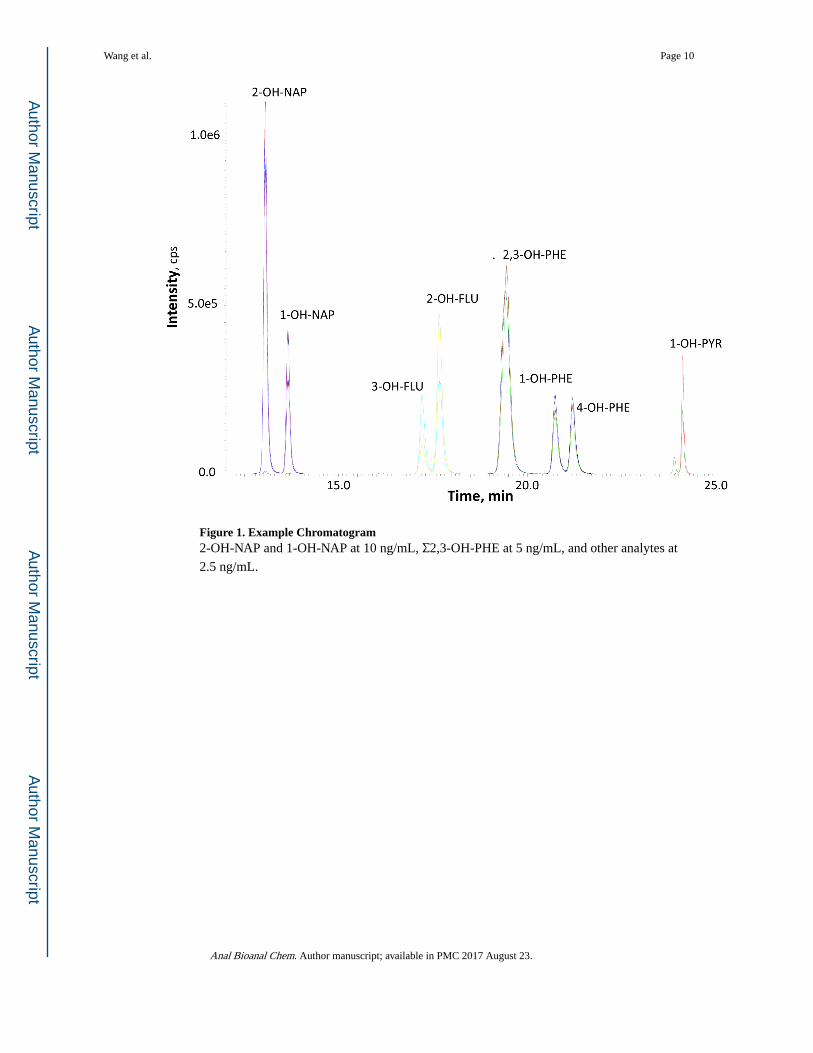
Figure 1. Example Chromatogram2-OH-NAP and 1-OH-NAP at 10 ng/mL, Σ2,3-OH-PHE at 5 ng/mL, and other analytes at
2.5 ng/mL.
Wang et al. Page 10
Anal Bioanal Chem. Author manuscript; available in PMC 2017 August 23.
Author M
anuscriptA
uthor Manuscript
Author M
anuscriptA
uthor Manuscript
Author M
anuscriptA
uthor Manuscript
Author M
anuscriptA
uthor Manuscript
Wang et al. Page 11
Tab
le 1
Opt
imiz
ed M
S pa
ram
eter
s fo
r ni
ne h
ydro
xyla
ted
PAH
met
abol
ites.
No.
Ana
lyte
Abb
revi
atio
nIo
n T
rans
itio
n (m
/z)
IS I
on T
rans
itio
n (m
/z)
Col
lisio
n E
nerg
y (e
V)
Par
ent
PAH
11-
hydr
oxyn
apht
hale
ne1-
OH
-NA
P14
3→11
514
9→12
1−
34N
apht
hale
ne2
2-hy
drox
ynap
htha
lene
2-O
H-N
AP
143→
115
149→
121
−34
32-
hydr
oxyf
luor
ene
2-O
H-F
LU
181→
180
187→
186
−34
Fluo
rene
43-
hydr
oxyf
luor
ene
3-O
H-F
LU
181→
180
187→
186
−26
51-
hydr
oxyp
hena
nthr
ene
1-O
H-P
HE
193→
165
197→
168
−38
Phen
anth
rene
62-
hydr
oxyp
hena
nthr
ene
Σ2,3
-OH
-PH
E*
193→
165
199→
171
−41
73-
hydr
oxyp
hena
nthr
ene
84-
hydr
oxyp
hena
nthr
ene
4-O
H-P
HE
193→
165
197→
168
−38
91-
hydr
oxyp
yren
e1-
OH
-PY
R21
7→18
922
3→19
5−
45Py
rene
* 2-O
H-P
HE
and
3-O
H-P
HE
are
mea
sure
d to
geth
er.
Anal Bioanal Chem. Author manuscript; available in PMC 2017 August 23.
Author M
anuscriptA
uthor Manuscript
Author M
anuscriptA
uthor Manuscript
Wang et al. Page 12
Table 2
Optimized LC gradient.
Flow Rate (μL/min) A% B% Time (min)
500 99 1 0.0
500 99 1 3.5
500 40 60 3.9
500 40 60 4.3
800 38 62 5.0
800 32 68 18.0
800 30 70 19.5
1000 15 85 20.0
1000 14 86 21.0
1000 10 90 22.0
1000 5 95 24.0
1000 5 95 24.5
1000 99 1 24.6
1000 99 1 27.0
*A: HPLC grade water with 0.1 mM ammonium fluoride, B: HPLC grade methanol with 0.1 mM ammonium fluoride.
Anal Bioanal Chem. Author manuscript; available in PMC 2017 August 23.

Author M
anuscriptA
uthor Manuscript
Author M
anuscriptA
uthor Manuscript
Wang et al. Page 13
Tab
le 3
Acc
urac
y fo
r th
e m
easu
rem
ent o
f hy
drox
ylat
ed P
AH
met
abol
ites.
Ana
lyte
Lev
el -
1 (n
=7)
Lev
el -
2 (n
=7)
Lev
el -
3 (n
=7)
SRM
367
2 Sm
oker
uri
ne (
n=4)
SRM
367
3 no
n-Sm
oker
uri
ne (
n=4)
Spik
ed (
ng/m
L)
Acc
urac
ySp
iked
(ng
/mL
)A
ccur
acy
Spik
ed (
ng/m
L)
Acc
urac
yM
easu
red
(ng/
mL
)N
IST
Cer
tifi
ed (
ng/m
L)
Acc
urac
yM
easu
red
(ng/
mL
)N
IST
Cer
tifi
ed (
ng/m
L)
Acc
urac
y
2-O
H-N
AP
0.71
112.
8±4.
3%3.
8599
.7±
1.6%
19.2
399
.7±
0.8%
8.88
±0.
178.
7310
1.7±
2.0%
1.43
±0.
071.
3510
6.3±
4.8%
1-O
H-N
AP
0.70
113.
3±1.
9%3.
8395
.3±
1.2%
19.1
398
.7±
1.2%
36.8
5±0.
6834
.410
7.7±
2.7%
207.
38±
3.94
211.
0098
.3±
1.87
%
3-O
H-F
LU
0.17
107.
2±4.
2%0.
9198
.6±
2.6%
4.57
98.1
±2.
0%0.
41±
0.02
0.43
96.8
±4.
7%0.
04±
0.01
0.04
112.
0±25
.6%
2-O
H-F
LU
0.18
107.
4±2.
3%0.
9699
.3±
1.3%
4.78
100.
3±1.
4%0.
72±
0.04
0.87
82.8
±4.
6%0.
09±
0.01
0.11
83.7
±9.
3%
Σ2,3
-OH
-PH
E0.
3611
3.1±
1.8%
1.94
99.4
±1.
8%9.
6810
1.9±
1.2%
0.20
±0.
020.
2196
.1±
9.6%
0.05
±0.
010.
0510
3.0±
18.9
%
1-O
H-P
HE
0.18
109.
8±2.
8%0.
9599
.4±
2.8%
4.75
101.
2±2.
4%0.
11±
0.01
0.14
84.3
±7.
4%0.
05±
0.01
0.05
98.4
±20
.4%
4-O
H-P
HE
0.17
108.
5±3.
2%0.
9498
.3±
3.2%
4.7
98.2
±1.
2%0.
05±
0.01
0.05
94.2
±20
.4%
*0.
01*
*
1-O
H-P
YR
0.18
105.
5±5.
0%0.
9793
.6±
2.6%
4.86
101.
8±2.
6%0.
18±
0.02
0.17
102.
2±11
.6%
*0.
03*
*
* Res
ults
not
rep
orte
d be
caus
e N
IST
cer
tifie
d va
lues
are
clo
se o
r be
low
the
met
hod
LO
D f
or th
ese
anal
ytes
.
Anal Bioanal Chem. Author manuscript; available in PMC 2017 August 23.
Author M
anuscriptA
uthor Manuscript
Author M
anuscriptA
uthor Manuscript
Wang et al. Page 14
Tab
le 4
Prec
isio
n, li
mits
of
dete
ctio
n (L
OD
s), a
nd u
pper
line
arity
lim
its.
Ana
lyte
sQ
CH
*Q
CL
*L
OD
(ng
/mL
)U
pper
line
arit
y lim
it (
ng/m
L)
Mea
n (n
g/m
L)
Wit
hin-
run
prec
isio
n (C
V%
)M
etho
d pr
ecis
ion
(CV
%)
Mea
n (n
g/m
L)
Wit
hin-
run
prec
isio
n (C
V%
)M
etho
d pr
ecis
ion
(CV
%)
1-O
H-N
AP
7.78
3.3%
4.8%
1.22
5.9%
7.4%
0.06
200
2-O
H-N
AP
8.94
3.2%
5.7%
1.54
4.4%
6.2%
0.09
200
2-O
H-F
LU
1.06
3.8%
5.4%
0.25
4.3%
5.7%
0.00
825
3-O
H-F
LU
1.14
3.3%
4.8%
0.28
4.2%
5.1%
0.00
810
1-O
H-P
HE
0.68
7.2%
8.0%
0.17
8.6%
9.7%
0.00
910
Σ2,3
-OH
-PH
E1.
366.
5%7.
9%0.
367.
1%8.
2%0.
0120
4-O
H-P
HE
0.54
7.0%
10.5
%0.
139.
5%12
.6%
0.00
710
1-O
H-P
YR
0.79
12.1
%12
.4%
0.40
11.4
%13
.0%
0.07
10
* QC
H: Q
C h
igh;
QC
L: Q
C lo
w.
Anal Bioanal Chem. Author manuscript; available in PMC 2017 August 23.
Author M
anuscriptA
uthor Manuscript
Author M
anuscriptA
uthor Manuscript
Wang et al. Page 15
Tab
le 5
Geo
met
ric
mea
n (G
M)
and
sele
ct p
erce
ntile
con
cent
ratio
ns (
ng/m
L)
of O
H-P
AH
s in
36
nons
mok
ers
and
36 s
mok
ers.
Ana
lyte
Non
Smok
er (
n=36
)Sm
oker
(n=
36)
Smok
er G
M /
Non
smok
er G
MG
M25
th50
th75
thG
M25
th50
th75
th
2-O
H-N
AP
1.97
1.09
1.90
4.56
11.2
45.
9110
.44
21.7
95.
72
1-O
H-N
AP
0.57
0.39
0.57
0.88
6.81
3.19
8.06
15.5
312
.00
3-O
H-F
LU
0.04
0.02
0.04
0.06
0.46
0.20
0.46
1.35
12.3
7
2-O
H-F
LU
0.09
0.04
0.08
0.15
0.76
0.38
0.82
1.84
8.53
Σ2,3
-OH
-PH
E0.
080.
050.
080.
120.
330.
200.
320.
644.
31
1-O
H-P
HE
0.05
0.03
0.05
0.08
0.13
0.06
0.11
0.33
2.49
4-O
H-P
HE
0.01
0.01
0.01
0.02
0.03
0.02
0.04
0.07
2.82
1-O
H-P
YR
0.08
0.06
0.08
0.12
0.38
0.17
0.38
0.99
4.75
Anal Bioanal Chem. Author manuscript; available in PMC 2017 August 23.