Extraction Based Thermodynamic Balancing for a ...
54
1 Extraction Based Thermodynamic Balancing for a Humidification Dehumidification Desalination Plant. by Victor Nevarez Submitted to the Department of Mechanical Engineering in Partial Fulfillment of the requirements for the Degree of Bachelor of Science In Mechanical Engineering at the Massachusetts Institute of Technology June 2012 © 2012 Massachusetts Institute of Technology All rights reserved The author hereby grants MIT permission to reproduce and to distribute publicly paper and electronic copies of this thesis document in whole or in part in any medium now know or hereafter created. Signature of Author............................................................................................................................ Department of Mechanical Engineering May 22 2012 Certified by........................................................................................................................................ John H. Lienhard V Samuel C. Collins Professor of Mechanical Engineering Thesis Supervisor Accepted by....................................................................................................................................... John H. Lienhard V Samuel C. Collins Professor of Mechanical Engineering Chairman, Undergraduate Thesis Committee
Transcript of Extraction Based Thermodynamic Balancing for a ...
1
Extraction Based Thermodynamic Balancing for a Humidification Dehumidification Desalination Plant.
by
Victor Nevarez
Submitted to the Department of Mechanical Engineering
in Partial Fulfillment of the requirements for the Degree of
Bachelor of Science In Mechanical Engineering
at the
Massachusetts Institute of Technology
June 2012
© 2012 Massachusetts Institute of Technology All rights reserved
The author hereby grants MIT permission to reproduce and to distribute publicly paper and electronic copies of this thesis document in whole or in part in any medium now know or
hereafter created.
Signature of Author............................................................................................................................ Department of Mechanical Engineering
May 22 2012
Certified by........................................................................................................................................ John H. Lienhard V
Samuel C. Collins Professor of Mechanical Engineering Thesis Supervisor
Accepted by....................................................................................................................................... John H. Lienhard V
Samuel C. Collins Professor of Mechanical Engineering Chairman, Undergraduate Thesis Committee

2
Extraction Based Thermodynamic Balancing
for a Humidification Dehumidification Desalination Plant.
by
Victor Nevarez
Submitted to the Department of Mechanical Engineering on May 22, 2012, in Partial Fulfillment of the requirements for the Degree of
Bachelor of Science in Mechanical Engineering
Abstract
Humidification dehumidification (HDH) desalination is a thermal driven desalination technology. One of the main issues with HDH desalination is the high energy consumption involved. The energy efficiency of thermal desalination systems is given by a non-dimensional number known as the gained output ratio (GOR) which is a ratio of the latent heat of evaporation of the water produced to the net heat input. In Lienhard Research Group at MIT, a particular method of increasing GOR has been invented. This method involves matching the heat capacity ratio (HCR) of the flows exchanging heat and mass to approach unity. Specifically, based on theoretical studies done previously in the group, it had been proposed that mass extraction of air from the humidification device to the dehumidification device changes the HCR favorably. This thesis looks to show the same experimentally. By making adjustments of the HCR in different parts of the process it is possible to increase the GOR substantially. In the current study it has been shown that the GOR is increased from 2.4 to 3.1 for a specific set of boundary conditions. All mass extraction cases found an improved GOR value, confirming that this process reduces the total system irreversibility.
Thesis Supervisor: John H. Lienhard V Title: Samuel C. Collins Professor of Mechanical Engineering
3
Acknowledgments Completing this project was a very difficult and painstaking process. There was many
times where it just did not seem like we would be able to finish. I would like to thank and
acknowledge everyone that helped to complete this project.
I would like to thank the Rohsenow Kendall Heat and Mass Transfer Laboratory (RKL),
lead by Professor John H. Lienhard V, for allowing me to use their resources and giving me an
opportunity to work on such a difficult and great project. I would like to thank the whole lab for
putting up with the constant leaks and for putting up with the amount of space our large setup
would take.
I would personally like to thank Prakash Narayan Govindan for always being available
and for the countless times that he was there to help out. There where countless times where
something went wrong and he was always there to pick up the slack. Thank you for always being
flexible and working around our schedules and also making sure that we would stay on task.
Thanks you for all of your involvement and for giving me the opportunity to work on this
project. I would also like to thank Gregory P Thiel for helping out with the instrumentation and
for also helping out with the dehumidifiers. Professor Lienhard, Thank you for giving me the
opportunity to work under this project and for being patient with us during all of our issues.
My greatest appreciation goes out to Maximus St. John, without him I would have never
found this project. Thank you for always being able to cover me whenever I was late or I was not
able to make it. Thank you for being so easy to work with and for always being available.
Without Max we would have never been able to finish this project. Most of all, thank you Max

4
for always making working with you enjoyable, it is safe to say that the whole project would
have been much less enjoyable without your company.
This project has really pushed me as an engineer and has also prepared me for the new
challenges I will have to face.
5
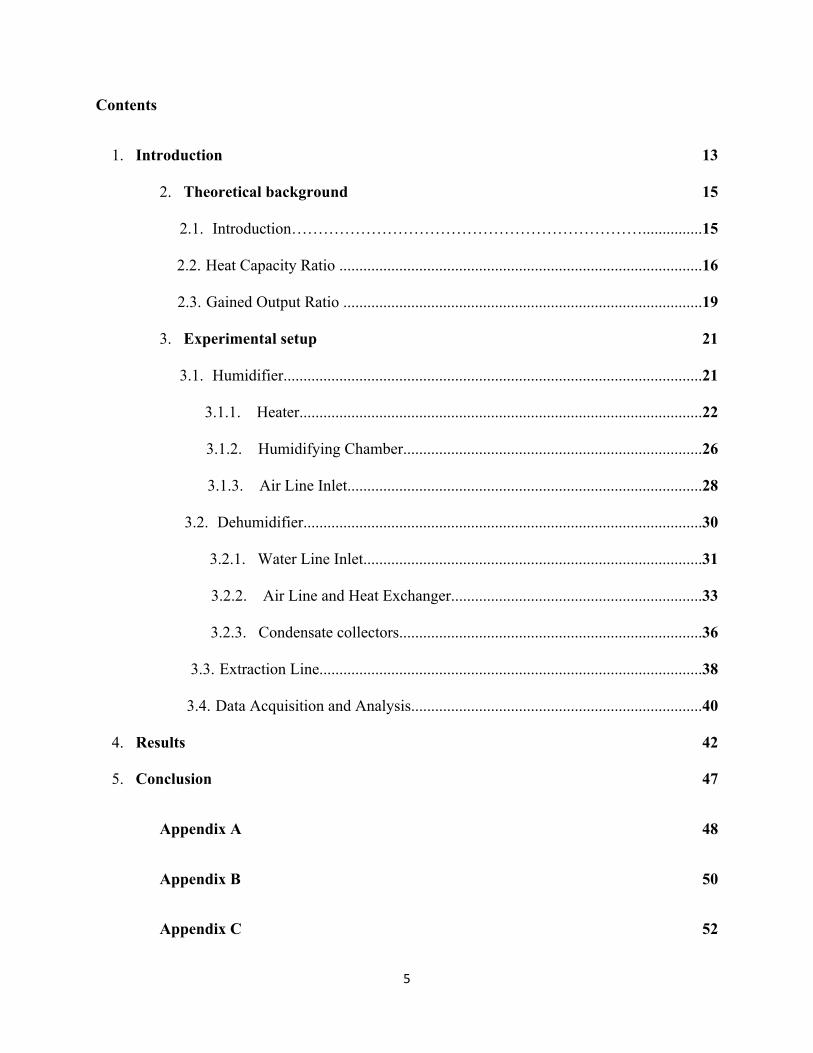
Contents
1. Introduction 13
2. Theoretical background 15
2.1. Introduction…………………………………………………………...............15
2.2. Heat Capacity Ratio ...........................................................................................16
2.3. Gained Output Ratio ..........................................................................................19
3. Experimental setup 21
3.1. Humidifier.........................................................................................................21
3.1.1. Heater.....................................................................................................22
3.1.2. Humidifying Chamber...........................................................................26
3.1.3. Air Line Inlet.........................................................................................28
3.2. Dehumidifier....................................................................................................30
3.2.1. Water Line Inlet.....................................................................................31
3.2.2. Air Line and Heat Exchanger...............................................................33
3.2.3. Condensate collectors............................................................................36
3.3. Extraction Line................................................................................................38
3.4. Data Acquisition and Analysis.........................................................................40
4. Results 42
5. Conclusion 47
Appendix A 48
Appendix B 50
Appendix C 52

6
6. References 54

7
List of Figures
1-1 Schematic diagram of system under study..............................................................................14
2-1 Temperature profile representing the HDH system without extraction..................................17
2-2 Temperature profile representing the HDH system with single extraction.............................19
3-1 Highlighted by the red box is the part of the process we will be analyzing............................21
3-2 Rheem Tankless 13 kW Electric Water Heater.......................................................................23
3-3 240VAC and 60A plug and receptacle....................................................................................24
3-4 Omega FL46300 in-line flow meter series..............................................................................25
3-5 Humidifying chamber without insulation................................................................................26
3-6 All of the components leading to the air inlet.........................................................................28
3-7 Omega in-line air flow meter...................................................................................................29
3-8 Frequency drivers and components involved..........................................................................29
3-9 Dehumidifier location..............................................................................................................30
3-10 Water tank with water supply for the system........................................................................31
3-11 Drain chamber and pump......................................................................................................32

8
3-12 Weg pump and valve to control the flow rate.......................................................................32
3-13 Insulated system....................................................................................................................33
3-14 Tube and plate counter flow exchanger.................................................................................34
3-15 Condensate collector angled downward towards tub………………………........................36
3-16 Extraction line location..........................................................................................................38
3-17 King in-line air flow meter....................................................................................................39
3-18 extraction line with blower in air flow meter........................................................................40
3-19 Agilent 34970A data acquisition...........................................................................................41
4-1 Baseline temperature values and calculated parameters………………………......................43
4-2 Comparison of 𝐻𝐶𝑅!!"values to the respective GOR values……………………......…......45
4-3 Peaking trend of GOR to the air extraction ratio to total air flow ratio...................................46
A-1 Humidifier fully dimensioned…………………………………………...…………………49
B-1 Geometry of Spray…………………………………………………………………………..50

9
C-1 Top view of the dimensioned dehumidifier………………………………..……………..…52
C-2 Side view of the dimensioned dehumidifier……………………………….……………..…53
10
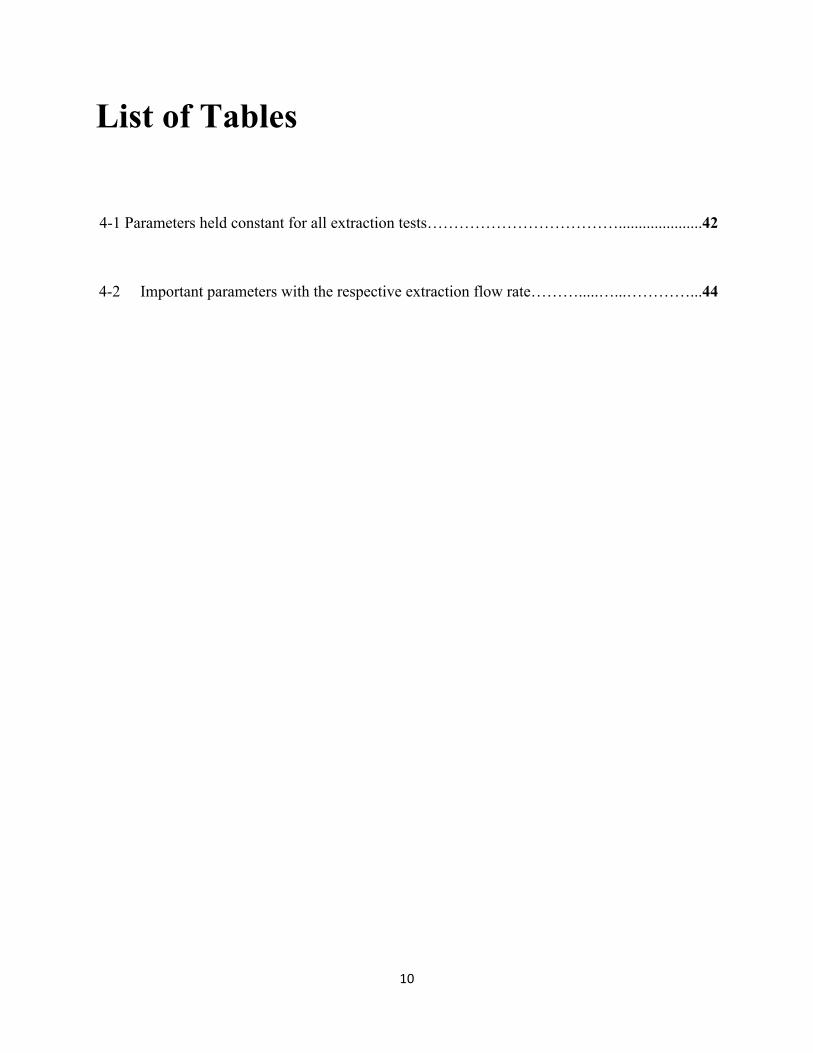
List of Tables
4-1 Parameters held constant for all extraction tests……………………………….....................42
4-2 Important parameters with the respective extraction flow rate……….....…...…………...44
11
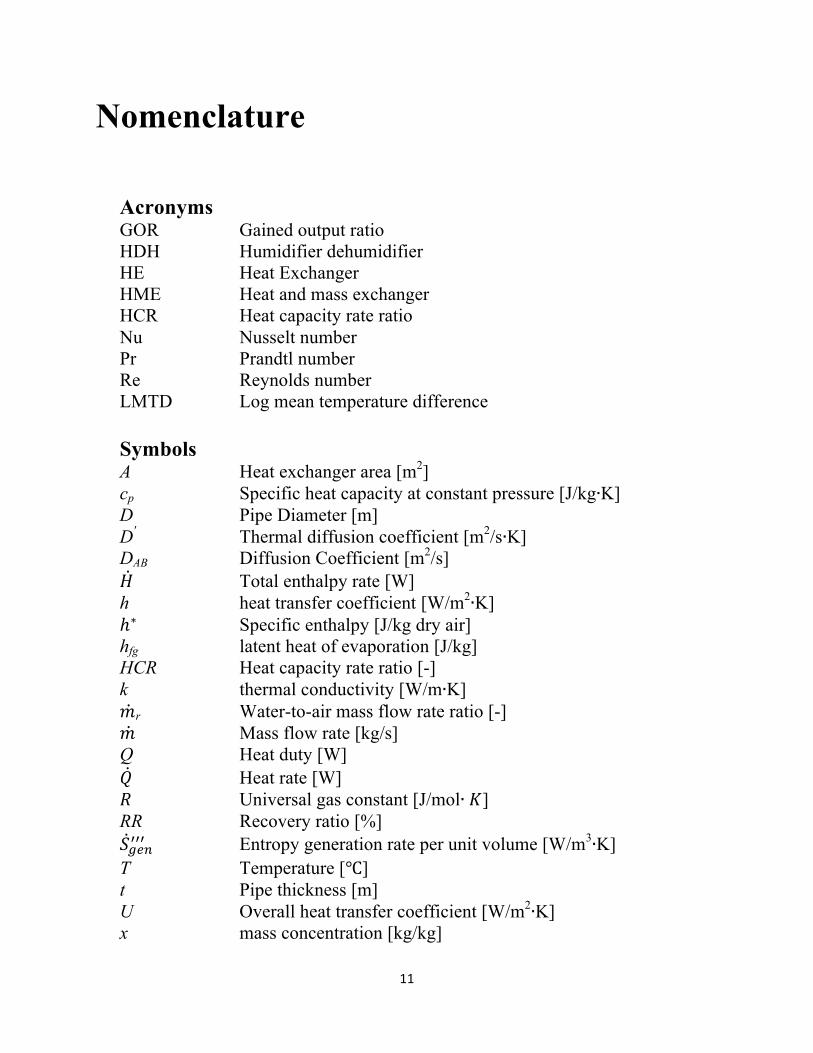
Nomenclature
Acronyms GOR Gained output ratio HDH Humidifier dehumidifier HE Heat Exchanger HME Heat and mass exchanger HCR Heat capacity rate ratio Nu Nusselt number Pr Prandtl number Re Reynolds number LMTD Log mean temperature difference Symbols A Heat exchanger area [m2] cp Specific heat capacity at constant pressure [J/kg∙K] D Pipe Diameter [m] D' Thermal diffusion coefficient [m2/s∙K] DAB Diffusion Coefficient [m2/s] 𝐻 Total enthalpy rate [W] h heat transfer coefficient [W/m2∙K] ℎ∗ Specific enthalpy [J/kg dry air] hfg latent heat of evaporation [J/kg] HCR Heat capacity rate ratio [-] k thermal conductivity [W/m∙K] 𝑚r Water-to-air mass flow rate ratio [-] 𝑚 Mass flow rate [kg/s] Q Heat duty [W] 𝑄 Heat rate [W] 𝑅 Universal gas constant [J/mol∙ 𝐾] RR Recovery ratio [%] 𝑆!"#!!! Entropy generation rate per unit volume [W/m3∙K] T Temperature [℃] t Pipe thickness [m] U Overall heat transfer coefficient [W/m2∙K] x mass concentration [kg/kg]

12
Greek Δ Difference or change µ Viscosity [kg/m∙s] ψ enthalpy pinch [kJ/kg of dry air] ρ Density [kg/m3] Subscripts a Humid air c Cold Stream da Dry air e Extraction h Hot stream hum Humidifier in In max maximum pw Pure water w water Thermodynamic states T6 Seawater entering the dehumidifier T10 Preheated seawater leaving the dehumidifier T11 Seawater entering the humidifier after the brine heater T12 Brine reject leaving the humidifier T2 Moist air entering the dehumidifier T14 Most air state at which mass extraction is carried out T1 Relatively dry air entering the humidifier T3,4,5,13 Air at arbitrary intermediate location in the dehumidifier T7,8,9 Seawater at an arbitrary intermediate location in the dehumidifier
13
1. Introduction
As the human population continues to increase so does the demand for fresh water and
with sources of fresh water being slowly depleted, desalination technologies have grown in
demand. With cost and time in mind, fresh water research has looked into various desalination
techniques. This thesis is focused on humidification dehumidification desalination (HDH).
The most common example of an HDH system is the natural production of rain. Ocean
water is heated up by the radiation emitted from the sun and rises up to the air as a carrier gas,
which is the humidifier part of the system. After enough water accumulates in the air it will
condense, and rain will form, and fresh water is produced, the dehumidifier side of the system.
Although this system may seem ideal the natural process is largely inefficient. In the system that
we have constructed as part of this study there is a large humidification chamber, four
dehumidifiers, and a brine heater to heat the seawater stream. In order to improve the efficiency
of this system we will focus on the minimization of entropy generation in the system. This paper
will focus on the use of mass extraction and injection to assist in the minimization of entropy
generation. This paper is built off of theoretical work done by the Lienhard Research Group on
mass extractions [1], which will explore in Section 2 in further detail.
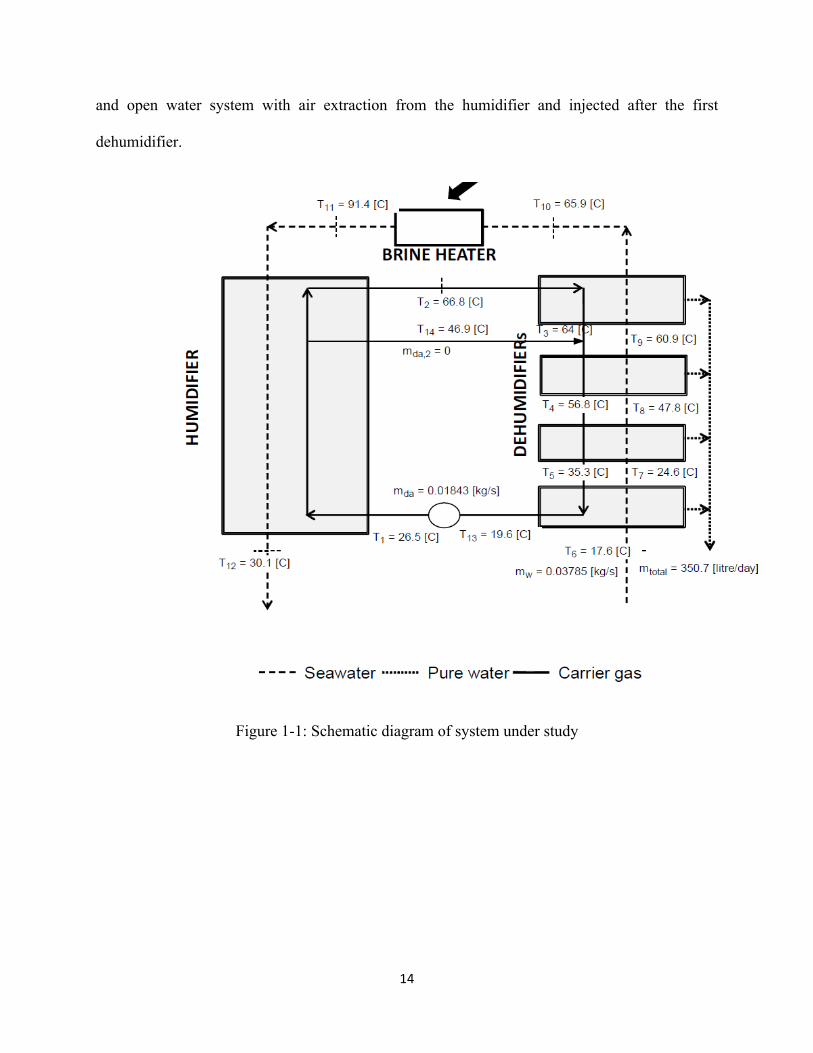
In this study we are going to draw upon optimized parameters to focus on the effects of
mass extraction. Shown below in Fig. 1-1 is the schematic diagram of the system with mass
extraction and injection at our baseline level. In Section 3 we are going to go into the
development and instrumentation of each component. The system is a water heated, closed air,
14
and open water system with air extraction from the humidifier and injected after the first
dehumidifier.
Figure 1-1: Schematic diagram of system under study
15
2. Theoretical Background
2.1 Introduction
An important factor in the HDH processes is the entropy generation and multiple studies
have been done to try to minimize the amount produced [1]. Decreasing the amount of entropy
generation will increase the efficiency of the system, which are measured in terms of the gained-
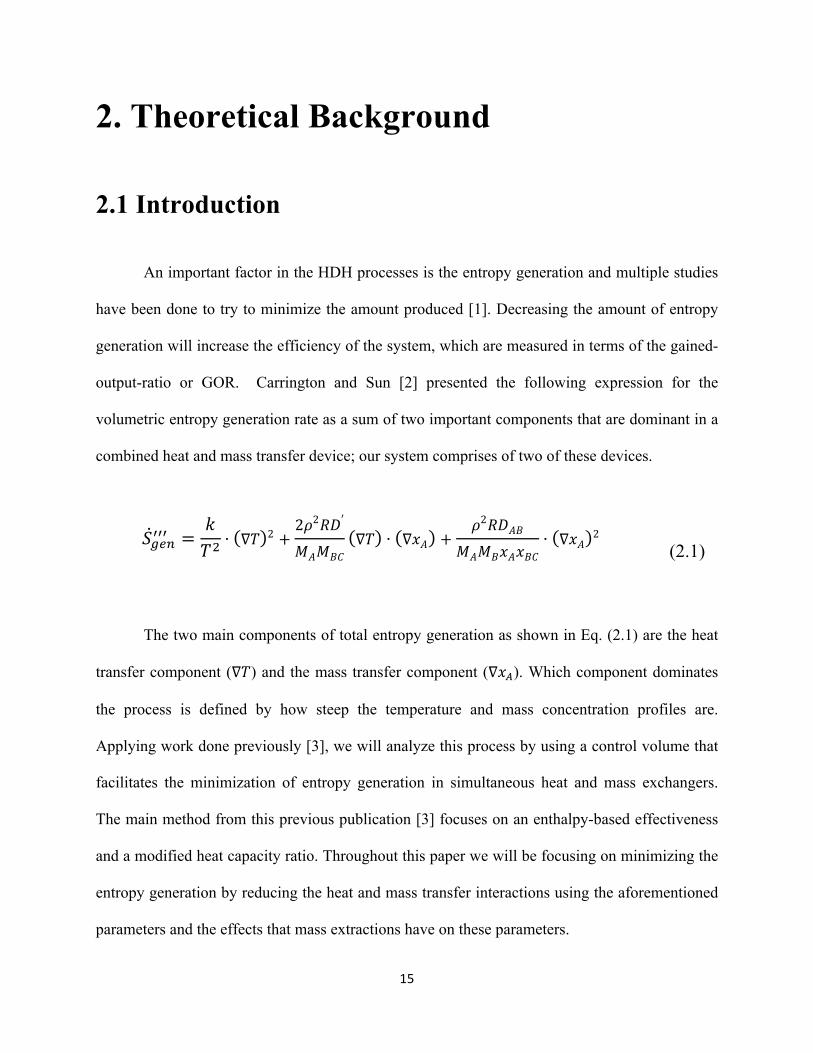
output-ratio or GOR. Carrington and Sun [2] presented the following expression for the
volumetric entropy generation rate as a sum of two important components that are dominant in a
combined heat and mass transfer device; our system comprises of two of these devices.
𝑆!"#!!! =
𝑘𝑇!
∙ ∇𝑇 2 +2𝜌2𝑅𝐷′
𝑀𝐴𝑀𝐵𝐶∇𝑇 ∙ ∇𝑥𝐴 +
𝜌2𝑅𝐷𝐴𝐵𝑀𝐴𝑀𝐵𝑥𝐴𝑥𝐵𝐶
∙ ∇𝑥𝐴 2
(2.1)
The two main components of total entropy generation as shown in Eq. (2.1) are the heat
transfer component (∇𝑇) and the mass transfer component (∇𝑥!). Which component dominates
the process is defined by how steep the temperature and mass concentration profiles are.
Applying work done previously [3], we will analyze this process by using a control volume that
facilitates the minimization of entropy generation in simultaneous heat and mass exchangers.
The main method from this previous publication [3] focuses on an enthalpy-based effectiveness
and a modified heat capacity ratio. Throughout this paper we will be focusing on minimizing the
entropy generation by reducing the heat and mass transfer interactions using the aforementioned
parameters and the effects that mass extractions have on these parameters.

16
2.2 Modified heat capacity ratio
In both the humidifier and the dehumidifier we have a cold stream interacting with a hot
stream. Whenever there is a thermal imbalance in the heat and mass exchangers (HME) there
will be entropy generated in the process over and above the entropy generated due to a finite heat
exchanger. This is related to the fact that the heat capacity rate of the interacting streams is not
equal [4] and is known as the "remnant irreversibility". In [3] it is found that the system is
balanced by achieving a HCR of one for an HME, modeled after the thermal balancing of a heat
exchanger (HE). To make this model work a modified HCR was created to fit the HE model. For
this to work the HCR is the total change of ideal enthalpy rate of the cold stream to that of the
hot stream.
𝐻𝐶𝑅 =
∆𝐻!"#,!∆𝐻!"#,!
(2.2)
The energy effectiveness and the modified HCR model works for an HME device that
does not have any mass extractions or injections. To account for the mass extractions and
injections we use the fact that the loss in enthalpy rates (𝛹! where 𝑥 = ℎ or 𝑐), or enthalpy pinch,
is a loss that we cannot reduce by thermal balancing. Shown in Fig. 2-1 is an example of the
temperature profile in the HDH system. The wide variation in the stream-to-stream temperature
difference in the humidifier and the dehumidifier may clearly be observed from the figure below.

17
Figure 2-1: Temperature profile representing the HDH system without extraction [1]
To do this we use the work from [1] to model the total change of enthalpy using these
"finite -sized" HME devices.
∆𝐻!"#,! = ∆ℎ∗ + 𝛹𝑥
(2.3)
𝐻𝐶𝑅 =
∆ℎ∗ + 𝛹𝑐
∆ℎ∗ + 𝛹ℎ
∆ℎ∗ =∆𝐻𝑚𝑑𝑎
(2.4)
(2.5)
18
From Eq. (2.3) we use the fact that ∆𝐻!"#,! is the total heat rate and we can obtain a
heat capacity value by dividing the total heat rate with the respective mass flow rate, which is
identical for the hot and cold cases. From Eq. (2.4) it is clear that the only way to achieve a
balanced condition (HCR=1) is for the loss in enthalpy rates to be equal and constant at all points
along the HME device (𝛹! = 𝛹!). With mass extraction it is possible to vary the slope of the
water line such that the HCR can better approach unity. It is proposed that this can be achieved
by varying the air-to-water mass flow ratio. In this study we will only focus on a single air
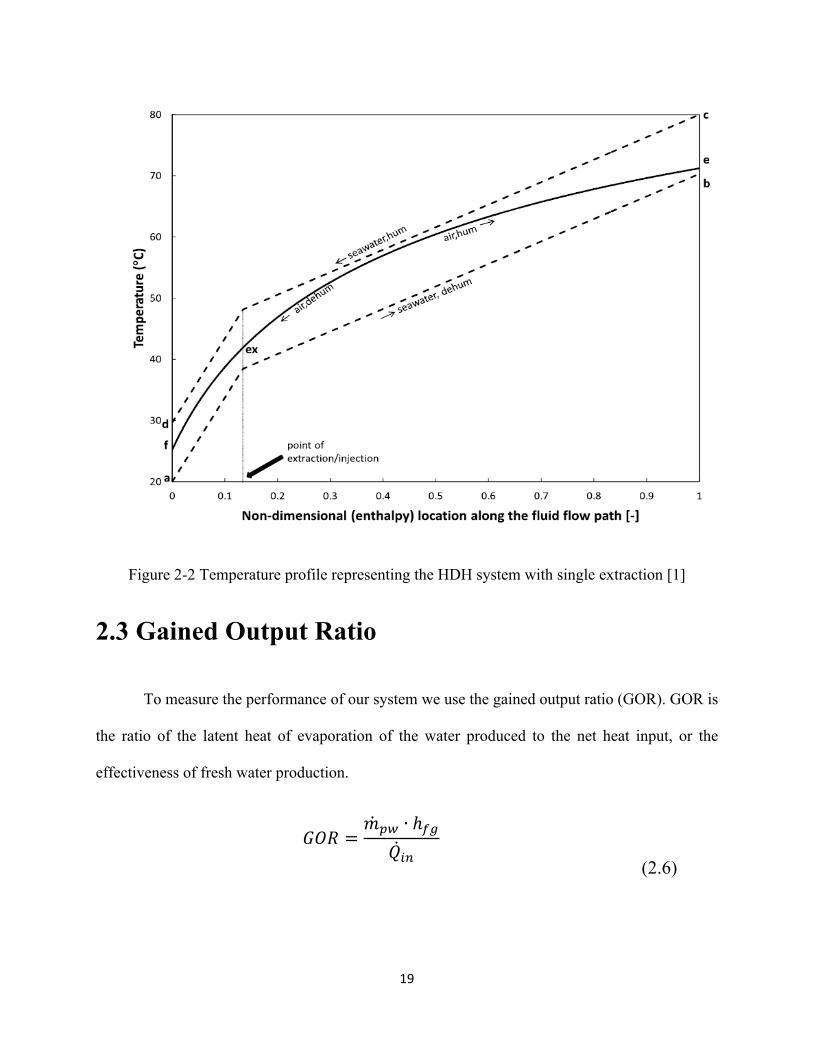
extraction from the humidifier. In Fig. 2-2 we can see what the enthalpy pinch points look like
for a single extraction process and notice that the stream-to-stream differences is smaller than in
Fig. 2-1 and that there are two temperature pinches in the humidifier as oppose to one in the zero
extraction case.
19
Figure 2-2 Temperature profile representing the HDH system with single extraction [1]
2.3 Gained Output Ratio
To measure the performance of our system we use the gained output ratio (GOR). GOR is
the ratio of the latent heat of evaporation of the water produced to the net heat input, or the
effectiveness of fresh water production.
𝐺𝑂𝑅 =
𝑚!" ∙ ℎ!"𝑄!"
(2.6)

20
With mass extraction and injection we will see an increase in GOR through our ability to adjust
the temperature profile of the seawater in the humidifier to the temperature profile of air.
Another important ratio we will be comparing is the Recovery Ratio (RR), which is the amount
of desalinated water per input.
𝑅𝑅 =𝑚!"
𝑚!
(2.7)

21
3. Experimental Setup 3.1 Humidifier
Shown below in Fig. 3-1 we will focus on the instrumentation and materials involved
with this part of the process. We will start with the brine heater move on to the humidifying
chamber, and then look into the blower for the air inlet.
Figure 3-1: Highlighted by the red box is the part of the process we will be analyzing
22
3.1.1 Heater
The first part of the outlined section we will focus on is the heater. The first thing to note
is that the water entering the heater will be preheated through the heat and mass exchange with
the air line. Typically the feed water is preheated to about 65℃. For our extraction based focus
we set the inlet temperature at the humidifier to be 90℃. To determine the type of heater
necessary we use the first law, assuming steady state and the work done on the water to be
negligible.
𝑄 = 𝑚! ∙ 𝑐!" ∙ ∆𝑇
(3.1)
With 𝑚! = 0.5 𝑔𝑝𝑚 = 1.89𝐿𝑝𝑚, ∆𝑇~25℃, and 𝑐!" = 4.1813 J/g∙ 𝐾 , we find the
power needed to be about 𝑄~ 3 kW but this is at steady state and with the preheated water. In
order to decrease the amount time to reach steady state and to have flexibility with the heater we
went with a heater capable of producing 13kW of power. The heater, shown below in Fig. 3-2, is
a Rheem Tankless Electric Water Heater rated for 13 kW demanding an input voltage of 240
VAC and a maximum current of 54 A.

23
Figure 3-2: Rheem Tankless 13 kW Electric Water Heater
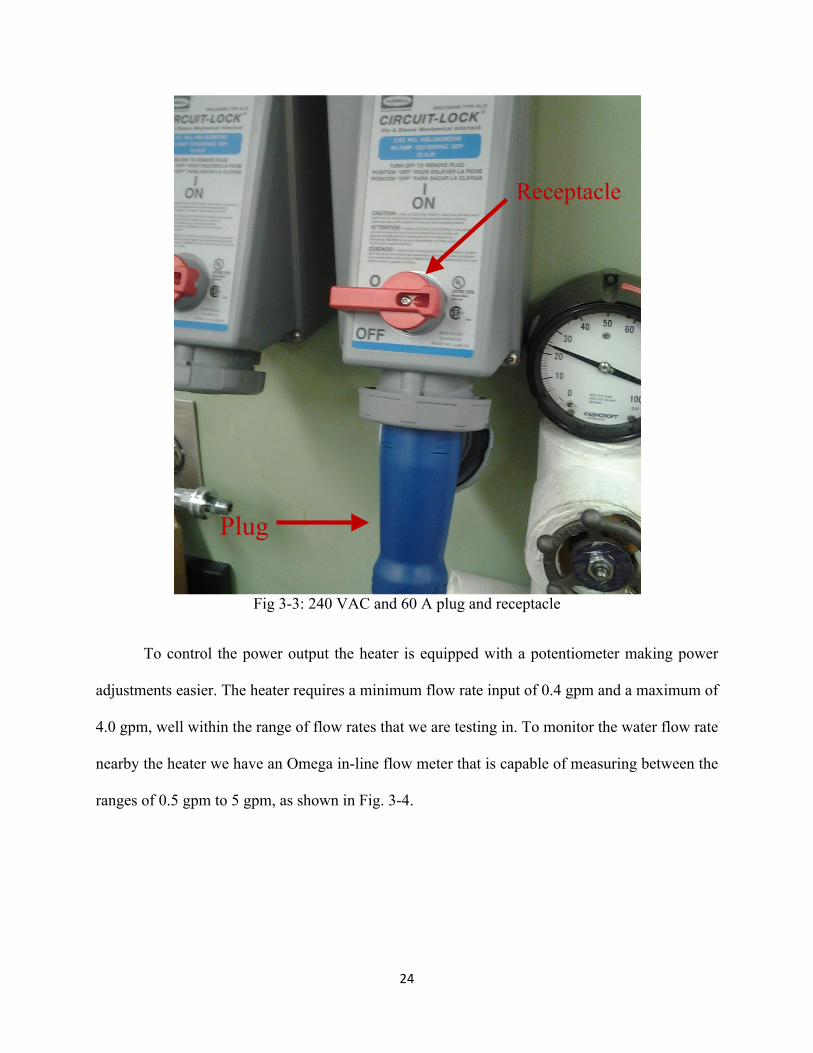
In order to supply this electric power we used an outlet and plug capable of supplying and
handling 60 A. Shown in Fig. 3-3 is the plug and outlet used to achieve this power rating.
Heater
Adjustable temperature knob
24
Fig 3-3: 240 VAC and 60 A plug and receptacle
To control the power output the heater is equipped with a potentiometer making power
adjustments easier. The heater requires a minimum flow rate input of 0.4 gpm and a maximum of
4.0 gpm, well within the range of flow rates that we are testing in. To monitor the water flow rate
nearby the heater we have an Omega in-line flow meter that is capable of measuring between the
ranges of 0.5 gpm to 5 gpm, as shown in Fig. 3-4.
Plug
Receptacle

25
Figure 3-4: Omega FL46300 in-line flow meter series
To monitor the temperature before after the heater we have an omega probe
thermocouple sized for 0.25 inch pipe set right before the inlet of the humidifier and after the
outlet of the dehumidifier. These types of thermocouples are used for all water temperature
measurements. The thermocouples for this part of the process are shown in Fig. 3-1 at T10 and
T11 respectively. With the hoses being well insulated and the location of the thermocouple after
the heater being near the humidifier there is little heat loss involved during this part of the
process.

26
3.1.2 Humidifying Chamber
For a fully dimensioned model of the humidifier see Appendix A. We will now focus on
this part of the process including the drain line out of the humidifier. The humidifying chamber
was built large enough to be able to vary fill packing's for maximum performance. These fill
packing's, shown in Fig. 3-5, increase the surface area of contact for the fluid to fall on.
Figure 3-5: Humidifying chamber without insulation
Fill Packing

27
This increases the interaction with the fluid and the air allowing the air to acquire more vapor
content to carrier out of the humidifying chamber. With not enough fills there will not be enough
mixture between the air and the water. For our experimental setup we will use the data taken
from [5] to optimize the fill size to control the extraction temperature.
Our sprayer assembly is designed such that at the maximum testing water flow rate, 1.25
gpm, the spraying profile reaches the edge of the top fill. If the spraying profile reaches the sides
of the humidifier then there will be less content for the air to mix with the air since it is all
located in a single part of the geometry. To achieve this we used a sprayer capable of spraying a
rectangular profile and matched the height of the sprayer with the fill for the max flow rate. To
see calculations determining sprayer height see Appendix B.
Directly above the sprayer is the air outlet, which is covered with a demister to prevent
the air carrying large water droplets instead of vapor content. An issue found with our choice of
sprayer is that the water droplets are too large and some are being carried up to the top of the
humidifying chamber. This phenomenon is noted because of the droplet formation on the ceiling
of the top section of the humidifying chamber. At the very bottom of the humidifying chamber is
the drain for the water and the inlet for the air slightly above.
The drain is maintained by using a small 1/40 horse power submersible pump that pumps
the water back into the water tank, which will be discussed in further detail in section 3.2.1.
Shortly after the drain outlet from the humidifying chamber, a thermocouple is setup to monitor
the temperature of the water after interaction with the air stream denoted as T12 in Fig 3-1. With
the water inlet, the water outlet, the air inlet and the air outlet temperature we can measure the
28
efficiency, and HCR, of this part of the process. The location of the latter two thermocouples will
be discussed shortly.
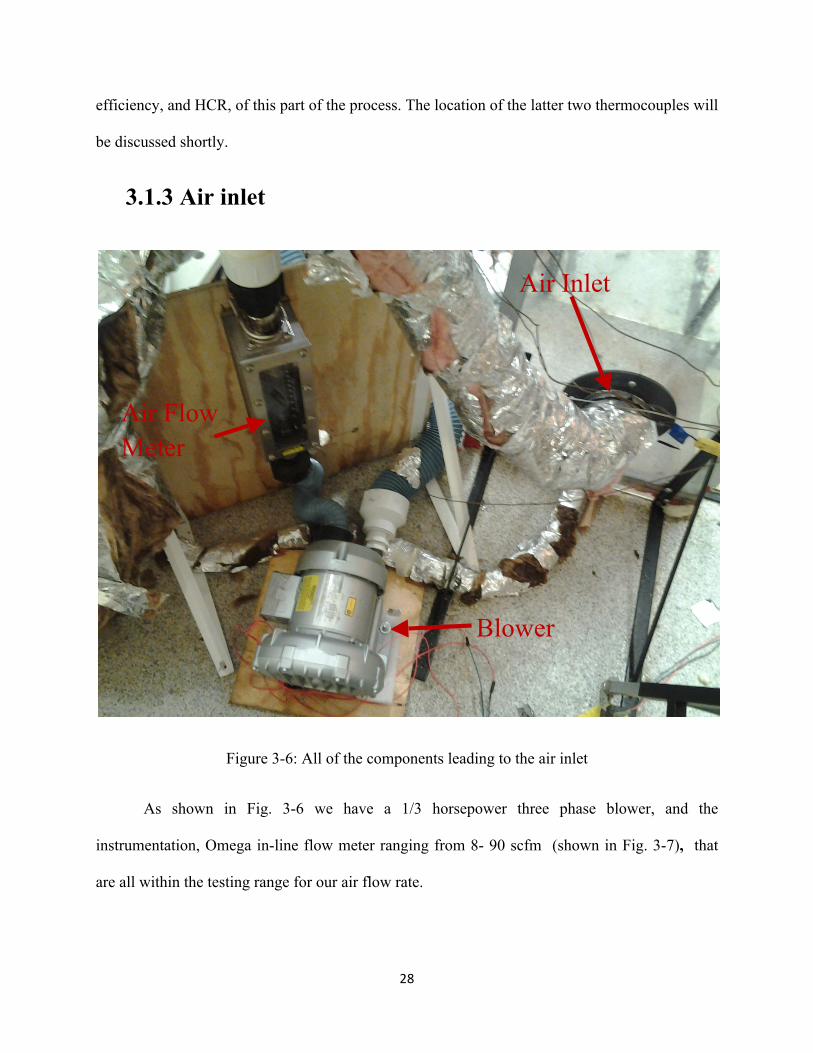
3.1.3 Air inlet
Figure 3-6: All of the components leading to the air inlet
As shown in Fig. 3-6 we have a 1/3 horsepower three phase blower, and the
instrumentation, Omega in-line flow meter ranging from 8- 90 scfm (shown in Fig. 3-7), that
are all within the testing range for our air flow rate.
Blower
Air Flow Meter
Air Inlet

29
Figure 3-7: Omega in-line air flow meter
To power the blower and adjust the air flow rate we needed to use a frequency drive,
show in Fig. 3-8. The frequency drive is capable of adjusting the power of the blower from 8
scfm to 40 scfm. To control the frequency drive we need to use a power supply capable of
supplying up to 5 V.
Figure 3-8: Frequency drivers and components involved
Fuses
Frequency Driver
Power Supply

30
These values work out with our 𝑚! ranges, with the air flow meter being accurate within
1 scfm. Slightly above the air flow meter is the thermocouple, the omega fine wire thermocouple
(K-type), in the air line to measure the air temperature into the humidifying chamber. These
types of thermocouples are all used to measure the air temperatures.
3.2 Dehumidifier
For this section we will focus on the highlighted section shown below in Fig. 3-9. Here
we first look at the beginning of the water line, then focus on the air line while focusing on the
type of heat exchanger, and finally look into the condensation collection design.
Figure 3-9: Dehumidifier location

31
3.2.1 Water Inlet
At this part of the process we have a large tank to store the water for the process. All of
the drained water enters back into this tank, tank shown in Fig. 3-10 and the earlier mentioned
drain pump shown in Fig. 3-11. Since the drained water enters back into to the tank at a higher
temperature then the starting temperature we are trying to achieve we will use a heat exchanger
in the tank to chill the water to the desired temperature.
Figure 3-10: Water tank with water supply for the system
Chilled water supply
Drain Line
32
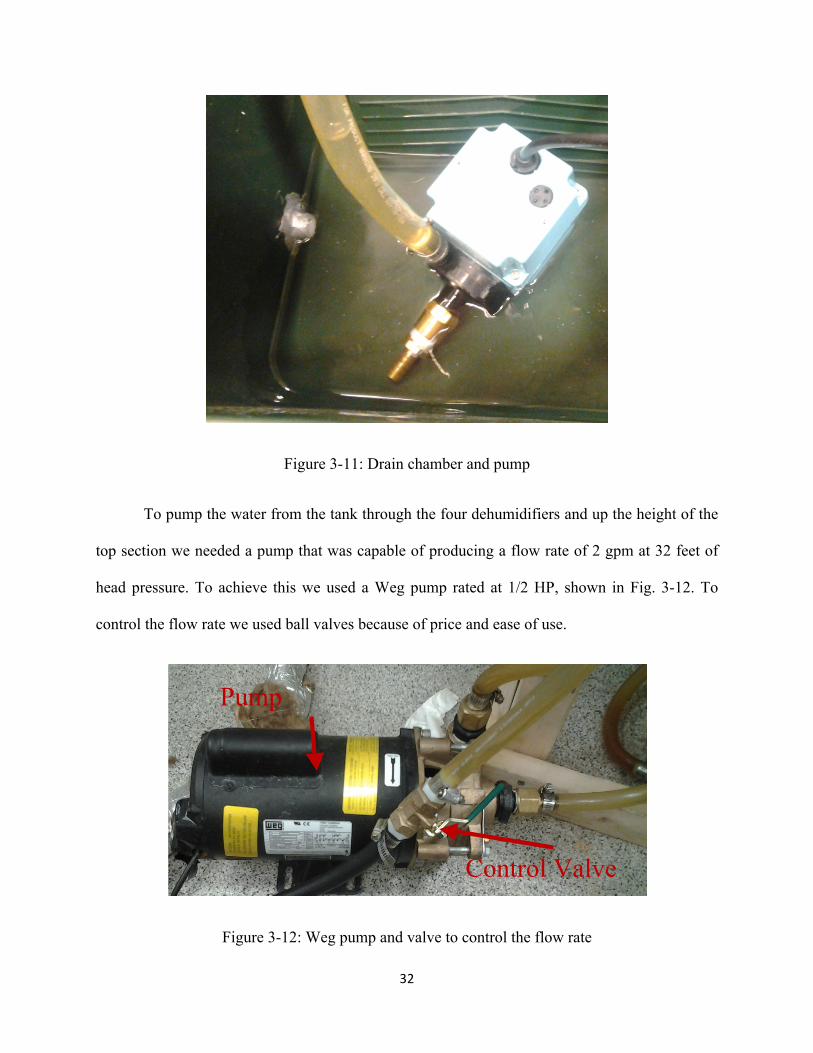
Figure 3-11: Drain chamber and pump
To pump the water from the tank through the four dehumidifiers and up the height of the
top section we needed a pump that was capable of producing a flow rate of 2 gpm at 32 feet of
head pressure. To achieve this we used a Weg pump rated at 1/2 HP, shown in Fig. 3-12. To
control the flow rate we used ball valves because of price and ease of use.
Figure 3-12: Weg pump and valve to control the flow rate
Pump
Control Valve

33
As shown in Fig. 3-1 each thermocouple for the water line is located before each
dehumidifier and a fifth after the last one to get a temperature reading before the heater.
3.2.2 Air Line and Heat Exchanger
For a full dimension drawing of the heat exchanger check Appendix C. All of the air lines
connect each dehumidifier to either a condensate collector, to the humidifier (the first air line), or
back to the blower (the last air line). For every air temperature measurement the omega precision
fine wire thermocouples were placed at the inlets of the dehumidifiers and for the final air line
the thermocouple is inserted right before the inlet for the blower. Since the air line can carry
vapor at high temperatures and issue with the design was to properly insulate all of the
dehumidifiers and the airlines. Fig. 3-13 is an image of the insulated dehumidifiers next to the
humidifying chamber.
Figure 3-13: Insulated system
Dehumidifiers
Humidifier
34
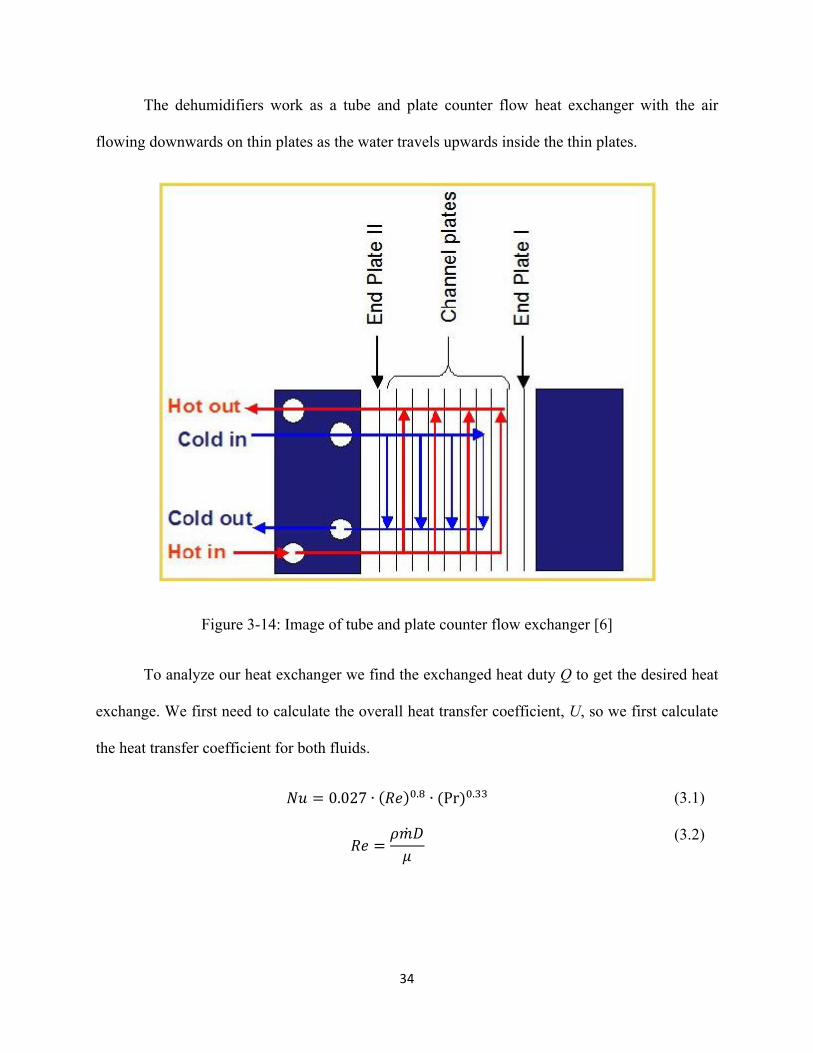
The dehumidifiers work as a tube and plate counter flow heat exchanger with the air
flowing downwards on thin plates as the water travels upwards inside the thin plates.
Figure 3-14: Image of tube and plate counter flow exchanger [6]
To analyze our heat exchanger we find the exchanged heat duty Q to get the desired heat
exchange. We first need to calculate the overall heat transfer coefficient, U, so we first calculate
the heat transfer coefficient for both fluids.
𝑁𝑢 = 0.027 ∙ 𝑅𝑒 !.! ∙ (Pr)!.!!
𝑅𝑒 =𝜌𝑚𝐷𝜇
(3.1)
(3.2)

35
We have assumed values of Prandtl numbers for the flows: 6.6 for water and 0.7
for air. With the Nusselt number we can easily find the heat transfer coefficient for each flow and
then we obtain the overall heat transfer coefficient by summing all of the internal resistances.
1𝑈 =
1ℎ!
+1ℎ!
+𝑡𝑘
𝑄 = 𝑈 ∙ 𝐴 ∙ 𝐿𝑀𝑇𝐷
(3.3)
(3.4)
For the system that we are looking at we are experimenting with we were looking at a
heat duty range of 2.5 to 6.3 kW. What is important is that we get the right LMTD range that
way we can optimize the condensate outputted.
With this sort of heat transfer we have the vapor content in the airline decrease as the
water starts to form droplets and be carried through the air line. It is the task of the condensate
collectors to catch that condensate and collect them after this dehumidification process.
36
3.2.3 Condensate Collector
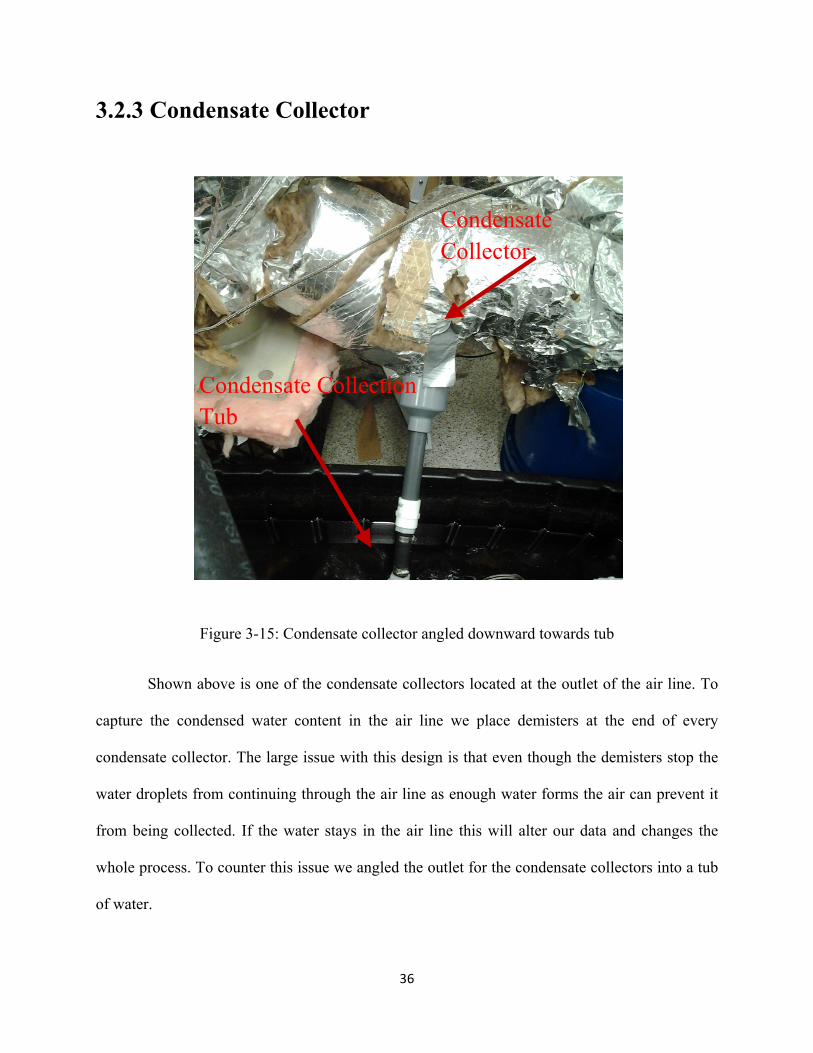
Figure 3-15: Condensate collector angled downward towards tub
Shown above is one of the condensate collectors located at the outlet of the air line. To
capture the condensed water content in the air line we place demisters at the end of every
condensate collector. The large issue with this design is that even though the demisters stop the
water droplets from continuing through the air line as enough water forms the air can prevent it
from being collected. If the water stays in the air line this will alter our data and changes the
whole process. To counter this issue we angled the outlet for the condensate collectors into a tub
of water.
Condensate Collection Tub
Condensate Collector

37
The tub of water needs to be prefilled otherwise air will leaks out from the condensate
collectors which again alter our process. With enough water such that the pressure from the
water is high enough to counter the pressure from the air, which ends up not being too much of
an issue, we can collect condensate. Using gravity and the pressure from the air helps the
collection process. To regulate the water level and drain as too much desalinated water is
produced we use a low power submersible pump to extract the water out of the tub. The same
design for the condensate collector is used for the extraction entry into the air line the only
difference is that the extraction airline is angled downwards into the main airline, that way if
some of the vapor condenses from the extraction process the condensed water follows the outlet
of the condensate collector.
38
3.3 Extraction Line
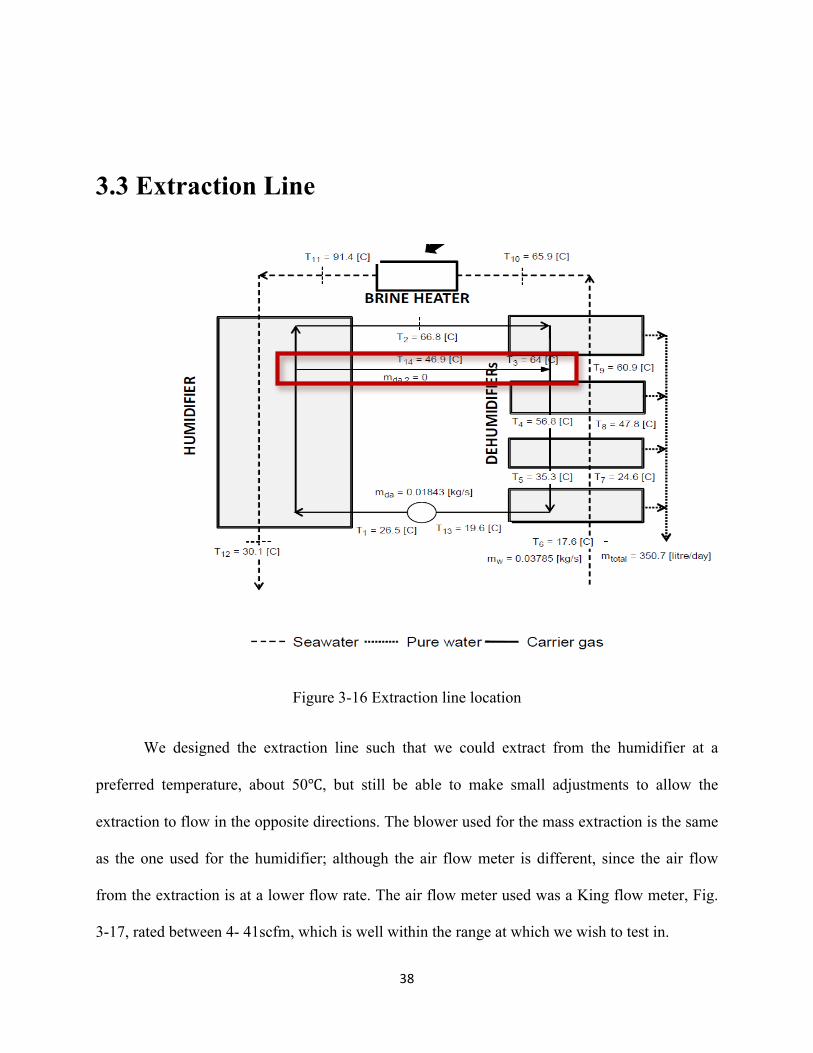
Figure 3-16 Extraction line location
We designed the extraction line such that we could extract from the humidifier at a
preferred temperature, about 50℃, but still be able to make small adjustments to allow the
extraction to flow in the opposite directions. The blower used for the mass extraction is the same
as the one used for the humidifier; although the air flow meter is different, since the air flow
from the extraction is at a lower flow rate. The air flow meter used was a King flow meter, Fig.
3-17, rated between 4- 41scfm, which is well within the range at which we wish to test in.

39
Figure 3-17: King in-line air flow meter
Since the blower is frequency controlled we will control the extraction flow rate though
another frequency drive. There are two thermocouples in the extraction airline, one at the
extraction inlet and one located after the blower and before the main air line. It is important that
we extract the temperature that is equivalent to the temperature after the first dehumidifier;
otherwise entropy will be generated due to the mixing of air steam at dissimilar temperatures and
concentration. Shown in Fig. 3-18 is our insulated extraction line.

40
Figure 3-18: Extraction line with blower in air flow meter
The valve shown in Fig 3-18 is used for a no extraction case to close off all air flow
through the extraction. Each extraction design would work for multiple extractions and not the
single case, the only difference is the location in the humidifier at which we choose to extract
from.
3.4 Data Acquisition and Analysis
Although there are thermocouples placed in key water and air lines we cannot read the
measurements without the use of the data acquisition Agilent 34970A, show in Fig 3-19. This
Blower Air Flow Meter
Humidifiers
Extraction air lines

41
device interprets the voltage output of each different type of thermocouple and reads out the
respective temperature for that value.
Figure 3-19: Agilent 34970A data acquisition
The ease of access of the data acquisition and of the flow rate meters makes adjusting
parameters easier and helps minimize the time to achieve steady state. To interpret the data we
used EXCEL and Engineering Equation Solver (EES). With EES we can easily input all of the
temperature values and the flow rates to get HCR, GOR, and RR values instantly. With Excel we
can graph out the temperature range per unit of the system and analyze the pinch points in the
system and analyze the changes in parameter values with changes in extraction flow rates.
42
4. Results
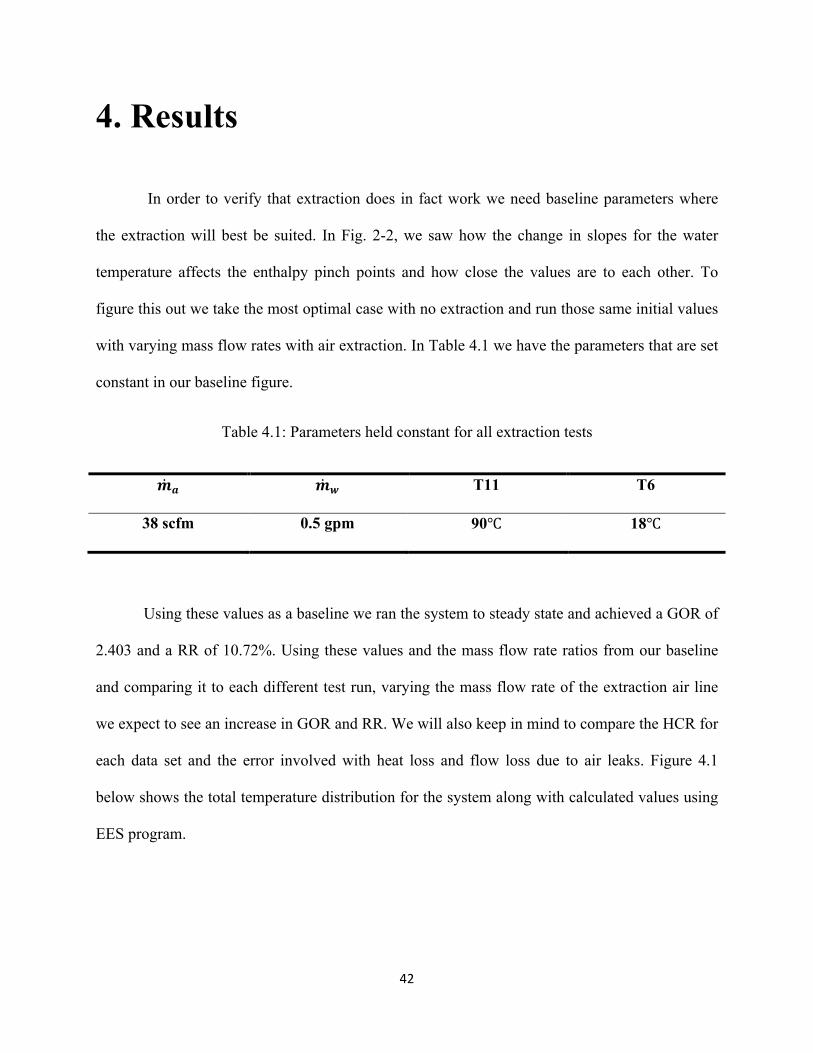
In order to verify that extraction does in fact work we need baseline parameters where
the extraction will best be suited. In Fig. 2-2, we saw how the change in slopes for the water
temperature affects the enthalpy pinch points and how close the values are to each other. To
figure this out we take the most optimal case with no extraction and run those same initial values
with varying mass flow rates with air extraction. In Table 4.1 we have the parameters that are set
constant in our baseline figure.
Table 4.1: Parameters held constant for all extraction tests
𝒎𝒂 𝒎𝒘 T11 T6
38 scfm 0.5 gpm 90℃ 18℃
Using these values as a baseline we ran the system to steady state and achieved a GOR of
2.403 and a RR of 10.72%. Using these values and the mass flow rate ratios from our baseline
and comparing it to each different test run, varying the mass flow rate of the extraction air line
we expect to see an increase in GOR and RR. We will also keep in mind to compare the HCR for
each data set and the error involved with heat loss and flow loss due to air leaks. Figure 4.1
below shows the total temperature distribution for the system along with calculated values using
EES program.

43
Figure 4-1: Baseline temperature values and calculated parameters
For our study we ran five different flow rates and once steady was reached, which took
about an hour to two, we would then copy down the entire temperature range and use EES to
analyze the data. Since the mass flow rates would sometimes vary we will compare each piece
of data by using the air to water mass flow ratios. The data obtained is shown below in Table 4.2.
44
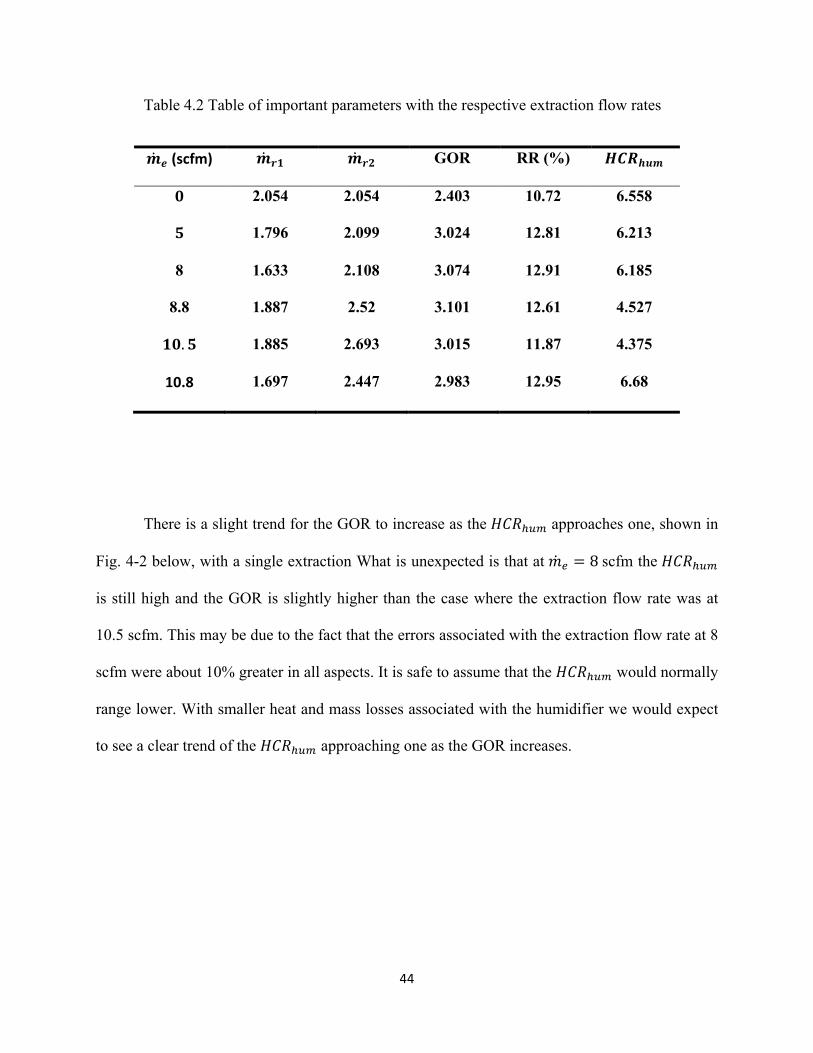
Table 4.2 Table of important parameters with the respective extraction flow rates
𝒎𝒆 (scfm) 𝒎𝒓𝟏 𝒎𝒓𝟐 GOR RR (%) 𝑯𝑪𝑹𝒉𝒖𝒎
𝟎 2.054 2.054 2.403 10.72 6.558
𝟓 1.796 2.099 3.024 12.81 6.213
8 1.633 2.108 3.074 12.91 6.185
8.8 1.887 2.52 3.101 12.61 4.527
𝟏𝟎.𝟓 1.885 2.693 3.015 11.87 4.375
10.8 1.697 2.447 2.983 12.95 6.68
There is a slight trend for the GOR to increase as the 𝐻𝐶𝑅!!" approaches one, shown in
Fig. 4-2 below, with a single extraction What is unexpected is that at 𝑚! = 8 scfm the 𝐻𝐶𝑅!!"
is still high and the GOR is slightly higher than the case where the extraction flow rate was at
10.5 scfm. This may be due to the fact that the errors associated with the extraction flow rate at 8
scfm were about 10% greater in all aspects. It is safe to assume that the 𝐻𝐶𝑅!!" would normally
range lower. With smaller heat and mass losses associated with the humidifier we would expect
to see a clear trend of the 𝐻𝐶𝑅!!" approaching one as the GOR increases.

45
Figure 4-2: Comparison of the 𝐻𝐶𝑅!!" values to the respective GOR values
A more distinct trend is that the GOR hit an optimum value and then tapers off. In Fig. 4-
3 below we compare the ratio of extraction air to the total air of the system to the ratio of the
GOR at that value over the baseline GOR.
2.25 2.75 3.25 3.75 4.25 4.75 5.25 5.75 6.25 6.75
0 1 2 3 4 5 6 7
GOR Compared With HCR
GOR
HCR

46
Figure 4-3: Peaking trend of GOR to the air extraction to total air ratio
The same trend exists if we compare with the extraction flow rates but this will not be a
constant trend if other parameters in the system are adjusted. That is why using the ratio of both
ratios is a better representation of the GOR increase with a single mass extraction.
47
5. Conclusion
From the data presented we find that the theoretical work of [1] is consistent with our
data. We also noticed that that there were major heat and mass losses in the system, which
decreases the GOR value. From our data and these errors we can conclude:
• All GOR values will increase with a single air extraction from the humidifier to the
dehumidifier regardless of the air-to-water flow ratio.
• Due to heat and mass losses, form leaks mainly in the humidifier, our GOR values are
lower than expected but will increase once the issues are fixed.
• With our current GOR values our system cannot become a competitive commercial
desalination device but with the losses fixed it should become a competitive device.
• Since the single mass extraction cases behaved as predicted in [1] we can expect that the
GOR will further increase with multiple mass extractions.

48
Appendix A
Humidifying Chamber Dimensions and Design
As previously mentioned the dimensions of the humidifier were made to vary to fill
sizing for [5] and experiment with the extraction. Figure A-1 below shows the original concept
of the humidifying chamber. In the humidifying chamber that was used for our experimental
setup the sprayer design was changed because of the spray angles in the original design being too
large. Too much of the fluid was spraying along the sides of the chamber instead of on the fills,
which does not allow enough flow too spread and evenly mix with the air [5].
49
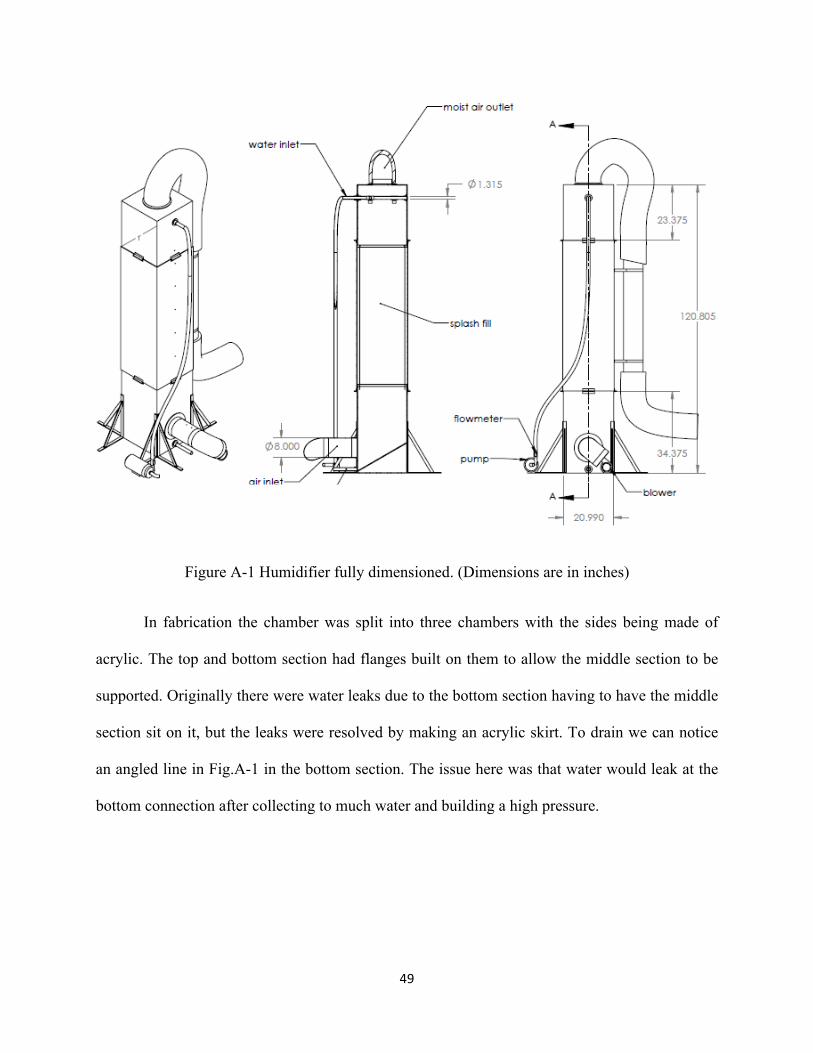
Figure A-1 Humidifier fully dimensioned. (Dimensions are in inches)
In fabrication the chamber was split into three chambers with the sides being made of
acrylic. The top and bottom section had flanges built on them to allow the middle section to be
supported. Originally there were water leaks due to the bottom section having to have the middle
section sit on it, but the leaks were resolved by making an acrylic skirt. To drain we can notice
an angled line in Fig.A-1 in the bottom section. The issue here was that water would leak at the
bottom connection after collecting to much water and building a high pressure.

50
Appendix B
Sprayer Height and Design
Our original sprayer design had for different sprayers covering to large of an area as
mentioned above. To fix this issue we used a single brass square-pattern nozzle spraying about
2.5 gpm at 20 psi with a spray angle of 75°. With this new sprayer nozzle to determine the
sprayer height at which to fix it we used some trig. Shown in Fig. B-1 we have an image of what
the spray would look like.
Figure B-1: Geometry of spray [7]
If we call the spray distance h, the theoretical coverage L, and the spray angle α then we
can determine h by perpendicularly intersecting L.

51
𝒕𝒂𝒏𝜶𝟐 =
𝑳𝟐𝒉
𝒉 =𝑳
𝟐𝒕𝒂𝒏(𝜶𝟐)
(B.1)
(B.2)
Using B.2 and that 𝐿 ≈ 22 in. and that 𝛼 = 75° we find that ℎ~14.3 in. Using this value
we set the height of the spray distance to be about this, making sure to not exceed this height as
to recreate the same problem as before.

52
Appendix C Dehumidifier Dimensioning
The four dehumidifiers that are used in this experiment are custom made by George
Fischer for this specific desalination plant. As mentioned before the heat exchangers are tube-
and plate heat exchangers. Shown below in Fig. C-1 is the side view of the dehumidifier and Fig
C-2 is the top view of the dimensioned dehumidifier.
Figure C-1: Side view of the dimensioned dehumidifier

53
Figure C-2: Top view of the dimensioned dehumidifier
Nothing in the dehumidifiers were modified we only had to decide on flange connections
for the air and water lines and we had to insulate the dehumidifiers.

54
6. References
[1] G. Prakash Narayan, Karim M. Chehayeb, Ronan K. McGovern, Gregory P. Thiel, Syed M. Zubair, and John H. Lienhard V. "Thermodynamic balancing of the humidification dehumidification desalination system by mass extraction and injection". In: International Journal of Heat and Mass Transfer [2] G. Prakash Narayan, John H. Lienhard V, and Syed M. Zubair. "Entropy Generation Minimization of Combined Heat and Mass Transfer Devices," International Journal of Sciences, vol. 49, pp. 2057-66, 2010. [3] Carrington, C.G., and Sun, Z.F., 1991 "Second law analysis of combined heat and mass transfer phenomena". In: International Journal of Heat and Mass Transfer 34(11), 2767- 2773.
[4] A. Bejan, Entropy generation minimization: the method of thermodynamic optimization of finite size systems and finite time processes. Boca Raton, FL: CRC Press, 1996.
[5] M. G. St. John, “Heat and Mass transfer characteristics of packed bed humidification devices.” Submitted to Massachusetts Institute of Technology May 2012.
[6] CESCO Custom Equipment Solutions CO. “Gasketed plate heat exchanger”. Image. Plate heat Exchangers. < http://www.gocesco.com/plateheatexchangers.html>
[7] Steinen nozzles. “Spray angle and Coverage”. Image. Spray Calculator. <http://www.steinen.com/industrial/usa/english/spray-calculator.php>