Extinction of fish stocks Peter Berck Professor University of California, Berkeley Visiting...
70
Extinction of fish stocks Peter Berck Professor University of California, Berkeley Visiting Professor, Umeå Universitet
-
Upload
esmond-byrd -
Category
Documents
-
view
215 -
download
2
Transcript of Extinction of fish stocks Peter Berck Professor University of California, Berkeley Visiting...

Extinction of fish stocks
Peter BerckProfessor University of California, BerkeleyVisiting Professor, Umeå Universitet

Marine Resource Destruction
We take it as given that policy should avoid causing very low populations of marine organisms.
The two major ways of reducing numbers of fish are Overfishing Habitat destruction

Sturgeon

Overfishing
(NYT) WASHINGTON, Sept. 30 [2005]- The United States
Fish and Wildlife Service will begin banning imports of beluga caviar and other beluga products from the Caspian Sea on Friday, after caviar-exporting countries in the region failed to provide details of their plans to conserve the fish, which is listed internationally as a species threatened with extinction.

Gadus Morrhua
http://www.photolib.noaa.gov/historic/nmfs/figb0314.htm
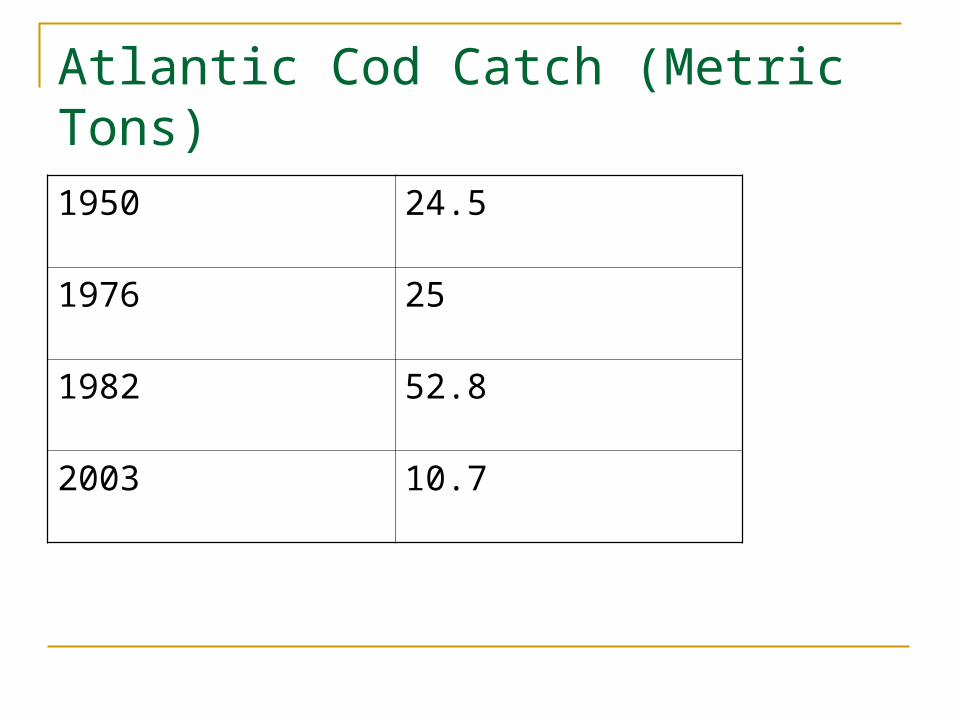
Atlantic Cod Catch (Metric Tons)1950 24.5
1976 25
1982 52.8
2003 10.7

Sebastes sp. caught north of Fanny Shoals,
CA, 300 ft. depth. Photo: R.D. Sage

Rockfish
In September 2002, West Coast fisherman faced the new reality when they learned that severe restrictions would be placed on bottom fishing on much of the continental shelf from Canada to Mexico. The Pacific Fishery Management Council implemented the strictest regulations in the history of West Coast fishing in a final-hour attempt to save the rockfish.
-Pew Ocean trust p. 36
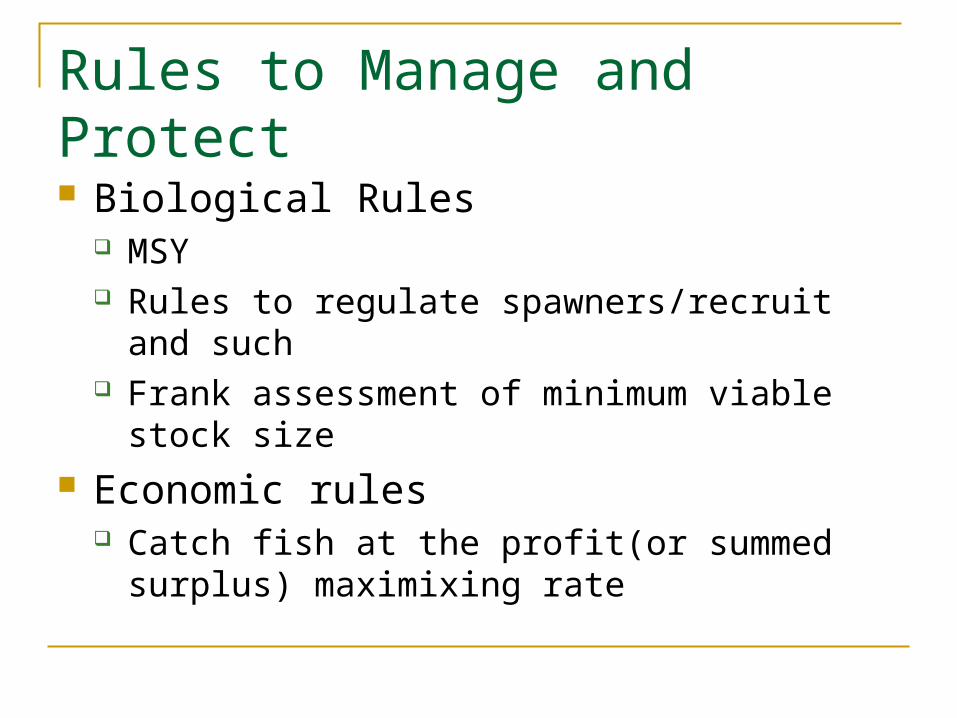
Rules to Manage and Protect
Biological Rules MSY Rules to regulate spawners/recruit and such Frank assessment of minimum viable stock size
Economic rules Catch fish at the profit(or summed surplus)
maximixing rate

Why Don’t the Rules Protect

Life Without Rules: Open Access Model
0
500
1000
1500
2000
2500
3000
0 200000 400000 600000 800000
Harvest metric tons
Sto
ck (
1000)
metr
ic t
ons
North Sea Herring 1963-77; Bjorndal and Conrad

The Model
dx/dt =f(x) – s q x is stock s is number of boats q is catch per boat f is growth function with usual logistic like shape

entry
ds/dt = pq – c(q,x) – fc p is price c is variable cost function given x fc is fixed costs per unit time

Catch per boat
p = dc/ dq Price equal marginal cost

Specific cost function
C(q,x) = T(x-x*) c(q) c(q) = qK
T = (x-x*)-R
Supply per boat p = T c’ = TKqK-1
q = (p/TK)(1/(K-1))
For the moment we assume that x*=0.
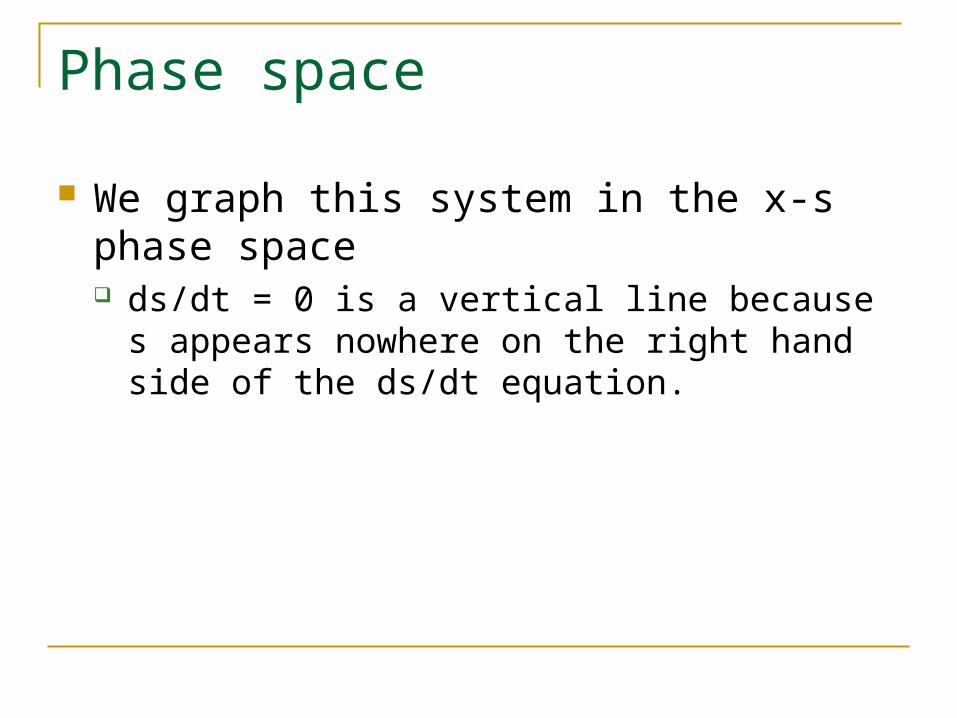
Phase space
We graph this system in the x-s phase space ds/dt = 0 is a vertical line because s appears
nowhere on the right hand side of the ds/dt equation.

Two possibilities for dx/dt = 0 s = f(x)/q on dx/dt = 0. When x is large enough f(x) is zero, call this
xmax. So x= xmax and s= 0 is one point. What happens when as x approaches 0?
Both numerator and denominator approach zero so we need l’Hopital’s rule.
f’(0) > 0 What of q’?

Depends upon R and K
q’ = (R/K-1)) (p/K)(1/(K-1)) x(R/(K-1)) – 1
The limit of q’ as x approaches zero is zero if R/(K-1) > 1 and infinite if < 1.
So the limit of f/q as x approaches zero is infinite if R/(K-1) > 1 and the picture is like IB and otherwise like 1A.

1A
s
x
ds/dt=0
dx/dt=0

Fig 1 B
x
ds/dt=0
dx/dt=0

So what is K and R
K is the factor on the cost function. Mildly increasing costs would give K = 1.25
R is how much fish stock matters for costs. When R is small you get the diagram leading to extinction. Fish finders and radios lead to smaller R’s and hence to the possibility of smaller stocks.
At least in this view.

Minimum pop. size
There is a minimum viable population size, perhaps 500 perhaps 5000 individuals in a population.
Below this genetic bottlenecks make extinction much easier
Let xv be the min viable population size

Shutdown
There may be a minimum size of population for fishing to still be worthwhile. Let x* be that amount. When x gets close to x*, T gets close to infinity and costs go to infinity.
MC(x,q) = K(x-x*)-R qK-1 = p
And so as x approaches x* q must approach zero.

The Upshot
If xv is less than x* then the fishery is protected from extinction and otherwise not.
That’s the theory.

Open access issues
Not all fisheries shutdown at low levels of fish.
By-catch. Other species of rockfish are more numerous than boccacio, and they are caught together. So fishing continues until the last boccacio is scooped up.
Sturgeon. They are immense and profitable. Their numbers could be reduced so low that they can’t find mates.

Will Economic Rule Protect?
F’ = r rule Boccacio and Sturgeon. Small rate of growth What is private sector r
Stock market is 10% nominal, perhaps 7% real Lack of diversification implies higher rate of return Underemployment emplies higher marginal value to
now. Gear unemployed in one fishery clobbers another
Gulf of Maine from Georges bank

Regulation and its failure
Regulation takes the form of a feedback rule for catch as function of spawning stock.
As far as the dynamics of the system, sq is now given by g(x), a government rule.
To enforce the rule government often restricts q by means of season length or gear restrictions.
ITQ’s also accomplish this restriction with less inefficiency. They work on the product s q. See Homans and Wilen for a worked out example of
regulation for Pacific Halibut.

Magnuson-Stevens Fishery Conservation Act Three fundamental problems
1. management emphasizes commodity production, although authority to sustain fisheries does exist within the law.
2. management structure and process suffer from regulatory capture….resource users dominate the councils’ voting memberships.
3. law codified open access. (I don’t see the reasoning for this point, the law allows ITQ’s, except that Congress passed a specific moratorium on their use.)
Source: Pew

What does the rule look like?
g(x) has a very funny form. It appears to be set close to the open access harvest until x becomes quite small, even close to xv and then it is set to zero.

ESA
Endangered species act. Listed species must be left unmolested. This causes fishing to be stopped, but only when the species is listed. Many endemics as well as some salmon and sturgeon have protection.
Obviously an extreme way to run a fishery.

Why does it get this way
The question is why g(x) has the form it does.

Employment
Year Fishers Processing and Wholesale Employment
1960 130,431 93,625
1980 193,000 103,448
1988 273,700 90,005

Capture
In the US case the fisheries councils are widely believed to be tools of the fisherman and fish processors. They serve on the councils and dominate them. See Pew.

Berck and Costello
Councils max present value of profits for incumbent fishers.
Congress forbade them from restricting entry.

BC Model
p price X fish stock E effort f(X) growth c cost per minute k catchability coefficient
speed of adjustment coefficient

State EQ’s
Schaeffer model leads to simplest algebra dX/dt = f(X) – kEX dE/dt = * (pkX – c)

Control Variable
k is taken as the control variable and the regulator chooses it between two bounds, kl and ku
Regulators make fishing boats less effective by regulating gear or time fishing.
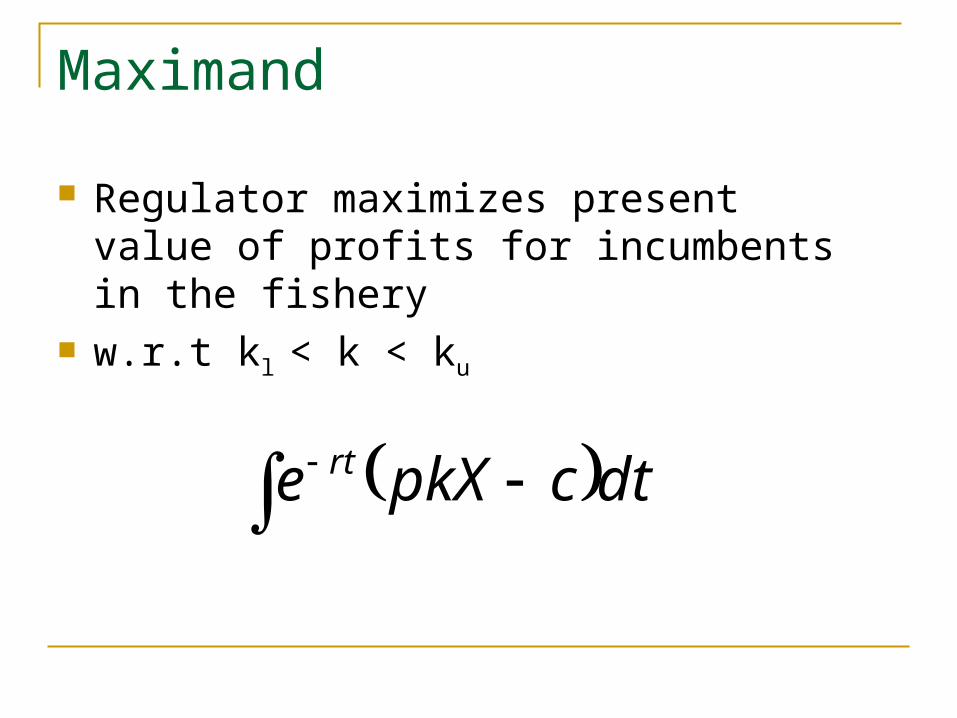
Maximand
Regulator maximizes present value of profits for incumbents in the fishery
w.r.t kl < k < ku
dtcpkXe rt


Steady State
By setting all the time derivatives in the state and cosate equations to zero, one finds the steady state for an interior value of k.
It is at f’(X) = r. However this is a coincidence of the
Schaeffer formulation and is not in general true.

Exceptional Control
Grad of H vanishes, as does it first and second derivatives. Substitute for time derivative of costate variables from costate equations. Get
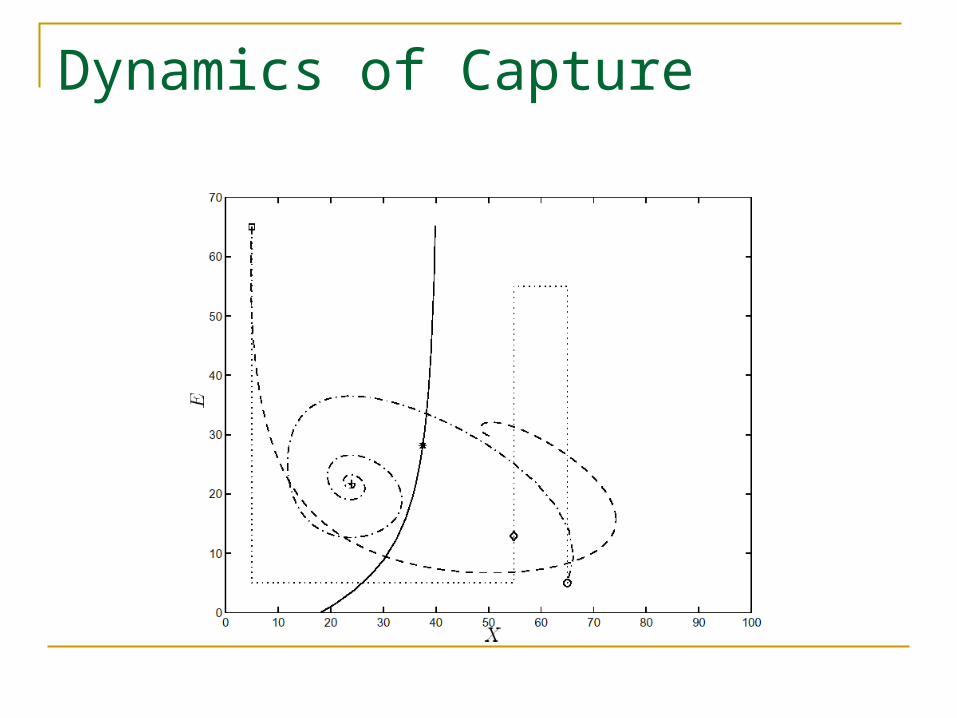
Dynamics of Capture

Outcome
Two possibilities Regulator chooses open access outcome when f’
=r gives stock lower than open access outcome. Regulator chooses open access (or minimum
fishing on low side) and then goes to stock higher than open access

Steady state Regulated
Is always less than the steady state chosen by a sole owner.

Conclusion
Regulation by the fishers when there isn’t limited entry may protect no more than open access itself.

Comment
Increased efficiency in fishing leads to worse outcomes in open access and hence in regulated open access.

ITQ’s and Capture
Any policy that limits entry, like ITQ’s, ends the problem with capture that come from open access.
They do not end the problem that the fisherman might prefer to catch the fish, all of them, now, pay off their boats and retire to San Diego.
Processors also may prefer to take more stock now and close up shop later.

Puzzle
Why did fishers rebel against limited entry? See Grafton, R., D. Squires, and K. Fox,
2000. "Common Resources, Private Rights and Economic Efficiency," Journal of Law and Economics 43(2).
Storability and Extinction
Elephants, rhinos, etc are all in danger of extinction.
They have a storable product, tusks and horns respectively.
Does this change the chances for extinction?

Elephant
Image is copyright George Ritchey. Usage requires an image credit.

MK: Elephants
The interesting case in MK is the case where there is storage and poaching to extinction.
Poaching means that p = c(x), where p is price and c(x) is marginal cost. C decreases in x—cheaper to kill animals when there are more of them. Note that nothing limits the rate of slaughter, that is, c is not a function of the kill, per se.
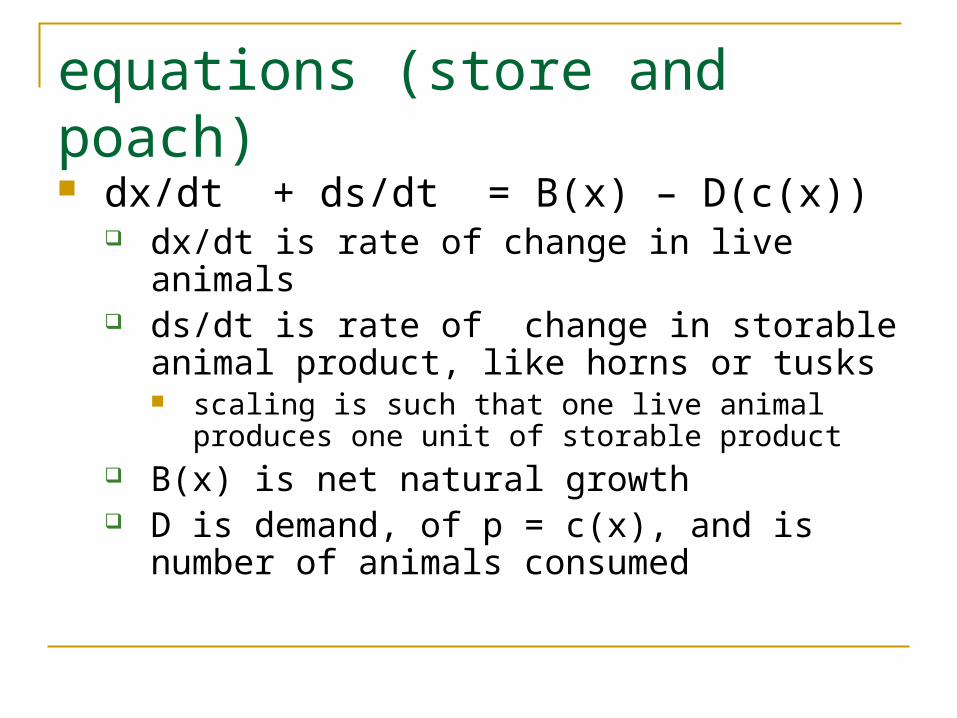
equations (store and poach)
dx/dt + ds/dt = B(x) – D(c(x)) dx/dt is rate of change in live animals ds/dt is rate of change in storable animal
product, like horns or tusks scaling is such that one live animal produces one unit
of storable product B(x) is net natural growth D is demand, of p = c(x), and is number of
animals consumed

storage (store and poach)
Hotelling’s rule applies to storage, so dp/dt = rp. recall that p = c(x) dp/dt = c’ dx/dt =rp =rc dx/dt = rc/c’ negative because c’ is negative only a function of x, because stock x solely
determines marginal cost of harvest, which equals price.

ds/dt for (store and poach)
ds/dt = B – D – dx/dt ds/dt = B – D – rc/c’
so ds/dt depends only on x. It is positive when B-D > rc/c’
On diagram, that is between Xl* and Xs*
Negative otherwise

store and poach fig 1
Xs*
Xl*
rc/c’
B-D
ds/dt
x

store and poach-shape
dx/dt always negative ds/dt negative for x > Xs*
ds/dt positive for Xl* < x < Xs*
ds/dt negative for x < Xl*
Xs*Xl*
s

store and poach—end point
The store and poach curve must end and not imply a price jump.
When it ends, price goes up at the rate of interest until S is exhausted
At x= 0, p = c(0), call this cm
let p* be the limit price for the demand curve. Define T by p* = erTcm
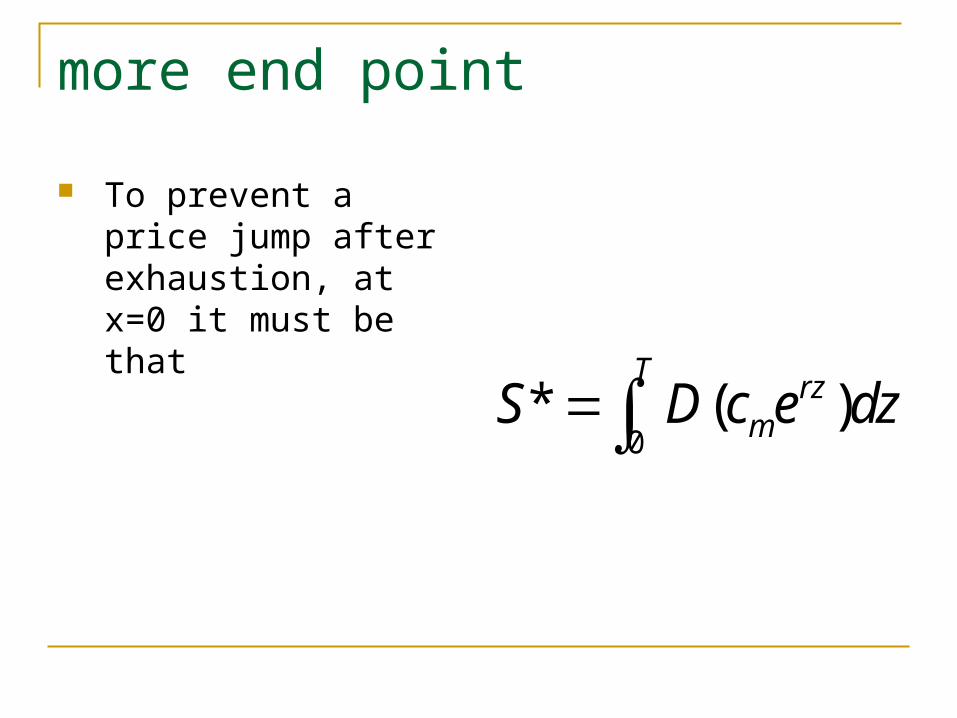
more end point
To prevent a price jump after exhaustion, at x=0 it must be that
0* ( )
T rzmS D c e dz
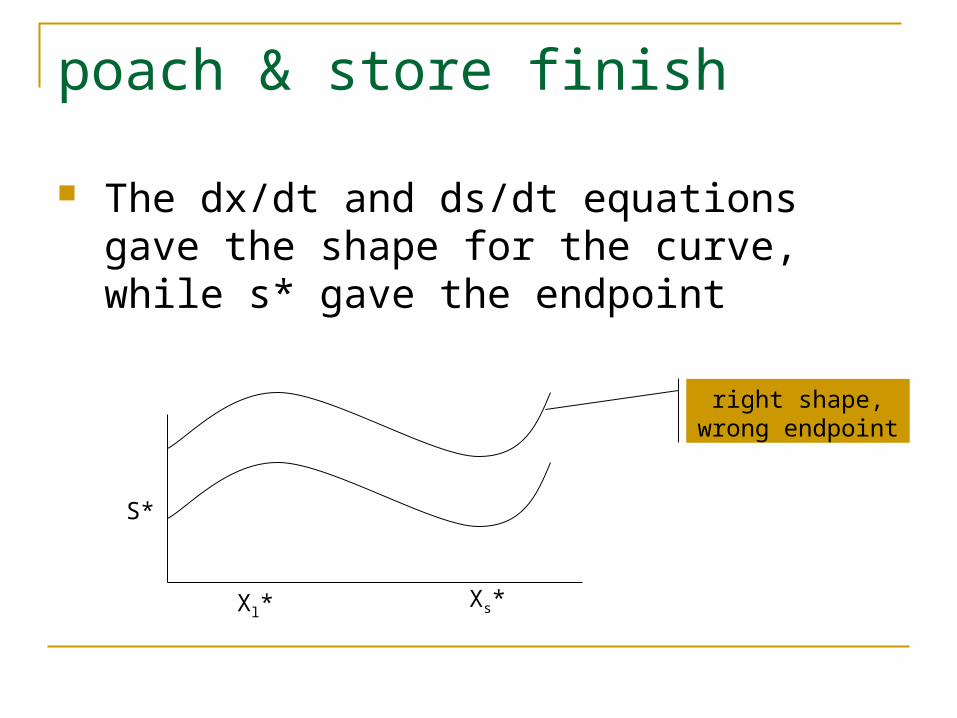
poach & store finish
The dx/dt and ds/dt equations gave the shape for the curve, while s* gave the endpoint
Xs*Xl*
S*
right shape, wrong endpoint

How to get there
Could magically start with (x,s) that leads to poach and store extinction
Could start with too much stock and get there by a store and don’t poach path
Could start with too little stock and get their by instantaneously converting x into s (called a cull in MK)

What to do
The model is very fragile as it requires hitting the extinction point with a specific amount of product in stores.
In the model, publicly holding a larger stock than the S* stock and threatening to sell it at extinction breaks up the poach and store outcome.
Marine Habitat Destruction
Dredges and such Reserves so that there are breeding grounds and
catching grounds separately. Equipment changes

Pollution
K and N runoff Mississippi or östersjön dead zones (oxygenless) Most effective part of clean water act, so far, was
the original 90% subsidy of sewage treatment. Would work well if EU did this.
Incredible that EU and US subsidize agriculture without forcing limits on K and N application. Especially because of overproduction.

Land Habitat Destruction
Water projects are just murder on salmon. Sacramento and San Joaquin rivers both have ESA listed salmonids.
ESA forced reallocation of water from agriculture to instream uses.
US Clean Water Act now quite strict on development of wetlands.

Conclusion
Open access can and does lead to the commercial destruction and even extinction of fish.
On land development is a threat to many species dependent upon streams and rivers.
Pollution also harms fish.

Lack of Will
There is much more political will to save wolves and grizzles, both big and furry, than there is to restore cod and sturgeon.
Neither aquatic nor terrestrial organisms really get much attention till they are in extremis.
Having a viable but small wolf population is success, but a small cod population is not a success. So thinking in terms of extirpation doesn’t really help with commercial quantities of fish.

Regulators
Regulators working in the interests of extant fishers and processors are unlikely to save stocks.

Outside Influences
Outside influences, like the storage in Morkom and Cramer, can lead to extinction through price changes.

Blue Whale
Sources
Berck, P. Open Access and Extinction. Econometrica 47(1979):877-882
Berck, P and Costello, C. Overharvesting the traditional fishery with a captured regulator. 2001. Mimeo.
Bjorndal, T. and Conrad, J. The Dynamics of an Open Access Fishery. Canadian Journal of Economics. 20(1987):74-85
Grafton, R., D. Squires, and K. Fox, 2000. "Common Resources, Private Rights and Economic Efficiency," Journal of Law and Economics 43(2).
Morcom and Kramer. Elephants American Economic Review America’s Living Oceans. Pew Oceans Commission May 2003.