
Extent and Determinants of Child Labour in Uganda · Abstract Despite the prevalence and the many...
22
Extent and Determinants of Child Labour in Uganda By Tom Mwebaze Makerere University Kampala, Uganda AERC Research Paper 167 African Economic Research Consortium, Nairobi June 2007
Transcript of Extent and Determinants of Child Labour in Uganda · Abstract Despite the prevalence and the many...
Extent and Determinantsof Child Labour in Uganda
By
Tom MwebazeMakerere UniversityKampala, Uganda
AERC Research Paper 167African Economic Research Consortium, Nairobi
June 2007

THIS RESEARCH STUDY was supported by a grant from the African EconomicResearch Consortium. The findings, opinions and recommendations are those of theauthor, however, and do not necessarily reflect the views of the Consortium, itsindividual members or the AERC Secretariat.
Published by: The African Economic Research ConsortiumP.O. Box 62882 - City SquareNairobi 00200, Kenya
Printed by: Modern Lithographic (K) Ltd.P.O. Box 52810-City SquareNairobi 00200, Kenya
ISBN 9966-778-12-8
© 2007, African Economic Research Consortium.
ContentsList of tablesList of figuresAbstractAcknowledgements
1. Introduction 1
2. Literature review 4
3. Methodology 10
4. Results from the survey data 15
5. Conclusions and policy implications 24
Notes 25
References 26
Appendixes 28

List of tables1. Working children by age (percentage) 152. Percentage of working children by age group and gender 163. Proportion of working children by gender and residence (rural/urban) 174. Working children by gender and region 175. Working children by the highest level of education attained 186. Child participation in work, work + study, and by gender, in percentages 187. Working children by level of education of household head 198. Working children by occupation of household head 199. Average hours of work per day among children working by age
group and gender 2010. Variable names, definitions and means 20
A1. Probit model estimates for 1992 data setDependent variable: working kid 28
A2. Probit model estimates for 1999 data setDependent variable: working kid 29
A3. Probit model estimates for 2002 data setDependent variable: working kid 30
A4. Tobit model estimates for 1992 data setDependent variable: hours worked per day (hrs worked) 31
A5. Tobit model estimates for 2002 data setDependent variable: hours worked per day 32
A6. Probit model estimates, gender specific, for 1992 data setDependent variables: working male kid (1-3)/working female kid (4-6) 33
A7. Probit model estimates, gender specific, for 1999 data setDependent variables: working male kid (1-3)/working female kid (4-6) 34
A8. Probit model estimates, gender specific, for 2002 data setDependent variables: working male kid (1-3)/working female kid (4-6) 35
A9. Probit model estimates for 1992 data setDependent variable: working kid 6 to 9 years old 36
A10. Probit model estimates for 1992 data setDependent variable: working kid 10 to 14 years old 37
A11. Probit model estimates for 1999 data setDependent variable: working kid 6 to 9 years old 38

A12. Probit model estimates for 1999 data setDependent variable: working kid 10 to 14 years old 39
A13. Probit model estimates for 2002 data setDependent variable: working kid 6 to 9 years old 40
A14. Probit model estimates for 2002 data setDependent variable: working kid 10 to 14 years old 41
Abstract
Despite the prevalence and the many dangers associated with child labour, thephenomenon has received the attention of researchers, academicians and policy makersonly recently, and not until International Labour Organization (ILO) estimates showeda large and increasing number of working children worldwide. It is now recognized thatin order to combat child labour effectively, policies should be grounded in an informedunderstanding of its causes, roles and implications. This study uses data from the 1992,1999 and 2002 Uganda National Household Surveys to explore the extent, determinantsand forms of child labour in a poor but growing economy. Of note here is that over thisperiod Uganda introduced universal and compulsory primary education.
The study highlights the extent, characteristics and determinants of child labour inUganda and their evolution over the decade. The theoretical framework is a standardhousehold production model that analyses the allocation of time within the household.Using probit and tobit models, we estimate the determinants of child labour for theindividual child worker. The results indicate that child labour is still common, widespreadand starts at an early age in Uganda, although it has reduced significantly over the years.Education and formal employment of the household head significantly decrease theprobability that a child will work. Household welfare is another indicator of child labour,as poor households are more likely to have working children. A comparison of the threedata sets reveals an increase in the percentage of children combining work and studyover time. Nevertheless, the likelihood of child labour increases with the age of thechild. The findings provide important results for informing policies to reduce, andpossibly eliminate, child labour in the country.
AcknowledgementsThe author acknowledges with gratitude the financial support of AERC, without whichthe study may not have been conducted. Thanks also go to the resource persons andother participants of Group A of the biannual workshop for their helpful comments andsuggestions.
EXTENT AND DETERMINANTS OF CHILD LABOUR IN UGANDA 27
Maitra, P. and R. Ray 2002. “The joint estimation of child participation in schooling andemployment: Comparative evidence from three countries”. Oxford Development Studies,30(1): 41–62.
Mason, Andrew D. and Shaludur R. Khandker, 1998. “Children’s work, opportunity cost andschooling in Tanzania”. Africa Region, The World Bank, Washington, D.C.
O’Donnell, O., F.C. Rosati and E. van Doorsaler. 2002. “Child labour and health: Evidence andresearch issues”. Working Paper. Understanding Children’s Work Inter-Agency ResearchCooperation Project. Innocent Research Centre, International Labour Organization, UnitedNations Children’s Fund and The World Bank.
Reynolds, Pamela. 1991. Dance Civet Cat: Child Labor in Zambezi Valley. Athens, Ohio: OhioUniversity Press.
Scoville, J.G. 2002. “Segmentation in the market for child labor: The economics of child laborrevisited”. American Journal of Economics and Sociology, 61(3): 713–23.
Singh, S. 2001. “Labour under contract farming in India: Issues of gender and child labour”.Indian Journal of Labour Economics, 44(4): 843–52.
Smith, Erica and Lou Wilson. 2002. “The new child labour: The part-time student workforce inAustralia”. Australian Bulletin of Labour, 28(2): 120–37.
Social Development Consultants. 2002. “Child labour in tobacco growing areas in Uganda”.Report of a study conducted for British American Tobacco Uganda Ltd.
Sunthornkajit, V., T. Kaiynunta, P. Varanarn and S. Varatechakongka. 2002. Thailand Child Labourin Illicit Drug Activities: A Rapid Assessment. Report prepared for the InternationalProgramme of the Elimination of Child Labour (IPEC). Geneva: International LabourOrganization.
Swaminathan, M. 1998. “Economic growth and the persistence of child labour: Evidence from anIndian city” World Development, 26(8): 1513–28.
The Monitor. 2003. “Policy on child labour coming”. Kampala: The Monitor Publications UgandaLimited, 4 February 2003.
Wahba, J. 2000. Do Market Wages Influence Child Labor and Child Schooling? Social ProtectionDiscussion Paper Series, No. 0024. The World Bank, Washington, D.C.
UBOS. 2003. Uganda National Household Survey 2002/03 Mid-term Report. Entebbe: UgandaBureau of Statistics.
Usha, S. and D.R. Devi. 1997. “Causes and earnings of child labour in Beedi and Agarbathiindustries”. The Indian Journal of Labour Economics, 40(4): 849–57.
28 RESEARCH PAPER 167
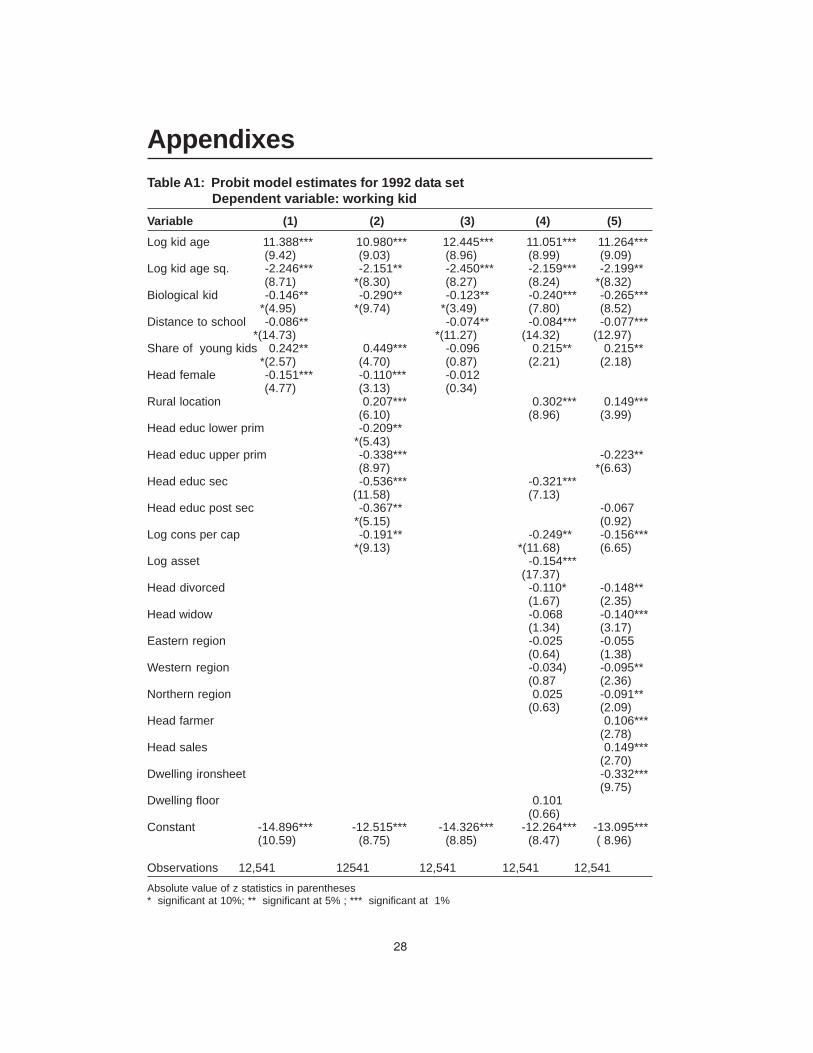
AppendixesTable A1: Probit model estimates for 1992 data set Dependent variable: working kidVariable (1) (2) (3) (4) (5)
Log kid age 11.388*** 10.980*** 12.445*** 11.051*** 11.264***(9.42) (9.03) (8.96) (8.99) (9.09)
Log kid age sq. -2.246*** -2.151** -2.450*** -2.159*** -2.199**(8.71) *(8.30) (8.27) (8.24) *(8.32)
Biological kid -0.146** -0.290** -0.123** -0.240*** -0.265****(4.95) *(9.74) *(3.49) (7.80) (8.52)
Distance to school -0.086** -0.074** -0.084*** -0.077****(14.73) *(11.27) (14.32) (12.97)
Share of young kids 0.242** 0.449*** -0.096 0.215** 0.215***(2.57) (4.70) (0.87) (2.21) (2.18)
Head female -0.151*** -0.110*** -0.012(4.77) (3.13) (0.34)
Rural location 0.207*** 0.302*** 0.149***(6.10) (8.96) (3.99)
Head educ lower prim -0.209***(5.43)
Head educ upper prim -0.338*** -0.223**(8.97) *(6.63)
Head educ sec -0.536*** -0.321***(11.58) (7.13)
Head educ post sec -0.367** -0.067*(5.15) (0.92)
Log cons per cap -0.191** -0.249** -0.156****(9.13) *(11.68) (6.65)
Log asset -0.154***(17.37)
Head divorced -0.110* -0.148**(1.67) (2.35)
Head widow -0.068 -0.140***(1.34) (3.17)
Eastern region -0.025 -0.055(0.64) (1.38)
Western region -0.034) -0.095**(0.87 (2.36)
Northern region 0.025 -0.091**(0.63) (2.09)
Head farmer 0.106***(2.78)
Head sales 0.149***(2.70)
Dwelling ironsheet -0.332***(9.75)
Dwelling floor 0.101(0.66)
Constant -14.896*** -12.515*** -14.326*** -12.264*** -13.095***(10.59) (8.75) (8.85) (8.47) ( 8.96)
Observations 12,541 12541 12,541 12,541 12,541
Absolute value of z statistics in parentheses* significant at 10%; ** significant at 5% ; *** significant at 1%
28
EXTENT AND DETERMINANTS OF CHILD LABOUR IN UGANDA 29
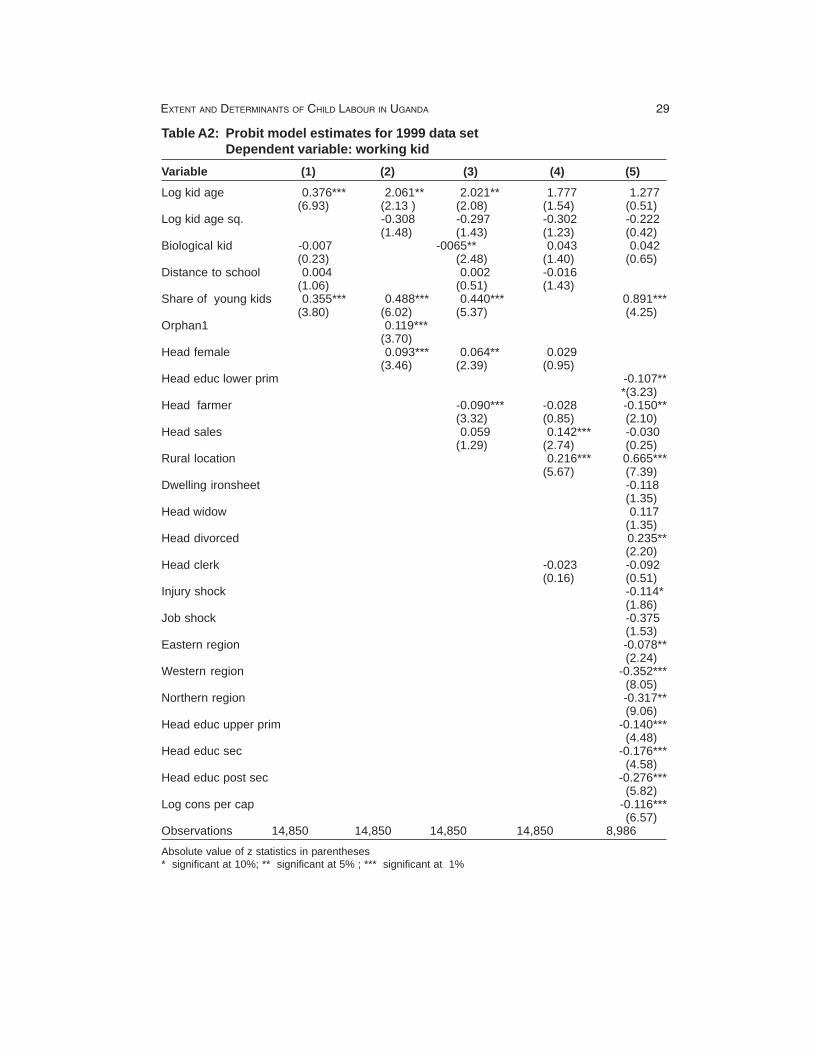
Table A2: Probit model estimates for 1999 data setDependent variable: working kid
Variable (1) (2) (3) (4) (5)
Log kid age 0.376*** 2.061** 2.021** 1.777 1.277(6.93) (2.13 ) (2.08) (1.54) (0.51)
Log kid age sq. -0.308 -0.297 -0.302 -0.222(1.48) (1.43) (1.23) (0.42)
Biological kid -0.007 -0065** 0.043 0.042(0.23) (2.48) (1.40) (0.65)
Distance to school 0.004 0.002 -0.016(1.06) (0.51) (1.43)
Share of young kids 0.355*** 0.488*** 0.440*** 0.891***(3.80) (6.02) (5.37) (4.25)
Orphan1 0.119***(3.70)
Head female 0.093*** 0.064** 0.029(3.46) (2.39) (0.95)
Head educ lower prim -0.107***(3.23)
Head farmer -0.090*** -0.028 -0.150**(3.32) (0.85) (2.10)
Head sales 0.059 0.142*** -0.030(1.29) (2.74) (0.25)
Rural location 0.216*** 0.665***(5.67) (7.39)
Dwelling ironsheet -0.118(1.35)
Head widow 0.117(1.35)
Head divorced 0.235**(2.20)
Head clerk -0.023 -0.092(0.16) (0.51)
Injury shock -0.114*(1.86)
Job shock -0.375(1.53)
Eastern region -0.078**(2.24)
Western region -0.352***(8.05)
Northern region -0.317**(9.06)
Head educ upper prim -0.140***(4.48)
Head educ sec -0.176***(4.58)
Head educ post sec -0.276***(5.82)
Log cons per cap -0.116***(6.57)
Observations 14,850 14,850 14,850 14,850 8,986
Absolute value of z statistics in parentheses* significant at 10%; ** significant at 5% ; *** significant at 1%
30 RESEARCH PAPER 167
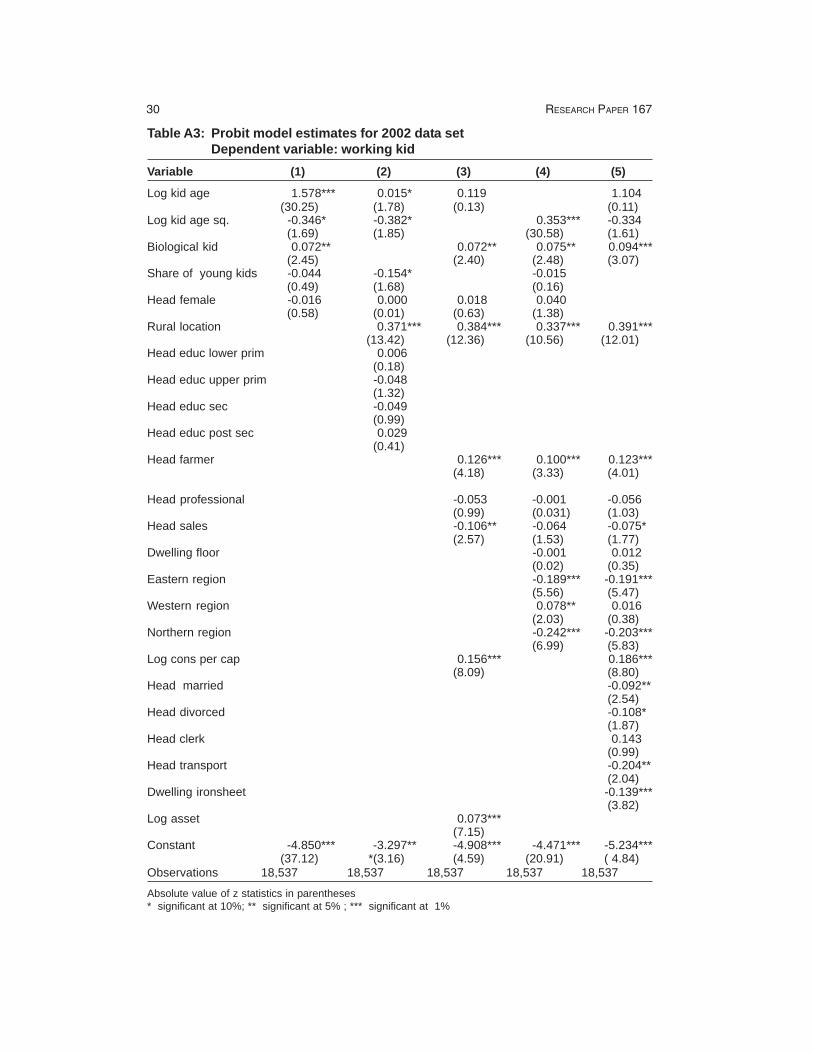
Table A3: Probit model estimates for 2002 data setDependent variable: working kid
Variable (1) (2) (3) (4) (5)
Log kid age 1.578*** 0.015* 0.119 1.104(30.25) (1.78) (0.13) (0.11)
Log kid age sq. -0.346* -0.382* 0.353*** -0.334(1.69) (1.85) (30.58) (1.61)
Biological kid 0.072** 0.072** 0.075** 0.094***(2.45) (2.40) (2.48) (3.07)
Share of young kids -0.044 -0.154* -0.015(0.49) (1.68) (0.16)
Head female -0.016 0.000 0.018 0.040(0.58) (0.01) (0.63) (1.38)
Rural location 0.371*** 0.384*** 0.337*** 0.391***(13.42) (12.36) (10.56) (12.01)
Head educ lower prim 0.006(0.18)
Head educ upper prim -0.048(1.32)
Head educ sec -0.049(0.99)
Head educ post sec 0.029(0.41)
Head farmer 0.126*** 0.100*** 0.123***(4.18) (3.33) (4.01)
Head professional -0.053 -0.001 -0.056(0.99) (0.031) (1.03)
Head sales -0.106** -0.064 -0.075*(2.57) (1.53) (1.77)
Dwelling floor -0.001 0.012(0.02) (0.35)
Eastern region -0.189*** -0.191***(5.56) (5.47)
Western region 0.078** 0.016(2.03) (0.38)
Northern region -0.242*** -0.203***(6.99) (5.83)
Log cons per cap 0.156*** 0.186***(8.09) (8.80)
Head married -0.092**(2.54)
Head divorced -0.108*(1.87)
Head clerk 0.143(0.99)
Head transport -0.204**(2.04)
Dwelling ironsheet -0.139***(3.82)
Log asset 0.073***(7.15)
Constant -4.850*** -3.297** -4.908*** -4.471*** -5.234***(37.12) *(3.16) (4.59) (20.91) ( 4.84)
Observations 18,537 18,537 18,537 18,537 18,537
Absolute value of z statistics in parentheses* significant at 10%; ** significant at 5% ; *** significant at 1%
EXTENT AND DETERMINANTS OF CHILD LABOUR IN UGANDA 31
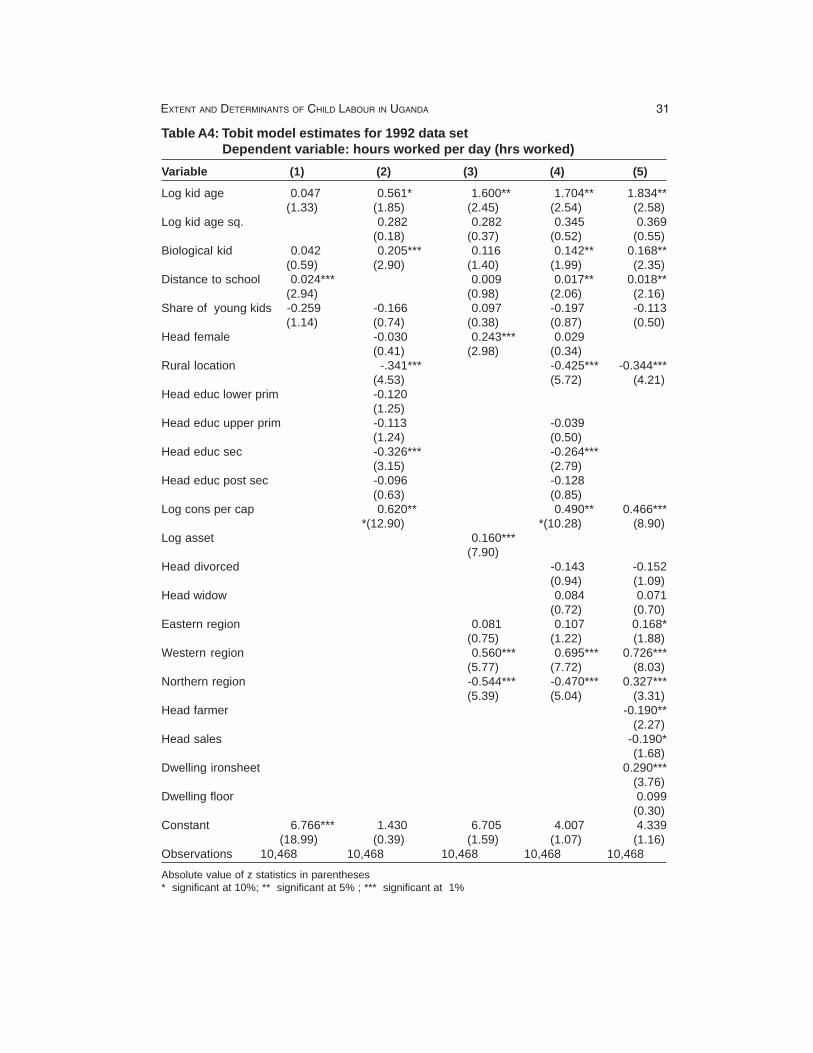
Table A4: Tobit model estimates for 1992 data set Dependent variable: hours worked per day (hrs worked)Variable (1) (2) (3) (4) (5)
Log kid age 0.047 0.561* 1.600** 1.704** 1.834**(1.33) (1.85) (2.45) (2.54) (2.58)
Log kid age sq. 0.282 0.282 0.345 0.369(0.18) (0.37) (0.52) (0.55)
Biological kid 0.042 0.205*** 0.116 0.142** 0.168**(0.59) (2.90) (1.40) (1.99) (2.35)
Distance to school 0.024*** 0.009 0.017** 0.018**(2.94) (0.98) (2.06) (2.16)
Share of young kids -0.259 -0.166 0.097 -0.197 -0.113(1.14) (0.74) (0.38) (0.87) (0.50)
Head female -0.030 0.243*** 0.029(0.41) (2.98) (0.34)
Rural location -.341*** -0.425*** -0.344***(4.53) (5.72) (4.21)
Head educ lower prim -0.120(1.25)
Head educ upper prim -0.113 -0.039(1.24) (0.50)
Head educ sec -0.326*** -0.264***(3.15) (2.79)
Head educ post sec -0.096 -0.128(0.63) (0.85)
Log cons per cap 0.620** 0.490** 0.466****(12.90) *(10.28) (8.90)
Log asset 0.160***(7.90)
Head divorced -0.143 -0.152(0.94) (1.09)
Head widow 0.084 0.071(0.72) (0.70)
Eastern region 0.081 0.107 0.168*(0.75) (1.22) (1.88)
Western region 0.560*** 0.695*** 0.726***(5.77) (7.72) (8.03)
Northern region -0.544*** -0.470*** 0.327***(5.39) (5.04) (3.31)
Head farmer -0.190**(2.27)
Head sales -0.190*(1.68)
Dwelling ironsheet 0.290***(3.76)
Dwelling floor 0.099(0.30)
Constant 6.766*** 1.430 6.705 4.007 4.339(18.99) (0.39) (1.59) (1.07) (1.16)
Observations 10,468 10,468 10,468 10,468 10,468
Absolute value of z statistics in parentheses* significant at 10%; ** significant at 5% ; *** significant at 1%
32 RESEARCH PAPER 167
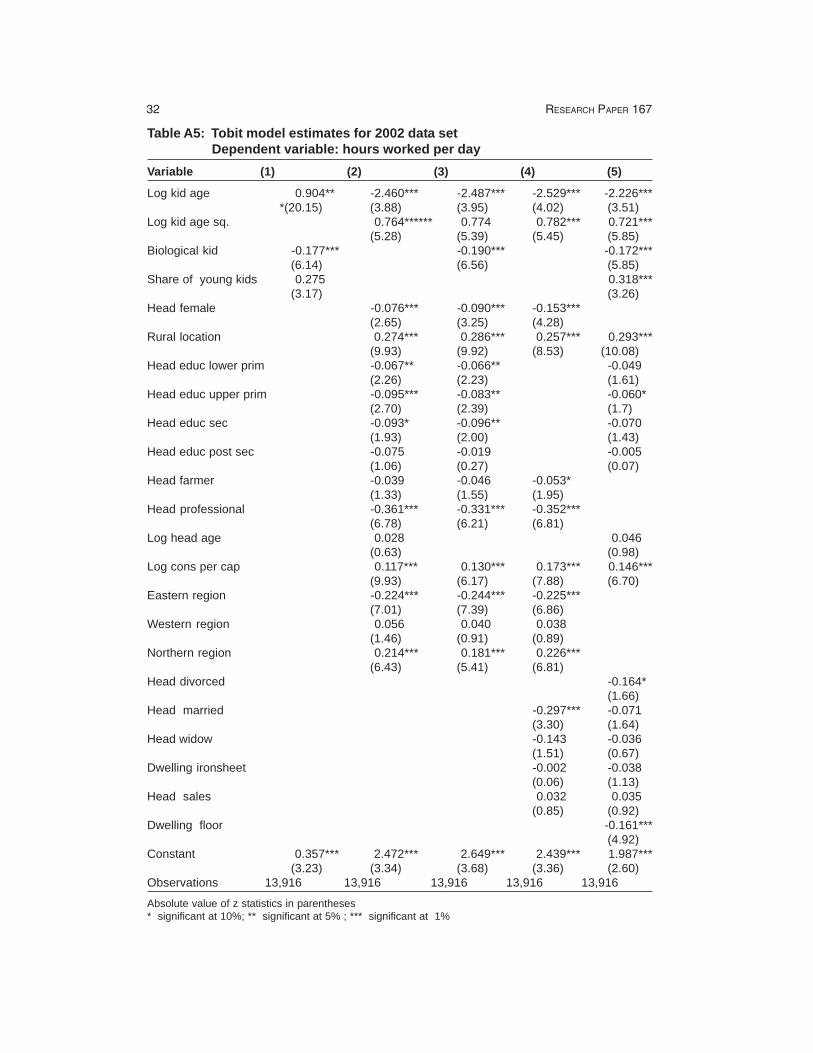
Table A5: Tobit model estimates for 2002 data set Dependent variable: hours worked per dayVariable (1) (2) (3) (4) (5)
Log kid age 0.904** -2.460*** -2.487*** -2.529*** -2.226****(20.15) (3.88) (3.95) (4.02) (3.51)
Log kid age sq. 0.764****** 0.774 0.782*** 0.721***(5.28) (5.39) (5.45) (5.85)
Biological kid -0.177*** -0.190*** -0.172***(6.14) (6.56) (5.85)
Share of young kids 0.275 0.318***(3.17) (3.26)
Head female -0.076*** -0.090*** -0.153***(2.65) (3.25) (4.28)
Rural location 0.274*** 0.286*** 0.257*** 0.293***(9.93) (9.92) (8.53) (10.08)
Head educ lower prim -0.067** -0.066** -0.049(2.26) (2.23) (1.61)
Head educ upper prim -0.095*** -0.083** -0.060*(2.70) (2.39) (1.7)
Head educ sec -0.093* -0.096** -0.070(1.93) (2.00) (1.43)
Head educ post sec -0.075 -0.019 -0.005(1.06) (0.27) (0.07)
Head farmer -0.039 -0.046 -0.053*(1.33) (1.55) (1.95)
Head professional -0.361*** -0.331*** -0.352***(6.78) (6.21) (6.81)
Log head age 0.028 0.046(0.63) (0.98)
Log cons per cap 0.117*** 0.130*** 0.173*** 0.146***(9.93) (6.17) (7.88) (6.70)
Eastern region -0.224*** -0.244*** -0.225***(7.01) (7.39) (6.86)
Western region 0.056 0.040 0.038(1.46) (0.91) (0.89)
Northern region 0.214*** 0.181*** 0.226***(6.43) (5.41) (6.81)
Head divorced -0.164*(1.66)
Head married -0.297*** -0.071(3.30) (1.64)
Head widow -0.143 -0.036(1.51) (0.67)
Dwelling ironsheet -0.002 -0.038(0.06) (1.13)
Head sales 0.032 0.035(0.85) (0.92)
Dwelling floor -0.161***(4.92)
Constant 0.357*** 2.472*** 2.649*** 2.439*** 1.987***(3.23) (3.34) (3.68) (3.36) (2.60)
Observations 13,916 13,916 13,916 13,916 13,916
Absolute value of z statistics in parentheses* significant at 10%; ** significant at 5% ; *** significant at 1%
EXTENT AND DETERMINANTS OF CHILD LABOUR IN UGANDA 33
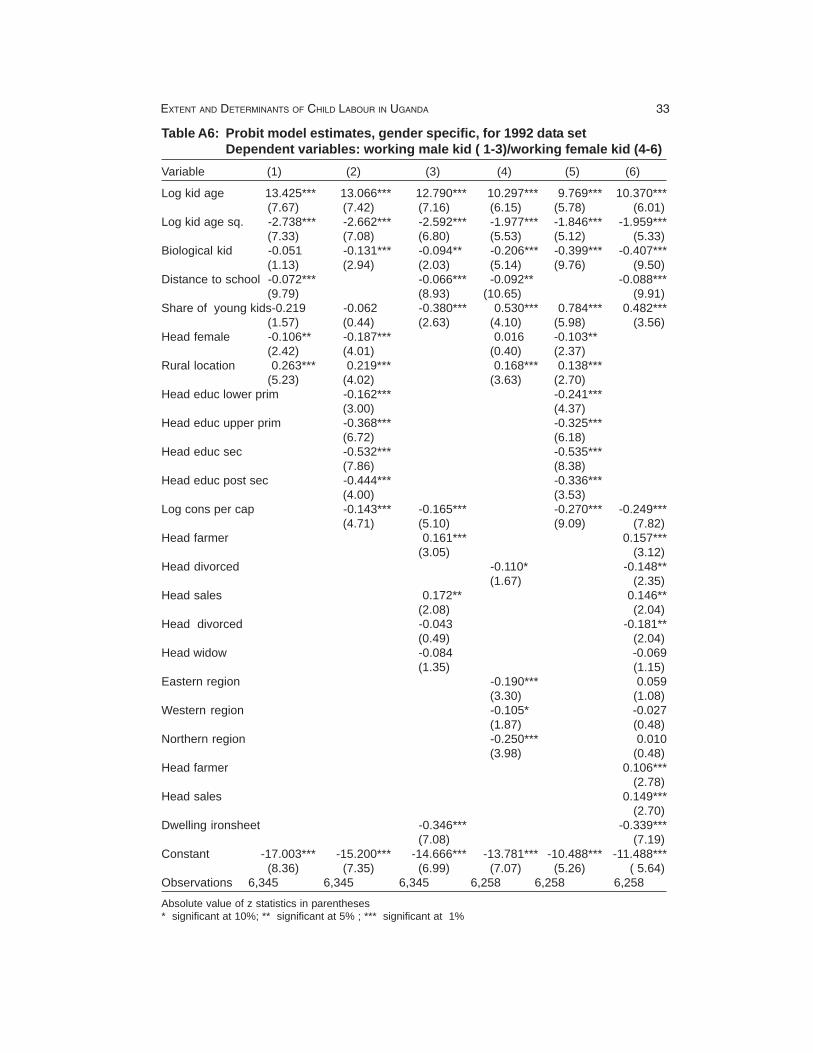
Table A6: Probit model estimates, gender specific, for 1992 data set Dependent variables: working male kid ( 1-3)/working female kid (4-6)Variable (1) (2) (3) (4) (5) (6)
Log kid age 13.425*** 13.066*** 12.790*** 10.297*** 9.769*** 10.370***(7.67) (7.42) (7.16) (6.15) (5.78) (6.01)
Log kid age sq. -2.738*** -2.662*** -2.592*** -1.977*** -1.846*** -1.959***(7.33) (7.08) (6.80) (5.53) (5.12) (5.33)
Biological kid -0.051 -0.131*** -0.094** -0.206*** -0.399*** -0.407***(1.13) (2.94) (2.03) (5.14) (9.76) (9.50)
Distance to school -0.072*** -0.066*** -0.092** -0.088***(9.79) (8.93) (10.65) (9.91)
Share of young kids-0.219 -0.062 -0.380*** 0.530*** 0.784*** 0.482***(1.57) (0.44) (2.63) (4.10) (5.98) (3.56)
Head female -0.106** -0.187*** 0.016 -0.103**(2.42) (4.01) (0.40) (2.37)
Rural location 0.263*** 0.219*** 0.168*** 0.138***(5.23) (4.02) (3.63) (2.70)
Head educ lower prim -0.162*** -0.241***(3.00) (4.37)
Head educ upper prim -0.368*** -0.325***(6.72) (6.18)
Head educ sec -0.532*** -0.535***(7.86) (8.38)
Head educ post sec -0.444*** -0.336***(4.00) (3.53)
Log cons per cap -0.143*** -0.165*** -0.270*** -0.249***(4.71) (5.10) (9.09) (7.82)
Head farmer 0.161*** 0.157***(3.05) (3.12)
Head divorced -0.110* -0.148**(1.67) (2.35)
Head sales 0.172** 0.146**(2.08) (2.04)
Head divorced -0.043 -0.181**(0.49) (2.04)
Head widow -0.084 -0.069(1.35) (1.15)
Eastern region -0.190*** 0.059(3.30) (1.08)
Western region -0.105* -0.027(1.87) (0.48)
Northern region -0.250*** 0.010(3.98) (0.48)
Head farmer 0.106***(2.78)
Head sales 0.149***(2.70)
Dwelling ironsheet -0.346*** -0.339***(7.08) (7.19)
Constant -17.003*** -15.200*** -14.666*** -13.781*** -10.488*** -11.488***(8.36) (7.35) (6.99) (7.07) (5.26) ( 5.64)
Observations 6,345 6,345 6,345 6,258 6,258 6,258
Absolute value of z statistics in parentheses* significant at 10%; ** significant at 5% ; *** significant at 1%
34 RESEARCH PAPER 167
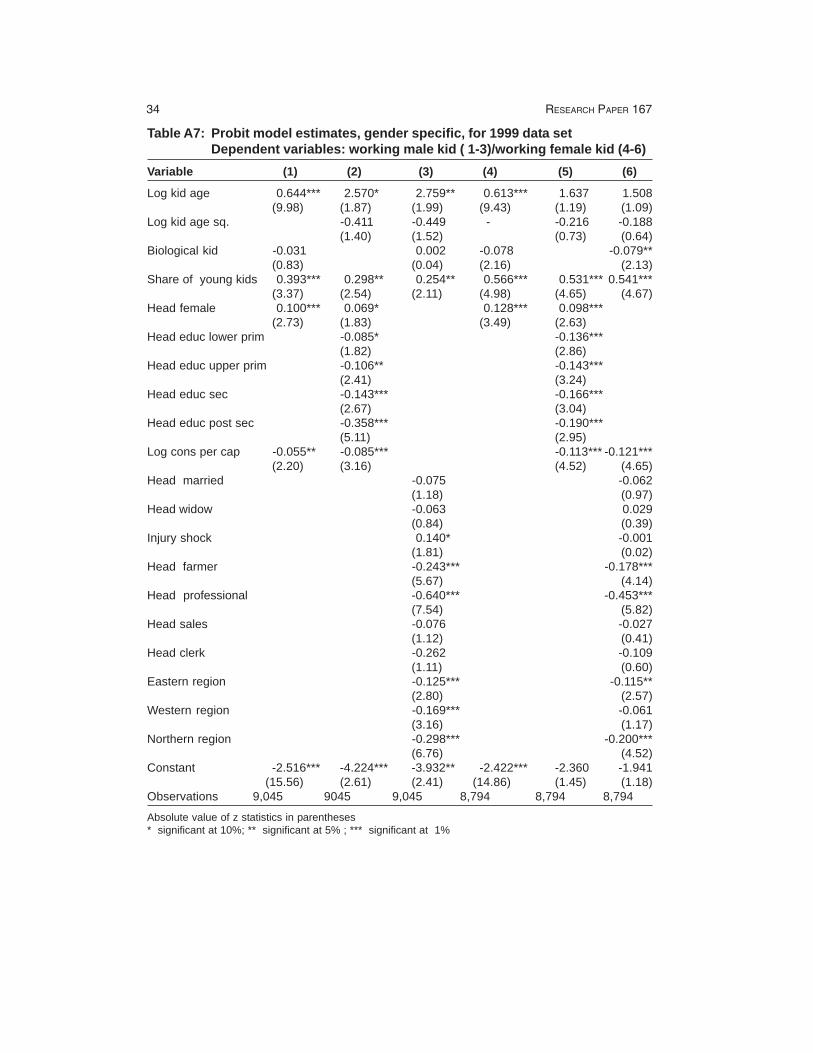
Table A7: Probit model estimates, gender specific, for 1999 data setDependent variables: working male kid ( 1-3)/working female kid (4-6)
Variable (1) (2) (3) (4) (5) (6)
Log kid age 0.644*** 2.570* 2.759** 0.613*** 1.637 1.508(9.98) (1.87) (1.99) (9.43) (1.19) (1.09)
Log kid age sq. -0.411 -0.449 - -0.216 -0.188(1.40) (1.52) (0.73) (0.64)
Biological kid -0.031 0.002 -0.078 -0.079**(0.83) (0.04) (2.16) (2.13)
Share of young kids 0.393*** 0.298** 0.254** 0.566*** 0.531*** 0.541***(3.37) (2.54) (2.11) (4.98) (4.65) (4.67)
Head female 0.100*** 0.069* 0.128*** 0.098***(2.73) (1.83) (3.49) (2.63)
Head educ lower prim -0.085* -0.136***(1.82) (2.86)
Head educ upper prim -0.106** -0.143***(2.41) (3.24)
Head educ sec -0.143*** -0.166***(2.67) (3.04)
Head educ post sec -0.358*** -0.190***(5.11) (2.95)
Log cons per cap -0.055** -0.085*** -0.113*** -0.121***(2.20) (3.16) (4.52) (4.65)
Head married -0.075 -0.062(1.18) (0.97)
Head widow -0.063 0.029(0.84) (0.39)
Injury shock 0.140* -0.001(1.81) (0.02)
Head farmer -0.243*** -0.178***(5.67) (4.14)
Head professional -0.640*** -0.453***(7.54) (5.82)
Head sales -0.076 -0.027(1.12) (0.41)
Head clerk -0.262 -0.109(1.11) (0.60)
Eastern region -0.125*** -0.115**(2.80) (2.57)
Western region -0.169*** -0.061(3.16) (1.17)
Northern region -0.298*** -0.200***(6.76) (4.52)
Constant -2.516*** -4.224*** -3.932** -2.422*** -2.360 -1.941(15.56) (2.61) (2.41) (14.86) (1.45) (1.18)
Observations 9,045 9045 9,045 8,794 8,794 8,794
Absolute value of z statistics in parentheses* significant at 10%; ** significant at 5% ; *** significant at 1%
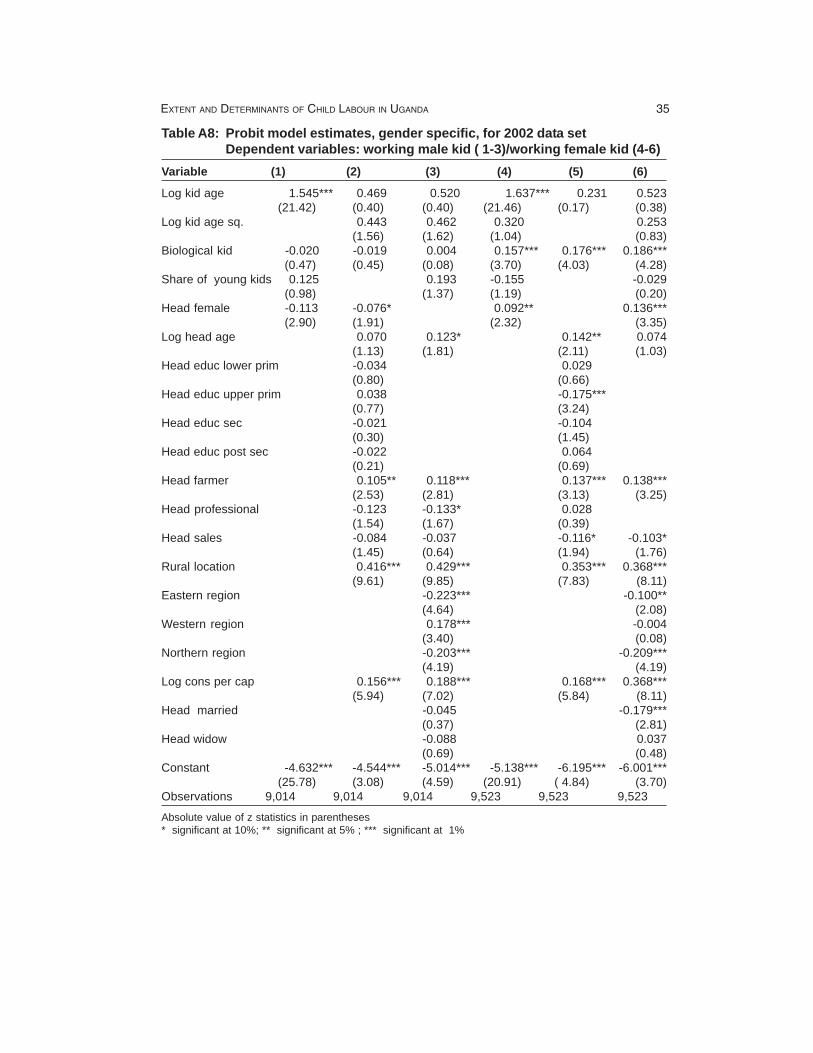
EXTENT AND DETERMINANTS OF CHILD LABOUR IN UGANDA 35
Table A8: Probit model estimates, gender specific, for 2002 data setDependent variables: working male kid ( 1-3)/working female kid (4-6)
Variable (1) (2) (3) (4) (5) (6)
Log kid age 1.545*** 0.469 0.520 1.637*** 0.231 0.523(21.42) (0.40) (0.40) (21.46) (0.17) (0.38)
Log kid age sq. 0.443 0.462 0.320 0.253(1.56) (1.62) (1.04) (0.83)
Biological kid -0.020 -0.019 0.004 0.157*** 0.176*** 0.186***(0.47) (0.45) (0.08) (3.70) (4.03) (4.28)
Share of young kids 0.125 0.193 -0.155 -0.029(0.98) (1.37) (1.19) (0.20)
Head female -0.113 -0.076* 0.092** 0.136***(2.90) (1.91) (2.32) (3.35)
Log head age 0.070 0.123* 0.142** 0.074(1.13) (1.81) (2.11) (1.03)
Head educ lower prim -0.034 0.029(0.80) (0.66)
Head educ upper prim 0.038 -0.175***(0.77) (3.24)
Head educ sec -0.021 -0.104(0.30) (1.45)
Head educ post sec -0.022 0.064(0.21) (0.69)
Head farmer 0.105** 0.118*** 0.137*** 0.138***(2.53) (2.81) (3.13) (3.25)
Head professional -0.123 -0.133* 0.028(1.54) (1.67) (0.39)
Head sales -0.084 -0.037 -0.116* -0.103*(1.45) (0.64) (1.94) (1.76)
Rural location 0.416*** 0.429*** 0.353*** 0.368***(9.61) (9.85) (7.83) (8.11)
Eastern region -0.223*** -0.100**(4.64) (2.08)
Western region 0.178*** -0.004(3.40) (0.08)
Northern region -0.203*** -0.209***(4.19) (4.19)
Log cons per cap 0.156*** 0.188*** 0.168*** 0.368***(5.94) (7.02) (5.84) (8.11)
Head married -0.045 -0.179***(0.37) (2.81)
Head widow -0.088 0.037(0.69) (0.48)
Constant -4.632*** -4.544*** -5.014*** -5.138*** -6.195*** -6.001***(25.78) (3.08) (4.59) (20.91) ( 4.84) (3.70)
Observations 9,014 9,014 9,014 9,523 9,523 9,523
Absolute value of z statistics in parentheses* significant at 10%; ** significant at 5% ; *** significant at 1%
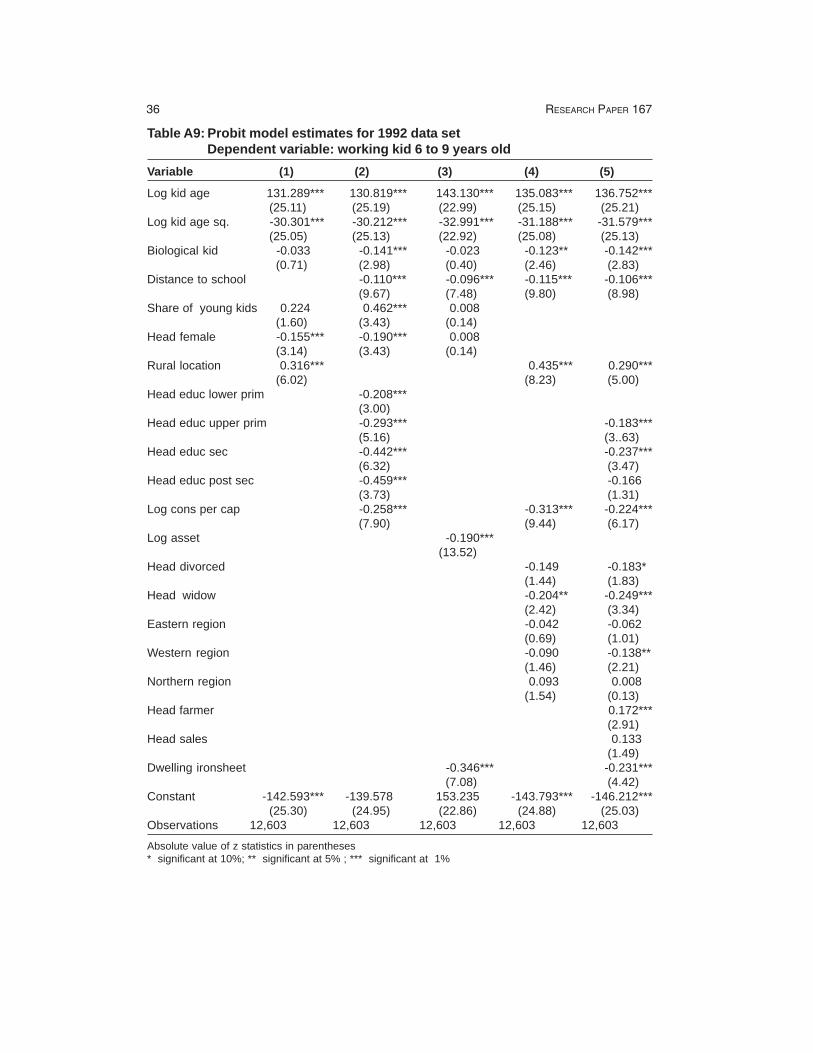
36 RESEARCH PAPER 167
Table A9: Probit model estimates for 1992 data setDependent variable: working kid 6 to 9 years old
Variable (1) (2) (3) (4) (5)
Log kid age 131.289*** 130.819*** 143.130*** 135.083*** 136.752***(25.11) (25.19) (22.99) (25.15) (25.21)
Log kid age sq. -30.301*** -30.212*** -32.991*** -31.188*** -31.579***(25.05) (25.13) (22.92) (25.08) (25.13)
Biological kid -0.033 -0.141*** -0.023 -0.123** -0.142***(0.71) (2.98) (0.40) (2.46) (2.83)
Distance to school -0.110*** -0.096*** -0.115*** -0.106***(9.67) (7.48) (9.80) (8.98)
Share of young kids 0.224 0.462*** 0.008(1.60) (3.43) (0.14)
Head female -0.155*** -0.190*** 0.008(3.14) (3.43) (0.14)
Rural location 0.316*** 0.435*** 0.290***(6.02) (8.23) (5.00)
Head educ lower prim -0.208***(3.00)
Head educ upper prim -0.293*** -0.183***(5.16) (3..63)
Head educ sec -0.442*** -0.237***(6.32) (3.47)
Head educ post sec -0.459*** -0.166(3.73) (1.31)
Log cons per cap -0.258*** -0.313*** -0.224***(7.90) (9.44) (6.17)
Log asset -0.190***(13.52)
Head divorced -0.149 -0.183*(1.44) (1.83)
Head widow -0.204** -0.249***(2.42) (3.34)
Eastern region -0.042 -0.062(0.69) (1.01)
Western region -0.090 -0.138**(1.46) (2.21)
Northern region 0.093 0.008(1.54) (0.13)
Head farmer 0.172***(2.91)
Head sales 0.133(1.49)
Dwelling ironsheet -0.346*** -0.231***(7.08) (4.42)
Constant -142.593*** -139.578 153.235 -143.793*** -146.212***(25.30) (24.95) (22.86) (24.88) (25.03)
Observations 12,603 12,603 12,603 12,603 12,603
Absolute value of z statistics in parentheses* significant at 10%; ** significant at 5% ; *** significant at 1%

EXTENT AND DETERMINANTS OF CHILD LABOUR IN UGANDA 37
Table A10: Probit model estimates for 1992 data set Dependent variable: working kid 10 to 14 years oldVariable (1) (2) (3) (4) (5)
Log kid age 70.454*** 72.540*** 70.222*** 71.049*** 73.230***(12.90) (13.28) (11.17) (12.88) (13.06)
Log kid age sq. -13.454*** -13.850*** -13.356*** -13.553*** 13.967***(12.42) (12.79) (10.72) (12.39) (12.57)
Biological kid -0.221*** -0.372*** -0.193*** -0.314 -0.329(5.87) (9.74) (4.28) (8.01) (8.21)
Distance to school -0.073*** -0.085*** -0.071*** -0.063***(11.32) (10.09) (10.95) (9.64)
Share of young kids 0.123 0.325** -0.254* 0.093 0.011(0.97) (2.54) (1.70) (0.71) (0.08)
Head female -0.108*** -0.067 0.023(2.65) (1.46) (0.48)
Rural location 0.123*** 0210*** 0.073(2.77) (4.75) (1.48)
Head educ lower prim -0.204***(4.00)
Head educ upper prim -0.379*** -0.302***(7.57) (6.47)
Head educ sec -0.595*** -0.418***(9.70) (6.79)
Head educ post sec -0.379*** -0.132(4.23) (1.41)
Log cons per cap -0.148*** -0.221*** -0.133***(5.40) (7.89) (4.28)
Log asset -0.137***(11.82)
Head divorced -0.079 -0.106(0.94) (1.30)
Head widow -0.027 -0.060(0.42) (1.09)
Eastern region 0.029 -0.009(0.57) (0.17)
Western region 0.041 -0.034(0.79) (0.64)
Northern region 0.033 -0.173***(0.61) (2.93)
Log Head age -0.209***(2.96)
Head farmer 0.028(0.56)
Head sales 0.194***(2.76)
Dwelling ironsheet -0.369***(8.04)
Constant -92.566*** -93.689*** -90.880*** -91.355*** -93.818***(13.46) (13.63) (11.50) (13.16) (13.29)
Observations 12,603 12,603 12,603 12,603 12,603
Absolute value of z statistics in parentheses* significant at 10%; ** significant at 5% ; *** significant at 1%
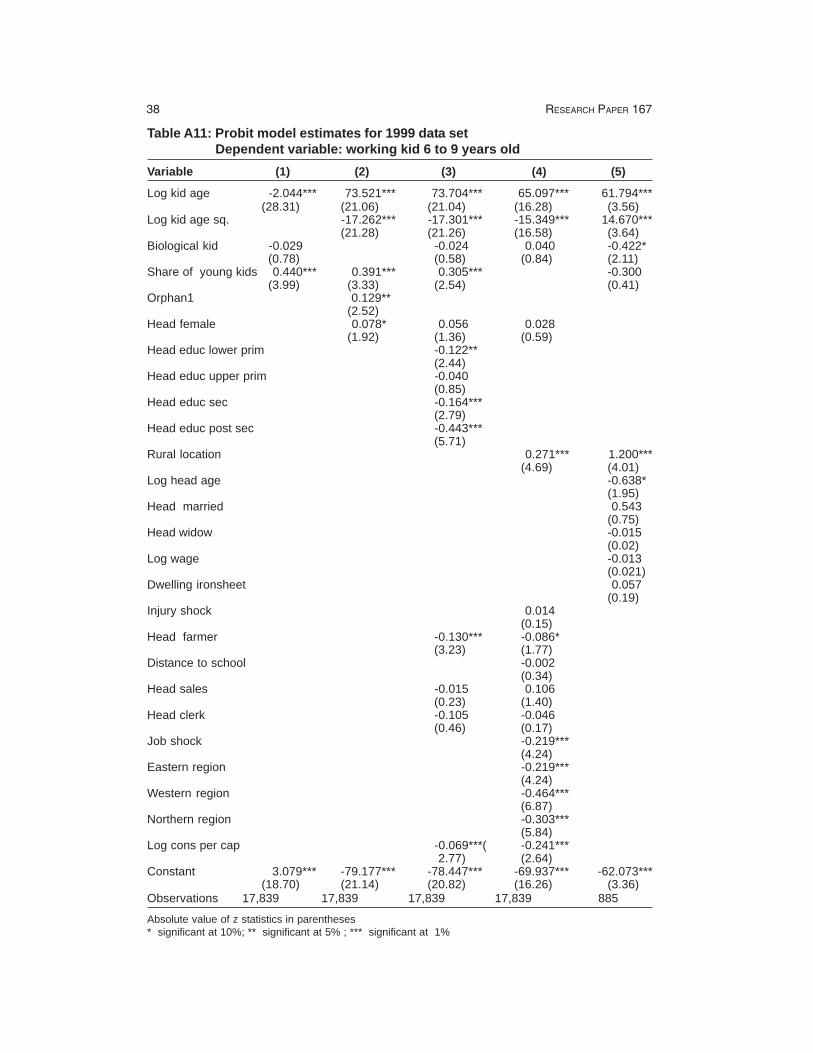
38 RESEARCH PAPER 167
Table A11: Probit model estimates for 1999 data set Dependent variable: working kid 6 to 9 years oldVariable (1) (2) (3) (4) (5)
Log kid age -2.044*** 73.521*** 73.704*** 65.097*** 61.794***(28.31) (21.06) (21.04) (16.28) (3.56)
Log kid age sq. -17.262*** -17.301*** -15.349*** 14.670***(21.28) (21.26) (16.58) (3.64)
Biological kid -0.029 -0.024 0.040 -0.422*(0.78) (0.58) (0.84) (2.11)
Share of young kids 0.440*** 0.391*** 0.305*** -0.300(3.99) (3.33) (2.54) (0.41)
Orphan1 0.129**(2.52)
Head female 0.078* 0.056 0.028(1.92) (1.36) (0.59)
Head educ lower prim -0.122**(2.44)
Head educ upper prim -0.040(0.85)
Head educ sec -0.164***(2.79)
Head educ post sec -0.443***(5.71)
Rural location 0.271*** 1.200***(4.69) (4.01)
Log head age -0.638*(1.95)
Head married 0.543(0.75)
Head widow -0.015(0.02)
Log wage -0.013(0.021)
Dwelling ironsheet 0.057(0.19)
Injury shock 0.014(0.15)
Head farmer -0.130*** -0.086*(3.23) (1.77)
Distance to school -0.002(0.34)
Head sales -0.015 0.106(0.23) (1.40)
Head clerk -0.105 -0.046(0.46) (0.17)
Job shock -0.219***(4.24)
Eastern region -0.219***(4.24)
Western region -0.464***(6.87)
Northern region -0.303***(5.84)
Log cons per cap -0.069***( -0.241***2.77) (2.64)
Constant 3.079*** -79.177*** -78.447*** -69.937*** -62.073***(18.70) (21.14) (20.82) (16.26) (3.36)
Observations 17,839 17,839 17,839 17,839 885
Absolute value of z statistics in parentheses* significant at 10%; ** significant at 5% ; *** significant at 1%
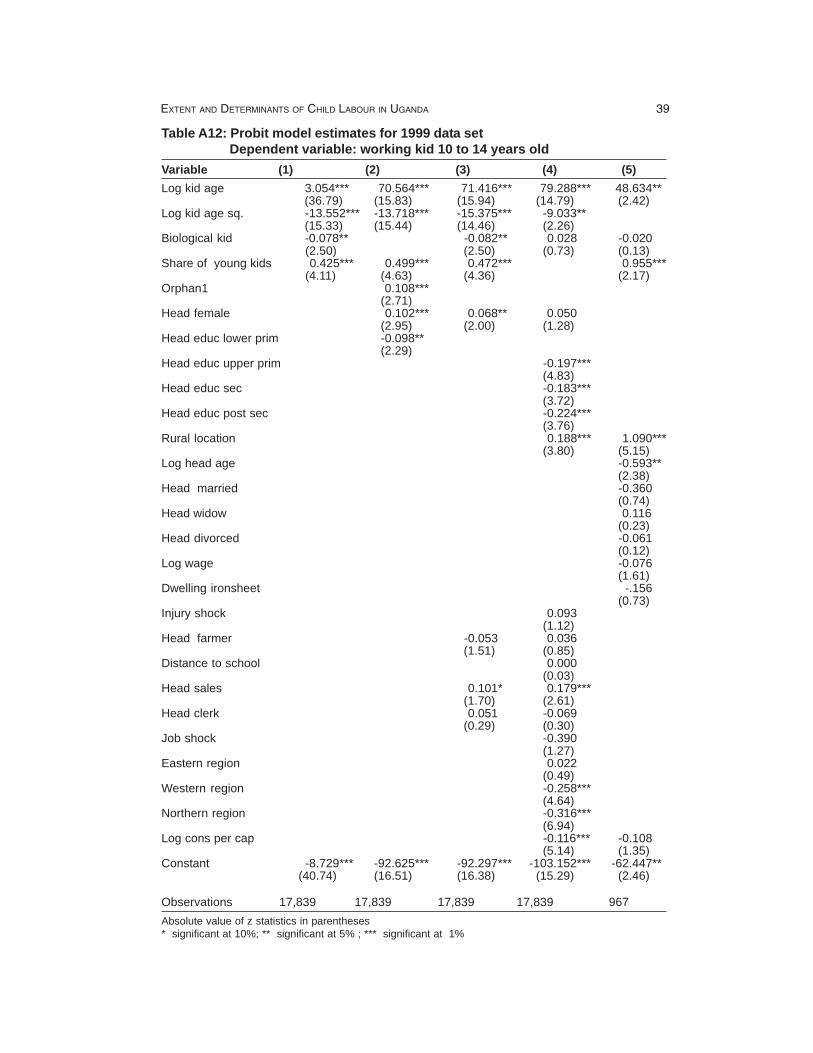
EXTENT AND DETERMINANTS OF CHILD LABOUR IN UGANDA 39
Table A12: Probit model estimates for 1999 data set Dependent variable: working kid 10 to 14 years oldVariable (1) (2) (3) (4) (5)Log kid age 3.054*** 70.564*** 71.416*** 79.288*** 48.634**
(36.79) (15.83) (15.94) (14.79) (2.42)Log kid age sq. -13.552*** -13.718*** -15.375*** -9.033**
(15.33) (15.44) (14.46) (2.26)Biological kid -0.078** -0.082** 0.028 -0.020
(2.50) (2.50) (0.73) (0.13)Share of young kids 0.425*** 0.499*** 0.472*** 0.955***
(4.11) (4.63) (4.36) (2.17)Orphan1 0.108***
(2.71)Head female 0.102*** 0.068** 0.050
(2.95) (2.00) (1.28)Head educ lower prim -0.098**
(2.29)Head educ upper prim -0.197***
(4.83)Head educ sec -0.183***
(3.72)Head educ post sec -0.224***
(3.76)Rural location 0.188*** 1.090***
(3.80) (5.15)Log head age -0.593**
(2.38)Head married -0.360
(0.74)Head widow 0.116
(0.23)Head divorced -0.061
(0.12)Log wage -0.076
(1.61)Dwelling ironsheet -.156
(0.73)Injury shock 0.093
(1.12)Head farmer -0.053 0.036
(1.51) (0.85)Distance to school 0.000
(0.03)Head sales 0.101* 0.179***
(1.70) (2.61)Head clerk 0.051 -0.069
(0.29) (0.30)Job shock -0.390
(1.27)Eastern region 0.022
(0.49)Western region -0.258***
(4.64)Northern region -0.316***
(6.94)Log cons per cap -0.116*** -0.108
(5.14) (1.35)Constant -8.729*** -92.625*** -92.297*** -103.152*** -62.447**
(40.74) (16.51) (16.38) (15.29) (2.46)
Observations 17,839 17,839 17,839 17,839 967Absolute value of z statistics in parentheses* significant at 10%; ** significant at 5% ; *** significant at 1%
40 RESEARCH PAPER 167
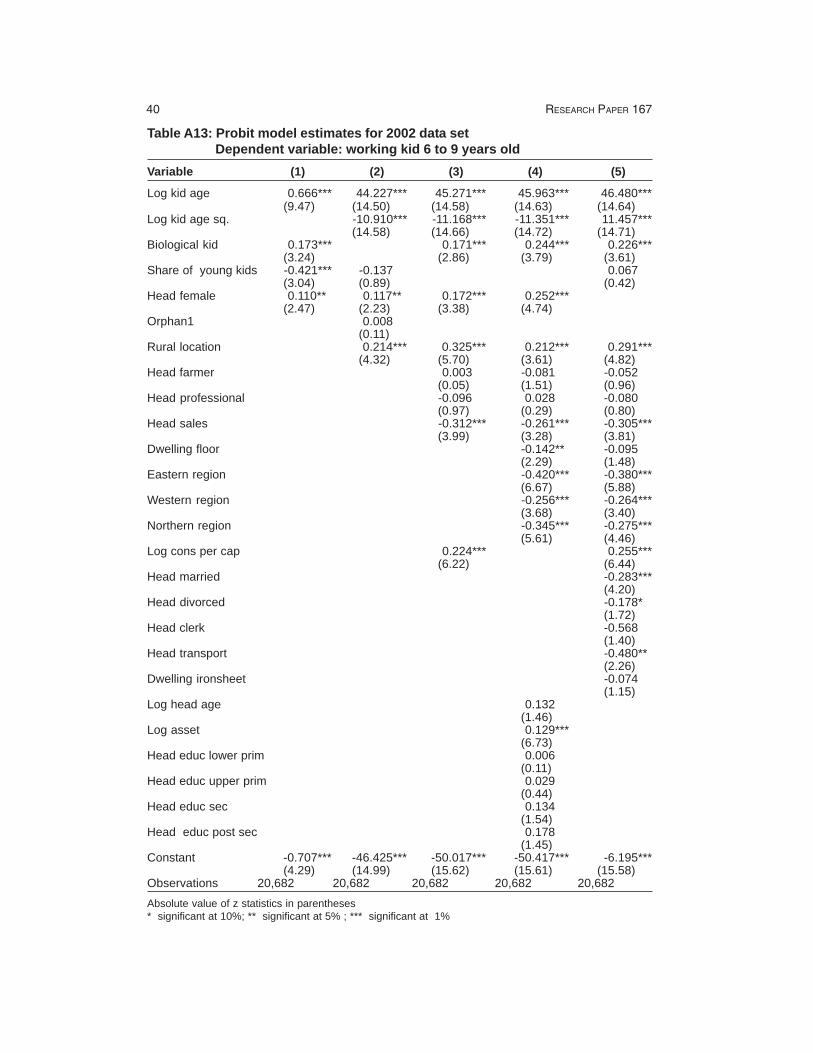
Table A13: Probit model estimates for 2002 data set Dependent variable: working kid 6 to 9 years oldVariable (1) (2) (3) (4) (5)
Log kid age 0.666*** 44.227*** 45.271*** 45.963*** 46.480***(9.47) (14.50) (14.58) (14.63) (14.64)
Log kid age sq. -10.910*** -11.168*** -11.351*** 11.457***(14.58) (14.66) (14.72) (14.71)
Biological kid 0.173*** 0.171*** 0.244*** 0.226***(3.24) (2.86) (3.79) (3.61)
Share of young kids -0.421*** -0.137 0.067(3.04) (0.89) (0.42)
Head female 0.110** 0.117** 0.172*** 0.252***(2.47) (2.23) (3.38) (4.74)
Orphan1 0.008(0.11)
Rural location 0.214*** 0.325*** 0.212*** 0.291***(4.32) (5.70) (3.61) (4.82)
Head farmer 0.003 -0.081 -0.052(0.05) (1.51) (0.96)
Head professional -0.096 0.028 -0.080(0.97) (0.29) (0.80)
Head sales -0.312*** -0.261*** -0.305***(3.99) (3.28) (3.81)
Dwelling floor -0.142** -0.095(2.29) (1.48)
Eastern region -0.420*** -0.380***(6.67) (5.88)
Western region -0.256*** -0.264***(3.68) (3.40)
Northern region -0.345*** -0.275***(5.61) (4.46)
Log cons per cap 0.224*** 0.255***(6.22) (6.44)
Head married -0.283***(4.20)
Head divorced -0.178*(1.72)
Head clerk -0.568(1.40)
Head transport -0.480**(2.26)
Dwelling ironsheet -0.074(1.15)
Log head age 0.132(1.46)
Log asset 0.129***(6.73)
Head educ lower prim 0.006(0.11)
Head educ upper prim 0.029(0.44)
Head educ sec 0.134(1.54)
Head educ post sec 0.178(1.45)
Constant -0.707*** -46.425*** -50.017*** -50.417*** -6.195***(4.29) (14.99) (15.62) (15.61) (15.58)
Observations 20,682 20,682 20,682 20,682 20,682
Absolute value of z statistics in parentheses* significant at 10%; ** significant at 5% ; *** significant at 1%
EXTENT AND DETERMINANTS OF CHILD LABOUR IN UGANDA 41
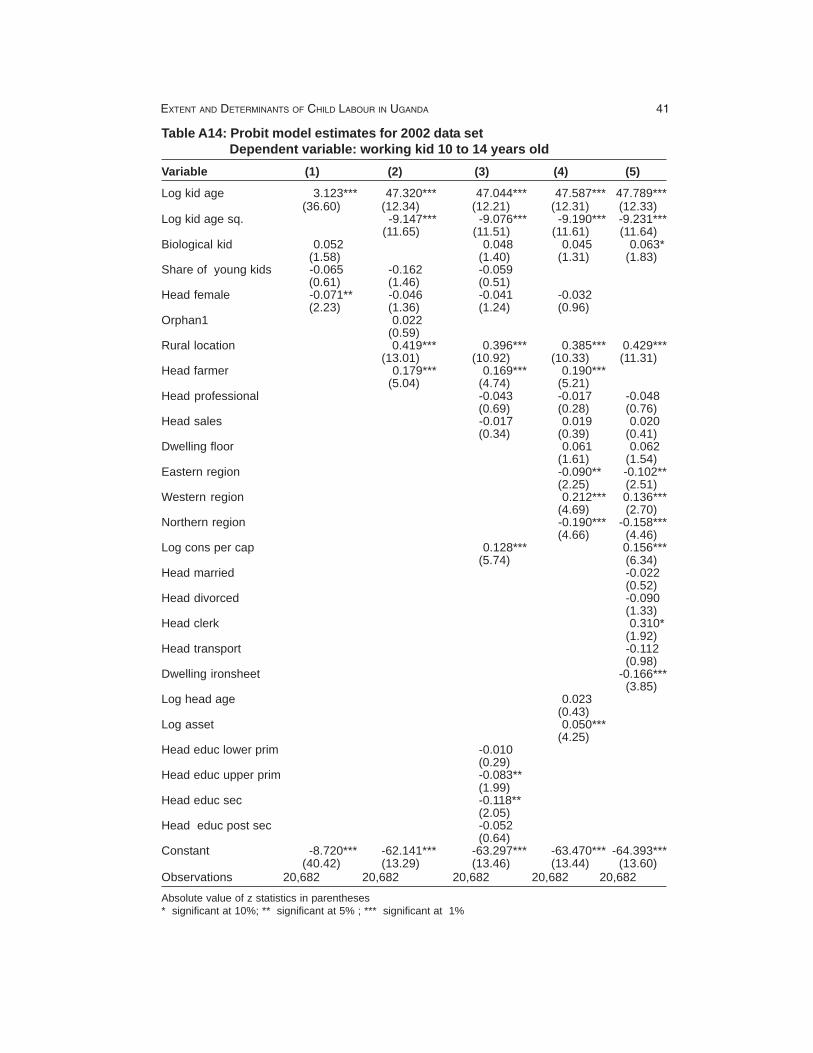
Table A14: Probit model estimates for 2002 data set Dependent variable: working kid 10 to 14 years oldVariable (1) (2) (3) (4) (5)
Log kid age 3.123*** 47.320*** 47.044*** 47.587*** 47.789***(36.60) (12.34) (12.21) (12.31) (12.33)
Log kid age sq. -9.147*** -9.076*** -9.190*** -9.231***(11.65) (11.51) (11.61) (11.64)
Biological kid 0.052 0.048 0.045 0.063*(1.58) (1.40) (1.31) (1.83)
Share of young kids -0.065 -0.162 -0.059(0.61) (1.46) (0.51)
Head female -0.071** -0.046 -0.041 -0.032(2.23) (1.36) (1.24) (0.96)
Orphan1 0.022(0.59)
Rural location 0.419*** 0.396*** 0.385*** 0.429***(13.01) (10.92) (10.33) (11.31)
Head farmer 0.179*** 0.169*** 0.190***(5.04) (4.74) (5.21)
Head professional -0.043 -0.017 -0.048(0.69) (0.28) (0.76)
Head sales -0.017 0.019 0.020(0.34) (0.39) (0.41)
Dwelling floor 0.061 0.062(1.61) (1.54)
Eastern region -0.090** -0.102**(2.25) (2.51)
Western region 0.212*** 0.136***(4.69) (2.70)
Northern region -0.190*** -0.158***(4.66) (4.46)
Log cons per cap 0.128*** 0.156***(5.74) (6.34)
Head married -0.022(0.52)
Head divorced -0.090(1.33)
Head clerk 0.310*(1.92)
Head transport -0.112(0.98)
Dwelling ironsheet -0.166***(3.85)
Log head age 0.023(0.43)
Log asset 0.050***(4.25)
Head educ lower prim -0.010(0.29)
Head educ upper prim -0.083**(1.99)
Head educ sec -0.118**(2.05)
Head educ post sec -0.052(0.64)
Constant -8.720*** -62.141*** -63.297*** -63.470*** -64.393***(40.42) (13.29) (13.46) (13.44) (13.60)
Observations 20,682 20,682 20,682 20,682 20,682
Absolute value of z statistics in parentheses* significant at 10%; ** significant at 5% ; *** significant at 1%