Extending the Applicability of Exact Nuclear Overhauser ...
7
Extending the Applicability of Exact Nuclear Overhauser Enhancements to Large Proteins and RNA Parker J. Nichols, [a] Alexandra Born, [a] Morkos A. Henen, [a, b] Dean Strotz, [c] Chi N. Celestine, [d] Peter Gɒntert, [c, e, f] and Beat Vçgeli* [a] 1. Introduction Since the first X-ray structures of myoglobin and the DNA double helix were first determined and proposed in 1958 and 1953, respectively, accurate determination of the 3D structures of biomolecules has been a cornerstone in molecular biology and biochemical research. Whereas single-state averaged struc- tures and simple lock-and-key models have been the most prominent paradigms for the majority of the 20th century, our current view of biomolecules realizes the importance of dynamics for their functions. In proteins, increasing evidence shows the importance of concerted motions and allosteric responses in enzymatic reactions, [1–4] protein–ligand interac- tions, [5–8] adaptive responses, [1, 2, 4] and the protein folding pro- cess. Intrinsically disordered proteins are capable of adopting many different conformations to form ternary complexes with a variety of binding partners. [3] In parallel, it is recognized that conformational changes and other important functions of RNA rely on dynamic motions that occur on the timescale of pico- seconds to seconds. [9] These include secondary-structure transi- tions that modulate RNA–ligand binding sites in response to ligand concentration and temperature, [10–13] as well as base-pair melting, reshuffling, and isomerization that regulate RNA–pro- tein and RNA–RNA interactions [14–22] and catalysis in the ribo- some and spliceosome. [23–27] These types of motions can be coupled to each other to result in an overall tertiary structure rearrangement. [28] Additionally, RNA interhelical and loop dynamics have been shown to be critical for many RNA recog- nition processes. [29–33] Thus, a full understanding of how such biomolecules function requires not only accurate 3D models but also a comprehensive description of their dynamics. NMR spectroscopy is well suited to tackle such require- ments. Whereas spin-relaxation methods can be used to char- acterize single-site flexibility and exchange, [34] NMR observables such as nuclear Overhauser enhancements (NOEs), scalar cou- plings, and residual dipolar couplings (RDCs), which report on internuclear distances, torsion angles, and internuclear vector orientations, respectively, can be used to determine the tertiary and global structure. [35–39] Whereas the application of NMR spectroscopy to larger biomolecules is fundamentally limited by fast transverse relaxation rates (R 2 ) and signal overlap, sig- nificant advances have been made that allow for measure- ments of NMR observables in systems of increasingly larger molecular weight. Examples include transverse relaxation-opti- mized spectroscopy (TROSY) and cross-correlated relaxation- enhanced polarization transfer (CRINEPT) sequences, [40–44] as well as perdeuteration, possibly in combination with selective methyl reprotonation, [45–49] which have enabled binding studies for a number of supramolecular protein complexes that are greater than 200 kDa. [50–56] The size of RNA structures that can be investigated by NMR spectroscopy has also been signifi- Distance-dependent nuclear Overhauser enhancements (NOEs) are one of the most popular and important experimental re- straints for calculating NMR structures. Despite this, they are mostly employed as semiquantitative upper distance bounds, and this discards the wealth of information that is encoded in the cross-relaxation rate constant. Information that is lost includes exact distances between protons and dynamics that occur on the sub-millisecond timescale. Our recently intro- duced exact measurement of the NOE (eNOE) requires little ad- ditional experimental effort relative to other NMR observables. So far, we have used eNOEs to calculate multistate ensembles of proteins up to approximately 150 residues. Here, we briefly revisit eNOE methodology and present two new directions for the use of eNOEs: applications to large proteins and RNA. [a] P. J. Nichols, A. Born, Prof. Dr. M. A. Henen, Prof. Dr. B. Vçgeli Department of Biochemistry and Molecular Genetics University of Colorado Denver, Anschutz Medical Campus 12801 East 17th Avenue, Aurora, CO 80045 (USA) E-mail : [email protected] [b] Prof. Dr. M. A. Henen Faculty of Pharmacy, Mansoura University Mansoura 35516 (Egypt) [c] Dr. D. Strotz, Prof. Dr. P. Gɒntert Laboratory of Physical Chemistry, ETH Zɒrich Vladimir-Prelog-Weg 2, 8093 Zɒrich (Switzerland) [d] Dr. C. N. Celestine Department of Medical Biochemistry and Microbiology Uppsala University BMC Box 582, 75123 Uppsala (Sweden) [e] Prof. Dr. P. Gɒntert Institute of Biophysical Chemistry, Goethe UniversitȨt Frankfurt Max-von-Laue-Strasse 9, 60438 Frankfurt am Main (Germany) [f] Prof. Dr. P. Gɒntert Graduate School of Science, Tokyo Metropolitan University 1-1 Minami-ohsawa, Hachioji, Tokyo 192-0397 (Japan) The ORCID identification numbers for the authors of this article can be found under https://doi.org/10.1002/cbic.201800237. ChemBioChem 2018, 19, 1695 – 1701 # 2018 Wiley-VCH Verlag GmbH & Co. KGaA, Weinheim 1695 Minireviews DOI: 10.1002/cbic.201800237
Transcript of Extending the Applicability of Exact Nuclear Overhauser ...
Extending the Applicability of Exact Nuclear OverhauserEnhancements to Large Proteins and RNAParker J. Nichols,[a] Alexandra Born,[a] Morkos A. Henen,[a, b] Dean Strotz,[c] Chi N. Celestine,[d]
Peter Gentert,[c, e, f] and Beat Vçgeli*[a]
1. Introduction
Since the first X-ray structures of myoglobin and the DNA
double helix were first determined and proposed in 1958 and1953, respectively, accurate determination of the 3D structures
of biomolecules has been a cornerstone in molecular biologyand biochemical research. Whereas single-state averaged struc-
tures and simple lock-and-key models have been the mostprominent paradigms for the majority of the 20th century, our
current view of biomolecules realizes the importance of
dynamics for their functions. In proteins, increasing evidenceshows the importance of concerted motions and allosteric
responses in enzymatic reactions,[1–4] protein–ligand interac-tions,[5–8] adaptive responses,[1, 2, 4] and the protein folding pro-
cess. Intrinsically disordered proteins are capable of adoptingmany different conformations to form ternary complexes with
a variety of binding partners.[3] In parallel, it is recognized that
conformational changes and other important functions of RNArely on dynamic motions that occur on the timescale of pico-
seconds to seconds.[9] These include secondary-structure transi-tions that modulate RNA–ligand binding sites in response to
ligand concentration and temperature,[10–13] as well as base-pairmelting, reshuffling, and isomerization that regulate RNA–pro-
tein and RNA–RNA interactions[14–22] and catalysis in the ribo-
some and spliceosome.[23–27] These types of motions can becoupled to each other to result in an overall tertiary structure
rearrangement.[28] Additionally, RNA interhelical and loopdynamics have been shown to be critical for many RNA recog-
nition processes.[29–33] Thus, a full understanding of how suchbiomolecules function requires not only accurate 3D modelsbut also a comprehensive description of their dynamics.
NMR spectroscopy is well suited to tackle such require-ments. Whereas spin-relaxation methods can be used to char-acterize single-site flexibility and exchange,[34] NMR observablessuch as nuclear Overhauser enhancements (NOEs), scalar cou-
plings, and residual dipolar couplings (RDCs), which report oninternuclear distances, torsion angles, and internuclear vector
orientations, respectively, can be used to determine the tertiaryand global structure.[35–39] Whereas the application of NMRspectroscopy to larger biomolecules is fundamentally limited
by fast transverse relaxation rates (R2) and signal overlap, sig-nificant advances have been made that allow for measure-
ments of NMR observables in systems of increasingly largermolecular weight. Examples include transverse relaxation-opti-
mized spectroscopy (TROSY) and cross-correlated relaxation-
enhanced polarization transfer (CRINEPT) sequences,[40–44] aswell as perdeuteration, possibly in combination with selective
methyl reprotonation,[45–49] which have enabled binding studiesfor a number of supramolecular protein complexes that are
greater than 200 kDa.[50–56] The size of RNA structures that canbe investigated by NMR spectroscopy has also been signifi-
Distance-dependent nuclear Overhauser enhancements (NOEs)are one of the most popular and important experimental re-
straints for calculating NMR structures. Despite this, they aremostly employed as semiquantitative upper distance bounds,and this discards the wealth of information that is encoded inthe cross-relaxation rate constant. Information that is lostincludes exact distances between protons and dynamics that
occur on the sub-millisecond timescale. Our recently intro-duced exact measurement of the NOE (eNOE) requires little ad-
ditional experimental effort relative to other NMR observables.So far, we have used eNOEs to calculate multistate ensemblesof proteins up to approximately 150 residues. Here, we brieflyrevisit eNOE methodology and present two new directions forthe use of eNOEs: applications to large proteins and RNA.
[a] P. J. Nichols, A. Born, Prof. Dr. M. A. Henen, Prof. Dr. B. VçgeliDepartment of Biochemistry and Molecular GeneticsUniversity of Colorado Denver, Anschutz Medical Campus12801 East 17th Avenue, Aurora, CO 80045 (USA)E-mail : [email protected]
[b] Prof. Dr. M. A. HenenFaculty of Pharmacy, Mansoura UniversityMansoura 35516 (Egypt)
[c] Dr. D. Strotz, Prof. Dr. P. GentertLaboratory of Physical Chemistry, ETH ZerichVladimir-Prelog-Weg 2, 8093 Zerich (Switzerland)
[d] Dr. C. N. CelestineDepartment of Medical Biochemistry and MicrobiologyUppsala UniversityBMC Box 582, 75123 Uppsala (Sweden)
[e] Prof. Dr. P. GentertInstitute of Biophysical Chemistry, Goethe Universit-t FrankfurtMax-von-Laue-Strasse 9, 60438 Frankfurt am Main (Germany)
[f] Prof. Dr. P. GentertGraduate School of Science, Tokyo Metropolitan University1-1 Minami-ohsawa, Hachioji, Tokyo 192-0397 (Japan)
The ORCID identification numbers for the authors of this article can befound under https ://doi.org/10.1002/cbic.201800237.
ChemBioChem 2018, 19, 1695 – 1701 T 2018 Wiley-VCH Verlag GmbH & Co. KGaA, Weinheim1695
MinireviewsDOI: 10.1002/cbic.201800237

cantly increased by the implementation of isotope-labelingstrategies,[57–59] “divide-and-conquer” and “cut-and-paste”
methods,[60, 61] solid-state NMR spectroscopy techniques,[62] andprotocols that incorporate a diverse range of structural and
biochemical data.[63] Such advances have pushed NMR spec-troscopy to heights that were originally thought impossible.
With such inspiring advances, it can be easy to forget aboutone of the most long-standing and informative NMR observa-bles, the nuclear Overhauser enhancement. Conventional NOEs
are mostly employed as semiquantitative upper distance re-straint limits, or in the case of the before-mentioned supra-
molecular complexes, as a tool to confirm assignments ofmethyl groups.[64, 65] Although useful, there is significant room
for improvement. We previously reported on the theory anduse of exact nuclear Overhauser enhancements (eNOEs) for the
determination of distances in Ubiquitin and GB3 of up to 5 a
with only 0.1 a error.[66, 67] The unprecedented accuracy ofeNOEs allows for high-resolution structures to be calculated
from eNOEs alone.[68, 69] In cases for which dense eNOE net-works can be acquired, multistate structure calculations can be
performed that capture spatial fluctuations that would other-wise be missed by conventional NOEs.[68, 70, 71] In addition, we
showed that eNOEs contain similar and complementary infor-
mation to both J couplings and RDCs.[72] So far, we have onlyused eNOEs to calculate multistate ensembles of proteins up
to about 150 resides.[73, 74] Currently, we are testing new direc-tions for the applications of eNOE methodology.
Exploiting the exceptional accuracy of eNOEs, we investigat-ed their usefulness as a tool to determine distances within
supramolecular complexes and to help define RNA molecules
for which a lack of chemical-shift diversity and NOE densitymakes defining structures problematic.[75] To this end, we re-
cently applied our eNOE protocol to determine inter-methyldistances in the 360 kDa proteasome[76] as well as the 14-mer
UUCG RNA tetraloop.[77] Here, we briefly review the eNOE pro-tocol and then discuss these most recent advances.
1.1. What is the difference between NOEs and eNOEs?
Although the NOE rate constant is proportional to the inversesixth power of the distance between two dipolar interactingspins (r@6),[78] NOEs are mostly employed as semiquantitative
upper distance limit restraints instead of exact averagedvalues.[39] This practice has resulted from the difficulty in con-verting NOEs into exact distances for large biomolecules.[79]
Specifically, extracting accurate NOE cross-relaxation rate con-stants (s) is hampered by interfering mechanisms throughout
the pulse sequence[80] but mainly by spin diffusion that is re-layed by neighboring spins.[79, 81] We introduced a formalism
that is able to correct for these issues,[82] allowing for the con-
version of s rates into an almost exact distance between thetwo atoms in question (exact NOEs or eNOEs). The formalism is
complex and was thoroughly described previously,[82, 83] so wewill not review it here.
2. Step-by-Step Guide for Extracting eNOEs
2.1. Acquiring a NOESY buildup series
We developed an easy-to-implement protocol for the extrac-tion of eNOEs from any system of interest. The first step of the
protocol is to measure either a 2D or 3D NOESY buildup series(Figure 1, step 1). For the 3D case, we usually use a NOESYHSQC pulse sequence with simultaneous evolution of 15N and13C[83] (for application to large systems, we recommend 3DHMQC NOESY HMQC, see Section 3.1.). Theoretically, only twomixing times are required; however, to achieve high-qualityfits of the data and to improve accuracy, we recommend atleast four. All mixing time points within the series must bemeasured during the same measurement session, and we rec-
ommend that the order be randomized in the case of time-
dependent sample changes. Assuming an inverse relationshipbetween the maximal mixing time and the overall rotational
correlation time (tc), we derived theoretical optimal upper limitmixing times of approximately 2.5 V 10@10 and 4 V 10@10 s2 tc
@1
for proteins and RNA, respectively.[77, 82] NOESY mixing periodsbeyond these values will incur relatively large errors in the ex-
tracted s values owing to increasing spin diffusion; however,
longer mixing times are used for assignment purposes. Afteracquiring the buildup series, we assign the signals in the spec-
tra from the longest NOESY mixing time and exclude over-lapped diagonal and crosspeaks, although cross-peak buildups
with overlapped diagonals can still be used in the form ofgenerically normalized eNOEs (gn-eNOEs),[84] as described later.
The intensities for the cross and diagonal peaks are then ex-
tracted for the entire series of mixing times by using the nlinLSscript within NMRPipe[85] or a similar script of choice.
2.2. Fitting the buildups
The intensities from the cross and diagonal peaks are then
fitted to monoexponential buildup and decay curves by usingthe eNORA2[86] package, which has been implemented into the
most recent version of CYANA[87, 88] (note that the stand-aloneeNORA2 package coded in MATLAB is available for download
but cannot handle RNA molecules). eNORA2 fits diagonal peakdecays as a function of the mixing time to determine both the
autorelaxation rate constant (1) as well as the initial magneti-zation at zero mixing time [DM(0)] . In parallel, spin-diffusioncorrections are calculated from a previously determined NMR
ensemble or X-ray structure and applied to the intensities ofthe cross-peak buildup curves. Note that if no structure is avail-
able, a preliminary structure by using conventional NOEs willneed to be calculated first. This structure may then be used as
an input for spin-diffusion treatment in eNOE distance determi-nation.
There are two methods that can be used to calculate spin
diffusion: the full-matrix approach and the three-spin ap-proach.[82, 89] For most applications, the full-matrix approach is
superior, because the magnetization transfer pathways be-tween all spins are considered simultaneously. The three-spin
ChemBioChem 2018, 19, 1695 – 1701 www.chembiochem.org T 2018 Wiley-VCH Verlag GmbH & Co. KGaA, Weinheim1696
Minireviews

approach is well-suited for partially deuterated biomole-cules.[89]
eNORA2 will then proceed to fit the s values by using the
corrected cross-peak buildup intensities and the fitted 1 andDM(0) values (Figure 1, step 2). The corrected s rates are thenconverted into bidirectional (both symmetry-related crosspeaks
can be normalized to their corresponding diagonal peaks) andunidirectional (only one crosspeak can be evaluated or the
eNOE cannot be normalized to both diagonal peaks) eNOEeffective distance restraints through the relationship s/ r@6.
Note that both the spin diffusion corrections and conversion
of s into effective distances require a relatively accurate valuefor the overall rotational correlation time (tc) as input.
Effective distances from unidirectional eNOEs should begiven a user-defined error (we recommend 20 and 10 % for
proteins and RNA, respectively), whereas bidirectional eNOEsrequire no tolerance adjustment and will have the same dis-
tance for both the upper and lower distance limits. eNORA2and CYANA will only calculate unidirectional eNOEs if thecrosspeak can be normalized to its corresponding diagonal
peak. Because there are two alternative pathways of magneti-zation transfer (from spin i!j and from spin j!i), there will beeffective distances missing from each choice of pathway thatmay be present in the other. Depending on the choice of theNOESY experiment,[80] normalization to the peak intensity of
the spin of origin (i!j) or destination (j!i) is more theoretical-ly sound. For example, if a HSQC element is used after the
NOESY transfer, the different relaxation rates of spins i and j
during the HSQC may result in stronger differentiation of theintensities than the one caused by nonuniform equilibrium
re-establishment before NOESY mixing. Nevertheless, we alsoalways add unidirectional eNOEs that are exclusive to the
other normalization to our list to increase the total amount ofeNOEs.
Figure 1. The eNOE protocol. The cross-relaxation rate (s) between two dipolar interacting spins increases as a function of the mixing time (tmix) and is pro-portional to r@6 (step 1). Acquiring a NOESY buildup series allows for the autorelaxation rates (1) and initial magnetizations [DM(0)] to be fitted (step 2). Thesecan then be used in combination with spin-diffusion corrections to fit accurate s rates (step 2). Once erroneous fits are removed by visual inspection of theplotted 1 and s rates, s can be converted into exact internuclear distances through its proportionality to r@6 (step 3). After adding a user-defined error to theeffective distances derived from unidirectional and generically normalized eNOEs, the eNOE distance restraints can be used as input for structure calculations(step 4). We recommend an error of 20 % for proteins and 10 % for RNA; however, the applied error is case dependent. If the input structure for spin-diffusioncalculations is not of exceptional quality, the newly acquired eNOE structure can be used as the input for spin-diffusion corrections in an iterative process(step 5). In cases for which robust eNOE networks can be acquired, multistate structure calculations can be performed in CYANA.
ChemBioChem 2018, 19, 1695 – 1701 www.chembiochem.org T 2018 Wiley-VCH Verlag GmbH & Co. KGaA, Weinheim1697
Minireviews

For the extraction of gn-eNOEs from overlapped diagonals, itis necessary to determine the average 1 value as well as an
upper limit DM(0) on the basis of the nonoverlapped values inthe output lists. It is recommended to distinguish single, methyl-
ene, and methyl protons upon choosing average 1 values andupper limit DM(0) values that are safely above all fitted DM(0)
values. An improved method is to use averaged 1 and upperlimit DM(0) values for each specific atom type. eNORA2 can
then use these values to calculate gn-eNOEs from cross-peak
buildups associated with overlapped diagonals, which can beused as upper limit restraints in conjunction with the bidirec-
tional and unidirectional eNOE restraints. gn-eNOEs should begiven the same upper limit error as unidirectional eNOEs.
2.3. eNOE structure calculation
Once the eNOEs are calculated, we visually inspect the buildupplots and remove poor fits (Figure 1, step 3). Calculating an
eNOE structure simply requires the use of the eNOE and gn-eNOE distance restraints as input for a conventional structurecalculation (Figure 1, step 4). Note that the calculated structure
can then be used as the input for spin-diffusion calculations,which allows for an iterative process (Figure 1, step 5).
For dense eNOE networks (an exceptional case is shown inFigure 1), multistate structures can be calculated in CYANA thatallow visualization of spatial sampling. This is due to the aver-aged nature of eNOEs,[73] and consequently, an atom that sam-
ples multiple points in space will produce eNOE distances tonearby atoms that are the r@6 averages of all the distances sam-
pled. If a sufficient amount of eNOEs define such an atom, then
the combined network contains information about all of the sam-pled substates. Thus, single-state structure calculations will result
in many violated distance restraints, because the eNOEs cannotbe fulfilled simultaneously by a single structure. Multiple states
allow for such violated eNOE restraints to be satisfied, which cap-tures the spatial sampling of the biomolecule in the process.
3. eNOE Recent Applications
3.1. eNOEs in a 360 kDa proteasome complex
We recently measured eNOEs in the 360 kDa 2 V 7-mer half pro-teasome from Thermoplasma acidophilium.[76] For proteins
larger than about 150 residues, diagonal peak overlap be-comes a limiting factor for the extraction of usable eNOEs.[84]
In addition, our simulations for molecules with a rotational cor-
relation time of 150 ns or larger showed that the spin diffusionbetween neighboring methyl groups within the same valine or
leucine side chain could be an order of magnitude larger thanthe direct NOE transfer. This made it impossible to perform ac-
curate spin-diffusion corrections so that quantitative distances
could be obtained.[89] Therefore, we measured eNOEs on asample that was perdeuterated and selectively methyl labeled
at the Iled1, Valg2, and Leud2 positions (Figure 2 A). Spin-diffu-sion corrections calculated by using the full-matrix approach
for this labeling scheme were possible, and this allowed for aNOESY buildup series to be measured for tmix = 30, 60, 90, and
120 ms. We were able to extract 18 bidirectional eNOEs, anadditional 14 unidirectional eNOEs if normalized to the spin oforigin, and 29 unidirectional eNOEs if normalized to the spin ofdestination (Figure 2 A). We compared the extracted bi- and
unidirectional eNOE distances to two high-resolution X-raystructures of the proteasome: one in the free form determined
at 3.4 a resolution (PDB ID: 1PMA)[90] and the other bound tothe 11S activator determined at 1.9 a resolution (PDB ID:1YA7).[91] Pearson’s correlation coefficients for only bi-direction-al and bi- or unidirectional eNOE distances compared to dis-tances from 1PMA were 0.80 and 0.64, respectively. If com-pared to 1YA7, they were 0.89 and 0.78, respectively, thus indi-cating that 1YA7 better represents the liquid-state conforma-tion (Figure 2 B). In addition, we found a number of eNOE dis-tances that were more than 1 a shorter (Figure 2 C, blue) or
longer (Figure 2 C, red) than the corresponding distances from
1YA7. Strikingly, almost all of these violated distance restraintscorrelated to residues with order parameters smaller than 0.33,
Figure 2. eNOEs in the 360 kDa proteasome. A) Left : ribbon backbone plotof the entire PDB ID 1PMA consisting of two heptameric a rings (colored)and two heptameric b rings (white). Right : the side chains of Val, Leu, andIle are plotted on the ribbon backbone of an individual a subunit. The NOE-sensitive 1H,13C-labeled methyl groups (Iled1, Valg2, and Leud2) are high-lighted by red spheres at the carbon positions. Methyl pairs for which build-ups could be measured are connected by red lines. B) Distances extractedfrom the X-ray structure 1YA7 on the x-axis versus those from eNOEs on they-axis. The intensities of the crosspeaks of unidirectional eNOEs were nor-malized with diagonal peak intensities of magnetization of origin or destina-tion. eNOEs were extracted from a NOESY buildup series with mixing timesof 30, 60, 90, and 120 ms. Corrections for spin diffusion were estimated withthe full-relaxation matrix approach, and the resulting distances were scaledby 1.09 to account for incomplete deuteration (as determined from thethree-spin approach). An overall tc of 148 ns was extrapolated from ref. [64]Theoretical distances were extracted with r@6 averaging from the 1YA7 PDBstructure. C) Clustering of deviations of experimental from X-ray distances.Distances that are at least 1 a larger or smaller than those extracted fromthe X-ray structure 1YA7 are shown in red and blue, respectively, and thosewithin 1 a are shown in yellow. The distances are plotted on the a subunit A(cyan), and other a subunits in the same ring are shown in white. Residueswith methyl axis order parameters smaller than 0.33 are colored black. 11Sactivator and the b ring are shown in pink and purple, respectively.
ChemBioChem 2018, 19, 1695 – 1701 www.chembiochem.org T 2018 Wiley-VCH Verlag GmbH & Co. KGaA, Weinheim1698
Minireviews

as determined by Kay and co-workers (Figure 2 C, blacklines).[64, 92] In addition, two clusters with systematic differencesemerged. The eNOE distances that were longer in the X-raystructure were found to involve residues that anchored loop
201–210, which in turn formed the interface with the 11S acti-vator (shown in pink). Under our experimental conditions, thisloop was solvent exposed, which may explain the more ex-tended nature of the distance network. Indeed, the distancesfrom 1PMA were longer, although the eNOE distances were
still larger. The cluster that contained distances that wereshorter than those in the X-ray structure involved the segment
that interacted with the b ring. Under our experimental condi-tions, this segment was instead in complex with the second a
ring, thus indicating that the structural differences at the inter-
face are dependent upon the interacting subunit. These find-ings highlight the potential ability of eNOEs to pinpoint
changes in molecular structure upon rearrangements such asbinding events and allosteric motions.
This study was significant because it was one of the first forwhich internuclear distances were extracted from supramolec-
ular complexes. Without spin-diffusion corrections, the extract-ed distances would not even be sufficient for a simple three-
class interpretation. Although we noted that the extracted dis-
tances were less accurate than those extracted for small pro-teins, the distances still correlated well with the high-resolution
X-ray structures. The quality of the structure used to calculatethe spin-diffusion corrections is also important. Given the
signal-to-noise ratio in our spectra, it is clear that such meas-urements are feasible for molecules with molecular weights up
to 1 MDa and even beyond.
3.2. High-resolution RNA structures from eNOEs
Another recent use of eNOEs was to define the structure of a14-mer RNA UUCG tetraloop.[77] RNA only contains 4 chemicallyunique building blocks, as opposed to 20 for proteins, and
Figure 3. Defining the 14mer UUCG tetraloop by using eNOEs. A) The 265 extracted eNOEs (red) and 88 gn-eNOEs (blue) are plotted onto the NMR structure2KOC. B-Left) Correlation plot between distances from 2KOC on the x axis and eNOE effective distances from fits of 40–160 ms on the y axis (overall correla-tion: y = 0.96 x, R = 0.89). Black circles correspond to distances between non-amino/non-methylene protons (y = 0.96 x, R = 0.89), orange diamonds correspondto distances between amino/methylene protons and non-amino/non-methylene or amino/methylene protons on a different residue (y = 0.96 x, R = 0.84), andred squares correspond to distances within amino/methylene spin pairs (y = 0.98 x, R = 0.35). B-Right) Superposition of the eNOE structure (black) and 2KOC(cyan). Reported RMSD values are for heavy atoms. C) Comparison of order parameters S2 backcalculated from the two-state eNOE ensemble and experimen-tally and computationally derived S2 values. eNOE S2 are shown in blue, NMR relaxation S2 in red, and molecular dynamics S2 in orange.
ChemBioChem 2018, 19, 1695 – 1701 www.chembiochem.org T 2018 Wiley-VCH Verlag GmbH & Co. KGaA, Weinheim1699
Minireviews
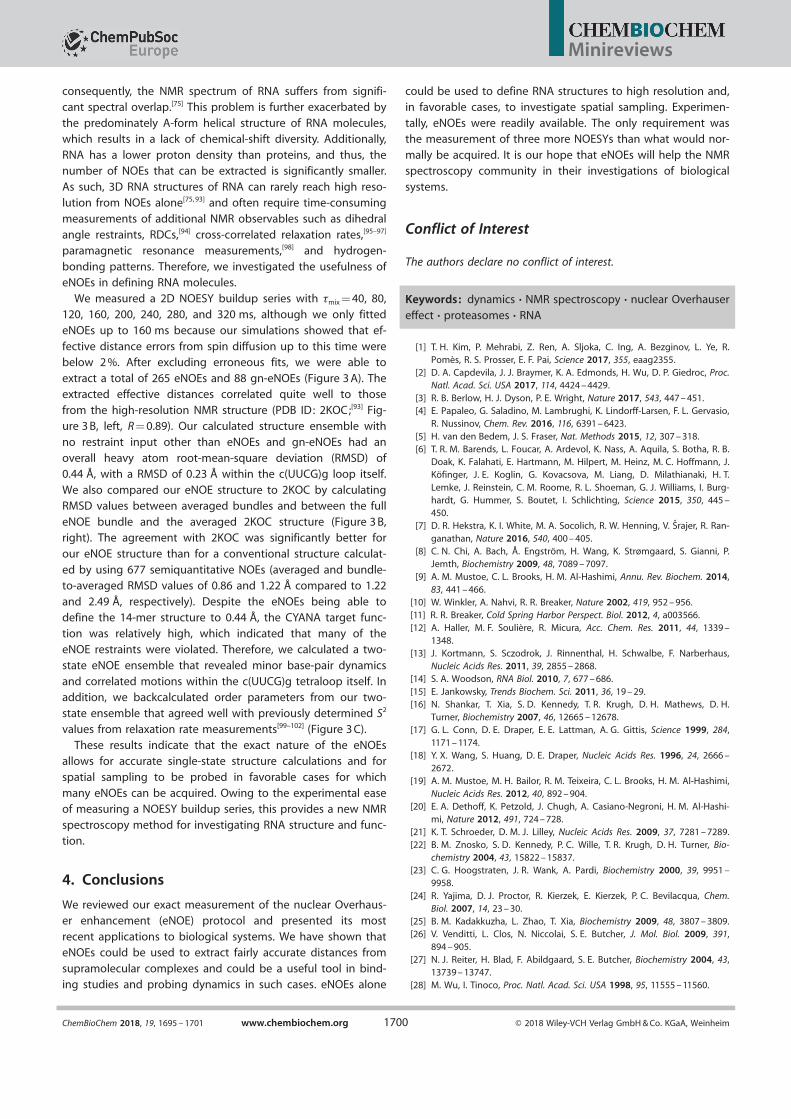
consequently, the NMR spectrum of RNA suffers from signifi-cant spectral overlap.[75] This problem is further exacerbated by
the predominately A-form helical structure of RNA molecules,which results in a lack of chemical-shift diversity. Additionally,
RNA has a lower proton density than proteins, and thus, thenumber of NOEs that can be extracted is significantly smaller.
As such, 3D RNA structures of RNA can rarely reach high reso-lution from NOEs alone[75, 93] and often require time-consumingmeasurements of additional NMR observables such as dihedral
angle restraints, RDCs,[94] cross-correlated relaxation rates,[95–97]
paramagnetic resonance measurements,[98] and hydrogen-bonding patterns. Therefore, we investigated the usefulness ofeNOEs in defining RNA molecules.
We measured a 2D NOESY buildup series with tmix = 40, 80,120, 160, 200, 240, 280, and 320 ms, although we only fitted
eNOEs up to 160 ms because our simulations showed that ef-
fective distance errors from spin diffusion up to this time werebelow 2 %. After excluding erroneous fits, we were able to
extract a total of 265 eNOEs and 88 gn-eNOEs (Figure 3 A). Theextracted effective distances correlated quite well to those
from the high-resolution NMR structure (PDB ID: 2KOC;[93] Fig-ure 3 B, left, R = 0.89). Our calculated structure ensemble with
no restraint input other than eNOEs and gn-eNOEs had an
overall heavy atom root-mean-square deviation (RMSD) of0.44 a, with a RMSD of 0.23 a within the c(UUCG)g loop itself.
We also compared our eNOE structure to 2KOC by calculatingRMSD values between averaged bundles and between the full
eNOE bundle and the averaged 2KOC structure (Figure 3 B,right). The agreement with 2KOC was significantly better for
our eNOE structure than for a conventional structure calculat-
ed by using 677 semiquantitative NOEs (averaged and bundle-to-averaged RMSD values of 0.86 and 1.22 a compared to 1.22
and 2.49 a, respectively). Despite the eNOEs being able todefine the 14-mer structure to 0.44 a, the CYANA target func-
tion was relatively high, which indicated that many of theeNOE restraints were violated. Therefore, we calculated a two-
state eNOE ensemble that revealed minor base-pair dynamics
and correlated motions within the c(UUCG)g tetraloop itself. Inaddition, we backcalculated order parameters from our two-
state ensemble that agreed well with previously determined S2
values from relaxation rate measurements[99–102] (Figure 3 C).These results indicate that the exact nature of the eNOEs
allows for accurate single-state structure calculations and for
spatial sampling to be probed in favorable cases for whichmany eNOEs can be acquired. Owing to the experimental easeof measuring a NOESY buildup series, this provides a new NMRspectroscopy method for investigating RNA structure and func-tion.
4. Conclusions
We reviewed our exact measurement of the nuclear Overhaus-er enhancement (eNOE) protocol and presented its most
recent applications to biological systems. We have shown thateNOEs could be used to extract fairly accurate distances from
supramolecular complexes and could be a useful tool in bind-ing studies and probing dynamics in such cases. eNOEs alone
could be used to define RNA structures to high resolution and,in favorable cases, to investigate spatial sampling. Experimen-
tally, eNOEs were readily available. The only requirement wasthe measurement of three more NOESYs than what would nor-
mally be acquired. It is our hope that eNOEs will help the NMRspectroscopy community in their investigations of biological
systems.
Conflict of Interest
The authors declare no conflict of interest.
Keywords: dynamics · NMR spectroscopy · nuclear Overhauser
effect · proteasomes · RNA
[1] T. H. Kim, P. Mehrabi, Z. Ren, A. Sljoka, C. Ing, A. Bezginov, L. Ye, R.PomHs, R. S. Prosser, E. F. Pai, Science 2017, 355, eaag2355.
[2] D. A. Capdevila, J. J. Braymer, K. A. Edmonds, H. Wu, D. P. Giedroc, Proc.Natl. Acad. Sci. USA 2017, 114, 4424 – 4429.
[3] R. B. Berlow, H. J. Dyson, P. E. Wright, Nature 2017, 543, 447 – 451.[4] E. Papaleo, G. Saladino, M. Lambrughi, K. Lindorff-Larsen, F. L. Gervasio,
R. Nussinov, Chem. Rev. 2016, 116, 6391 – 6423.[5] H. van den Bedem, J. S. Fraser, Nat. Methods 2015, 12, 307 – 318.[6] T. R. M. Barends, L. Foucar, A. Ardevol, K. Nass, A. Aquila, S. Botha, R. B.
Doak, K. Falahati, E. Hartmann, M. Hilpert, M. Heinz, M. C. Hoffmann, J.Kçfinger, J. E. Koglin, G. Kovacsova, M. Liang, D. Milathianaki, H. T.Lemke, J. Reinstein, C. M. Roome, R. L. Shoeman, G. J. Williams, I. Burg-hardt, G. Hummer, S. Boutet, I. Schlichting, Science 2015, 350, 445 –450.
[7] D. R. Hekstra, K. I. White, M. A. Socolich, R. W. Henning, V. Srajer, R. Ran-ganathan, Nature 2016, 540, 400 – 405.
[8] C. N. Chi, A. Bach, a. Engstrçm, H. Wang, K. Strømgaard, S. Gianni, P.Jemth, Biochemistry 2009, 48, 7089 – 7097.
[9] A. M. Mustoe, C. L. Brooks, H. M. Al-Hashimi, Annu. Rev. Biochem. 2014,83, 441 – 466.
[10] W. Winkler, A. Nahvi, R. R. Breaker, Nature 2002, 419, 952 – 956.[11] R. R. Breaker, Cold Spring Harbor Perspect. Biol. 2012, 4, a003566.[12] A. Haller, M. F. SouliHre, R. Micura, Acc. Chem. Res. 2011, 44, 1339 –
1348.[13] J. Kortmann, S. Sczodrok, J. Rinnenthal, H. Schwalbe, F. Narberhaus,
Nucleic Acids Res. 2011, 39, 2855 – 2868.[14] S. A. Woodson, RNA Biol. 2010, 7, 677 – 686.[15] E. Jankowsky, Trends Biochem. Sci. 2011, 36, 19 – 29.[16] N. Shankar, T. Xia, S. D. Kennedy, T. R. Krugh, D. H. Mathews, D. H.
Turner, Biochemistry 2007, 46, 12665 – 12678.[17] G. L. Conn, D. E. Draper, E. E. Lattman, A. G. Gittis, Science 1999, 284,
1171 – 1174.[18] Y. X. Wang, S. Huang, D. E. Draper, Nucleic Acids Res. 1996, 24, 2666 –
2672.[19] A. M. Mustoe, M. H. Bailor, R. M. Teixeira, C. L. Brooks, H. M. Al-Hashimi,
Nucleic Acids Res. 2012, 40, 892 – 904.[20] E. A. Dethoff, K. Petzold, J. Chugh, A. Casiano-Negroni, H. M. Al-Hashi-
mi, Nature 2012, 491, 724 – 728.[21] K. T. Schroeder, D. M. J. Lilley, Nucleic Acids Res. 2009, 37, 7281 – 7289.[22] B. M. Znosko, S. D. Kennedy, P. C. Wille, T. R. Krugh, D. H. Turner, Bio-
chemistry 2004, 43, 15822 – 15837.[23] C. G. Hoogstraten, J. R. Wank, A. Pardi, Biochemistry 2000, 39, 9951 –
9958.[24] R. Yajima, D. J. Proctor, R. Kierzek, E. Kierzek, P. C. Bevilacqua, Chem.
Biol. 2007, 14, 23 – 30.[25] B. M. Kadakkuzha, L. Zhao, T. Xia, Biochemistry 2009, 48, 3807 – 3809.[26] V. Venditti, L. Clos, N. Niccolai, S. E. Butcher, J. Mol. Biol. 2009, 391,
894 – 905.[27] N. J. Reiter, H. Blad, F. Abildgaard, S. E. Butcher, Biochemistry 2004, 43,
13739 – 13747.[28] M. Wu, I. Tinoco, Proc. Natl. Acad. Sci. USA 1998, 95, 11555 – 11560.
ChemBioChem 2018, 19, 1695 – 1701 www.chembiochem.org T 2018 Wiley-VCH Verlag GmbH & Co. KGaA, Weinheim1700
Minireviews

[29] R. W. Alexander, J. Eargle, Z. Luthey-Schulten, FEBS Lett. 2010, 584,376 – 386.
[30] B. Heppell, S. Blouin, A. M. Dussault, J. Mulhbacher, E. Ennifar, J. C.Penedo, D. A. Lafontaine, Nat. Chem. Biol. 2011, 7, 384 – 392.
[31] N. Leulliot, G. Varani, Biochemistry 2001, 40, 7947 – 7956.[32] T. Xia, Curr. Opin. Chem. Biol. 2008, 12, 604 – 611.[33] T. Hermann, D. J. Patel, Science 2000, 287, 820 – 825.[34] Y. Xue, J. M. Ward, T. Yuwen, I. S. Podkorytov, N. R. Skrynnikov, J. Am.
Chem. Soc. 2012, 134, 2555 – 2562.[35] N. Tjandra, A. Bax, Science 1997, 278, 1111 – 1114.[36] A. Bax, Protein Sci. 2003, 12, 1 – 16.[37] J. R. Bothe, E. N. Nikolova, C. D. Eichhorn, J. Chugh, A. L. Hansen, H. M.
Al-Hashimi, Nat. Methods 2011, 8, 919 – 931.[38] B. S. Tolbert, Y. Miyazaki, S. Barton, B. Kinde, P. Starck, R. Singh, A. Bax,
D. A. Case, M. F. Summers, J. Biomol. NMR 2010, 47, 205 – 219.[39] K. Wethrich, NMR of Proteins, Nucleic Acids, Wiley, Hoboken, 1986.[40] K. Pervushin, R. Riek, G. Wider, K. Wethrich, Proc. Natl. Acad. Sci. USA
1997, 94, 12366 – 12371.[41] R. Riek, G. Wider, K. Pervushin, K. Wethrich, Proc. Natl. Acad. Sci. USA
1999, 96, 4918 – 4923.[42] G. Wider, K. Wethrich, Curr. Opin. Struct. Biol. 1999, 9, 594 – 601.[43] R. Riek, K. Pervushin, K. Wethrich, Trends Biochem. Sci. 2000, 25, 462 –
468.[44] A. Eletsky, S. V. S. R. K. Pulavarti, V. Beaumont, P. Gollnick, T. Szyperski, J.
Am. Chem. Soc. 2015, 137, 11242 – 11245.[45] N. K. Goto, L. E. Kay, Curr. Opin. Struct. Biol. 2000, 10, 585 – 592.[46] K. H. Gardner, L. E. Kay, Annu. Rev. Biophys. Biomol. Struct. 1998, 27,
357 – 406.[47] B. T. I. Farmer, R. A. Venters, N. R. In Krishna, L. J. Berliner, Biological
Magnetic Resonance, 1998, Kluwer/Plenum, New York, pp. 75 – 120.[48] D. M. LeMaster, F. M. Richards, Biochemistry 1988, 27, 142 – 150.[49] S. Grzesiek, J. Anglister, A. Bax, J. Anglister, H. Ren, J. Am. Chem. Soc.
1993, 115, 4369 – 4370.[50] J. Fiaux, E. B. Bertelsen, A. L. Horwich, K. Wethrich, Nature 2002, 418,
207 – 211.[51] S. Rudiger, S. M. V. Freund, D. B. Veprintsev, A. R. Fersht, Proc. Natl.
Acad. Sci. USA 2002, 99, 11085 – 11090.[52] R. Sprangers, A. Gribun, P. M. Hwang, W. A. Houry, L. E. Kay, Proc. Natl.
Acad. Sci. USA 2005, 102, 16678 – 16683.[53] T. L. Religa, R. Sprangers, L. E. Kay, Science 2010, 328, 98 – 102.[54] R. Sprangers, A. Velyvis, L. E. Kay, Nat. Methods 2007, 4, 697 – 703.[55] C. Huang, P. Rossi, T. Saio, C. G. Kalodimos, Nature 2016, 537, 202 – 206.[56] T. Saio, X. Guan, P. Rossi, A. Economou, C. G. Kalodimos, Science 2014,
344, 1250494.[57] K. Lu, Y. Miyazaki, M. F. Summers, J. Biomol. NMR 2010, 46, 113 – 125.[58] L. J. Alvarado, R. M. Leblanc, A. P. Longhini, S. C. Keane, N. Jain, Z. F.
Yildiz, B. S. Tolbert, V. M. D’Souza, M. F. Summers, C. Kreutz, T. K. Dayie,ChemBioChem 2014, 15, 1573 – 1577.
[59] S. C. Keane, X. Heng, K. Lu, S. Kharytonchyk, V. Ramakrishnan, G.Carter, S. Barton, A. Hosic, A. Florwick, J. Santos, N. C. Bolden, S. McCo-win, D. A. Case, B. A. Johnson, M. Salemi, A. Telesnitsky, M. F. Summers,Science 2015, 348, 917 – 921.
[60] R. P. Barnwal, E. Loh, K. S. Godin, J. Yip, H. Lavender, C. M. Tang, G.Varani, Nucleic Acids Res. 2016, 44, 9426 – 9437.
[61] O. Duss, N. Diarra Dit Kont8, F. H. T. Allain, Methods Enzymol. 2015, 565,537 – 562.
[62] A. Marchanka, B. Simon, G. Althoff-Ospelt, T. Carlomagno, Nat.Commun. 2015, 6, 7024.
[63] E. Karaca, J. P. G. L. M. Rodrigues, A. Graziadei, A. M. J. J. Bonvin, T. Car-lomagno, Nat. Methods 2017, 14, 897 – 902.
[64] R. Sprangers, L. E. Kay, Nature 2007, 445, 618 – 622.[65] I. Gelis, A. M. J. J. Bonvin, D. Keramisanou, M. Koukaki, G. Gouridis, S.
Karamanou, A. Economou, C. G. Kalodimos, Cell 2007, 131, 756 – 769.[66] B. Vçgeli, M. Friedmann, D. Leitz, A. Sobol, R. Riek, J. Magn. Reson.
2010, 204, 290 – 302.[67] B. Vçgeli, T. F. Segawa, D. Leitz, A. Sobol, A. Choutko, D. Trzesniak, W.
Van Gunsteren, R. Riek, J. Am. Chem. Soc. 2009, 131, 17215 – 17225.
[68] B. Vçgeli, S. Kazemi, P. Gentert, R. Riek, Nat. Struct. Mol. Biol. 2012, 19,1053 – 1058.
[69] B. Vçgeli, S. Olsson, P. Gentert, R. Riek, Biophys. J. 2016, 110, 113 – 126.[70] S. Olsson, D. Strotz, B. Vçgeli, R. Riek, A. Cavalli, Structure 2016, 24,
1464 – 1475.[71] C. N. Chi, B. Vçgeli, S. Bibow, D. Strotz, J. Orts, P. Gentert, R. Riek,
Angew. Chem. Int. Ed. 2015, 54, 11657 – 11661; Angew. Chem. 2015,127, 11823 – 11827.
[72] B. Vçgeli, S. Olsson, R. Riek, P. Gentert, J. Struct. Biol. 2015, 191, 306 –317.
[73] P. Nichols, A. Born, M. Henen, D. Strotz, J. Orts, S. Olsson, P. Gentert, C.Chi, B. Vçgeli, Molecules 2017, 22, 1176.
[74] B. Vçgeli, J. Orts, D. Strotz, C. Chi, M. Minges, M. A. W-lti, P. Gentert, R.Riek, J. Magn. Reson. 2014, 241, 53 – 59.
[75] B. Fertig, C. Richter, J. Wçhnert, H. Schwalbe, ChemBioChem 2003, 4,936 – 962.
[76] C. N. Chi, D. Strotz, R. Riek, B. Vçgeli, Chem. Eur. J. 2018, 24, 2270 –2276.
[77] P. J. Nichols, M. A. Henen, A. Born, D. Strotz, P. Gentert, B. Vçgeli,Commun. Biol. 2018, 1, 61.
[78] I. Solomon, Phys. Rev. 1955, 99, 559 – 565.[79] A. Kumar, G. Wagner, R. R. Ernst, K. Wethrich, J. Am. Chem. Soc. 1981,
103, 3654 – 3658.[80] D. Strotz, J. Orts, M. Minges, B. Vçgeli, J. Magn. Reson. 2015, 259, 32 –
46.[81] K. Zinovjev, E. Liepinsh, J. Biophys. Chem. 2013, 4, 58 – 65.[82] B. Vçgeli, Prog. Nucl. Magn. Reson. Spectrosc. 2014, 78, 1 – 46.[83] B. Vçgeli, P. Gentert, R. Riek, Mol. Phys. 2013, 111, 437 – 454.[84] C. N. Chi, D. Strotz, R. Riek, B. Vçgeli, J. Biomol. NMR 2015, 62, 63 – 69.[85] F. Delaglio, S. Grzesiek, G. W. Vuister, G. Zhu, J. Pfeifer, A. Bax, J. Biomol.
NMR 1995, 6, 277 – 293.[86] D. Strotz, J. Orts, C. N. Chi, R. Riek, B. Vçgeli, J. Chem. Theory Comput.
2017, 13, 4336 – 4346.[87] P. Gentert, C. Mumenthaler, K. Wethrich, J. Mol. Biol. 1997, 273, 283 –
298.[88] P. Gentert, L. Buchner, J. Biomol. NMR 2015, 62, 453 – 471.[89] J. Orts, B. Vçgeli, R. Riek, J. Chem. Theory Comput. 2012, 8, 3483 – 3492.[90] J. Lowe, D. Stock, B. Jap, P. Zwickl, W. Baumeister, R. Huber, Science
1995, 268, 533 – 539.[91] A. Fçrster, E. I. Masters, F. G. Whitby, H. Robinson, C. P. Hill, Mol. Cell
2005, 18, 589 – 599.[92] V. Tugarinov, R. Sprangers, L. E. Kay, J. Am. Chem. Soc. 2007, 129,
1743 – 1750.[93] S. Nozinovic, B. Fertig, H. R. A. Jonker, C. Richter, H. Schwalbe, Nucleic
Acids Res. 2010, 38, 683 – 694.[94] M. H. Bailor, C. Musselman, A. L. Hansen, K. Gulati, D. J. Patel, H. M. Al-
Hashimi, Nat. Protoc. 2007, 2, 1536 – 1546.[95] I. C. Felli, C. Richter, C. Griesinger, H. Schwalbe, J. Am. Chem. Soc. 1999,
121, 1956 – 1957.[96] H. Schwalbe, T. Carlomagno, M. Hennig, J. Junker, B. Reif, C. Richter, C.
Griesinger, Methods Enzymol. 2002, 338, 35 – 81.[97] J. Boisbouvier, B. Brutscher, A. Pardi, D. Marion, J. P. Simorre, J. Am.
Chem. Soc. 2000, 122, 6779 – 6780.[98] C. M. Grytz, S. Kazemi, A. Marko, P. Cekan, P. Gentert, S. T. Sigurdsson,
T. F. F. Prisner, Phys. Chem. Chem. Phys. 2017, 19, 29801 – 29811.[99] J. Ferner, A. Villa, E. Duchardt, E. Widjajakusuma, J. Wçhnert, G. Stock,
H. Schwalbe, Nucleic Acids Res. 2008, 36, 1928 – 1940.[100] P. Vallurupalli, L. E. Kay, J. Am. Chem. Soc. 2005, 127, 6893 – 6901.[101] J. Rinnenthal, C. Richter, S. Nozinovic, B. Fertig, J. J. Lopez, C. Glaubitz,
H. Schwalbe, J. Biomol. NMR 2009, 45, 143 – 155.[102] G. M. Giambasu, D. M. York, D. A. Case, RNA 2015, 21, 963 – 974.
Manuscript received: May 4, 2018
Accepted manuscript online: June 8, 2018
Version of record online: July 10, 2018
ChemBioChem 2018, 19, 1695 – 1701 www.chembiochem.org T 2018 Wiley-VCH Verlag GmbH & Co. KGaA, Weinheim1701
Minireviews