Extended Medicare Safety Net - Department of Health · Extended Medicare Safety Net A report by the...
92
Extended Medicare Safety Net A report by the Centre for Health Economics Research and Evaluation PREPARED FOR: Australian Government Department of Health & Ageing REVIEW REPORT 2009
Transcript of Extended Medicare Safety Net - Department of Health · Extended Medicare Safety Net A report by the...

Extended Medicare Safety Net
A report by the Centre for Health Economics Research and Evaluation
PrePared for:
Australian Government Department of Health & Ageing
Review RepoRt 2009

Review RepoRt 2009

Extended Medicare Safety NetReview RepoRt 2009
A report by the Centre for Health Economics Research and Evaluation
PrePared for:
Australian Government Department of Health & Ageing

Extended Medicare Safety Net (EMSN) Review RepoRt 2009
II
Extended Medicare Safety Net Review Report 2009
ISBN: 1-74186-873-4 Online ISBN: 1-74186-874-2 Publications Number: P3 -5200
Copyright Statements:
Paper-based publications (c) Commonwealth of Australia 2009 This work is copyright. Apart from any use as permitted under the Copyright Act 1968, no part may be reproduced by any process without prior written permission from the Commonwealth. Requests and inquiries concerning reproduction and rights should be addressed to the Commonwealth Copyright Administration, Attorney-General’s Department, Robert Garran Offices, National Circuit, Barton ACT 2600 or posted at http://www.ag.gov.au/cca
Internet sites (c) Commonwealth of Australia 2009 This work is copyright. You may download, display, print and reproduce this material in unaltered form only (retaining this notice) for your personal, non-commercial use or use within your organisation. Apart from any use as permitted under the Copyright Act 1968, all other rights are reserved. Requests and inquiries concerning reproduction and rights should be addressed to Commonwealth Copyright Administration, Attorney-General’s Department, Robert Garran Offices, National Circuit, Barton ACT 2600 or posted at http://www.ag.gov.au/cca

Extended Medicare Safety Net (EMSN) Review RepoRt 2009
III
Contents
ExEcutIvE Summary v
1 IntroductIon 011.1 What is the Extended Medicare Safety Net (EMSN)? 01
1.2 Background and purpose of the review 01
1.3 Data and information sources 02
1.4 Structure of this report 02
2 thE hEalth carE SyStEm and thE ExtEndEd mEdIcarE SafEty nEt 032.1 Overview of the Australian health system 03
2.2 The Medicare program 03
2.3 The Extended Medicare Safety Net 07
2.4 The original Medicare Safety Net 16
2.5 Other health care safety nets 17
3 thE dIStrIbutIon of out-of-pockEt coStS and EmSn bEnEfItS 193.1 Overview of methods 19
3.2 Distribution for individuals, families and singles 20
3.3 Distribution for income groups 30
3.4 Distribution for regional areas 34
3.5 Effect of the EMSN on patients with complex and chronic conditions 36
3.6 Distribution of EMSN benefits for professional groups 45
3.7 Conclusions 49
4 thE Impact of thE ExtEndEd mEdIcarE SafEty nEt 514.1 Overview of methods 51
4.2 Impact on average fees, benefits and out-of-pocket costs 52
4.3 Impact on bulk billing rates 61
4.4 Impact on patients’ use of medical services 62
4.5 Impact on the service setting 62
4.6 Sensitivity analysis for obstetrics and assisted reproductive services 67
4.7 Impact on individual Medicare items 70
4.8 Conclusions 76
rEfErEncES 79

Extended Medicare Safety Net (EMSN) Review RepoRt 2009
Iv
About CHeReThe Centre for Health Economics Research and Evaluation (CHERE) is an independent research unit affiliated with the University of Technology, Sydney. It has been established since 1991 and in that time has developed a strong reputation for excellence in research and teaching in health economics, health services research and public health and for providing timely and high quality policy advice and support. Its research program is policy-relevant and concerned with issues at the forefront of the sub-discipline.
CHERE has extensive experience in evaluating health services and programs, and in assessing the effectiveness of policy initiatives. The Centre provides policy support to all levels of the health care system, through both formal and informal involvement in working parties and committees, and by undertaking commissioned projects. For further details on our work, see <http://www.chere.uts.edu.au>.
PRojeCt teAm A/Prof. Elizabeth Savage Mr Kees van Gool A/Prof. Marion Haas A/Prof. Rosalie Viney Mr Minh Vu
ACknowledgementsIn preparing this report, the CHERE project team would like to acknowledge the assistance of officers from the Department of Health and Ageing. In particular, we would like to thank Rebecca Dadds, Jenny Reed, Lisa Simpson and Dayna Swiatek, from the Medicare Safety Net and Review Section, and Ross Saunders, Alan Wojcik and Chris Wall from the Medicare Financing and Analysis Branch. We would also like to thank Dr Gillian Sykes for editorial assistance and Professor Denzil Fiebig for econometrics advice.
ContACt detAils
Associate Professor Elizabeth Savage Mr Kees van Gool Centre for Health Economics Research and Evaluation (CHERE) University of Technology, Sydney PO Box 123 Broadway NSW 2007 Tel: + 61 2 9514 4720 Fax: + 61 2 9514 4730

Extended Medicare Safety Net (EMSN) Review RepoRt 2009
v
exeCutive summARyThe Extended Medicare Safety Net (EMSN) was introduced at a time when Australians were facing substantial increases in out-of-pocket costs for their medical services. This government policy was designed to provide additional financial relief for those patients with high out-of-pocket costs, particularly those with complex and high health care needs.
The EMSN takes effect once a family or single person has reached a certain threshold in out-of-pocket costs incurred through their use of Medicare out-of-hospital services. Once the threshold is reached, the EMSN pays 80% of the out-of-pocket costs for Medicare-related services for the rest of the calendar year. The policy does not apply to in-hospital services or to medical services that are ineligible for Medicare benefits.
When the EMSN was introduced in March 2004, the lower threshold was $300 for Commonwealth concession cardholders and those families who qualified for a Family Tax Benefit Part A payment, and the general threshold was $700 for all other singles and families. From 1 January 2006, the lower threshold increased to $500 and the general threshold increased to $1,000. The thresholds are indexed to the Consumer Price Index at the start of every calendar year.
About tHis ReviewThis report presents an evidence-based review of the EMSN. The objective of the review was to analyse: (1) the operation of the EMSN; (2) the extent to which the introduction of the EMSN has achieved its stated purpose; and (3) any changes to Medicare billing and patient access to medical services which have been a direct consequence of the introduction of the EMSN. The review is not intended to provide specific recommendations to government on the future operation of the EMSN.
key findingsThe EMSN targets a growing problem. Whilst most people face out-of-pocket costs of less than $50 per year, some members of the community face significant medical bills for out-of-hospital services. In 2007, around 7% of individuals had out-of-pocket costs of over $300 per year, compared with around 3% in 2000. In 2007, 11,000 Australians incurred out-of-pocket costs of more than $2,000. The number of people with these very high out-of-pocket costs initially fell after the introduction of the EMSN, but has been rising since.
The EMSN distributed some $324 million to approximately 790,000 Australians to reduce their out-of-pocket costs in 2007 (using date of service information).
In 2007, less than 1% of single people and 9% of families who claimed at least one Medicare service received EMSN benefits. On average, families who qualified for EMSN benefits on the general threshold received $1,200, whereas recipients of Family Tax Benefit Part A received around $600, and families with Commonwealth concession cards received less than $400. Singles on the general threshold received $1,000 in EMSN benefits, while those with Commonwealth concession cards received $400.
After the threshold changes in 2006, a large number of singles and families no longer qualified for EMSN benefits. However, for those who did still qualify, the average amount of benefits they received increased.

Extended Medicare Safety Net (EMSN) Review RepoRt 2009
vI
Consistent with the fact that people in affluent areas incur more out-of-pocket costs, we found that some 55% of EMSN benefits are distributed to the top quintile of Australia’s most socioeconomically advantaged areas, whereas the least advantaged quintile receive less than 3.5%.
EMSN benefits are highly concentrated in certain types of services. In 2007, over 30% of all EMSN benefits helped fund obstetric services and 22% went towards assisted reproductive services. The EMSN has more than doubled the amount of Commonwealth funding going towards these two professional groups. Only 8% of EMSN benefits went towards funding general practice consultations.
Based on the available evidence, the EMSN appears to be more effective at directing assistance to cancer patients than to other patients with high health care needs and complex conditions. The 27% of patients with cancer who claimed at least one Medicare service for chemotherapy or radiotherapy, and who qualified for the EMSN in 2007, received over $1,000 in benefits. For the 5% of diabetic patients who qualified, the EMSN provided, on average, $369 in benefits.
We observed a small increase in the use of some services such as radiation oncology and private obstetrics after the introduction of the EMSN. However, the demand for assisted reproductive services grew substantially.
The government’s additional spending on EMSN benefits has not been matched by a drop in patients’ out-of-pocket costs. Since its introduction, there have been concerns that the EMSN may lead providers to increase fees and thereby dilute the potential benefits to patients. Since the introduction of the EMSN, average fees have increased by around 4.2% per year (excluding general practice and pathology). This increase is over and above the rate of inflation. We estimate that the EMSN is responsible for 70% of this increase. That is, we estimate that the EMSN was directly responsible for a 2.9% increase in fees per year.
These fee increases have resulted in considerable leakage of government benefits towards providers’ incomes, rather than reduced costs for patients. A conservative estimate is that, for every dollar spent on the EMSN in 2008, providers received 43 cents and patients received 57 cents. However, for Medicare services that are associated with high out-of-pocket costs (that is greater than $50), this estimate is as high as 78 cents for providers and 22 cents for patients. Services in this group include those associated with assisted reproductive technologies as well as procedures to treat varicose veins and vision impairments.

Extended Medicare Safety Net (EMSN) Review RepoRt 2009
vII
ConClusionThe EMSN was designed to provide financial relief for those who incur high out-of-pocket costs and thereby make health care services more affordable. High out-of-pocket costs are widely regarded as a barrier to health care, especially amongst poorer sections of the community, and are likely to lead to greater health inequities. In Australia, people with high incomes are more likely to consult a specialist than those on low incomes. There is evidence that affordability (or lack thereof) is a key factor in explaining the use of specialist services.
The EMSN appears to have made services more affordable for some (people using assisted reproductive services, some patients with complex health conditions such as cancer), but has had little impact for those in more remote areas or in lower socioeconomic groups. Despite the lower threshold for low and middle income households, the EMSN appears to be a relatively ineffective way to direct higher benefits to those households.
A concern is that most EMSN benefits have flowed to services that are more often used by wealthier sections of the community. The implication of this is that the EMSN has increased the affordability of high-cost services for these groups, but has had relatively little impact on the affordability of medical services for other sections of the Australian population. In this sense, the EMSN is a poorly targeted policy because it has not addressed one of the main barriers to access that many patients on low incomes face.
In the context of Medicare, the EMSN is a small program, but it has fundamentally changed insurance arrangements for out-of-hospital services. The Medicare program caps the amount of benefits per service. The EMSN, on the other hand, provides benefits that increase with provider fees, regardless of how high those fees may be. This feature has resulted in significant increases in provider fees for some services and has meant that patients do not receive the full benefit of the EMSN.
The impact of the EMSN on fees is most pronounced for Medicare items that are usually associated with high out-of-pocket costs per service. We believe that providers know, if they bill these items, their patients are likely to qualify for EMSN benefits. Under these circumstances, providers feel fewer competitive constraints on their fees.
The evidence on increasing fees across a number of medical specialities has implications for those who need these services, but do not qualify for EMSN benefits.


Extended Medicare Safety Net (EMSN) Review RepoRt 2009
01
1 intRoduCtion
1.1 What is the Extended Medicare Safety Net (EMSN)? The Extended Medicare Safety Net (EMSN) was introduced in March 2004 to make medical services more affordable for all Australians, particularly for those with complex health needs, families and others with high health care needs (Department of Health and Ageing 2004).
The EMSN targets families and single people who have incurred high out-of-pocket (OOP) costs through their use of out-of-hospital Medicare services. OOP costs refer to the amount of money spent on medical services by a patient from their own pockets. The EMSN pays 80% of OOP costs once a family or single person has reached one of two thresholds:
• Commonwealth concession cardholders and/or recipients of Family Tax Benefit Part A (FTB(A)) qualify once they reach the lower threshold, which was $555.70 as of January 2009.
• All other members of the public qualify once they reach the general threshold, which was $1,111.60 as of January 2009.
Thresholds are indexed to the Consumer Price Index at the start of every calendar year. Family members’ individual OOP costs contribute to the family threshold as long as that family has registered with Medicare Australia. Once a registered family has reached their threshold, all family members will receive EMSN benefits to cover further OOP costs for the rest of the calendar year. Singles do not have to register with Medicare Australia, as they alone contribute OOP costs towards their threshold.
The EMSN complements existing Medicare arrangements. Importantly, it only covers OOP costs incurred above the Medicare benefit for services delivered in an out-of-hospital setting. The policy does not apply to in-hospital services or to medical services that are ineligible for Medicare benefits. People who are eligible for Medicare are also eligible for the EMSN.1
1.2 Background and purpose of the reviewThe EMSN was introduced under the Health Legislation Amendment (Medicare) Act 2004. Section 4 of the Act stipulates that:
(1) The Minister must initiate, by the third anniversary of the day on which this Act commences, a review of the operation, effectiveness and implications of this Act.
(2) In selecting a person to conduct the review required by this section, the Minister must seek and select a person from nominations received from independent academic institutions.
(3) The Minister must cause to be tabled in both Houses of the Parliament a copy of the report of the review within 15 sitting days of receiving the report.
The Centre for Health Economics Research and Evaluation (CHERE) at the University of Technology, Sydney was contracted in December 2008 to undertake the review and submit the final report in April 2009.
1 To be eligible for Medicare people must reside in Australia—excluding Norfolk Island—and (1) hold Australian citizenship; (2) have been issued with a permanent visa; (3) hold New Zealand citizenship; or (4) have applied for a permanent visa (excludes an application for a parent visa).

Extended Medicare Safety Net (EMSN) Review RepoRt 2009
02
The objective of the review was to undertake an independent evidence-based analysis of the EMSN. As set out in the terms of reference, this review analyses:
• the operation of the EMSN since its commencement in March 2004
• the extent to which the introduction of the EMSN has achieved its stated purpose, and
• any changes to Medicare billing and patient access to medical services which have been a direct consequence of the introduction of the EMSN.
The review is not intended to provide specific recommendations to government on the future operation of the EMSN.
1.3 Data and information sourcesThe Department of Health and Ageing has provided CHERE with the necessary de-identified data to undertake this review in line with the data requirements specified by members of the CHERE project team. Aside from checks for data consistency, it was not possible for CHERE to verify the accuracy of the data supplied.
As part of the information used in this review, we examined a sample of correspondence from the general public received by the Department of Health and Ageing. In addition, we spoke to representatives of the Australian Medical Association (AMA) about their views on the EMSN. The comments and issues raised by providers and the public have helped us interpret our findings and will be referred to throughout this report.
Supplementary information to this report can be found at <http://www.health.gov.au>, including methods used for this analysis, a summary of issues identified by the members of the public and representatives of the AMA, more detailed results, and aggregate data used to conduct the analysis.
1.4 Structure of this reportThe structure of this report is aligned to the terms of reference. Section 2 gives an overview of the Australian health care system and the Medicare program. It then describes the EMSN, its purpose and place in the Medicare program, and how it operates.
Section 3 of this report examines the distribution of OOP costs to the population and changes to OOP costs after the introduction of the EMSN. Section 3 also reports on the distribution of EMSN benefits to the population by income groups, regional areas, and for patients with complex and chronic conditions. Finally, this section reports on the distribution of EMSN benefits to professional groups.
Section 4 measures the extent to which the introduction of the EMSN has made Medicare services more affordable. It examines the impact of the EMSN on changes to provider fees, government benefits paid, and OOP costs per service. It examines these impacts for a range of professional groups as well as for individual Medicare items. In addition, Section 4 reports on the extent to which the EMSN has impacted on in-hospital and out-of-hospital fee structures, and whether there have been changes in the use of particular services.

Extended Medicare Safety Net (EMSN) Review RepoRt 2009
03
2 tHe HeAltH CARe system And tHe extended mediCARe sAfety net
2.1 Overview of the Australian health system The Australian health care system is characterised by universal free access to public hospitals and subsidised access to medicines and health services. The system is predominantly publicly funded but there are significant contributions from private health insurance and direct patient contributions through out-of-pocket (OOP) costs.
Publicly provided and financed health care is a shared responsibility between various levels of government. The Commonwealth Government has responsibility for financing health services and pharmaceutical benefits. The state and territory governments finance, own and operate public hospitals. However, the Commonwealth currently provides a significant funding contribution to public hospital operating costs. From 1 July 2009, the National Healthcare Agreements2 will provide funding to states and territories for prevention and primary care in addition to public hospital funding.
Australians can choose to purchase private health insurance that covers hospital accommodation charges in either a public or private hospital, a portion of the medical fees charged by private medical providers, and prostheses and devices provided to private patients in hospital. Private hospital cover duplicates the entitlements afforded to Australians under the National Healthcare Agreements and the Medicare program (OECD 2004).
In addition, private insurers offer supplementary coverage for ancillary type services, which include dental care, allied health services such as physiotherapy, and complementary care such as chiropractic and acupuncture. Annual premiums vary depending upon the extent of cover, the front-end deductible (also known as an ‘excess’) and the state of residence. In general, private health insurers cannot cover out-of-hospital services that are funded under Australia’s Medicare program, although, following reforms in 2007, insurers can cover a broader range of chronic conditions and hospital substitute programs.
2.2 The Medicare programMedicare is a universal program and has been a fundamental component of Australia’s public health care funding arrangements. It is a Commonwealth Government funded program and subsidises health services including consultations with general practitioners (GPs)3, psychiatrists, obstetricians, pathologists and other specialist medical practitioners, as well as diagnostic, therapeutic and allied health services. These services are privately provided; providers are paid by patients on a fee-for-service basis and patients are reimbursed by the government.
Medicare subsidises the costs of services that are provided out of hospital (for example doctor’s consulting rooms) as well as in-hospital services provided to private patients. The Medicare program defines around 5,700 different medical services. The government assigns each service a Medicare Benefits Schedule (MBS) item number and fee. (From here on, we refer to an item as a ‘Medicare item’ and the associated fee as the ‘MBS fee’.) The Medicare item definitions and associated MBS fees are listed in the MBS, which is updated regularly to reflect fee changes and approved new medical services.
2 Previously, the Australian Health Care Agreements provided funding to the state and territory governments for public hospital funding.
3 In this report we use ‘GP’ to refer to both general practice and a general practitioner.
Extended Medicare Safety Net (EMSN) Review RepoRt 2009
04
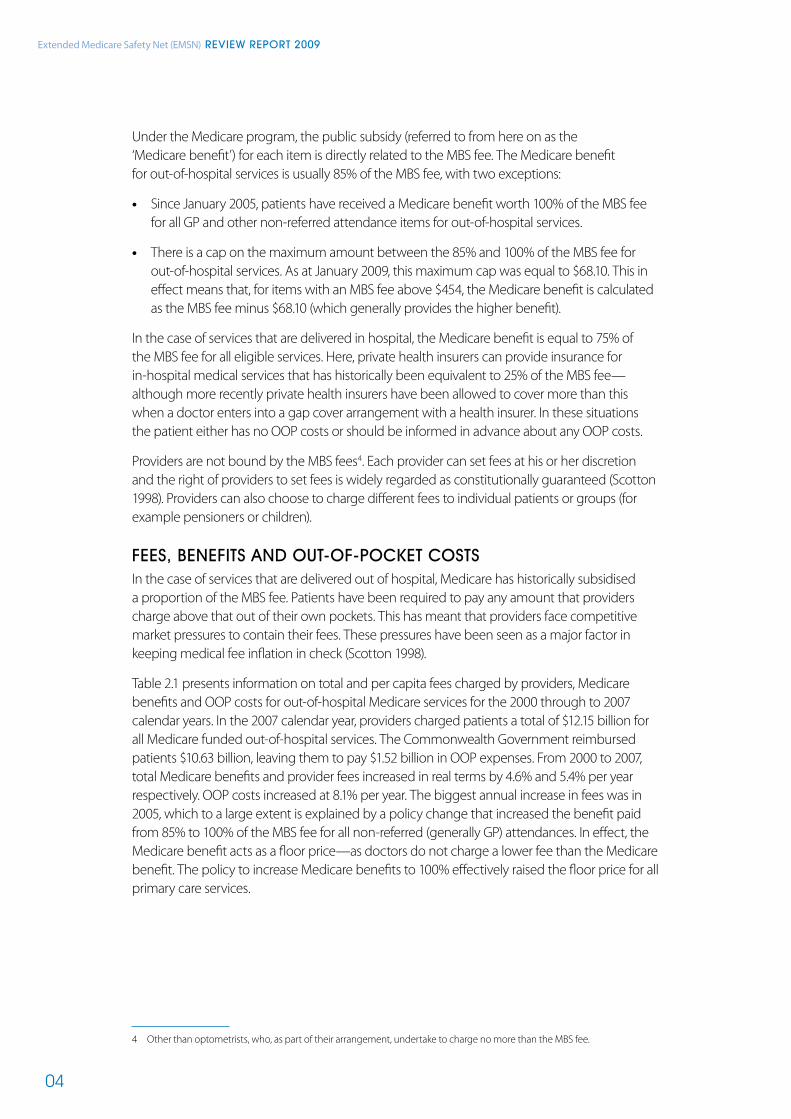
Under the Medicare program, the public subsidy (referred to from here on as the ‘Medicare benefit’) for each item is directly related to the MBS fee. The Medicare benefit for out-of-hospital services is usually 85% of the MBS fee, with two exceptions:
• Since January 2005, patients have received a Medicare benefit worth 100% of the MBS fee for all GP and other non-referred attendance items for out-of-hospital services.
• There is a cap on the maximum amount between the 85% and 100% of the MBS fee for out-of-hospital services. As at January 2009, this maximum cap was equal to $68.10. This in effect means that, for items with an MBS fee above $454, the Medicare benefit is calculated as the MBS fee minus $68.10 (which generally provides the higher benefit).
In the case of services that are delivered in hospital, the Medicare benefit is equal to 75% of the MBS fee for all eligible services. Here, private health insurers can provide insurance for in-hospital medical services that has historically been equivalent to 25% of the MBS fee—although more recently private health insurers have been allowed to cover more than this when a doctor enters into a gap cover arrangement with a health insurer. In these situations the patient either has no OOP costs or should be informed in advance about any OOP costs.
Providers are not bound by the MBS fees4. Each provider can set fees at his or her discretion and the right of providers to set fees is widely regarded as constitutionally guaranteed (Scotton 1998). Providers can also choose to charge different fees to individual patients or groups (for example pensioners or children).
fees, benefits And out-of-PoCket CostsIn the case of services that are delivered out of hospital, Medicare has historically subsidised a proportion of the MBS fee. Patients have been required to pay any amount that providers charge above that out of their own pockets. This has meant that providers face competitive market pressures to contain their fees. These pressures have been seen as a major factor in keeping medical fee inflation in check (Scotton 1998).
Table 2.1 presents information on total and per capita fees charged by providers, Medicare benefits and OOP costs for out-of-hospital Medicare services for the 2000 through to 2007 calendar years. In the 2007 calendar year, providers charged patients a total of $12.15 billion for all Medicare funded out-of-hospital services. The Commonwealth Government reimbursed patients $10.63 billion, leaving them to pay $1.52 billion in OOP expenses. From 2000 to 2007, total Medicare benefits and provider fees increased in real terms by 4.6% and 5.4% per year respectively. OOP costs increased at 8.1% per year. The biggest annual increase in fees was in 2005, which to a large extent is explained by a policy change that increased the benefit paid from 85% to 100% of the MBS fee for all non-referred (generally GP) attendances. In effect, the Medicare benefit acts as a floor price—as doctors do not charge a lower fee than the Medicare benefit. The policy to increase Medicare benefits to 100% effectively raised the floor price for all primary care services.
4 Other than optometrists, who, as part of their arrangement, undertake to charge no more than the MBS fee.

Extended Medicare Safety Net (EMSN) Review RepoRt 2009
05
Table 2.1: Total and per capita fees, benefits and OOP costs for out-of-hospital services
yeAR
PRovideR fees mediCARe benefits ooP Costs
$ million PeR CAPitA $ million PeR CAPitA $ million PeR CAPitA
2000 8,390 438 7,510 393 879 46
2001 8,610 444 7,640 394 967 50
2002 8,860 451 7,750 395 1,110 56
2003 9,040 454 7,770 391 1,270 64
2004 9,810 487 8,560 425 1,250 62
2005 10,900 534 9,660 473 1,250 61
2006 11,250 544 9,860 476 1,380 67
2007 12,150 578 10,630 506 1,520 72
Note: Dollar amounts shown have been indexed to 2007 dollars using the Consumer Price Index.
From 2000 to 2007, total Medicare benefits increased by 29%. The vast majority of the growth occurred after 2004, coinciding with the introduction of the Strengthening Medicare package (more on this below). In the four years prior to this, government benefits remained relatively steady in real terms. With provider fees outpacing government benefits, the OOP gap widened from $46 to $72 per capita over the period from 2000 to 2007—a 58% increase (6.7% per year).
OOP costs for Medicare out-of-hospital services accounted for approximately 12% of the overall OOP costs faced by patients directly (Australian Institute of Health and Welfare 2008). As shown in Figure 2.1, in the decade following the introduction of Medicare, average OOP costs per service remained relatively stable. In the four years prior to 1996, OOP costs fell in real terms—mostly explained by the rise in the rate of bulk billing for most types of medical services during that period.
After 1996, OOP costs started to rise, but this trend was arrested after 2004—coinciding with the then government’s MedicarePlus package (which was later renamed the Strengthening Medicare package) (Department of Health and Ageing 2008).

Extended Medicare Safety Net (EMSN) Review RepoRt 2009
06
Figure 2.1: Average OOP costs per service
Note: This figure shows average OOP costs for Medicare out-of-hospital services, based on bulk billed and patient billed services. Dollar amounts shown have been indexed to 2007 dollars using the Consumer Price Index.
Source: Department of Health and Ageing (2008)
stRengtHening mediCARe The Strengthening Medicare package contained a number of policy measures to reduce the OOP cost burden associated with health services. These measures, which were implemented throughout 2004 and at the start of 2005, were mostly directed at the primary care sector, or general practice. They were aimed at increasing the bulk billing rate and thereby reducing OOP costs in that sector5. They included:
• bulk billing incentives for GP, GP-provided pathology, and self-determined diagnostic imaging services to Commonwealth concession cardholders and children under 16 years of age
• higher bulk billing incentives for GPs in non-metropolitan areas, Tasmania and eligible urban areas and large regional centres for bulk billed consultations to Commonwealth concession cardholders and children under 16 years of age
• an increase in the Medicare benefit to 100% (from 85%) of the MBS fee for GP and non-referred attendances (implemented in January 2005)
• new Medicare items for certain allied health and dental services.
Another initiative of the Strengthening Medicare package was the Extended Medicare Safety Net (EMSN), introduced in March 2004 to give people relief from high OOP costs.
5 For further information see Savage and Jones (2004).
0
1
2
3
4
5
6
7
8
1984/1985
1985/1986
1986/1987
1987/1988
1988/1989
1989/1990
1990/1991
1991/1992
1992/1993
1993/1994
1994/1995
1995/1996
1996/1997
1997/1998
1998/1999
1999/2000
2000/2001
2001/2002
2002/2003
2003/2004
2004/2005
2005/2006
2006/2007
2007/2008
$

Extended Medicare Safety Net (EMSN) Review RepoRt 2009
07
2.3 The Extended Medicare Safety Net
PuRPose At the time of its introduction, the then government said that the purpose of the EMSN was to protect all Australians from high OOP costs for medical services provided out of hospital, particularly those with complex health needs, families and others with high health care needs (Department of Health and Ageing 2004; Australia, House of Representatives 2003a). The Chair of the government’s policy committee on health and ageing noted that the EMSN was ‘designed to take the pressure off those families who may be struggling to balance the family budget and meet their health care needs’ (Australia, House of Representatives 2003b).
The EMSN takes effect once a family or single person has reached a certain threshold in OOP costs. Once the threshold is reached, the EMSN pays 80% of the OOP costs for Medicare-related services for the rest of the calendar year. We give more detail on these thresholds below.
The reason for referring to this new initiative as the ‘extended’ Medicare Safety Net is that there already existed an ‘original’ Medicare Safety Net, which was introduced at the same time as Medicare in 1984. Section 2.4 gives more detail about the relationship between the two Medicare safety nets. However, the rest of this section focuses on how the EMSN operates.
CoveRAgeUnlike the other Strengthening Medicare initiatives, the EMSN encompasses all out-of-hospital services, not just primary care services (Jones, Savage & Hall 2004). It supplements existing Medicare arrangements in that it only covers services that are listed in the MBS, and is bound by the same rules and regulations for subsidising fees. Importantly, however, the EMSN is restricted to providing additional subsidies to out-of-hospital services, whereas the Medicare program subsidises both out-of-hospital and private in-hospital health services.
Some members of the public have complained to the Department of Health and Ageing that the EMSN definition of OOP costs is not sufficiently broad. They raised the fact that they still incurred high medical costs through their use of private in-hospital services or through allied health services not covered by Medicare. This point highlights the fact that the Medicare program does not cover all types of out-of-hospital health care services (for example only some allied health services are covered), and, as a result, such services are not covered by the EMSN either.
tHResHoldsBefore they can qualify for the EMSN, single people and families must reach one of two thresholds:
• Commonwealth concession cardholders and/or recipients of Family Tax Benefit Part A (FTB(A)) qualify once they reach the lower threshold, which was $300 at the time the policy commenced in March 2004.
• All other members of the public qualify once they reach the general threshold, which was $700 when the policy commenced.
The thresholds operate on a calendar year basis and the threshold count starts afresh on 1 January of each year. This means that the EMSN stops providing benefits at the start of each calendar year, until the family or single person reaches the threshold again.

Extended Medicare Safety Net (EMSN) Review RepoRt 2009
08
This was raised as an issue of concern by members of the public who required treatment which spanned two calendar years. They considered it unfair that the cut-off point of 31 December resulted in them being burdened with additional OOP costs. Providers also highlighted this issue as not being in the interests of patients. Other possible options would have involved a significant departure from current Medicare arrangements and prevent the EMSN operating as a national program, consistent for all Australians.
In January 2006, there was a one-off threshold adjustment where the EMSN lower and general thresholds rose to $500 and $1,000 respectively. These thresholds were consistent with the then government’s original proposed threshold levels, which were subsequently amended in the Senate in 2004 (see the end of Section 2.3 for more about the development of the EMSN).
Thresholds are indexed to the Consumer Price Index and adjusted at the start of each calendar year. Table 2.2 summarises the thresholds, beneficiaries and benefits for the EMSN. It shows that the thresholds for the 2009 calendar year are $555.70 for Commonwealth concession cardholders and FTB(A) families, and $1,111.60 for all other members of the public.
Table 2.2: EMSN thresholds as of 1 January 2009
tHResHolds benefiCiARies CAlCulAtion bAse benefits
Lower $555.70 Commonwealth concession cardholders and/orFamilies eligible for Family Tax Benefit Part A (FTB(A))
OOP costs—the difference between the provider’s charge and the Medicare benefit
80% of OOP costs for out-of-hospital services
General $1,111.60 All other Medicare cardholders
As above 80% of OOP costs for out-of-hospital services
Singles and families are both eligible for the same threshold amounts. However, family members can combine their individual OOP costs to reach a threshold sooner. Once a family or single person reaches their EMSN threshold, subsequent OOP costs will be reimbursed at 80% for services provided in that year. In the case of families, the EMSN will provide benefits for all family members. The thresholds vary only by eligibility for either a Commonwealth concession card or FTB(A), not by family size.
Table 2.3 presents information on the number of people eligible for the lower and general thresholds as well as the number of people who have received an EMSN benefit. Consistently, less than half the population has been eligible for the lower threshold. Before the 2006 threshold changes, approximately 8% of the population eligible for the lower threshold received EMSN benefits whereas only 5% of those eligible for the general threshold received benefits. After the threshold changes, this percentage fell relatively more in the lower threshold population than in the general threshold population. In 2007, 5% of those eligible for the lower threshold received EMSN benefits and the corresponding figure for the general threshold population was just under 4%.

Extended Medicare Safety Net (EMSN) Review RepoRt 2009
09
Table 2.3: Number of eligible people and EMSN recipients, by threshold
numbeR of eligible PeoPle numbeR of emsn ReCiPients
loweRtHResHold
geneRAltHResHold
loweRtHResHold
geneRAltHResHold
Year ‘000 ‘000 ‘000 ‘000
2005 10,299 7,417 824 338
2006 10,544 7,396 443 232
2007 10,687 7,690 502 288
Note: Only includes people who submitted a claim to Medicare during the selected years.
exPendituReIn the context of the overall Medicare program, the EMSN is relatively small. In 2007, the EMSN represented about 3% of total government Medicare benefits ($324 million out of a total $10.63 billion). Table 2.4 provides details of the amount of net Medicare benefits and EMSN benefits paid by government. Net Medicare benefits refer to the amount of Medicare benefits paid by government, excluding EMSN expenditure. The table also shows that total EMSN benefits have increased in every year except 2006—the year in which the EMSN thresholds were increased.
Table 2.4: Medicare and EMSN expenditure6
net mediCARe benefitsextended mediCARe
sAfety net
yeAR $ million $ million
2004 8,340 210
2005 9,359 292
2006 9,600 250
2007 10,295 324
eligibility foR loweR tHResHoldTo be eligible for the lower EMSN threshold, singles must first be eligible for a Commonwealth concession card, and families must be eligible for FTB(A) and/or a Commonwealth concession card.
Eligibility for FTB(A) is based on a means test on family income, and adjusted for the number and age of any children in the family. Commonwealth concession card eligibility is based on a number of criteria. Table 2.5 summarises the eligibility criteria for FTB(A) and Commonwealth concession cards.
6 Data shown in this report are based on the Date of Service, unless otherwise stated. These numbers may be different to those based on the Date of Processing. All figures are in constant 2007 dollars.

Extended Medicare Safety Net (EMSN) Review RepoRt 2009
10
Table 2.5: Eligibility criteria for FTB(A) or Commonwealth concession cards
goveRnment PRogRAm/PoliCy Aim eligibility CRiteRiA
Family Tax Benefit Part A (FTB(A))
A tax benefit to help families with the cost of raising children.
Families must have at least one dependent child under 21 (or full-time student aged 21 to 24), care for that child for a certain percentage of the year, and have income under a certain amount. As at January 2009, maximum family income for FTB(A) eligibility for a person with one child under 18 was $100,801. The income threshold increases with each additional child.
Health Care Card To help low income earners with the cost of medicines and a limited number of concessions.
Families or individuals must be a recipient of one of the following payments or allowances: (1) Newstart; (2) Exceptional Circumstances Relief; (3) Special Benefit; (4) Sickness; (5) Partner; (6) Widow; (7) Youth (Job Seeker); (8) Parenting; (9 ) the maximum rate of FTB(A); (10) Mobility; or (11) Carer or care for a foster child (the card is issued in the name of the child).Low income singles and families may be eligible for a Low Income Health Care Card (see below).
Pensioner Concession Card
To help low income earners receiving selected payments with the cost of medicines and a range of concessions.
Families or individuals must receive one of the following: (1) pension; (2) Parenting Payment (single); (3) Carer Payment (adult or child); (4) Newstart Allowance (as a single carer of dependent child/ren); (5) Youth Allowance (Job Seeker) (as a single carer of dependent child/ren); (6) aged over 60 and have been receiving one of the following payments: (a) Newstart; (b) Sickness; (c) Widow; (d) Partner Parenting Payment; or (e) Special Benefit for a continuous period of nine months or more.
Commonwealth Seniors Health Card
To help people of age pension age who do not qualify for the pension with the cost of medicines and a range of concessions.
Families or individuals must have reached age pension age but do not qualify for a social security pension or benefit and have an annual adjusted taxable income of less than $50,000 (singles); $80,000 (couples combined); or $100,000 (couples combined who are separated due to ill health). The income limits are increased for each dependent child in their care.
Low Income Health Care Card
To help low income earners with the cost of medicines and a limited number of concessions.
This card is issued to people who meet a test of their average gross income in the 8 weeks immediately before they claim the card, but who are not eligible for one of the payments or allowances listed under the Health Care Card eligibility criteria above. As at March 2009, the income threshold was equivalent to an annual income of $23,400 for singles, $38,948 for couples with no children and $40,716 for singles/couples with one child (increasing by $1,768 for each dependent child).
For those FTB(A) families eligible for the lower threshold, the way they choose to receive their FTB(A) payments will determine when the lower threshold applies. For example, families who choose to receive FTB(A) fortnightly payments are eligible for the lower threshold from the date of their first FTB(A) payment for that calendar year. Similarly, if the FTB(A) fortnightly payment is deferred, threshold eligibility commences from the date of deferment. If a family claims FTB(A) as a lump sum and the lump sum payment is received on or before 31 December, the lower threshold commences from 1 January the following year. For lump sum payments received after 31 December, families are eligible for the lower threshold from the date of that payment.

Extended Medicare Safety Net (EMSN) Review RepoRt 2009
11
A ‘concessional family’ consists of at least one adult plus one other family member, both of whom are entitled to a Commonwealth concession card. In the case where some members of a family are Commonwealth concession cardholders and some are not, the OOP costs accumulated by the concessional members count towards both the lower threshold and the general threshold for the family. However, the OOP costs accumulated by the non-concessional family members do not count towards the lower threshold, only towards the general threshold. The different treatment of family members adds considerable complexity to the policy and was raised as an issue of concern by members of the public.
Singles and families who become eligible for the lower threshold retain their entitlement for the lower threshold for the rest of the calendar year, regardless of any changes in circumstances.
The existence of two levels of EMSN thresholds shows that the government intended to provide those on low and middle incomes (generally Commonwealth concession cardholders and recipients of FTB(A)) with additional financial relief from high OOP costs. Indeed the Chair of the then government’s policy committee on health and ageing said that the EMSN was designed to take the pressure off those families who may be struggling to balance the family budget and meet their health care needs (Australia, House of Representatives 2003b).
Correspondence received by the Department of Health and Ageing raised the perceived inequity of both families and singles being eligible for the same EMSN threshold. Correspondents argued that the threshold for singles should be lowered because there are economies of scale in the cost of living for families. An equivalent threshold for families and singles is consistent with other government programs such as the original Medicare Safety Net and the Pharmaceutical Benefits Scheme (PBS) Safety Net (see Section 2.4 and Section 2.5 for more details about these other programs). The rationale for this policy is that couples and families need to meet the medical and prescription costs for a number of people, whereas an individual only has to pay for his or her own treatment or medicines.
Representatives of the Australian Medical Association (AMA) emphasised during our consultation that there are considerable difficulties associated with explaining to patients how the EMSN operates and assisting them to understand how it will affect them. It was felt that there was a general lack of awareness and understanding in the community, as well as amongst some provider groups, about the EMSN. Issues of eligibility, changes in family composition and the re-commencement of the scheme on 1 January each year were given as examples of the complexity of the scheme. These issues arose in a number of medical practices attempting to deal with the EMSN.

Extended Medicare Safety Net (EMSN) Review RepoRt 2009
12
RegistRAtion of fAmiliesSingles are automatically registered for the EMSN. However, for family members’ individual OOP costs to be counted towards a family threshold, the family (or couple) must first register with Medicare Australia. This involves completing a Medicare Safety Net registration form that asks respondents to provide the names and Medicare card numbers of partners and dependants. Families can register on-line, by visiting a Medicare office, or by telephoning or writing to Medicare Australia. Whilst a family only has to register once, they will be asked to confirm that there have been no changes to the family when nearing the EMSN threshold in subsequent years.
The definition of a family for safety net purposes was broadened under the Same-Sex Relationships (Equal Treatment in Commonwealth Laws—General Law Reform) Act 2008. The Health Insurance Act 1973 was consequently amended to recognise same-sex relationships. A family for EMSN purposes is now defined as:
• a couple legally married and not separated, or a couple in a de facto partnership with or without dependent children, or
• a single person with dependent children.
These amendments addressed a number of concerns raised by members of the public who had written to the Department of Health and Ageing. Prior to the amendments, same-sex couples were not classified as a ‘couple’ for the purpose of EMSN registration.
A dependent child is a child under 16 years, or a full-time student at a school, college or university under 25 years, whom the parent/s support. Members of the public have raised the issue that there are some inconsistencies between the EMSN and other government programs on the definition of a dependant.
Dependent children of separated or divorced parents are entitled to be members of two registered families—but only the family which pays the cost of the medical service is entitled to have the OOP costs count towards their threshold and receive any EMSN benefit. Box 2.1 illustrates various ways people qualify for EMSN benefits under the lower and general thresholds.

Extended Medicare Safety Net (EMSN) Review RepoRt 2009
13
Box 2.1: General or lower threshold: eligibility scenarios
Scenario 1—Family/couple eligible for the general thresholdSue and Steve are married with no children. They are both working, and they are not eligible for Family Tax Benefit Part A (FTB(A)) or a Commonwealth concession card. They have registered as a family for the Extended Medicare Safety Net (EMSN) from 1 January 2009. During the year, their out-of-pocket (OOP) costs have reached $1,100 for out-of-hospital Medicare services. They are contacted by Medicare Australia to confirm their family status (that is to confirm that all family members are registered and meet the definition of a family for EMSN purposes). They confirm this, and Sue’s next specialist appointment takes their OOP costs to the EMSN general threshold of $1,111.60. For all remaining out-of-hospital services provided during the year, the family will receive the Medicare benefit amount (85% of the MBS fee) and 80% of their OOP costs. On 1 January 2010, they no longer qualify for EMSN benefits until they reach the threshold again.
Scenario 2—FTB(A) familiesKarim and Despina have two dependent children under the age of 15 and their combined income means they are eligible for FTB(A) for the 2009 calendar year. They have elected to receive their FTB(A) payment as a lump sum with their 2009–10 tax return, which they receive on 1 September 2010. They are now eligible for the EMSN lower threshold, commencing on 1 January 2011. For the 2010 calendar year, they will qualify for EMSN benefits only if they reach the general threshold. Their eligibility for the lower threshold starts from the next calendar year (2011), and they remain eligible for that whole year, even if they are no longer eligible for FTB(A) in the 2010–11 financial year.
Jim and Jane also have two dependent children under the age of 15, and are also eligible for FTB(A). They became eligible on 1 March 2009, when Jim reduced his working hours, and they elected to receive their FTB(A) payments fortnightly through the Family Assistance Office. They are now eligible for the EMSN lower threshold, commencing from the date of their first FTB(A) payment (13 March 2009).
If Jim and Jane had already incurred more than $555.70 in OOP costs for claims lodged before 13 March 2009, they would not be entitled to a benefit under the EMSN for those services already received. This is because the general threshold applied to the family prior to 13 March 2009. Once they become eligible for the EMSN lower threshold, Jim and Jane remain eligible for the remainder of the 2009 calendar year, even if they do not remain eligible for FTB(A).
Scenario 3—Family with shared custody of childrenKarl and Laura share custody of their child, Elise, with each parent having Elise live with them on alternate weeks. Laura and her partner Susan also have a dependent child, Sarah. Laura, Susan and both children are registered as a family and are nearing the EMSN general threshold.
Karl and Elise are also registered as a family for the EMSN. While Elise is living with her father, she has a visit to the general practitioner (GP), who charges $53 for the consultation. However, because Karl has paid for this consultation and claims the Medicare benefit, the OOP cost for the consultation counts towards the threshold for the family of Karl and Elise, and not towards the threshold for Laura’s family.
Elise has a follow-up visit with the same GP the next week when she is living with her mother. The OOP cost for this consultation counts towards the family EMSN threshold for Laura and Susan, because it is paid for and claimed by Laura and Susan; they have now reached the general threshold. For the rest of the calendar year, all Laura’s family members can receive an additional 80% of their OOP costs for out-of-hospital services provided in that year.
However, if Elise sees the doctor while she is staying with Karl and he makes a Medicare claim, he will still not qualify for EMSN benefits because he has not reached an EMSN threshold.

Extended Medicare Safety Net (EMSN) Review RepoRt 2009
14
Box 2.1 continued
Scenario 4—Concessional familiesDue to a change in circumstances, Louis and Marie have become eligible for a Newstart allowance and also a Commonwealth Health Care Card. They become eligible for the EMSN lower threshold of $555.70 for the rest of the calendar year from the date they become eligible for the Commonwealth Health Care Card.
Emma and Jordan have two children under the age of 6. Because her partner Jordan is on a low income ($700 per fortnight) and both children are in her care, Emma is eligible for a parenting payment. The family is therefore eligible for a Commonwealth concession card, which in turn entitles them to be eligible for the EMSN lower threshold, from the date of entitlement to the end of the calendar year, regardless of whether the entitlement ceases during that year. Where the concessional entitlement is ongoing, Emma’s family will be eligible for the lower threshold for the following year/s.
Patricia and Ian are in their early 70s. They each have a Commonwealth Seniors Health Card and are registered for the EMSN as a family. They are eligible for the lower threshold, from the date of entitlement and for the remainder of the calendar year.
Scenario 5—Family with one Commonwealth concession cardholderGeorge and Henrietta have two children, Sarah and Mark, aged 9 and 12. Mark has a disability and qualifies for a Commonwealth concession card. They are registered for the EMSN as a family. As Mark has a Commonwealth concession card, he is eligible for the lower threshold, but the rest of the family is eligible only for the general threshold. During the year, all of the family members use out-of-hospital services that incur OOP costs. By 30 May, the family’s combined OOP costs are $850, of which $450 has resulted from Mark’s consultations with specialists and diagnostic tests. The remaining $400 has resulted from services provided to the other three family members. At this stage they have not yet qualified for the EMSN. Mark then has a further four consultations during June and July, which take his total OOP costs to $555.70 by 25 July.
For Mark’s next visit to a specialist, the provider charges $150 for the consultation; the MBS fee is $79.05, leaving a gap between the provider’s charge and the Medicare benefit of $82.80. Because Mark has now qualified for the EMSN, he will receive an additional $66.25, so the family will only pay $16.55 for this consultation. The $16.55 is added to the remaining family’s accumulated OOP costs for the general threshold.
In August, Henrietta is referred for a bone densitometry test, for which the provider’s charge is $160. Because only Mark has qualified for the EMSN, Henrietta does not receive EMSN benefits. By 1 November, the remaining family members have accumulated a total of $1,111.60 in OOP costs. This is made up of the $555.70 accumulated by Mark up until 25 July, an additional $80 accumulated by Mark since 25 July, and $475.90 accumulated by Henrietta, George and Sarah. The whole family has now qualified for EMSN benefits to cover 80% of their out-of-hospital, OOP costs for services provided in the remainder of that calendar year.

Extended Medicare Safety Net (EMSN) Review RepoRt 2009
15
Scenario 6—Family with a child over 16Yuko and Keith have a 17-year-old son, Phil, who left school at the end of year 11 and went to live inter-state during 2008. After six months (June 2008) Phil returns to live with his parents again. He is planning to complete year 12 at the beginning of 2009, but in the meantime has found a casual job for 10 hours per week. Because Phil is not currently a full-time student, he is not classified as a dependant for the purpose of the EMSN family registration. Even though he is living at home and being financially supported by his parents, he is classified as a single for EMSN purposes. Yuko and Keith are registered for the EMSN as a family, but Phil’s OOP expenses for Medicare services (which are paid by Yuko and Keith) do not count towards Yuko and Keith’s family threshold. To qualify for EMSN benefits, Yuko and Keith must incur OOP costs of more than $1,111.60 for their own services.
Because Phil is on a low income, he is eligible for the Low Income Health Care Card, and he will qualify for EMSN benefits if he incurs more than $555.70 in OOP costs for his own out-of-hospital services. Only when Phil enrols as a full-time student again in 2009, is he able to be included in his family’s registration. For the 2009 calendar year, all of the OOP costs for Phil, Yuko and Keith will accumulate towards the family’s EMSN threshold.

Extended Medicare Safety Net (EMSN) Review RepoRt 2009
16
develoPment of tHe emsn The program conception of the safety net that was first put forward by the former government was different to the EMSN that was implemented in 2004.
The initial proposal was for a new safety net only for Commonwealth concession cardholders. This proposal was rejected by the Senate, partly because of concerns that such cards are not an accurate measure of need. A later proposal included two thresholds of $500 and $1,000. The lower threshold was proposed for Commonwealth concession cardholders, and also families receiving FTB(A). A report by the Senate Select Committee, released in February 2004, argued that the two thresholds ‘are too high to deliver meaningful benefits to any more than a tiny handful of Australian families and individuals each year’ (Senate Select Committee on Medicare Australia 2004). The report also sought the introduction of a single threshold reduced below $500 to ensure consistency with the universality of Medicare, and to protect more people from high OOP costs. Furthermore, the Senate recommended the merging of the safety nets for the MBS and the PBS; however, these recommendations were not included in the final program.
Other concerns included that many health care costs would not be eligible for the safety net, and therefore people would still have high OOP medical expenses. The Senate report suggested that, to reduce high medical expenses, a greater emphasis on bulk billing programs for GPs and specialists was required, rather than a reliance on a safety net to protect people after medical expenses had been incurred (Senate Select Committee on Medicare Australia 2004)
The later proposal that was enacted in legislation reduced the thresholds to $300 and $700, but still retained the proposals for the status required for the lower threshold (that is Commonwealth concession cardholders and FTB(A) recipients).
2.4 The original Medicare Safety NetThe original Medicare Safety Net and the EMSN are both current programs and work simultaneously. However, the original Medicare Safety Net is quite different to the EMSN in two important ways: (1) what is counted towards the threshold; and (2) the benefits received by those who qualify.
Singles and families qualify for the original Medicare Safety Net once they reach a threshold of $383.90 (as at January 2009) in gap expenses for out-of-hospital Medicare services. The term ‘gap expenses’ refers to the difference between the Medicare benefit and the MBS fee. After people have qualified for the original Medicare Safety Net, their Medicare benefit increases to 100% of the MBS fee, instead of the usual 85%. Box 2.2 shows how a family can receive benefits under both Medicare safety nets.
Expenditure on the original Medicare Safety Net is consistently around $10 million per year.

Extended Medicare Safety Net (EMSN) Review RepoRt 2009
17
Box 2.2: Example of a family qualifying for the Medicare safety netsThe Ho family consists of two adults and a child. Since they receive Family Tax Benefit Part A (FTB(A)), they are eligible for the Extended Medicare Safety Net (EMSN) lower threshold. First, we will show how gap expenses and out-of-pocket (OOP) costs are calculated for the purposes of the original Medicare Safety Net and EMSN thresholds respectively.
It is the start of the year and Mr Ho has suffered a sporting injury. He is referred to a specialist who charges him $155 for the consultation. Mr Ho then makes a claim at a Medicare office and is told that, as the family has not yet qualified for either safety net, he is only eligible for the standard Medicare benefit of $67.20.
Provider fee MBS fee Medicare benefit Gap OOP cost
Column 1 Column 2 Column 3 = ( 0.85 X Col 2)
Column 4 = (Col 2 - Col 3)
Column 5 = (Col 1 - Col 3)
$155.00 $79.05 $67.20 $11.85 $87.80
As the above table shows, the family has incurred $11.85 in gap expenses, which is counted towards the original Medicare Safety Net threshold, and $87.80 in OOP costs, which is counted towards the EMSN threshold. When the family accumulates $383.90 in gap expenses, they will become eligible for original Medicare Safety Net benefits for the remainder of the calendar year. This means that the Medicare benefit will increase to 100% of the MBS fee for all out-of-hospital services. As the Ho family is eligible for the lower EMSN threshold, they need to accumulate $555.70 in OOP costs to be able to claim EMSN benefits.
As the calendar year progresses, the family accumulates sufficient gap and OOP costs to qualify for both safety nets. Mrs Ho is also referred to a specialist. The next table demonstrates the additional benefits the Ho family now receives.
Provider fee MBS feeMedicare
benefitOriginal Medicare Safety Net benefit EMSN benefit
Column 1 Column 2 Column 3 = ( 0.85 X Col 2)
Column 4 = (Col 2 - Col 3)
Column 5 = 0.8 X (Col 1 - Col 3 - Col 4)
$155.00 $79.05 $67.20 $11.85 $60.80
The Ho family has now qualified for both safety nets. They will receive $67.20 through the standard Medicare benefit, $11.85 through the original Medicare Safety Net, and $60.80 through the EMSN. This leaves the family with an OOP cost of $15.15 for this particular specialist’s visit instead of the $87.80 in OOP costs incurred earlier in the year when Mr Ho visited a specialist.
2.5 Other health care safety nets
PHARmACeutiCAl benefits sCHeme (Pbs) sAfety net Unlike Medicare, the PBS operates as a ‘front-end’ deductible. That is, the patient pays the first component of the product price (patient co-payment), and the PBS subsidises 100% of the remaining costs equal to the difference between the patient co-payment and the price agreed to by the government and the pharmaceutical company supplying the drug.7 As at January 2009, the co-payment amount for the general population was $32.90 per script and $5.30 for Commonwealth concession cardholders.
7 The PBS also subsidises the cost of the wholesaler margin dispensing fee of the community pharmacist.

Extended Medicare Safety Net (EMSN) Review RepoRt 2009
18
The PBS Safety Net provides additional financial support once a family reaches a certain threshold incurred through PBS-related co-payments. The PBS Safety Net thresholds, as at 1 January 2009, were $1,264.90 for the general population and $318 for Commonwealth concession cardholders. This is equivalent to sixty scripts per annum for Commonwealth concession cardholders. Once patients reach the threshold, the co-payment level for the general population falls to $5.30. For Commonwealth concession cardholders there is no co-payment once they reach the concession threshold8.
The eligibility criteria for the EMSN and PBS safety nets differ. For the PBS, only Commonwealth concession cardholders are eligible for the lower PBS threshold. For the EMSN, both Commonwealth concession cardholders and recipients of FTB(A) are eligible for the lower EMSN threshold.
The context in which the PBS Safety Net operates is also different to the EMSN. Firstly, the government exerts considerable influence over the price it pays for PBS-listed medicines, by negotiating with pharmaceutical companies over the agreed price. This is in contrast to Medicare, where medical providers set their own fees and determine the maximum price that consumers pay for their services. Secondly, there is no direct financial interest in the consumption of drugs on the part of providers. However, providers do have a direct financial interest in the fees they charge to patients. This means that provider incentives for the PBS Safety Net and the EMSN are quite different.
net mediCAl exPenses tAx offset Families and individuals can claim a tax offset of 20% of net medical expenses over $1,500. Net medical expenses are defined as the difference between medical expenses paid and reimbursements from Medicare and/or a private health insurer (if any). There is no upper limit on the amount that can be claimed. For example, a family whose net medical expenses are $2,000 for the year can claim 20% of $500 in tax offset, reducing their tax by $100. The Commonwealth Government estimates that in 2004-05 the net medical expenses tax offset cost $255 million in foregone tax revenue. In 2008-09, the estimate increased to $440 million (Treasury 2009).
The tax offset applies to a broad range of health care services. Expenses relating to an illness or operation paid to legally qualified doctors, dentists, opticians, chemists (for medical aids and appliances), whether delivered in public or private hospitals or in the out-of-hospital setting, are all eligible. However, expenses for some cosmetic operations are excluded.
It would be expected that the EMSN would reduce the amount of tax offsets claimed by families. This is because families with very high OOP costs now receive greater financial support under the EMSN, leaving them with a lower amount of net medical expenses. However, as noted, the offset applies to a much broader set of medical services than those covered by the EMSN.
8 Because of other policies in relation to the PBS, there may be situations where a patient who has reached the respective reduced PBS Safety Net co-payment amount is not eligible for PBS Safety Net benefits. In these cases they are required to pay the respective co-payments. For example, this will happen for some selected medicines for chronic conditions where a repeat prescription is dispensed within 21 days of the previous supply.

Extended Medicare Safety Net (EMSN) Review RepoRt 2009
19
3 tHe distRibution of out-of-PoCket Costs And emsn benefits
3.1 Overview of methodsWhen the Extended Medicare Safety Net (EMSN) was introduced, the government stated that its purpose was to protect all Australians from high out-of-pocket (OOP) costs, particularly those with complex health needs, families and other groups with high health care needs (Senate Select Committee on Medicare 2004; Department of Health and Ageing 2004). One aspect of this was the introduction of a lower threshold for EMSN benefits for Commonwealth concession cardholders and recipients of Family Tax Benefit Part A (FTB(A)).
In this part of the review, we provide a detailed analysis of the distribution of OOP costs and EMSN benefits across the Australian population. Our goal is to describe changes in OOP costs that occurred following the introduction of the EMSN, and to identify those receiving EMSN benefits. We also examine the effect the EMSN has had on those with very high OOP costs.
The analysis is based on Medicare Australia data for all out-of-hospital services. Data were provided on numbers of the population and subpopulations falling into bands of OOP costs or EMSN benefits. For both OOP costs and EMSN benefits, the bands increase in $50 units ($0.01 to $49.99; $50.00 to $99.99, etc), and in each year the bands are indexed to 2007 dollars using the Consumer Price Index. Those people with zero OOP costs or zero EMSN benefits form a separate category.
For annual OOP costs, we have de-identified data on all individuals (whether single or in families) from 2000 to 2007. From 2004 onwards, we also have OOP costs data for general and lower threshold singles and families. We have EMSN benefit data for the same period. For the purposes of this analysis, we define individuals as any one person who has used at least one Medicare service during any of the years examined. All individuals are then classified as belonging either to a ‘single’ household or a ‘family’ household. In this part of the review we also use the term ‘family member’ to describe a person who belongs to a ‘family’ household.
In the analysis we provide results by threshold status. We identify singles facing the general threshold and the lower threshold (Commonwealth concession cardholders). We similarly identify families facing the general threshold and the lower threshold (Commonwealth concession cardholders and recipients of FTB(A)). There are a small number of families (less than 4%) who are classified as ‘hybrid’ in relation to their threshold status. This refers to a family which consists of some family members who are eligible for the general EMSN threshold and other family members who are eligible for the lower threshold (see Scenario 5 in Box 2.1 for an example). We exclude these families from the analysis.
Additional information is provided on socioeconomic status and region, and for a subset of the population with complex and chronic conditions.
The remainder of this section is set out as follows. In Section 3.2 we compare the distribution of OOP costs for individuals before and after the introduction of the EMSN. In addition, we look at the distribution of EMSN benefits for individuals, and for singles and families, distinguished by their eligibility for the lower and general thresholds. In Section 3.3 we examine the distribution of OOP costs and EMSN benefits in five different socioeconomic areas of Australia.

Extended Medicare Safety Net (EMSN) Review RepoRt 2009
20
In Section 3.4 we replicate this analysis for metropolitan, rural and remote regions. In Section 3.5, we analyse how benefits are distributed amongst individuals with selected complex and chronic conditions. We also consider how effective the EMSN has been in reducing OOP costs for this group. Section 3.6 presents the analysis of the distribution of EMSN benefits by professional groups and identifies the Medicare items with the highest benefits per service. Finally, Section 3.7 presents some conclusions.
3.2 Distribution for individuals, families and singles
out-of-PoCket CostsTable 3.1 gives detail on the OOP costs for all individuals from 2000 to 2007. All OOP costs analysis is carried out for each person as an individual, regardless of whether that person is single or a member of a family registered with Medicare Australia for EMSN purposes. In each year, between 38% and 48% of the study population incurred no OOP costs, which means they only used Medicare-eligible services that were bulk billed. Only 3.3% of individuals faced OOP costs in excess of $300 per year in 2000, although this percentage increased to 7.1% by 2007.
Median OOP costs were fairly stable over the period, both for all individuals (about $24) and for those with positive OOP costs (about $71)9. Average OOP costs were higher than the median, indicating that the distribution has a long tail (that is a small number of individuals with very high OOP costs). The fact that the gap between median and average OOP costs widened over time suggests more individuals were experiencing high OOP costs, and/or those with already high OOP costs were incurring even higher costs.
Table 3.1: OOP costs for all individuals, by year
numbeR of individuAls ooP>0 ooP>300
AveRAge ooP
AveRAge ooP foR
tHose witH
ooP>0mediAn
ooP
mediAn ooP foR
tHose witH
ooP>0
yeAR ‘000 % % $ $ $ $
2000 16,851 52.2 3.3 52.6 100.5 22.3 70.3
2001 17,042 55.3 3.7 56.2 102.0 22.3 70.3
2002 17,181 59.3 4.4 64.2 108.0 23.4 70.7
2003 17,243 62.8 5.4 73.3 116.6 24.5 71.2
2004 17,389 61.5 5.5 72.0 117.1 24.9 71.7
2005 17,717 58.2 5.6 70.4 120.9 24.0 71.6
2006 17,940 57.0 6.3 76.6 134.6 24.7 72.0
2007 18,378 56.0 7.1 82.8 147.5 25.4 72.1
Note: Only includes people who submitted a claim to Medicare during these years.
9 The median is the value of OOP cost that divides the population into two equal groups; 50% of the population face lower OOP costs than the median and 50% face higher OOP costs.

Extended Medicare Safety Net (EMSN) Review RepoRt 2009
21
To illustrate the distribution of OOP costs before and after the introduction of the EMSN, we focus on three years: 2003, 2005 and 2007. We use a smoothing function to show how individuals are distributed across bands of OOP costs.10
Figure 3.1 shows the estimated distribution of all individuals by band of OOP payment (in constant 2007 dollars) for the three selected years. The vertical axis indicates the proportion of the population falling into a particular band of OOP cost. The area under the curve represents the total population. Band 0 represents patients with zero OOP costs. For each band, OOP costs increase in $50 increments (‘1’ = $0.01 to $49.99; ‘2’ = $50.00 to $99.99, etc). To focus on the part of the population where most individuals are concentrated, the distribution is truncated at band 14 (annual OOP costs of less than $750). The 2004 thresholds for the EMSN ($300 and $700) are shown on the figure.
The figure shows the high concentration of individuals at the lower end of the distribution of OOP costs. It also shows that the distributions over the three years are reasonably similar at higher bands of OOP costs, and also for zero OOP costs, but there have been some changes in the middle part of the distribution. Considering that the EMSN targets those with high OOP costs and provides substantial additional assistance, it is surprising to see so little change in the distribution amongst those individuals who incur OOP costs of less than $750. However, presenting the distribution for individuals may conceal relevant family information. For example, some individuals with low OOP costs may be benefiting from the EMSN because they belong to a family whose collective OOP costs have made them qualify for EMSN benefits.
Figure 3.1: Distribution of OOP costs for all individuals, by year
10 We use the STATA kdensity command to provide the smoothing. This is a way of estimating the probability density function of a random variable without specifying a parametric form for the distribution (such as a normal distribution). Informally, a probability density function can be thought of as a ‘smoothed out’ version of a frequency histogram, where the density on the vertical axis indicates the estimated proportion of the population with the value given on the horizontal axis.
0.0
5.1
.15
.2.2
5
Den
sity
0 1 2 3 4 5 6 7 8 9 10 11 12 13 14
OOP band
2003 2005 2007
$300threshold
$700threshold

Extended Medicare Safety Net (EMSN) Review RepoRt 2009
22
Figure 3.2 presents data on the number of individuals who faced very high annual OOP costs over the 2000 to 2007 period. The figure illustrates that, in the period leading up to the EMSN, there was a substantial increase in the number of people who incurred very high OOP costs. By 2003, around 14,000 people incurred annual OOP costs greater than $2,000. After the introduction of the EMSN, this number fell by around 9,500 people. However, by 2007 the number had climbed again and was similar to 2002 levels. The number of people who incurred OOP costs greater than $5,000 fell from 1,571 in 2003 to 235 in 2005, but increased to 268 in 2007. It should be noted that these numbers represent a tiny fraction of the population (that is less than 0.1% of Australians incur annual OOP costs greater than $2,000).
Figure 3.2: Number of individuals with very high OOP costs, by year
As already noted, Medicare statistics from 2004 onwards allow us to separately identify OOP costs for general and lower threshold families and singles. In addition, for those eligible for the lower threshold, we also have data on the reason they are eligible (that is whether or not they receive FTB(A) payments and/or hold a Commonwealth concession card).
The patterns of OOP costs are quite distinct for general threshold individuals, those eligible for the lower threshold because of their FTB(A) status, and those eligible for the lower threshold because of their concessional status. Figure 3.3 illustrates this for 2007. It shows that individuals who were eligible for FTB(A) were more likely to have lower OOP costs. Individuals who faced the general threshold were more likely to have higher OOP costs than individuals on the lower threshold. The graph also shows that, of the two lower threshold groups, a higher proportion of Commonwealth concession cardholders faced somewhat higher OOP costs.
As outlined in Table 2.5 (see Section 2), to be eligible for Commonwealth concession cards, families and singles must generally be on low incomes, whereas those eligible for FTB(A) (but not concession cards) are families with at least one dependent child and with middle household incomes.
0
2,000
4,000
6,000
8,000
10,000
12,000
14,000
16,000
2000 2001 2002 2003 2004 2005 2006 2007
Num
ber o
f ind
ivid
uals
≥2000≥3000≥4000≥5000≥6000≥7000

Extended Medicare Safety Net (EMSN) Review RepoRt 2009
23
Figure 3.3: Distribution of OOP costs, by threshold group, 2007
Note: Figure excludes those with zero OOP costs.
extended mediCARe sAfety net benefitsWe examine the pattern of EMSN benefits across the population by first looking at the number and percentage of families and singles who have received EMSN benefits. We then examine the average, median and overall distribution of EMSN benefits under the general and lower thresholds. We also look at any changes that have occurred over time to investigate the impact of the 2006 threshold changes.
The proportions of families and singles who received benefits are presented in Table 3.2 and Table 3.3, respectively. Most singles and families did not receive any EMSN benefits, and this was particularly so for singles. It is possible that some families who did not have high OOP costs chose not to register for the EMSN, and were, therefore, treated as singles in the data. If this were true, then some people with low OOP costs who should be counted as families were actually counted as singles.
For families overall, between 8.5% (in 2007) and 13.5% (in 2004) received EMSN benefits. Table 3.2 reveals a drop in the percentage of families receiving benefits in 2006, which can be explained by the threshold changes that made it harder to qualify for the EMSN. In the two years prior to the 2006 threshold changes, nearly 20% of families eligible for FTB(A) benefits received EMSN benefits. Around 15% of those eligible for a Commonwealth concession card received EMSN benefits, and the corresponding figure for general families was 10%. These percentages are based on the number of people who submitted at least one Medicare claim during the year.
In 2004 and 2005, a family’s eligibility for the lower threshold appears to have increased their likelihood of receiving EMSN benefits. However, by 2007, the percentages of general, concessional and FTB(A) families receiving some EMSN benefits were not very different. This suggests that the threshold changes increased the difficulty of reaching the threshold for FTB(A) and concessional families compared to families facing the general threshold.
0.0
5.1
.15.2
.25
Den
sity
1 2 3 4 5 6 7 8 9 10 11 12 13 14
OOP band
GeneralFTB(A)Concessional

Extended Medicare Safety Net (EMSN) Review RepoRt 2009
24
Table 3.2: Number of families by threshold group and the percentage of each who qualify for EMSN benefits, by year
yeAR
geneRAl fAmiliesConCessionAl
fAmilies ftb(A) fAmilies All fAmilies
‘000 % ‘000 % ‘000 % ‘000 %
2004 1,269 10.4 727 15.0 1,469 19.9 3,648 13.5
2005 1,380 10.9 799 14.6 1,644 19.5 4,011 13.5
2006 1,446 7.3 852 6.8 1,714 9.5 4,210 7.6
2007 1,532 8.3 885 7.9 1,730 10.5 4,368 8.5
Note: Only includes people who submitted a claim to Medicare during the selected years.
Table 3.3 shows the percentage of singles who qualified for EMSN benefits. Overall, only about 1% of singles received EMSN benefits in each year, but concessional singles (that is those who held Commonwealth concession cards and were eligible for the lower threshold) were nearly twice as likely to receive benefits as those eligible under the general threshold. This table shows a drop in the percentage of singles receiving benefits in 2006, which can again be explained by the threshold changes.
Table 3.3: Number of singles by threshold group and percentage of each who qualify for EMSN benefits, by year
yeAR
geneRAl singlesConCessionAl
singles All singles
‘000 % ‘000 % ‘000 %
2004 4,116 0.7 2,930 1.7 7,591 1.0
2005 3,792 0.8 2,713 1.9 6,937 1.2
2006 3,558 0.5 2,687 0.9 6,613 0.7
2007 3,526 0.6 2,655 1.1 6,513 0.8
Note: Only includes people who submitted a claim to Medicare during the selected years.
Figure 3.4 and Figure 3.5 show the distributional pattern of EMSN benefits between 2004 and 2007 for families and singles who qualified for EMSN benefits, respectively. The distributional patterns for the two groups are quite similar, with higher concentrations of the populations in low EMSN bands in 2004 and 2005, before changes in the threshold levels. The figures show that the one-off increase in the thresholds in 2006 had the effect of reducing the proportion of people receiving benefits in the low EMSN bands, and that this effect was stronger for singles than for families.

Extended Medicare Safety Net (EMSN) Review RepoRt 2009
25
Figure 3.4: Distribution of EMSN benefits for qualifying families, by year
Note: Figure excludes those with zero EMSN benefits.
Figure 3.5: Distribution of EMSN benefits for qualifying singles, by year
Note: Figure excludes those with zero EMSN benefits.
Table 3.4 presents average and median EMSN benefits for those qualifying for benefits for all families and by threshold groups. Average EMSN benefits for all family threshold groups increased in real terms in every year after the introduction of the EMSN. However, median benefits increased in 2006 only—the year the threshold levels changed. The median is sensitive to the threshold change unlike the average, which is strongly influenced by those receiving high levels of EMSN benefits.
0.0
5.1
.15
.2.2
5
Den
sity
1 2 3 4 5 6 7 8 9 10 11 12 13 14
EMSN band
2004 2005 2006 2007
0.0
5.1
.15
.2.2
5D
ensi
ty
1 2 3 4 5 6 7 8 9 10 11 12 13 14EMSN band
2004 2005 2006 2007

Extended Medicare Safety Net (EMSN) Review RepoRt 2009
26
This table also demonstrates that the average EMSN benefit received was considerably smaller for families who qualified under the lower threshold compared to those who qualified under the general threshold. In 2007, families who qualified under the general threshold received an average benefit of $1,194 (compared with $391 for concessional families and $615 for FTB(A) families).
Table 3.4: EMSN benefits for families who received an EMSN benefit, by year ($)
All fAmilies geneRAl fAmiliesConCessionAl
fAmilies ftb(A) fAmilies
yeAR AveRAge mediAn AveRAge mediAn AveRAge mediAn AveRAge mediAn
2004 372 174 628 274 239 124 288 124
2005 476 174 800 374 274 124 377 174
2006 693 274 1,057 575 370 174 560 224
2007 778 274 1,194 574 391 174 615 224
Note: Only includes people who submitted a claim to Medicare during the selected years.
In Figure 3.6, we can see how EMSN benefits were distributed across general, concessional and FTB(A) families in 2007. In this figure, the two categories of families eligible for the lower threshold have very similar distributions, with a high concentration of families in lower bands of EMSN benefits. In contrast, families facing the general threshold are concentrated in higher bands of benefit.
Figure 3.6: Distribution of EMSN benefits for qualifying families, by threshold group, 2007
Note: Figure excludes those with zero EMSN benefits.
The average and median EMSN benefits for singles are shown in Table 3.5. As for families, singles facing the general threshold received higher average benefits once they passed the threshold compared to singles who qualified for the lower threshold. The average and median benefits for singles also increased substantially, as they did for families, after the threshold levels were changed in 2006.
0.0
5.1
.15
.2.2
5
Den
sity
1 2 3 4 5 6 7 8 9 10 11 12 13 14EMSN band
Concessional FTB(A) General

Extended Medicare Safety Net (EMSN) Review RepoRt 2009
27
Table 3.5: EMSN benefits for singles who received an EMSN benefit, by year ($)
All singles geneRAl singles ConCessionAl singles
yeAR AveRAge mediAn AveRAge mediAn AveRAge mediAn
2004 324 124 507 175 222 123
2005 388 125 617 225 258 123
2006 629 226 941 423 398 173
2007 683 227 1,024 423 419 174
Note: Only includes people who submitted a claim to Medicare during the selected years.
EMSN thresholds vary only by eligibility for either a Commonwealth concession card or FTB(A) entitlement, and not by family size. This potentially lowers the EMSN benefits flowing to singles compared to families where more family members contribute to OOP costs. When we compare families and singles, the average and median EMSN benefits are somewhat higher for families. The threshold changes of 2006 resulted in fewer singles and families qualifying for the EMSN. However, for those who did qualify after 2006, the average EMSN benefit was substantially higher (increasing from $476 in 2005 to $693 in 2006 for families, and from $388 to $629 for singles). However, there is a difference in the pattern of benefits for those receiving benefits, as shown in Figure 3.7. Again we can see that, as for families, singles facing the general threshold are placed higher in the distribution of EMSN benefits.
Figure 3.7: Distribution of EMSN benefits for qualifying singles, by threshold group, 2007
Note: Figure excludes those with zero EMSN benefits.
0.0
5.1
.15
.2.2
5
Den
sity
1 2 3 4 5 6 7 8 9 10 11 12 13 14EMSN band
Concessional General

Extended Medicare Safety Net (EMSN) Review RepoRt 2009
28
Figure 3.8 illustrates the percentage of total EMSN benefits paid to singles and families (by threshold groups) in 2007. It shows that, of the $324 million spent on EMSN benefits, the general families received 49% of benefits, whereas general singles and concessional singles received 7% and 4%, respectively. This may be due to the fact that single people are less likely to use private obstetrics and assisted reproductive services, which, as we will examine in Section 3.6, is where the majority of EMSN benefits are directed.
Figure 3.8: Percentage of total EMSN benefits paid to singles and families, 2007
Figure 3.9 and Figure 3.10 present information on the total amount of EMSN benefits distributed to various age groups of females and males, respectively. Figure 3.9 strikingly demonstrates that most EMSN benefits have flowed to women in the 25–34 and 35–44 age groups. This, of course, reflects the fact that these women are most likely to use obstetrics and assisted reproductive services. Furthermore, between 2006 and 2007 the amount of EMSN benefits received by women in these age groups increased by around $50 million, because of higher OOP costs. We can see that relatively fewer EMSN benefits flowed to women in older age groups. The pattern is quite different for men, whose average benefits, as Figure 3.10 shows, are flatter across the age distribution and tend to increase with age.
General families49%
Concessional families8%
FTB(A) families32%
General singles7%
Concessional singles4%

Extended Medicare Safety Net (EMSN) Review RepoRt 2009
29
Figure 3.9: Total EMSN benefits paid to females, by age ($ million)
Figure 3.10: Total EMSN benefits paid to males, by age ($ million)
0 20 40 60 80 100 120
0-4
5-14
15-24
25-34
35-44
45-54
55-64
65-74
75-84
85+
2004 2005 2006 2007
$ million
0 20 40 60 80 100 120
0-4
5-14
15-24
25-34
35-44
45-54
55-64
65-74
75-84
85+
2004 2005 2006 2007
$ million

Extended Medicare Safety Net (EMSN) Review RepoRt 2009
30
3.3 Distribution for income groups
out-of-PoCket CostsTo investigate the socioeconomic pattern of OOP costs over the period, we examine the distribution of OOP costs for individuals separately by quintile of the Australian Bureau of Statistics’ SEIFA11 score of advantage and disadvantage. The SEIFA score estimates the relative socioeconomic status of geographic areas (not individuals) using information such as income and education from the Census. This analysis was based on the postcode of the person as recorded by Medicare Australia, not on the individual characteristics of the person. Therefore, the results of this analysis should be interpreted at the group level, not the individual level. The SEIFA score is grouped into five quintiles, with SEIFA quintile 1 containing the least advantaged 20% of areas, and SEIFA quintile 5 containing the most advantaged 20%. Note that the SEIFA quintiles do not match the distribution of the population. In our data approximately 10% of people live in SEIFA 1 areas (least advantaged); 15% in SEIFA 2; 20% in SEIFA 3; 25% in SEIFA 4; and 30% in SEIFA 5 (most advantaged).
Table 3.6 presents the average and median OOP costs by SEIFA quintile for selected years between 2000 and 2007. The average OOP cost for the top quintile is over double that of the lowest quintile in each year. The middle three quintiles are quite similar and 50% of the population in all quintiles, except the lowest, have annual OOP costs of less than about $25. For the most disadvantaged quintile, at least 50% of individuals have no OOP costs for out-of-hospital Medicare services.
Table 3.6: OOP costs for all individuals, by SEIFA quintile and year ($)
seifA 1 (leAst AdvAntAged) seifA 2 seifA 3 seifA 4
seifA 5 (most AdvAntAged)
yeAR AveR mediAn AveR mediAn AveR mediAn AveR mediAn AveR mediAn
2000 32 0 46 22 45 22 48 0 73 24
2003 44 0 61 24 62 24 69 24 100 26
2005 42 0 57 24 60 24 67 24 96 26
2007 47 0 64 25 69 25 79 25 115 27
Figure 3.11 illustrates the distribution of OOP costs for all individuals by SEIFA quintiles for the 2007 calendar year. For lower OOP bands, the population distribution is very similar for the middle three SEIFA quintiles. However, SEIFA quintile 5 has relatively fewer people in the low OOP costs bands and more in the higher OOP costs bands. Meanwhile, SEIFA quintile 1 tends to have a relatively greater proportion of people in the lower OOP costs bands. This may be driven by the type of services used by people in different areas. For example, people who live in more advantaged areas are likely to use services with high OOP costs such as private obstetrics and assisted reproductive services.
In Figure 3.12 we examine how the socioeconomic composition of those in the upper tail of the distribution of OOP costs (costs greater than $300) has changed over time. For each year from 2000 to 2007, the figure shows the number of individuals with OOP costs greater than $300. The figure demonstrates that, over time, the number of individuals who incur high OOP costs has grown for all SEIFA quintiles. However, the rate of growth is higher amongst
11 Socio Economic Index For Areas

Extended Medicare Safety Net (EMSN) Review RepoRt 2009
31
individuals living in relatively advantaged areas compared to those living in disadvantaged areas. It is worth noting that the rate of growth slowed in 2004, coinciding with the introduction of the EMSN, but then increased in subsequent years.
Figure 3.11: Distribution of OOP costs for all individuals, by SEIFA quintile, 2007
Figure 3.12: Composition of those with high OOP costs (above $300), by SEIFA quintile and year
0
100,000
200,000
300,000
400,000
500,000
600,000
700,000
2000 2001 2002 2003 2004 2005 2006 2007
Num
ber o
f ind
ivid
uals
SEIFA 1 (least advantaged) SEIFA 2 SEIFA 3 SEIFA 4 SEIFA 5 (most advantaged)
0.0
5.1
.15
.2.2
5
Den
sity
0 1 2 3 4 5 6 7 8 9 10 11 12 13 14
OOP band
SEIFA 1 (least advantaged) SEIFA 2 SEIFA 3
SEIFA 4 SEIFA 5 (most advantaged)

Extended Medicare Safety Net (EMSN) Review RepoRt 2009
32
extended mediCARe sAfety net benefitsThe government designed the EMSN so that people on low and middle incomes (with children) would face a lower threshold before receiving EMSN benefits. We believe that this decision implies that the government intended to provide greater support for these income groups. Here we examine the distribution of EMSN benefits by SEIFA quintile to determine whether some socioeconomic groups benefit more than others.
Figure 3.13 plots the cumulative distribution of EMSN benefits received by SEIFA quintile for 2007 (on the horizontal axis) against the cumulative distribution of individuals by SEIFA quintile on the vertical axis. The dashed line shows the percentage of individuals falling into each SEIFA quintile.12 This line forms the frame of reference for the distribution of benefits. If EMSN benefits were distributed along this line, it would indicate that the policy is providing financial support in line with the share of population in each SEIFA quintile. For example, it would indicate that the least advantaged 20% of individuals receive 20% of benefits, the least advantaged 40% of individuals receive 40% of benefits, and so on. The further the actual distribution of EMSN benefits is away from the ‘equality line’, the more unequally the benefits are distributed by socioeconomic status.
As Figure 3.13 shows, in 2007, about 55% of EMSN benefits went to the top SEIFA quintile, the most advantaged 30% of the population. In contrast, the least socioeconomically advantaged 10% of the population received 3.3% of EMSN benefits. This reveals that the EMSN is a highly regressive social insurance. A regressive policy is one that distributes higher amounts of public funding to wealthier sections of the community compared to poorer sections.
Figure 3.13: Distribution of EMSN benefits, by SEIFA quintile, 2007
12 With individual data this line would fall along the diagonal. Because the Medicare data uses the SEIFA of the postcode of residence of the individual, 20% of observations do not fall into each quintile.
0
10
20
30
40
50
60
70
80
90
100
SEIFA 1 SEIFA 2 SEIFA 3 SEIFA 4 SEIFA 5
Cumulative % of EMSN bene�ts
Cum
ulat
ive
% o
f ind
ivid
uals

Extended Medicare Safety Net (EMSN) Review RepoRt 2009
33
Figure 3.14 brings together total OOP costs incurred and EMSN benefits received by SEIFA quintile for the 2007 calendar year. It demonstrates that EMSN benefits are distributed to people in wealthy areas who also incur high Medicare-related OOP costs. The results shown can be explained in two ways:
• People in low income areas are protected from high OOP costs (for example more people have a Commonwealth concession card and more services are bulk billed), and/or
• People in low income areas use fewer Medicare services that are associated with high OOP costs (for example specialist-type care).
Previous research supports both explanations. Jones, Savage & van Gool (2008) found that concession cards provided considerable OOP cost protection for general practice (GP)13 services but no protective effect was found for specialist care. Van Doorslaer et al. (2007) found that poorer households made greater use of GP services but that richer households were higher users of specialist services (which are usually associated with high OOP costs). This evidence suggests that the kinds of services that drive a significant component of EMSN benefits are not distributed according to health care need in Australia.
Figure 3.14: Total OOP costs and EMSN benefits for all individuals, by SEIFA quintile ($ million)
13 In this report we use ‘GP’ to refer to both general practice and a general practitioner.
0
100
200
300
400
500
600
700
800
900
SEIFA 1 SEIFA 2 SEIFA 3 SEIFA 4 SEIFA 5
$ m
illio
n
EMSN benefits OOP costs

Extended Medicare Safety Net (EMSN) Review RepoRt 2009
34
3.4 Distribution for regional areas
out-of-PoCket CostsTo investigate the regional pattern of OOP costs, we can examine the distribution of OOP costs separately by the Australian Bureau of Statistics’ classification of Remoteness Area over the period. Individuals are categorised as living in one of five types of regions: major cities, inner regional, outer regional, remote, very remote. In addition, some individuals are classified as migratory. However, because ‘migratory’ regions did not have sufficient individuals for benefits to approximate their distributions we have excluded them from this analysis.
Table 3.7 presents the average and median OOP costs by region for selected years from 2000 to 2007. The average OOP costs were similar in 2000 for all areas except for ‘very remote’ (lower average OOP costs) and ‘migratory’ (higher average OOP costs). Over time, the average OOP costs increased most in ‘major cities’, although the median was quite stable, which suggests that higher OOP costs in major cities are faced by those at the upper end of the distribution.
Table 3.7: OOP costs for all individuals, by Remoteness Area and year ($)
2000 2003 2005 2007
AveRAge mediAn AveRAge mediAn AveRAge mediAn AveRAge mediAn
Major cities 53 0 76 24 74 24 88 25
Inner regional 54 23 73 25 67 25 77 26
Outer regional 52 23 65 25 60 24 70 26
Remote 43 23 50 23 49 22 55 0
Very remote 27 0 31 0 29 0 30 0
To explore the regional pattern of OOP costs in more detail we focus on the 2007 calendar year. Figure 3.15 shows clearly that those in more remote areas spent least on out-of-hospital health care. Given the concentration of Indigenous people in remote communities, this is more likely to reflect low access or use of Medicare services rather than average health status. Those in ‘major cities’ had higher levels of OOP costs while ‘inner regional’ and ‘outer regional’ areas had a similar pattern of OOP costs.

Extended Medicare Safety Net (EMSN) Review RepoRt 2009
35
Figure 3.15: Distribution of OOP costs for individuals, by Remoteness Area, 2007
Note: Figure excludes those with zero OOP costs.
extended mediCARe sAfety net benefitsWe now examine the regional distribution of EMSN benefits for individuals qualifying for EMSN benefits. The most striking feature of Table 3.8 is that average and median EMSN benefits were consistently higher in major cities than in other regions. Consistent with the distribution of OOP costs, average EMSN benefits decline with remoteness. (Large changes in average benefits in the most remote areas are driven by the very small number of individuals qualifying for benefits.)
Table 3.8: EMSN benefits for qualifying individuals, by Remoteness Area and year ($)
2004 2005 2006 2007
AveRAge mediAn AveRAge mediAn AveRAge mediAn AveRAge mediAn
Major cities 221 72 282 73 403 122 444 123
Inner regional 148 68 170 71 260 72 296 73
Outer regional 136 67 150 70 224 72 271 72
Remote 138 37 169 62 279 73 303 74
Very remote 132 31 192 61 292 74 425 86
Figure 3.16 shows the distributions of benefits for five regions.
0.0
5.1
.15
.2.2
5
Den
sity
1 2 3 4 5 6 7 8 9 10 11 12 13 14
OOP band
Major cities Inner regional
Outer regional Remote
Very remote

Extended Medicare Safety Net (EMSN) Review RepoRt 2009
36
Figure 3.16: Distribution of EMSN benefits, by Remoteness Area, 2007
Note: Figure excludes those with zero EMSN benefits.
3.5 Effect of the EMSN on patients with complex and chronic conditions
tHe distRibution of out-of-PoCket CostsA key consideration for determining whether the EMSN has achieved its stated purpose is the impact on OOP costs for individuals with complex and high health needs (Department of Health and Ageing 2004; Australia, House of Representatives 2003a). To explore this, we identify individuals with selected complex and chronic conditions and analyse their total OOP costs and EMSN benefits for selected years between 2000 and 2007. We identify individuals with cancer, diabetes, and a mental illness, and also individuals with other (non-specified) chronic conditions. Individuals were identified through their use of specific Medicare items. Individuals were identified as having cancer if they used any Medicare item associated with chemotherapy or radiation oncology. Patients with diabetes were selected on the basis of their use of a pathology item relating to the management of established diabetes. Patients with a mental illness were identified if they used a psychiatric service. Patients with other chronic conditions were identified if a GP care plan item was billed to them. The full list of Medicare items used to identify conditions can be found at <http://www.health.gov.au>.
The total annual OOP costs and EMSN benefits for those identified patients were retrieved and grouped into $50 bands—as per our earlier analysis.
0.0
5.1
.15
.2.2
5D
ensi
ty
1 2 3 4 5 6 7 8 9 10 11 12 13 14
EMSN band
Major cities Inner regional
Outer regional Remote
Very remote

Extended Medicare Safety Net (EMSN) Review RepoRt 2009
37
Table 3.9 shows the number of individuals who used Medicare services related to each category of complex and chronic condition for three years: 2003, 2005 and 2007. It also shows the average annual OOP cost these patients incurred through out-of-hospital Medicare services.
The numbers of patients identified with diabetes and those with other chronic conditions increased substantially in 2007. These increases are due to a number of policy changes, including changes to the description and benefits of GP care plan items. In addition, new allied health items relating to psychology services were introduced onto the Medicare Benefits Schedule (MBS). Patients can be referred for these allied health services by a GP (who is managing the patient under a GP Mental Health Plan), a psychiatrist or a paediatrician. These changes mean that not only has the number of patients changed, but potentially also the type of care received and the types of services used. This is likely to impact on our analysis of OOP costs and EMSN benefits in 2007 and, in the case of other chronic conditions, 2005. Results will require careful interpretation.
Table 3.9: Number of patients and average OOP costs, by condition and year
2003 2005 2007
numbeR PAtients
AveRAge ooP
numbeR PAtients
AveRAge ooP
numbeR PAtients
AveRAge ooP
‘000 $ ‘000 $ ‘000 $
Cancer 71 588 83 470 96 506
Diabetes 227 126 250 119 588 124
Mental illness 158 340 154 264 117 348
Other chronic condition 123 104 500 100 705 118
Note: Only includes people who submitted a claim to Medicare during the selected years.
Table 3.9 also shows that people with cancer had much higher average annual OOP costs than other groups. It is worth noting that these OOP costs only relate to expenses incurred for out-of-hospital Medicare services and that the cancer patients are likely to have faced substantial OOP costs for other aspects of their care. The table also shows that there was a fall in average annual OOP costs for patients with cancer and patients with diabetes after 2003, but not for patients with mental illnesses and other chronic conditions.
Figure 3.17 shows the pattern of benefits across the distribution for the selected conditions. In broad terms, over the period, patients with cancer and patients with a mental illness faced higher OOP costs (more patients are concentrated in higher bands of OOP costs) compared to patients with diabetes or those with other chronic conditions. The pattern of OOP costs for these latter two patient groups is relatively stable over the period. The graph also illustrates that the proportion of patients with cancer who faced OOP costs between bands 3 and 10 (OOP costs between $150 and $500) fell over the period.

Extended Medicare Safety Net (EMSN) Review RepoRt 2009
38
Figure 3.17: Distribution of OOP costs, by condition and year
Cancer
Diabetes
0.0
5.1
.15
.2.2
5
Den
sity
0 1 2 3 4 5 6 7 8 9 10 11 12 13 14
OOP band
2003 2005 2007
0.0
5.1
.15
.2.2
5D
ensi
ty
0 1 2 3 4 5 6 7 8 9 10 11 12 13 14OOP band
2003 2005 2007

Extended Medicare Safety Net (EMSN) Review RepoRt 2009
39
Figure 3.17: Distribution of OOP costs, by condition and year (continued)
Mental illness
Other chronic condition
0.0
5.1
.15
.2.2
5D
ensi
ty
0 1 2 3 4 5 6 7 8 9 10 11 12 13 14OOP band
2003 2005 2007
0.0
5.1
.15
.2.2
5D
ensi
ty
0 1 2 3 4 5 6 7 8 9 10 11 12 13 14OOP band
2003 2005 2007

Extended Medicare Safety Net (EMSN) Review RepoRt 2009
40
Table 3.10 shows the percentage of patients who experienced annual OOP costs greater than $300 over the 2003, 2005 and 2007 calendar years, as well as the average OOP costs for those patients. The table provides evidence that the proportion of patients with OOP costs greater than $300 fell for patients with cancer over the 2003 to 2007 period. On average, patients with cancer or mental illness with relatively high OOP costs were around $60 better off per year. A similar percentage of patients with diabetes and patients with other chronic conditions incurred OOP costs greater than $300.
Table 3.10: Patients with OOP costs greater than $300, by condition and year
2003 2005 2007
% of
PAtientsAveRAge
ooP $% of
PAtientsAveRAge
ooP $% of
PAtientsAveRAge
ooP $
Cancer 61 904 58 749 56 843
Diabetes 14 489 15 435 16 486
Mental illness 32 775 33 600 42 714
Other chronic condition 11 499 12 431 15 480
We also examined changes in the OOP costs for patients with OOP costs greater than $5,000 and $10,000 per year. The results shown in Table 3.11 and Table 3.12 reveal some interesting facts. Firstly, there are very few patients with such high OOP costs. In 2003, for the selected conditions examined here, only 472 patients incurred OOP costs higher than $5,000, and 73 had OOP costs greater than $10,000. Secondly, the EMSN appears to have had an effect on reducing this already small number, particularly for patients with a mental illness. Comparing 2003 and 2007 in Table 3.11 shows that the average OOP cost for these patients with a mental illness fell by $1,843.
Table 3.11: Patients with OOP costs greater than $5,000, by condition and year
2003 2005 2007
numbeR PAtients
AveRAge ooP $
numbeR PAtients
AveRAge ooP $
numbeR PAtients
AveRAge ooP $
Cancer 133 6,441 66 5,963 94 5,845
Diabetes 23 7,505 * around 6,000 11 6,544
Mental illness 302 7,839 16 7,502 31 5,996
Other chronic condition 11 9,482 5 5,843 10 6,275
Total 472 7,457 * around 6,200 152 5,948
Note: * less than five patients.

Extended Medicare Safety Net (EMSN) Review RepoRt 2009
41
Table 3.12: Patients with OOP costs greater than $10,000, by condition and year
2003 2005 2007
numbeR PAtients
AveRAge ooP $
numbeR PAtients
AveRAge ooP $
numbeR PAtients
AveRAge ooP $
Cancer 10 13,004 * around 13,700 * around 14,500
Diabetes * around 11,500 * around 6,100 * around 12,200
Mental illness 57 13,423 * around 14,500 * around 12,300
Other chronic condition * around 18,100 * around 7,200 * around 9,400
Total 73 13,479 6 11,750 * around 12,100
Note: * less than five patients.
tHe distRibution of emsn benefitsOne of the stated aims of the EMSN was to protect against high out-pocket-costs due to complex health conditions (Department of Health and Ageing 2004; Australia, House of Representatives 2003a). The distribution of EMSN benefits to individuals with selected conditions indicates whether the policy is well-targeted to patients with complex health care needs. The average EMSN benefit for each of these patient groups is shown in Table 3.13. The averages in this table include those receiving no EMSN benefits, the percentage of the patient population who do receive EMSN benefits, and the average amount of EMSN benefits amongst those recipients.
The table shows that the highest level of average benefit went to patients with cancer, followed by patients with a mental illness. Average EMSN benefits for those patients identified as having diabetes or another chronic condition were only $22 and $19 respectively. The low average benefits for patients with diabetes and patients with other chronic conditions are partly caused by the low percentages receiving any EMSN benefits. In turn, this reflects the low OOP costs experienced by these patient groups for out-of-hospital Medicare services.
There were substantial changes in the percentage of the patient population who qualified for EMSN benefits in 2007. This not only reflects changes in the EMSN thresholds, but also broader changes to the MBS already identified. Those changes were unlikely to affect the cancer group in a significant way, and therefore the drop of 9% points is a reflection of the EMSN threshold change. The average EMSN benefit for those who qualified ranged from $339 for patients with other chronic conditions to $1,007 for those with cancer.

Extended Medicare Safety Net (EMSN) Review RepoRt 2009
42
Table 3.13: EMSN benefits, by condition and year
AveRAge emsn
$% witH emsn
benefits
AveRAge emsn foR tHose quAlifying
$
2005 2007 2005 2007 2005 2007
Cancer 303 269 36 27 842 1,007
Diabetes 22 19 10 5 221 369
Mental illness 135 160 27 24 507 670
Other chronic condition 19 18 8 5 228 339
A relatively high percentage of cancer patients also received high levels of EMSN benefits (in excess of $500), as shown in Table 3.14. Less than 1% of those with diabetes received EMSN benefits above $500, compared with about 14% for the cancer patients. However, the levels of benefit are quite similar (between $1,423 and $1,742) across patient groups for those receiving high levels of benefit.
Table 3.14: Patients with EMSN benefits greater than $500, by condition and year
% witH emsn benefits Above $500
$
AveRAge emsn foR tHose witH emsn Above $500
$
2005 2007 2005 2007
Cancer 17 14 1,592 1,742
Diabetes 1 1 1,151 1,545
Mental illness 7 9 1,370 1,514
Other chronic condition 1 1 1,170 1,423
The distributions of EMSN benefits for qualifying patients are shown in Figure 3.18 for each of the conditions. The graphs clearly show that people with cancer and people with mental illnesses are more likely to receive high EMSN benefits, whereas people with diabetes and people with other chronic conditions are more likely to receive lower benefits.

Extended Medicare Safety Net (EMSN) Review RepoRt 2009
43
Figure 3.18: Distribution of EMSN benefits, by condition and year
Cancer
Diabetes
0.0
5.1
.15
.2.2
5
Den
sity
1 2 3 4 5 6 7 8 9 10 11 12 13 14EMSN band
2005 2007
0.0
5.1
.15
.2.2
5D
ensi
ty
1 2 3 4 5 6 7 8 9 10 11 12 13 14EMSN band
2005 2007

Extended Medicare Safety Net (EMSN) Review RepoRt 2009
44
Figure 3.18: Distribution of EMSN benefits, by condition and year (continued)
Mental illness
Other chronic condition
Note: Figure excludes those with zero EMSN benefits.
Figure 3.19 brings together the average OOP costs and EMSN benefits for all the conditions. It illustrates that the EMSN has directed more benefits to those patients who experience high OOP costs. It also shows clearly that in 2005 the amount of EMSN benefits was not matched by a reduction in OOP costs. In the case of cancer, patients received an average EMSN benefit of $303 but average OOP costs fell by only $118. This result can be explained by increases in provider fees and/or changes to the number and type of services used. Section 4 investigates these issues further and finds evidence for both explanations.
0.0
5.1
.15
.2.2
5D
ensi
ty
1 2 3 4 5 6 7 8 9 10 11 12 13 14EMSN band
2005 2007
0.0
5.1
.15
.2.2
5D
ensi
ty
1 2 3 4 5 6 7 8 9 10 11 12 13 14EMSN band
2005 2007

Extended Medicare Safety Net (EMSN) Review RepoRt 2009
45
Figure 3.19: Average OOP costs and EMSN benefits, by condition and year
3.6 Distribution of EMSN benefits for professional groupsTable 3.15 shows the distribution of EMSN benefits by professional groups of services between 2004 and 2007.14 In 2007, over 50% of all EMSN benefits helped fund obstetrics and assisted reproductive services. In monetary terms, EMSN funding of obstetric services increased from $45 million in 2004 to $100 million (in constant dollars) in 2007. EMSN funding of assisted reproductive services increased from $29 million to $72 million over the same period.
For some professional groups the proportion of EMSN benefits has remained stable. For example, each year around 4% of EMSN benefits are contributed to radiation oncology services and around 5% contributed to the cost of operations.
The threshold changes that occurred at the start of 2006 appear to have had a differential impact on the distribution of EMSN benefits for some professional groups. Benefits declined in 2006 for all the groups except allied health, obstetrics and assisted reproductive services.
The jump in benefits for allied health services is primarily explained by the introduction of psychology items on the MBS. The increase for obstetrics and assisted reproductive services in 2006 indicates that patients using these services incurred such high OOP costs that they still easily qualified for EMSN benefits and were largely unaffected by the threshold changes.
14 The professional groups of services are based on Medicare item data, rather than the speciality of the practitioner providing the service. The groups consist of GP consultations, psychiatric consultations, specialist attendances, obstetric services, pathology services, diagnostic imaging services, radiation oncology services, nuclear medicine services, allied health and assisted reproductive services.
020
040
060
080
00
200
400
600
800
2003 2005 2007 2003 2005 2007
2003 2005 2007 2003 2005 2007
Cancer Diabetes
Mental illness Other chronic condition
OOP costs EMSN benefits
$$

Extended Medicare Safety Net (EMSN) Review RepoRt 2009
46
Table 3.15: EMSN benefits by professional groups ($)
2004 2005 2006 2007
$‘000 $‘000 $‘000 $‘000
General practice consultations15 34,442 34,435 21,134 26,242
Allied health services 153 557 912 6,025
Specialist attendances 47,200 61,300 44,100 51,300
Obstetrics 44,700 78,400 80,700 99,700
Operations & anaesthetics 10,837 16,034 15,639 20,537
Pathology 6,040 7,005 4,878 5,765
Diagnostic imaging 24,300 31,700 21,000 25,700
Radiation oncology & nuclear medicine 7,957 11,500 10,800 12,000
Assisted reproductive services 29,300 44,600 47,500 71,700
Other 5,189 6,503 3,954 4,689
Total 210,118 292,034 250,617 323,658
Note: These figures are based on date of service and will not match up with previously published figures that use date of processing data.
All figures are in constant 2007 dollars.
Figure 3.20 shows the amount of EMSN benefits paid in 2007 for the top twenty Medicare items. Collectively, these Medicare items accounted for over 77% of total EMSN expenditure (or $250 million). The top item in terms of EMSN benefits received was item 16590—planning and management of pregnancy at the 20-week stage of pregnancy. This item was introduced in September 2004 (initially as item 15999) following negotiations between the government and professional groups. Since its introduction, it has consistently attracted the most EMSN benefits. In 2007, this item alone accounted for 27% of total EMSN expenditure (or $88 million). Item 16500 (antenatal attendances) was another pregnancy-related service in the top twenty.
This top twenty items list also included: three items relating to assisted reproductive services; four items relating to mental health; four items for specialist and consultant physician attendances; three items for radiation oncology services; and two items for GP consultations. There were also two procedural items relating to the treatment of varicose veins (item 32500) and the injection of therapeutic substances into the eye to treat macular degeneration (item 42740).
15 Often referred to as non-referred attendances.

Extended Medicare Safety Net (EMSN) Review RepoRt 2009
47
Figure 3.20: Top twenty Medicare items with highest EMSN benefits, 2007 ($ million)
Figure 3.20 is based on the twenty Medicare items with the highest total EMSN benefits. A different list emerges when examining Medicare items with the highest average EMSN benefit per service (see Table 3.16). The two lists only have one item in common: item 13200, assisted reproductive services.
Thirteen of the twenty Medicare items with the highest average EMSN benefit per service were billed less than thirty times in 2007 on an out-of-hospital basis. These services are more usually associated with in-hospital billing arrangements. For example, the vast majority of services for items associated with lipectomy and rhinoplasty were billed on an in-hospital basis, but the small number of services that were billed on an out-of-hospital basis received substantial EMSN benefits.
It should be noted that, collectively, these top twenty highest average EMSN benefit items only explain 12% of total EMSN expenditure. The vast majority of this total is accounted for by item 13200. Nevertheless, Table 3.16 highlights some more general points about the Australian health care system. Firstly, there is considerable ambiguity in the Australian health care system around what defines in-hospital and out-of-hospital care, providing some flexibility as to how patients are treated and billed. Secondly, advances in technology have enabled considerable shifts in the care setting. More and more procedures that have traditionally been undertaken in the in-hospital domain can now be conducted in the out-of-hospital setting. Thirdly, the EMSN may make it more advantageous for some patients to be treated and/or billed in the out-of-hospital setting. These factors may, in the future, contribute to a greater number of services shifting from the in-hospital to the out-of-hospital setting. This would have considerable financial implications for patients, government and private health insurers and the EMSN. Section 4 of this report investigates whether there has been a shift in billing arrangements between in-hospital and out-of-hospital settings.
0 10 20 30 40 50 60 70 80 90 100
Planning and management of a pregnancy (16590)
Assisted reproductive services (13200)
Assisted reproductive planning and management (13209)
GP attendance level B (23)
Antenatal attendance (16500)
Specialist attendance (105)
Specialist attendance (104)
Consultant physician (116)
Psychiatry (306)
Consultant physician (110)
Varicose veins (32500)
Assisted reproductive services (13218)
Psychology attendance (80110)
Radiation oncology (15263)
GP level C (36)
Paracentesis (42740)
Psychiatry (304)
Radiation oncology (15266)
Psychiatry (319)
Radiation oncology (15269)
$ million

Extended Medicare Safety Net (EMSN) Review RepoRt 2009
48
Table 3.16: Medicare items with highest average EMSN benefit per service and more than ten out-of-hospital services per year, 2007
seRviCe desCRiPtion (mediCARe item)
AveRAge emsn benefit PeR seRviCe
numbeR of seRviCes totAl emsn benefit
in-HosPitAl
out-of-HosPitAl totAl$ $
Hair transplant (45560) 3,288 12 192 204 631,270
Lipectomy (30174) 2,741 386 12 398 32,897
Rhinoplasty (45638) 1,657 2,149 20 2,169 33,147
Dental care for patients with chronic/complex needs (10977) 1,611 0 61 61 98,273
Reduction mammaplasty (45522) 1,534 229 86 315 131,931
Brachytherapy planning (15539) 1,516 427 206 633 312,232
Liposuction (45585) 1,400 123 84 207 117,600
Rhinoplasty (45641) 1,373 1,873 29 1,902 39,809
Vulvoplasty or labioplasty (35533) 1,241 1,036 99 1,135 122,902
Assisted reproductive services (13200) 1,193 18 30,578 30,596 36,483,614
Cleft lip and cleft palate services (75037) 1,095 0 17 17 18,619
Mastectomy (male) (31527) 1,065 1,204 123 1,327 130,937
Some of the items listed in Table 3.16 appear to be services that should be provided in the in-hospital rather than out-of-hospital setting. This raises issues of safety and billing. It may be the case that the EMSN has added to incentives to provide care in the out-of-hospital setting, when this care is more safely conducted in the in-hospital setting. The EMSN may also add an incentive to bill patients in the out-of-hospital setting—even though the care was actually provided in the in-hospital setting. Also, several items fall into the category of plastic and reconstructive surgery. Note that some other high average EMSN benefit items were not included in the table due to the low number of services raising concerns about privacy, including a number of items relating to some oral and maxillofacial services.

Extended Medicare Safety Net (EMSN) Review RepoRt 2009
49
3.7 ConclusionsWhilst the majority of people face OOP costs of less than $50 per year and 93% face OOP costs of less than $300 per year, some members of the community face significant medical bills. In 2003, around 14,000 people incurred OOP costs of more than $2,000. This number fell by around 9,500 following the introduction of the EMSN, which indicates that the EMSN has provided these people with some financial relief. However, in recent years, the number of people incurring high OOP costs has increased again. In 2007, some 11,000 Australians incurred OOP costs of more than $2,000.
With few people experiencing high OOP costs, it not surprising that EMSN benefits are highly concentrated towards a small group of the population. In 2007, less than 1% of single people and just over 8% of families received EMSN benefits. Whilst families who were eligible for the lower threshold were more likely to qualify for the EMSN, they received far fewer benefits than those who qualified under the general threshold. Families on the general threshold with EMSN claims received an average benefit of $1,200 in 2007, whereas recipients of FTB(A) received around $600, and families with Commonwealth concession cards received less than $400. Similarly, singles on the general threshold qualifying for EMSN benefits received $1,000, on average, in 2007, while those with Commonwealth concession cards received $400. The figures for both singles and families suggest that, despite the lower threshold for low and middle income households, the EMSN appears to be a relatively ineffective way to direct higher benefits to those with Commonwealth concession cards, who are generally on low incomes.
This is further supported by the impact of changes to the thresholds in 2006. These changes resulted in a large number of singles and families being excluded from EMSN benefits, but had little impact on the average benefits received by those families and singles who reached the thresholds.
We investigated the distribution of EMSN benefits amongst patients with several chronic and complex conditions that were identifiable through Medicare data. We found that, for the 27% of patients with cancer who claimed a Medicare service for chemotherapy or radiotherapy, the EMSN provided over $1,000 in benefits. For the 5% of patients with diabetes who qualified, the EMSN provided around $370 in benefits. Comparing the years before and after the introduction of the EMSN shows that OOP costs fell for these patients, but the fall in OOP costs was less than the amount of EMSN benefits provided to these patients. For example, in the case of cancer, the average EMSN benefit was $303 but average OOP costs for patients with cancer fell by only $118.
EMSN benefits are highly concentrated in certain types of services. In 2007, over 50% of all EMSN benefits helped fund obstetrics and assisted reproductive services. From 2003 to 2007, the amount of public funding going towards private obstetric services increased from $80.5 million to $199.5 million. Eighty-three percent of this increase was attributable to the EMSN. In the case of assisted reproductive services, government benefits increased from $55.5 million to $158.7 million, with 70% of this increase attributable to the EMSN. This is consistent with the large share of EMSN benefits going to women in their child-bearing years. Only 8% of EMSN benefits go towards funding GP consultations. Furthermore, the threshold changes that occurred in 2006 had a sustained impact on reducing benefits to non-referred attendances, but had a negligible impact on the amount of EMSN benefits funding private obstetrics and assisted reproductive services.

Extended Medicare Safety Net (EMSN) Review RepoRt 2009
50
The review also found that some services receiving high EMSN benefits would generally be provided in an in-hospital setting, raising questions of safety when these services are provided out of hospital. Other types of services attracting high EMSN benefits fall into the category of plastic and reconstructive surgery.
Since its inception, the EMSN has provided more benefits to people living in Australia’s richer areas. Some 55% of EMSN benefits are distributed to the top quintile of Australia’s most socioeconomically advantaged areas, whereas the least advantaged quintile receives less than 3.5%. This is consistent with the fact that people in wealthy areas also incur more OOP costs. Two possible reasons for this phenomenon are that people in low income areas: (1) are more likely to be bulk billed for some Medicare services such as GP consultations; and (2) use some Medicare services, such as specialist consultations, less often.
Despite overwhelming evidence that people on low incomes have high health care needs, utilisation of specialist care in Australia is very heavily concentrated in higher socioeconomic areas. The high OOP costs associated with this type of care have been seen as a major barrier to access for those in lower socioeconomic groups (Jones & Nicolás 2004; Kawachi & Kennedy 1999; Kennedy, Kawachi & Prothrow-Stith 1996; Lostao et al. 2007; Manning et al. 1987; Propper 1998; Ross et al. 2000; Trendle 2005; van de Voorde, van Doorslaer & Schokkaert 2001; Wagstaff & van Doorslaer 2000; Wilkinson 1997; Wong et al. 2001; Young & Dobson 2003; Young, Dobson & Byles 2000, 2001).
The evidence from this review suggests that the kinds of services that drive a significant component of EMSN benefits are not distributed according to health care need in Australia. The EMSN may have made services more affordable for some (people using assisted reproductive services, some patients with complex conditions such as cancer), but appears to have had little impact for those in more remote areas or in lower socioeconomic groups.
The evidence outlined in this section provides some indication that, despite the generous nature of the EMSN for those who qualify, this policy has not facilitated change in the patterns of care. For example, there is no evidence that the EMSN has made services more affordable for those living in poorer areas. Indeed, with most of the benefits flowing to services that are more often used by wealthier sections of the community, the EMSN may even have entrenched the status quo. That is, it may be helping wealthier people to afford even more high-cost services.

Extended Medicare Safety Net (EMSN) Review RepoRt 2009
51
4 tHe imPACt of tHe extended mediCARe sAfety net
4.1 Overview of methodsThis part of the review examines whether the introduction of the Extended Medicare Safety Net (EMSN) was associated with a significant change in the:
• average fee charged per medical service
• average overall Medicare benefit paid per service, including EMSN benefit
• average net Medicare benefit paid per service, excluding EMSN benefit
• average out-of-pocket (OOP) cost per service
• number of services used per capita
• percentage of services bulk billed.
We have approached this part of the review by comparing time trends before and after the introduction of the EMSN. That is, we estimate the pre-EMSN time trends for each of the above outcomes of interest, and then compare these to post-EMSN time trends. For example, by how much were average fees rising per quarter before the EMSN compared to rises after its introduction? We test whether there was a statistically significant difference between these two time trends. In addition, we examine whether the introduction of the EMSN was associated with an instant change in any of the outcomes of interest. For example, did the average Medicare benefit increase as soon as the EMSN was introduced?
We used Ordinary Least Squares (OLS) regression analysis to estimate the models. More detail about the regressions can be found at <http://www.health.gov.au>. Quarterly data from the first quarter of the 2000 calendar year through to the third quarter of 2008 were used to examine the pre- and post-EMSN time trends. The review therefore had access to data for thirty-five quarters, of which sixteen occurred before the introduction of the EMSN, and nineteen occurred after its introduction. For each quarter, the review had access to the total number of services used, the number of services bulk billed, the fees charged, the Medicare benefits paid, the total EMSN benefits paid, and the OOP costs. Each data field was further categorised by in-hospital and out-of-hospital status. These data were made available for each of the (approximately) 5,700 items on the Medicare Benefits Schedule (MBS). All current dollar figures were converted to constant 2007 dollars using the quarterly national Consumer Price Index.
An important challenge for this analysis is to isolate the impacts of the EMSN from changes that are not attributable to its introduction. It is possible that other changes in the health care market occurred around the same time as the EMSN, such as increases to Medicare benefits and the introduction of new items. If this were the case, there is a risk that the type of analysis described above may wrongly attribute estimated changes to the EMSN. We have developed several strategies to address this concern and strengthen the causal interpretation of the results. Firstly, we include in-hospital services in the analysis (that is operations). As the EMSN does not apply to these services, they serve as a control group to observe whether there were changes occurring to the overall medical market at the time the EMSN was introduced.

Extended Medicare Safety Net (EMSN) Review RepoRt 2009
52
Secondly, for each professional group16 in this study we examine whether in-hospital trends differ from out-of-hospital trends. For example, we examine whether psychiatrists’ average out-of-hospital fees (EMSN eligible) changed compared to their average in-hospital fees (EMSN ineligible).
Thirdly, we include net Medicare benefits in the analysis, which are essentially the amount of money patients get back from Medicare Australia, excluding the EMSN component. This allows us to estimate the impact of changes to benefits that are not directly attributable to the EMSN. For example, we can detect changes to MBS fees over the period, the introduction of new Medicare items during the period, and changes in the types of services provided. These strategies make the analysis and its conclusion more robust. Nevertheless, care is still required in interpreting the findings and we highlight areas where extra care is warranted.
The remainder of this section is set out as follows. Section 4.2 presents results on the impact of the EMSN on average fees, benefits and OOP costs, first for all the professional groups combined, and then for individual professional groups. Section 4.3 looks at the impact of the EMSN on bulk billing rates, and Section 4.4 examines its impact on patients’ use of medical services. Section 4.5 then examines the impact of the EMSN on the service setting, such as whether different professional groups have different trends in the average fees and the number of services they provide to their in-hospital and out-of-hospital patients. This section also looks at the total fees charged in these different settings. Section 4.6 investigates the special case of obstetrics and assisted reproductive services further. Section 4.7 reports on the impact of the EMSN on individual Medicare items, including its impact on items that are billed by different groups of medical providers (peer groups). Finally, Section 4.8 provides some concluding comments.
4.2 Impact on average fees, benefits and out-of-pocket costs
All PRofessionAl gRouPsTable 4.1 shows the results of regression analyses for all the professional groups of services, excluding general practice (GP)17 consultations and pathology services. These two groups were excluded from the overall analysis because their relative market size means that they are likely to dominate any results, and also because there were policy changes coinciding with the introduction of the EMSN that may confound the interpretation of the results. We present the results for GP consultations and pathology services separately when we analyse the impact of the EMSN on individual professional groups later in this section.
Results are shown in Table 4.1 for four outcomes of interest: average fees, overall benefits, net benefits and OOP costs.18 The constant can be interpreted as the average dollar amount at the start of the period of analysis. For example, the average fee per service was $82.82 at the start of the first quarter of 2000, whereas the average overall benefit was $67.41. The pre-EMSN time trend is an estimate of how much the average amount changed each quarter between 2000 and 2008, inclusive. For example, the average fee increased by 34 cents every quarter.
16 The professional groups of services are based on Medicare item data, rather than the speciality of the practitioner providing the service. The groups consist of GP consultations, psychiatric consultations, specialist attendances, obstetric services, pathology services, diagnostic imaging services, radiation oncology services, nuclear medicine services, and assisted reproductive services.
17 In this report we use ‘GP’ to refer to both general practice and a general practitioner.18 ‘Overall benefits’ refer to the overall amount of money patients are reimbursed from Medicare Australia, including the
EMSN benefit. ‘Net benefits’ refer to the amount of money patients are reimbursed from Medicare Australia, excluding the EMSN component.

Extended Medicare Safety Net (EMSN) Review RepoRt 2009
53
The EMSN instant effect is a measure of how much each outcome of interest changed at the time the EMSN was introduced. For example, we estimate that average fees rose instantly by $4.62, whereas OOP costs fell by $1.57. The EMSN time trend estimates the change per quarter after the EMSN was introduced, in relation to the pre-EMSN time trend. For example, we estimate that, after the introduction of the EMSN, average fees increased by 82 cents per quarter—over and above the pre-EMSN time trend of 34 cents. The asterisks in Table 4.1 provide an indication of the level of significance associated with the result. That is, one asterisk indicates there is a less than 1% probability that the result is not statistically different from zero.
The results show that the trend in the average fee per service changed significantly after the introduction of the EMSN, as did overall benefits and net benefits. However, there was no significant change in the trend for the average OOP cost per service. There is some need for caution in interpreting the results in Table 4.1. Some of the results may be attributable to changes in billing practices by some professional groups. In Section 4.6 we investigate how such factors could be influencing results.
The quarterly change in benefit that can be attributed to the EMSN is given by subtracting the net benefit from the overall benefit. Of the 84 cents increase in quarterly benefit, 46 cents is due to the EMSN (that is 84 cents minus 38 cents). However, these figures are heavily influenced by the obstetrics and assisted reproductive markets. When we exclude these two markets we estimate that, for the 38 cents increase in quarterly benefit, only 4 cents is attributable to the EMSN.
Table 4.1: Changes in fees, benefits and OOP costs for all professional groups ($)
AveRAge
fee
AveRAge oveRAll benefit
AveRAge net benefit
AveRAge ooP Cost
Pre-EMSN time trend 0.34 * -0.16 -0.17 * 0.50 *
EMSN instant effect 4.62 * 6.19 * 0.75 -1.57
EMSN time trend 0.82 * 0.84 * 0.38 * -0.02
Constant 82.82 * 67.41 * 67.04 * 15.41 *
Note: ^ excludes GP consultations and pathology services; * p < 0.01
The results presented in Table 4.1 are shown diagrammatically in Figure 4.1. The vertical dashed line indicates the quarter in which the EMSN was introduced and is included in the majority of the figures in this section. The scattered dots represent actual data points for each quarter, whereas the lines are the predicted values from the regression models.
The graph demonstrates that prior to the EMSN fees were increasing, benefits were decreasing and, as a result, OOP costs were rising. By definition, overall benefits and net benefits were identical prior to the EMSN. After the introduction of the EMSN, overall benefits and net benefits diverged. The gap between overall benefits and net benefits represents the average amount of EMSN benefits per service.

Extended Medicare Safety Net (EMSN) Review RepoRt 2009
54
The graph highlights that whilst benefits increased after the EMSN was introduced, so did fees—leaving the rising OOP costs trend virtually unaltered. Another feature of the graph worth noting is that the scattered points for overall benefits and OOP costs are more widespread after the introduction of the EMSN. This reflects the seasonal nature of the EMSN policy: as more people qualify during the year, benefits start rising and OOP costs start to fall as the year proceeds.
Figure 4.1: Trends in average fees, benefits and OOP costs: all professional groups (excl GP & pathology)
◆ Average fee Predicted average fee● Average overall benefit Predicted average overall benefit■ Average net benefit Predicted average net benefit▲ Average OOP cost Predicted average OOP cost
According to the Australian Medical Association (AMA), MBS fees were increased at rates below the Consumer Price Index and did not keep pace with rising practice costs. This has meant that the amount of public subsidy paid per Medicare service has fallen over time in real terms, and that OOP costs have risen because more providers have had to increase fees beyond the Medicare benefit. The AMA representatives expressed the view that if this trend continues the EMSN will be operating as a type of second tier insurance scheme. Figure 4.1 shows that in the period prior to 2004 the average Medicare benefit per service was falling in real terms. However, after 2004, both overall benefits and net benefits started to rise again.
Some correspondence received by the Department of Health and Ageing from members of the public suggested that after the EMSN was introduced the gap between fees and the MBS grew. Whilst we have found some evidence of this above, the results are dominated by the obstetrics and the assisted reproductive markets. We therefore also analysed pre- and post-EMSN trends for individual professional groups.
200
4060
8010
012
0$
2000q3 2002q3 2004q3 2006q3 2008q3

Extended Medicare Safety Net (EMSN) Review RepoRt 2009
55
individuAl PRofessionAl gRouPsWe have also estimated the impact of the EMSN on average fees, benefits and OOP costs for individual professional groups. Figures 4.2 to 4.5 present the results. The professional groups that reflect similar trends have been grouped together.
The graphs for the four individual professional groups (general practice, specialist attendances, pathology and diagnostic imaging) in Figure 4.2 show that the EMSN did not have an impact on fees, benefits or OOP costs for the services provided by these professional groups. In the case of GP consultations, the change in overall benefits was matched by the change in net benefits, indicating that changes in the GP market are attributable to other policy initiatives, such as the increase in the Medicare benefit to 100% and bulk billing incentives, rather than the EMSN.
For specialist attendances there was no significant change in the overall trends following the introduction of the EMSN. In the case of pathology, there was a small instant rise in average overall benefits following the introduction of the EMSN that was matched, nearly equally, by the small rise in fees, leaving OOP costs unchanged. However, the pre-EMSN trend in pathology fees remained negative. In the diagnostic imaging market, average fees were stable, but benefits were falling, resulting in small rises in OOP costs. We can see that post EMSN the trend in OOP costs has been arrested and is now stable.

Extended Medicare Safety Net (EMSN) Review RepoRt 2009
56
Figure 4.2: Trends in average fees, benefits and OOP costs per service
◆ Average fee Predicted average fee● Average overall benefit Predicted average overall benefit■ Average net benefit Predicted average net benefit▲ Average OOP cost Predicted average OOP cost
010
2030
40
$
2000q3 2002q3 2004q3 2006q3 2008q3
200
4060
8010
0
$
2000q3 2002q3 2004q3 2006q3 2008q3
Specialist attendances0
510
1520
25
$
2000q3 2002q3 2004q3 2006q3 2008q3
Pathology
050
100
150
$
2000q3 2002q3 2004q3 2006q3 2008q3
Diagnostic imaging
General practice

Extended Medicare Safety Net (EMSN) Review RepoRt 2009
57
Figure 4.2: Trends in average fees, benefits and OOP costs per service (continued)
◆ Average fee Predicted average fee● Average overall benefit Predicted average overall benefit■ Average net benefit Predicted average net benefit▲ Average OOP cost Predicted average OOP cost
010
2030
40
$
2000q3 2002q3 2004q3 2006q3 2008q3
200
4060
8010
0
$
2000q3 2002q3 2004q3 2006q3 2008q3
Specialist attendances
05
1015
2025
$
2000q3 2002q3 2004q3 2006q3 2008q3
Pathology
050
100
150
$
2000q3 2002q3 2004q3 2006q3 2008q3
Diagnostic imaging
General practice

Extended Medicare Safety Net (EMSN) Review RepoRt 2009
58
Figure 4.3 shows the results for psychiatry and radiation oncology services. For psychiatry, both overall and net benefits rose following the introduction of the EMSN; this was partly matched by a rise in the average fee, especially in the 2 years after the introduction of the EMSN. These changes mean there was a non-significant change in average OOP costs. However, some care is required in interpreting the results. The scattered data points around the average fee line and net benefits line reveal changes in the psychiatry market after 2006. In particular, in November 2006, the MBS fee for a number of commonly billed items increased by 7%.
Also of potential relevance in interpreting these results is the introduction of psychology items onto the MBS. As noted in stakeholder consultations, the introduction of Medicare benefits for some psychology services may have led to less complex cases being referred to psychologists, and psychiatrists being referred more complex cases, leading to a change in the mix of items being billed by psychiatrists. This could result in an increase in the average amount of net benefit, because complex consultations tend to attract a higher average benefit per service.
As a proxy for greater complexity, we checked whether there were shifts in the number of short and long psychiatric consultations.19 We found that the number of consultations that last up to 45 minutes has been falling, but we did not see any evidence of an increase in the number of longer consultations. On balance, we believe that the significant change in the average fee for psychiatry services that occurred in the two years after 2004 is attributable to the EMSN, but that subsequent psychiatric fee increases are likely to be caused by factors described in the previous two paragraphs.
The results in Figure 4.3 show there was a significant instant increase in overall benefits in the radiation oncology market after the introduction of the EMSN. The one-off jump of $12.46 in benefits was accompanied by an $8.65 increase in fees, resulting in a $3.81 fall in OOP costs. However, the post-EMSN time trends for net benefits and overall benefits are not statistically different from each other. This suggests that the positive post-EMSN trend in average fees can be explained by increases in net benefits, and not by the EMSN.
19 We checked for shifts in the number of out-of-hospital services provided for items 300 to 338.

Extended Medicare Safety Net (EMSN) Review RepoRt 2009
59
Figure 4.3: Trends in average fees, benefits and OOP costs per service
◆ Average fee Predicted average fee● Average overall benefit Predicted average overall benefit■ Average net benefit Predicted average net benefit▲ Average OOP cost Predicted average OOP cost
Figure 4.4 shows the results for the obstetrics and assisted reproductive markets. The results indicate substantial rises in the amount of Medicare benefits for obstetric services. The average out-of-hospital benefit increased from $53 per service in 2003 to $132 in 2007, and this rise is primarily due to the EMSN. Total public funding of private obstetrics also increased significantly after the introduction of the EMSN. In 2003, total Medicare benefits for obstetric services, including in-hospital and out-of-hospital payments, were $80.5 million; by 2007, this had increased to $199.1 million. The in-hospital component of this benefit grew by 8% over that period and the out-of-hospital component grew by 313%.
The data indicate that the obstetrics markets saw significant rises in quarterly fees after the introduction of the EMSN. However, careful interpretation is required because some of these results may be an artefact of a change in billing practice rather than a change in fees. AMA representatives claim that pre-EMSN Medicare data on fees and OOP costs is unreliable because prior to the EMSN some charges were normally billed as a separate non-Medicare invoice. This would mean that, prior to the EMSN, Medicare data underestimate the average fee and OOP cost for this group of services. We return to this issue in Section 4.6.
050
100
150
200
$
2000q3 2002q3 2004q3 2006q3 2008q3
Psychiatry
050
100
150
200
$
2000q1 2002q1 2004q1 2006q1 2008q1
Radiation oncology

Extended Medicare Safety Net (EMSN) Review RepoRt 2009
60
Figure 4.4: Trends in average fees, benefits and OOP costs per service
◆ Average fee Predicted average fee● Average overall benefit Predicted average overall benefit■ Average net benefit Predicted average net benefit▲ Average OOP cost Predicted average OOP cost
Results for assisted reproductive services are also shown in Figure 4.4. There was a significant instant rise in average overall benefits, but not for net benefits. Total public funding of assisted reproductive services through Medicare increased from $55.5 million in 2003 to $158.7 million in 2007. The EMSN accounts for 70% of this increase and the remainder is explained by increased utilisation (which in part may also be attributable to the EMSN).
Average fees for assisted reproductive services increased instantly after the introduction of the EMSN. Average fees were increasing rapidly prior to the EMSN and this rate of growth increased even further post EMSN. In the first year after the introduction of the EMSN average fees increased by 21%. We estimate that around three-quarters of this increase was attributable to the EMSN. Over the period after the introduction of the EMSN, average fees increased by 10.3% per year and half of this increase was due to the EMSN. That is, we estimate that the EMSN was directly responsible for a 5% increase in fees per year.
The market also saw a one-off fall in the average OOP cost per service at the start of the EMSN. The trend in OOP costs, whilst still positive, did not rise as fast post EMSN as it did pre EMSN. The rise in fees has diluted the extent to which EMSN benefits have reduced OOP costs for patients using assisted reproductive services. We estimate that, for every dollar spent on the EMSN, providers received 52 cents and 48 cents went towards reducing patient OOP costs.
Similar to the claims made in relation to obstetric services, representatives of the AMA claimed that there has been a change in billing practices for assisted reproductive services. We will examine these claims further in Section 4.6.
Figure 4.5 sets out the results for the operations market. It is important to remember that this analysis was based on in-hospital services only—services that are ineligible for EMSN benefits. In contrast to the many other professional groups shown, the rising trend in average fees was curtailed after the introduction of the EMSN. Indeed, of all the professional groups in this
050
100
150
200
$
2000q3 2002q3 2004q3 2006q3 2008q3
Obstetrics
200
040
060
080
010
0012
00
$
2000q3 2002q3 2004q3 2006q3 2008q3
Assisted reproductive services

Extended Medicare Safety Net (EMSN) Review RepoRt 2009
61
analysis, the operations group was the only one that saw a significant slow down in fee growth after the EMSN was introduced. This provides us with evidence that the fee increases by some professional groups in the out-of-hospital setting are not due to other factors in the medical market (for example rises in the cost of medical practice placing pressure on fees).
Figure 4.5: Trends in average fees and benefits per service: operations
◆ Average fee Predicted average fee● Average overall benefit Predicted average overall benefit■ Average net benefit Predicted average net benefit
4.3 Impact on bulk billing ratesJust as we estimated the impact of the EMSN on average fees, benefits and OOP costs, we also estimated its impact on bulk billing rates. Here we discuss the main findings for each professional group.
GP consultations: Bulk billing rates jumped after the introduction of the EMSN by 4% and increased by about 1% per quarter compared to the pre-EMSN time trend. Once again, these findings need to be interpreted in the context of other policy initiatives that were introduced around the same time as the EMSN, including bulk billing incentives.
Specialist attendances, psychiatry, radiation oncology: Services related to these professional groups are all characterised by an initial decline in bulk billing rates followed by small quarterly rises. The overall bulk billing trend for specialist attendances was very stable. In the case of psychiatry there remained an overall downward trend in the rate of bulk billing, but in the period after the introduction of the EMSN the decline in bulk billing slowed. Prior to the EMSN the bulk billing rate for radiation oncology services was going up and the EMSN has reinforced this trend.
010
020
030
040
050
060
0
$
2000q3 2002q3 2004q3 2006q3 2008q3

Extended Medicare Safety Net (EMSN) Review RepoRt 2009
62
Obstetrics and operations: In both these professional groups the pre-EMSN bulk billing trend was negative, but, post EMSN, more services were bulk billed.
Pathology and diagnostic imaging: Aside from a very small one-off drop in bulk billing rates in diagnostic imaging, the overall bulk billing trends appear to have been unaffected by the EMSN for both these professional groups.
Assisted reproductive services: Very few services are bulk billed in this professional field, but the pre-EMSN bulk billing trend was positive. Following the introduction of the EMSN, the trend was still positive but the rate of growth slowed.
4.4 Impact on patients’ use of medical services A fall in OOP costs would be expected to lead to some additional demand for services. Again, we examined pre- and post-EMSN trends for per capita service use for each of the professional groups identified. We found that some specific professional groups saw a significant rise in demand for their services post EMSN.
The private obstetrics market changed from negative to positive growth, which equates to around 1% increase per year in the number of services used per capita— although this could be explained by an increase in the birth rate at the same time. Whilst this is a small change, it is statistically significant.
There has been substantive growth in the demand for assisted reproductive services. We estimate that the demand for services increased by around 10% per year after the introduction of the EMSN. Other markets that also experienced positive post-EMSN growth trends were GP consultations, pathology, diagnostic imaging, and radiation oncology services—although the latter two professional groups were only just statistically significant.
The post-EMSN trends for specialist attendances and psychiatry, as well as operations, were not significantly different from zero—meaning that they were no different to the prevailing pre-EMSN trends in the number of services used per capita.
4.5 Impact on the service setting
substitution between in-HosPitAl And out-of-HosPitAl billing PRACtiCesThe EMSN may have affected the incentives for doctors and patients to change from in-hospital to out-of-hospital service settings. During stakeholder consultations, the AMA recognised that the incentives provided by the EMSN are to shift costs from in-hospital to out-of-hospital settings, and to structure OOP expenses so they can be covered by the EMSN. For example, obstetricians will usually deliver an episode of care to their patients, some of which is provided in the out-of-hospital setting and some in the in-hospital setting. This gives them, as well as other types of providers, the opportunity to alter fee structures between these settings.
Patients who qualify for the EMSN only face a maximum cost of 20 cents in every dollar charged in the out-of-hospital setting. For some patients, this level of cover may be more generous than their insurance cover for the in-hospital setting. For example, some patients have private hospital insurance with large co-payments and some do not have any cover at all. On the part of providers, the EMSN offers more freedom to raise fees for out-of-hospital

Extended Medicare Safety Net (EMSN) Review RepoRt 2009
63
services compared to the fees they are able to charge in the in-hospital setting. This is especially the case if the provider agrees to abide by a ‘no-gap’ or ‘known-gap’ agreement with private health insurers for care delivered in the in-hospital setting.
The issue of defining in-hospital care was raised by members of the public who had been treated in a day stay facility. Correspondents were confused by the fact that: they were not aware of any admission procedures; they were specifically advised that they did not need to be ‘admitted’ for such procedures; and/or the procedures took place in what they perceived to be the doctor’s surgery. In the perception of these correspondents, the services appeared to be out-of-hospital services, but were classified as ineligible for EMSN benefits (because they were actually in-hospital procedures). As we discussed in Section 3.6, EMSN benefits have been paid for a small number of medical services that are ordinarily delivered in the in-hospital setting, raising concerns about the impact of EMSN incentives on safety. Whilst we only examined items with a high EMSN benefit, this issue may apply to other items as well.
Figure 4.6 illustrates the extent to which different professional groups have altered the average fee charged in the in-hospital and out-of-hospital settings. The graphs only present the professional groups for which a statistically significant result was found.
There is evidence that some professional groups increased their out-of hospital fees relative to their in-hospital fees following the introduction of the EMSN. This result holds for the following professional groups: psychiatry, obstetrics, pathology services, operations, and assisted reproductive services.
In the case of obstetrics and assisted reproductive services, the graphs in Figure 4.6 clearly show that, after the introduction of the EMSN, the average out-of-hospital fee increased and the in-hospital fee decreased. For obstetrics, Medicare data shows that average in-hospital fees fell by 6%, while out-of-hospital fees increased by 267% from 2003 to 2008. Over the same period, average in-hospital fees for assisted reproductive services fell by 9% and out-of-hospital fees increased by 62%. This analysis supports the idea that providers have changed their billing practices by switching some of their fees from the in-hospital to the out-of-hospital setting. This result is perhaps not surprising given that both types of providers offer episodes of care to patients that involve both out-of-hospital and in-hospital services. This enables them to switch some fees more easily between settings.
Figure 4.6 also shows that, after the EMSN, average fees for psychiatry increased, but there was a relatively higher increase in out-of-hospital fees compared to in-hospital fees. In the case of operations, growth in in-hospital fees slowed after the introduction of the EMSN, whereas growth in out-of-hospital fees increased slightly (but was still statistically significant). The graph for pathology services shows a general decline in average fees but a relatively sharper decline in fees charged in the in-hospital compared to the out-of-hospital setting.

Extended Medicare Safety Net (EMSN) Review RepoRt 2009
64
Figure 4.6: Average fees for in-hospital and out-of-hospital services: selected professional groups
◆ Average in-hospital fee Predicted average in-hospital fee● Average out-of-hospital fee Predicted average out-of-hospital fee
020
040
060
080
01,
000
$
2000q3 2002q3 2004q3 2006q3 2008q3
Obstetrics
400
020
060
080
01,
000
1,200
$
2000q3 2002q3 2004q3 2006q3 2008q3
Assisted reproductive services0
2550
7510
012
515
0
$
2000q3 2002q3 2004q3 2006q3 2008q3
Psychiatry
05
1015
2025
3035
4045
$
2000q3 2002q3 2004q3 2006q3 2008q3
Pathology10
00
200
300
400
500
$
2000q3 2002q3 2004q3 2006q3 2008q3
Operations

Extended Medicare Safety Net (EMSN) Review RepoRt 2009
65
We also examined whether the EMSN was associated with a shift in the service setting; that is, we examined whether, after the introduction of the EMSN, more in-hospital services were now provided in the out-of-hospital setting. Using a similar approach to our previous analysis, we examined the pre- and post-EMSN trends for the number of services used by patients in hospital and out of hospital for each of the professional groups. We looked for significant changes that indicated fewer services were being provided in the in-hospital setting following the EMSN, and more services were being provided in the out-of-hospital setting.
Our results show that only the specialist attendances group exhibited a pattern of service use consistent with the notion that the EMSN has contributed to a substitution effect.
totAl in-HosPitAl And out-of-HosPitAl feesWhilst Figure 4.6 shows that average fees have risen for some professional groups in the out-of-hospital setting, this does not mean that overall fees have risen. For example, the results for obstetrics and assisted reproductive services leave some ambiguity as to what happened to overall fees. It is possible that the increase in out-of-hospital fees was offset by the decrease in in-hospital charges. To determine whether overall fees have increased for these professional groups, the total amount of fees charged was modelled (instead of the average fee) over the 2000 to 2008 period. Figure 4.7 shows the results.
Whilst average fees in psychiatry increased, total fees did not. The graph shows that after the introduction of the EMSN, the rate of decline in total out-of-hospital fees was arrested. This result is mostly explained by the general decline in the number of psychiatric services used over the period. So, whilst average fees went up, total fees remained stable because of falling volumes of services. The increases in total fees for pathology and operations are most likely explained by increases in the volume of services provided.
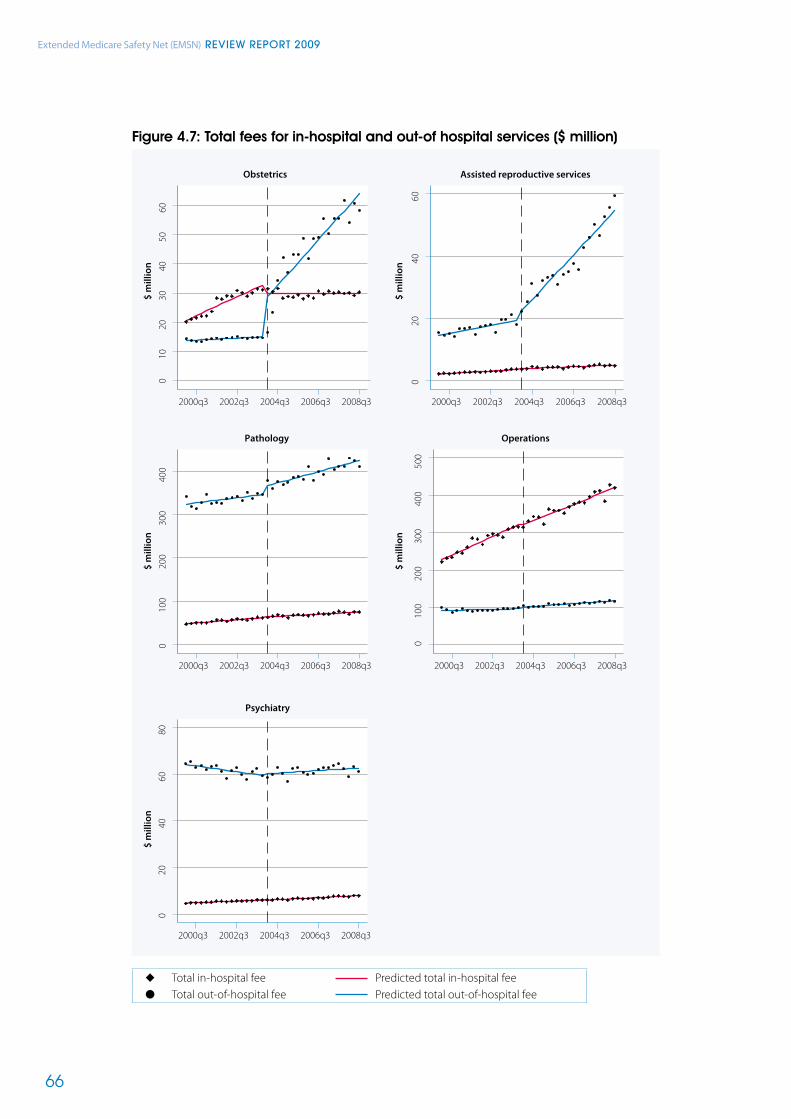
Extended Medicare Safety Net (EMSN) Review RepoRt 2009
66
Figure 4.7: Total fees for in-hospital and out-of hospital services ($ million)
◆ Total in-hospital fee Predicted total in-hospital fee● Total out-of-hospital fee Predicted total out-of-hospital fee
100
2030
4050
60
$ m
illio
n
$ m
illio
n
$ m
illio
n$
mill
ion
$ m
illio
n2000q3 2002q3 2004q3 2006q3 2008q3
Obstetrics
020
4060
2000q3 2002q3 2004q3 2006q3 2008q3
Assisted reproductive services0
2040
6080
2000q3 2002q3 2004q3 2006q3 2008q3
Psychiatry
010
020
030
040
0
2000q3 2002q3 2004q3 2006q3 2008q3
Pathology
100
020
030
040
050
0
2000q3 2002q3 2004q3 2006q3 2008q3
Operations

Extended Medicare Safety Net (EMSN) Review RepoRt 2009
67
Based on the available Medicare data, Figure 4.7 demonstrates that total fees for obstetrics and assisted reproductive services increased after the introduction of the EMSN. As noted previously, some of these increases may be due to rises in the volume of services and some of the rises in the out-of-hospital setting may be due to the booking fees and charges being added to Medicare data for the first time after the introduction of EMSN.
4.6 Sensitivity analysis for obstetrics and assisted reproductive services
As noted previously, concerns were raised about the reliability of Medicare data prior to the introduction of the EMSN for assisted reproductive services and the obstetrics groups. This section reports the results of our sensitivity analysis. This analysis allows us to test the robustness of our conclusions about these two professional groups individually, as well as the overall results for all professional groups.
During our consultations with the AMA, representatives claimed that, prior to the introduction of the EMSN, patients who used obstetric services were regularly charged a booking fee that was not recorded in the Medicare data. After the introduction of the EMSN, providers started to routinely add this charge to their overall Medicare claimable bill. In the months after the EMSN was implemented it became clear that obstetricians substantially increased their fees for antenatal attendances (item 16500). In the space of 6 months the average fee for this service had increased from $45 to $89. One explanation for the increase is that providers changed their billing practice by adding their booking fee to this item.
These observed increases in provider fees led the government to introduce a new Medicare item (item 15999, which later became item 16590) in September 2004. This item can be billed to the patient after 20 weeks of pregnancy and is for services related to the planning and management of a pregnancy. As obstetricians started to bill this item to their patients, the average fee for antenatal attendances fell back to around $52.
These factors could have influenced the increases in fees and OOP costs we observed in Medicare data. However, we would expect that once the shifting of these charges to Medicare had become routine, its impact on Medicare data would no longer be felt.
The AMA also claimed that a similar practice occurred in the assisted reproductive market. In response to the AMA’s assertion that there was a non-Medicare fee for assisted reproductive services, the Department of Health and Ageing informed us that prior to and during the Independent Review on Assisted Reproductive Technology services, de-identified patient claims were examined. These did not provide any evidence that a booking fee existed prior to the introduction of the EMSN. In numerous discussions with the profession on the EMSN, this issue was not raised as a reason for the increase in EMSN expenditure for assisted reproductive services. In fact, the Department of Health and Ageing states that monthly Medicare data reveal the average fee charged for items 13200 and 13209 remained fairly flat while the Independent Review of Assisted Reproductive Technology Services was being conducted (mid 2005 to early 2006) and until November 2006, when the average fee increased dramatically. It is also worth noting that a planning and management item for assisted reproductive services already existed prior to the introduction of the EMSN. Some patients have been and continue to be charged for services such as new techniques and technologies that are not funded through the MBS.

Extended Medicare Safety Net (EMSN) Review RepoRt 2009
68
The aim of this section is to estimate the impact that these claims have on the results reported thus far.
Potentially, these factors can be easily dealt with in our analysis. If we could add any charge to patients that was not observed in the Medicare data, we would be able to repeat our analysis and thereby determine the impact of the charge on our results. Unfortunately, our discussions with the AMA revealed that there is no reliable information on the average amount of these non-observed charges or the proportion of providers who charged these fees.
However, AMA representatives did indicate that a settling-in period of 12 to 18 months was necessary to achieve consistent billing practices. This means that the average charge for the non-observed fees should become observable in the Medicare data around 12 to 18 months after the introduction of the EMSN and item 16590.
To estimate the non-observed charge in the obstetrics group we took the average fee that providers were charging for Medicare item 16590 during the latter half of 2005—some 12 to 18 months after the introduction of that item. This turns out to be around $1,000. We used this amount as the basis for calculating a new average fee charged for the period prior to the introduction of item 16590 in September 2004. We also adjusted the spike in fees for item 16500 (antenatal attendances) so that it was consistent with its long-term average trend.
To estimate the claims of a non-observed charge in the assisted reproductive market we examined Medicare item 13209 (which is associated with the planning and management of one cycle of treatment with assisted reproductive technologies). Between the end of 2003 and the end of 2004, the average fee for this item increased by around $250. We used this amount as the basis for adjusting the fees charged by providers prior to the introduction of the EMSN, as well as in the 12 months afterwards, to take account of the period during which providers were purportedly changing their billing practices.
We then re-estimated the impact of the EMSN using the new data with adjusted fees for the obstetrics market, the assisted reproductive services market, and for all the professional groups combined.
When we compared the new results with those reported in Section 4.2, we found that the conclusions were robust, but there were some changes in the size of the impact. That is, we still conclude that average fees for the obstetrics and assisted reproductive services markets rose significantly as a result of the EMSN.
We found that in the obstetrics market OOP costs fell when the EMSN was introduced, but there was no significant change in the overall observed trend for OOP costs. We found a significant reduction in OOP costs for patients using assisted reproductive technologies after the EMSN was introduced, which is similar to our earlier finding. Where this finding differs from our earlier finding is that we now identified a small negative (but significant) trend in OOP costs.
The changes that occurred in the obstetrics and assisted reproductive markets had some impact on our overall results. For the combined professional groups there remained a significant upward trend in the average fee, but the immediate jump in fees observed in our earlier analysis was no longer evident.

Extended Medicare Safety Net (EMSN) Review RepoRt 2009
69
Consistent with our previous results, there is no evidence that the EMSN has had an impact on the observed trend for OOP costs. However, the result does show a significant drop in OOP costs at the commencement of the EMSN. This is similar to our earlier finding, but the result is now statistically significant. For more details on the regression analyses please refer to <http://www.health.gov.au>.
The results of our sensitivity analysis allow us to make a more conservative estimate of the impact of the EMSN on fees and OOP costs, taking claims of a ‘booking fee’ into account. We estimate that the long-term increase in obstetric fees that is attributable to the EMSN is around $11 per service per year. In the year after the introduction of the EMSN, average obstetric fees increased by 3.3% and we estimate that 66% of this increase was due to the EMSN. Over the period after the introduction of the EMSN, average fees increased by 7.4% per year and 86% of this increase was attributable to the EMSN. That is, we estimate that the EMSN was directly responsible for a 6.4% increase in fees per year.
The overall analysis on the professional groups (excluding GP consultations and pathology) also showed a significant increase in average fees of 5.4% in the first year after the introduction of the EMSN. We estimate that 76% of this increase was due to the EMSN. Over the period after the introduction of the EMSN average fees increased by 4.2% per year and 70% of this increase was due to the EMSN. That is, we estimate that the EMSN was directly responsible for a 2.9% increase in fees per year.
Table 4.2 shows our estimates of the proportion of EMSN expenditure that has gone towards increased fees and reduced OOP costs under various scenarios. On the assumption that patients of obstetric and assisted reproduction services were charged a booking fee, we estimate that providers gained 38 cents and patients gained 62 cents of every dollar the government spent on the EMSN in 2008. This is our most conservative estimate of the amount of EMSN benefits that went towards providers’ incomes and reduced costs for patients.
Table 4.2: Estimated change in provider fees and OOP costs for every dollar spent on the EMSN
CHAnge in PRovideR fees CHAnge in ooP Costs
Obstetrics (no booking fee) 1.39 0.39
Obstetrics (with booking fee) 0.33 -0.67
Assisted reproductive services (no booking fee) 0 52 -0.48
Assisted reproductive services (with booking fee) 0.31 -0.69
All professional groups (no booking fee) 0.87 -0.13
All professional groups (with booking fee) 0.38 -0.62
All professional groups (with obstetric booking fee only) 0.43 -0.57
Note: ‘All professional groups’ excludes GP and pathology services.

Extended Medicare Safety Net (EMSN) Review RepoRt 2009
70
4.7 Impact on individual Medicare items
mediCARe items witH HigH emsn benefitsFor this part of the analysis we focused on Medicare items that have attracted a high level of EMSN benefits. We selected items on the basis that they reached the top forty highest EMSN items in any of the years since the EMSN was introduced. This meant that there were fifty-four individual items, which collectively accounted for 85% of all EMSN benefits in 2007. We conducted the same analysis on these individual items as we did in Section 4.2, by examining the pre- and post-EMSN trends in average fees, overall benefits, net benefits, OOP costs and services per capita. It is important to note that six items were introduced onto the MBS after the EMSN was implemented, which stopped us from estimating a pre-EMSN time trend. For these items, we report trends for the post-EMSN era only.
For the purposes of reporting the results here, we categorised the remaining forty-eight Medicare items into three groups:
• low OOP cost items (OOP costs less than $10 per service)
• moderate OOP cost items (OOP costs between $10 and $50 per service)
• high OOP cost items (OOP costs more than $50 per service).
In 2007, these groups accounted for 7%, 24% and 25% of EMSN expenditure, respectively. A list of the Medicare items categorised in each of these groups can be found at <http://www.health.gov.au>.
The results are shown in Figure 4.8. The low OOP cost items demonstrate little impact after the introduction of the EMSN. These low OOP cost items include a number of GP items, and therefore the trend is more likely to have been influenced by policy changes other than the EMSN. Indeed, the post-EMSN scatter points suggest substantial changes in benefits and fees at the start of 2005—coinciding with the policy change to increase GP benefits to 100% of the MBS fee.
The moderate OOP cost graph illustrates that the growth in fees declined after the EMSN was introduced and that benefits did not increase significantly. This surprising result is because of the large volume of services claimed for these items. That is, the average amount of EMSN benefit per service is quite small but because so many services in the moderate group are claimed each year, the total amount of EMSN benefits is high. The growth in OOP costs declined post EMSN for the moderate group.
Finally, for the high OOP cost group, average fees and overall benefits rose significantly and markedly—whereas net benefits remained stable. After an initial dip in OOP costs, the time trend in the post-EMSN period is equivalent to the pre-EMSN period trend. We estimate that, for these items, for every EMSN dollar spent, around 78 cents went towards higher fees and 22 cents went towards reducing patients’ OOP costs.

Extended Medicare Safety Net (EMSN) Review RepoRt 2009
71
Figure 4.8: Trends in average fees, benefits and OOP costs: Medicare items with high EMSN benefits
◆ Average fee Predicted average fee● Average overall benefit Predicted average overall benefit■ Average net benefit Predicted average net benefit▲ Average OOP cost Predicted average OOP cost
While service use per capita increased for the low OOP cost and the high OOP cost groups, it actually decreased for the moderate OOP cost group after the introduction of the EMSN.
Since the introduction of the EMSN, several new items have been added to the MBS, some of which have attracted substantial EMSN benefits. Whilst it is not possible to estimate a pre-EMSN trend for these Medicare items, we have analysed these items to estimate the current trend associated with each item. Figure 4.9 shows the results for the six individual Medicare items in question.
Declining trends in fees and benefits were found in four out of the six items—albeit a number of these were insignificant. However, for two items (16590 and 55707), fees have been increasing. In the four years since its introduction in September 2004, the average fee for item 16590 (planning and management of pregnancy) increased from around $1,000 to $1,350. Item 55707 is a pregnancy-related ultrasound introduced in November 2005. From 2005 to 2008, average fees increased from $135 to $153 per ultrasound.
010
2030
40$
2000q3 2002q3 2004q3 2006q3 2008q3
Low OOP items
020
4060
8010
0$
2000q3 2002q3 2004q3 2006q3 2008q3
Moderate OOP items
010
020
030
040
050
060
070
0$
2000q3 2002q3 2004q3 2006q3 2008q3
High OOP items

Extended Medicare Safety Net (EMSN) Review RepoRt 2009
72
Figure 4.9 Trends in average fees, benefits and OOP costs: new Medicare items with high EMSN benefits
◆ Average fee Predicted average fee● Average overall benefit Predicted average overall benefit■ Average net benefit Predicted average net benefit▲ Average OOP cost Predicted average OOP cost
050
100
150
200
250
$
2007q4 2008q1 2008q2 2008q3 2008q4
Consultant physician (Item: 132)
010
2030
4050
$2005q1 2006q1 2007q1 2008q1 2009q1
Out−of−hours GP (Item: 5020)
010
020
030
040
050
0$
2007q2 2007q3 2007q4 2008q1 2008q2 2008q3
Assisted reproductive services (Item: 13251)
050
01,
000
1,50
0$
2004q3 2005q3 2006q3 2007q3 2008q3
Plan & manage pregnancy (Item: 16590)
040
8012
016
0
$
2005q3 2006q3 2007q3 2008q3
Ultrasound−pregnancy (Item: 55707)
040
8012
016
0$
2006q4 2007q2 2007q4 2008q2 2008q4
Psychology consultation (Item: 80010)

Extended Medicare Safety Net (EMSN) Review RepoRt 2009
73
PeeR gRouP itemsSo far we have looked at broad professional service groups. Within these broad groups, we can further distinguish between different types of medical providers (peer groups) who bill similar Medicare items. For example, Medicare item 104 is described as a ‘specialist attendance’. This broad description means that a range of medical specialists, such as radiation oncologists and dermatologists, will bill this item to their patients.
In this section of the report, we examine whether there are any differences in billing practices between peer groups for items related to specialist attendances and obstetric services.
Specialist attendancesSpecialist attendance items are billed by various medical specialists. Data on these Medicare items were used to examine the average fees, benefits and OOP costs associated with nineteen different peer groups. Again, we examined pre- and post-EMSN trends to determine whether there were any significant changes.
The results show that, of the nineteen peer groups analysed, eight groups did not exhibit a significant change in the average fee charged after the introduction of the EMSN. For the most part, the average fee charged by these medical specialists was growing before the introduction of the EMSN and continued to do so afterwards. Eight peer groups showed a negative trend in average fees after the EMSN and three groups recorded a significant increase in average fees charged. The results for the latter three peer groups are shown in Figure 4.10.
The graph for radiation oncologists shows that after the EMSN a negative trend in average fees was converted into a slightly positive trend. The results for dermatologists indicate that the rate of growth in average fees increased further after the EMSN.
Finally, the scattered data points in the specialist physician graph indicate that average fees rose considerably towards the end of 2004, but then started falling after the end of 2005. Overall benefits did not increase significantly in any of the three medical specialist fields shown in Figure 4.10. This provides evidence that EMSN benefits were not making a major contribution to the average amount of benefit per service.

Extended Medicare Safety Net (EMSN) Review RepoRt 2009
74
Figure 4.10: Trends in average fees, benefits and OOP costs per service: specialist attendance items
◆ Average fee Predicted average fee● Average overall benefit Predicted average overall benefit■ Average net benefit Predicted average net benefit▲ Average OOP cost Predicted average OOP cost
Obstetric servicesMedicare items relating to obstetric services can be claimed by obstetricians, and also by GPs who provide obstetric care to their patients. We examined whether there were differences in the pre- and post-EMSN trends for these provider groups for the same Medicare items.
Figure 4.11 illustrates the changes over time in fees, benefits and OOP costs. The scattered data points around the average GP fee indicate that these increased around the start of 2005, rather than at the start of the EMSN. The trend after this one-off jump appears to be relatively flat. As benefits did not increase after the introduction of the EMSN, it seems that patients who use GP-based obstetric care tend not to qualify for EMSN benefits compared to those who use obstetrician-based care. As illustrated in Figure 4.11, average fees, benefits and OOP costs appear to have increased after the introduction of the EMSN.
020
4060
$
2000q3 2002q3 2004q3 2006q3 2008q3
Radiation oncologist
2040
6080
100
$
2000q3 2002q3 2004q3 2006q3 2008q3
Dermatologist
1020
3040
5060
$
2000q3 2002q3 2004q3 2006q3 2008q3
Specialist physician

Extended Medicare Safety Net (EMSN) Review RepoRt 2009
75
Figure 4.11: Trends in average fees, benefits and OOP costs per service: obstetric items
◆ Average fee Predicted average fee● Average overall benefit Predicted average overall benefit■ Average net benefit Predicted average net benefit▲ Average OOP cost Predicted average OOP cost
The differences between GPs and obstetricians in the fees charged and EMSN benefits are mainly explained by Medicare item 16590 for the planning and management of pregnancy. The average fee charged by obstetricians in 2004 was $1,238, and in 2008 this had increased to $1,732—an increase of 40% over and above the rate of inflation. There is considerable diversity amongst obstetricians in their fees for Medicare item 16590. The bottom 25% of the range of fees charged for this item went up from $400 in 2005 to $1,250 in 2008. In the top 25% range, the fee rose from $1,500 in 2005 to $2,800 in 2008. GP fees for obstetric services, on the other hand, fell by 16% over the period, from $159 to $134.
Since 2004 the percentage of bulk billed services has increased for both GPs and obstetricians. By 2008, the rate of bulk billing for GP obstetric services was 62% (up from 42% in 2004) and for obstetricians it was 25% (up from 15% in 2004).
050
100
150
200
250
$
2000q3 2002q3 2004q3 2006q3 2008q3
General practitioners
050
100
150
200
250
$
2000q3 2002q3 2004q3 2006q3 2008q3
Obstetricians

Extended Medicare Safety Net (EMSN) Review RepoRt 2009
76
4.8 ConclusionsIn this part of the review, we examined whether there were any significant changes in provider fees, Medicare and EMSN benefits, OOP costs for patients and the number of services used by patients after the introduction of the EMSN. A major focus has been on the extent to which EMSN benefits lowered OOP costs and the extent to which they resulted in increased provider fees. We employed several strategies to ensure that the results obtained can be attributed to the EMSN. We analysed these changes for all the professional groups combined, as well as for individual professional groups.20
Below, we summarise the main findings.
Provider fees: Overall, provider fees increased significantly. After the introduction of the EMSN, average fees increased by 4.2% per year in real terms and we attribute around 70% of this increase to the EMSN. That is, we estimate that the EMSN was directly responsible for a 2.9% increase in fees per year. This result is based on our analysis of all the professional groups combined. It excludes fees charged for GP consultations and pathology.
When we analysed the professional groups individually, we found large differences between them. For example, we found no significant increases in average fees charged for GP consultations, specialist attendances, pathology services or diagnostic imaging services that were attributable to the EMSN. However, there were significant increases in fees for services relating to psychiatry and radiation oncology. The rise in fees in these areas is partly explained by changes that occurred in the MBS, and partly by the EMSN.
There were also substantial rises in the fees charged for private obstetrics. Some of these initial fee increases may have reflected a change in billing practice by providers of obstetric services. Based on our sensitivity analysis, we estimate that obstetric fees increased by 7.4% per year and 86% of this increase was due to the EMSN. In the case of assisted reproductive services we estimate that the EMSN caused fees to increase by around 5% per year.
The impact of the EMSN on fees is most pronounced for Medicare items that are usually associated with high OOP costs per service (that is greater than $50). We believe that for these high OOP cost items, providers are able to assess the patient’s likelihood of qualifying for EMSN benefits. This means that, for services where an episode of care is likely to make patients qualify for EMSN benefits, providers feel fewer competitive market pressures to contain their fees
Medicare and EMSN benefits: After a period of declining Medicare benefits between 2000 and 2003, average benefits increased following the introduction of the EMSN. The EMSN has had an immediate as well as a longer term effect on benefits and reversed a downward trend. Overall, we attribute around half the rise in benefits to the EMSN and the other half to changes in the MBS.
20 The professional groups of services are based on Medicare item data, rather than the speciality of the practitioner providing the service. The groups consist of GP consultations, psychiatric consultations, specialist attendances, obstetric services, pathology services, diagnostic imaging services, radiation oncology services, nuclear medicine services, and assisted reproductive services.

Extended Medicare Safety Net (EMSN) Review RepoRt 2009
77
Patient OOP costs: Whilst the government is spending more through higher Medicare and EMSN benefits, the evidence suggests that this has had a negligible impact on average OOP costs per service for all the professional groups combined—although there were significant falls in OOP costs for some individual professional groups. When we adjusted some of the fees charged in our sensitivity analysis, we found that the EMSN did have an immediate effect on OOP costs, but that it had little impact on the trend. This means that the immediate fall in OOP costs will slowly be eroded. This result also reflects the extent to which average fees have increased, causing considerable leakage of government benefits towards providers’ incomes, rather than reduced costs for patients.
We estimate that, in 2008, for every dollar spent on the EMSN, providers received 43 cents and 57 cents went towards reducing patient OOP costs. In the case of obstetric services, we estimate that for every dollar spent on the EMSN, providers received 33 cents and 67 cents went towards reducing patient OOP costs. The corresponding figures for assisted reproductive services are 52 cents to providers and 48 cents to patients. For high OOP cost Medicare items, which include some assisted reproductive services, as well as procedures to treat varicose veins and vision impairments, we estimate that providers received 78 cents and 22 cents went towards reducing patient OOP costs.
Number of services used: For all the professional groups combined (excluding GP consultations and pathology), there was no significant change in the number of services used following the introduction of the EMSN. However, some professional groups saw a rise in demand for services post EMSN. The obstetrics market has seen a small increase in use, whereas the demand for assisted reproductive services has grown substantially. Other markets, including general practice and pathology, also saw some increase in service use, but specialist attendances, psychiatric consultations and operations did not change after the introduction of the EMSN.
Service setting: Our comparisons of average fees in the in-hospital and out-of-hospital settings reveal that a number of professional groups had significantly different growth trends in each setting after the introduction of the EMSN. For example, out-of-hospital fees for obstetrics and assisted reproductive services increased after the introduction of the EMSN, while average in-hospital fees for these professional groups decreased. We also examined whether there has been a shift in the delivery of services from in-hospital to out-of-hospital settings. We found that, with the exception of specialist attendances, there was no evidence of shifts between service settings as a result of the EMSN.
The evidence on increasing fees across a number of medical specialities has implications for those who use these services, but do not qualify for EMSN benefits. For example, the 75% of patients who use psychiatric services but do not qualify for EMSN benefits may be facing higher average fees for services without the additional financial support offered by the EMSN.


Extended Medicare Safety Net (EMSN) Review RepoRt 2009
79
RefeRenCesAssisted Reproductive Technologies Review Committee 2006, Report of the Independent Review of Assisted Reproductive Technologies, Canberra.
Australia, House of Representatives 2003a, Health Legislation Amendment (Medicare) Bill second reading speech, vol. No. 19, pp. 23779–81.
2003b, Debates, vol. No. 19, pp. 23788–9.
Australian Institute of Health and Welfare 2008, Health expenditure Australia 2006–07, Australian Institute of Health and Welfare, Canberra.
Department of Health and Ageing 2004, Medicare introduces a new safety net for all Australians - consumer information booklet, Commonwealth of Australia.
2008, Medicare Statistics - September 2008, viewed 20 January 2009, <http://www.health.gov.au/internet/main/publishing.nsf/Content/medstat-sep08-contents>.
Jones, AM & Nicolás, AL 2004, ‘Measurement and explanation of socioeconomic inequality in health with longitudinal data’, Health Economics, vol. 13, no. 10, pp. 1015–30.
Jones, G, Savage, E & Hall, J 2004, ‘Pricing of general practice in Australia: some recent proposals to reform Medicare’, Journal of Health Services & Research Policy, vol. 9, suppl. 2, pp. 63–8.
Jones, G, Savage, E & van Gool, K 2008, ‘The distribution of household health expenditures’, The Economic Record, vol. 84, suppl. 1, S99–S114.
Kawachi, I & Kennedy, BP 1999, ‘Income inequality and health: pathways and mechanisms’, Health Services Research, vol. 34, no. 1, pt. 2, pp. 215–27.
Kennedy, BP, Kawachi, I & Prothrow-Stith, D 1996, ‘Income distribution and mortality: cross sectional ecological study of the Robin Hood index in the United States.[see comment][erratum appears in BMJ 1996 May 11;312(7040):1194]’, British Medical Journal, vol. 312, no. 7037, pp. 1004–7.
Lostao, L, Regidor, E, Geyer, S & Aiach, P 2007, ‘Patient cost sharing and social inequalities in access to health care in three western European countries’, Social Science and Medicine, vol. 65, no. 2, pp. 367–76.
Manning, WG, Newhouse, JP, Duan, N, Keeler, EB, Leibowitz, A & Marquis, MS 1987, ‘Health insurance and the demand for medical care: evidence from a randomized experiment’, American Economic Review, vol. 77, no. 3, pp. 251–77.
OECD 2004, Private health insurance in OECD countries, Organisation for Economic Co-operation and Development, Paris.
Propper, C 1998, ‘Who pays for and who gets health care?’ Nuffield Occasional Papers. Health Economics series paper no. 5, Nuffield trust, London.
Ross, NA, Wolfson, MC, Dunn, JR, Berthelot, JM, Kaplan, GA & Lynch, JW 2000, ‘Relation between income inequality and mortality in Canada and in the United States: cross sectional assessment using census data and vital statistics[see comment]’, British Medical Journal, vol. 320, no. 7239, pp. 898–902.

Extended Medicare Safety Net (EMSN) Review RepoRt 2009
80
Savage, E, Jones, G 2004, ‘An analysis of the General Practice Access Scheme on GP incomes, bulk billing and consumer co-payments’, Australian Economic Review, vol. 37, pp.31–40.
Scotton, R 1998, ‘The doctor business’, in G Mooney & R Scotton (eds), Economics and Australian Health Policy, Allen and Unwin, Sydney.
Senate Select Committee on Medicare Australia 2004, Second Report: Medicare Plus: the future for Medicare? Canberra.
Treasury 2009, Tax expenditures statement 2008, Australian Government Publishing Service, Canberra.
Trendle, B 2005, ‘Sources of regional income inequality: an examination of small regions in Queensland’, Review of Urban and Regional Development Studies, vol. 17, no. 1, pp. 35–50.
Van de Voorde, C, van Doorslaer, E & Schokkaert, E 2001, ‘Effects of cost sharing on physician utilization under favourable conditions for supplier-induced demand’, Health Economics, vol. 10, no. 5, pp. 457–71.
Van Doorslaer, E, Clarke, P, Savage, E & Hall, J 2007, ‘Horizontal inequities in Australia’s mixed public/private health care system’, Health Policy, vol. 86, no. 1, pp. 97–108.
Wagstaff, A & van Doorslaer, E 2000, ‘Equity in health care finance and delivery’, in A Culyer & J Newhouse (eds), Handbook of Health Economics, Elsevier, Amsterdam, vol. 1B.
Wilkinson, RG 1997, ‘Socioeconomic determinants of health. Health inequalities: relative or absolute material standards?’ British Medical Journal, vol. 314, no. 7080, pp. 591–5.
Wong, MD, Andersen, R, Sherbourne, CD, Hays, RD & Shapiro, MF 2001, ‘Effects of cost sharing on care seeking and health status: results from the Medical Outcomes Study’, American Journal of Public Health, vol. 91, no. 11, pp. 1889–94.
Young, AF & Dobson, AJ 2003, ‘The decline in bulk-billing and increase in out-of-pocket costs for general practice consultations in rural areas of Australia, 1995–2001’, Medical Journal of Australia, vol. 178, no. 3, pp. 122–6.
Young, AF, Dobson, AJ & Byles, JE 2000, ‘Access and equity in the provision of general practitioner services for women in Australia’, Australian and New Zealand Journal of Public Health, vol. 24, no. 5, pp. 474–80.
2001, ‘Determinants of general practitioner use among women in Australia’, Social Science and Medicine, vol. 53, no. 12, pp. 1641–51.