Exposure to Pro-Tobacco Marketing and …...January 2011 Exposure to Pro-Tobacco Marketing and...
31
January 2011 Exposure to Pro-Tobacco Marketing and Promotions among New Yorkers Topical Report Prepared for New York State Department of Health Corning Tower, Room 710 Albany, NY 12237-0676 Prepared by Brett Loomis Quynh Nguyen Annice Kim RTI International 3040 Cornwallis Road Research Triangle Park, NC 27709 RTI Project Number 0211568.003.016
Transcript of Exposure to Pro-Tobacco Marketing and …...January 2011 Exposure to Pro-Tobacco Marketing and...
January 2011
Exposure to Pro-Tobacco Marketing and Promotions among
New Yorkers
Topical Report
Prepared for
New York State Department of Health Corning Tower, Room 710
Albany, NY 12237-0676
Prepared by
Brett Loomis Quynh Nguyen
Annice Kim RTI International
3040 Cornwallis Road Research Triangle Park, NC 27709
RTI Project Number 0211568.003.016


iii
January 2011
Exposure to Pro-Tobacco Marketing and Promotions among
New Yorkers
Prepared for
New York State Department of Health Corning Tower, Room 710
Albany, NY 12237-0676
Prepared by
Brett Loomis Quynh Nguyen
Annice Kim RTI International
3040 Cornwallis Road Research Triangle Park, NC 27709
RTI Project Number 0211568.003.016
iv
Contents
Section Page
Introduction ............................................................................................................ 1
Methods and Data ................................................................................................... 3
Methods ............................................................................................................ 3
Data ................................................................................................................. 4
Licensed Tobacco Retailers ........................................................................... 4
Retail Advertising Tobacco Study ................................................................... 4
New York Adult Tobacco Survey .................................................................... 4
National Adult Tobacco Survey ...................................................................... 5
New York Youth Tobacco Survey ................................................................... 5
The Extent of Pro-Tobacco Advertising and Promotions in New York ...................... 6
Exposure to Tobacco Advertising and Use of Promotions among Adults and Youth .................................................................................................................... 13
Adults ............................................................................................................. 13
Youth .............................................................................................................. 17
Conclusions ........................................................................................................... 23
References .......................................................................................................... R-1

v
Figures
Number Page
1. Number of Licensed Tobacco Retailers, 2000–2009, New York State Department of Tax and Finance ....................................................................... 7
2. Percentage of Retailers with Any Exterior Cigarette Advertising, RATS 2004–2009 ............................................................................................................ 8
3. Percentage of Retailers with Any Interior Cigarette Advertising, RATS 2004–2009 ............................................................................................................ 8
4. Average Number of Exterior Cigarette Advertisements, RATS 2004–2009 ............. 9
5. Average Number of Interior Cigarette Advertisements, RATS 2004–2009 ............ 10
6. Percentage of Retailers with Price-Reducing Promotions, RATS 2004–2009 ......... 10
7. Average Number of Price-Reducing Cigarette Promotions Per Store, RATS 2004–2009 ................................................................................................. 11
8. Percentage of Retailers with Tobacco Advertisements or Products at Children’s Eye-Level or near Candy or Toys, RATS 2004–2009 .......................... 12
9. Percentage of Current Smokers and Recent Quitters Who Received Promotional Items in the Mail from Tobacco Companies, NY-ATS 2005–2009 and NATS 2009 ........................................................................................... 13
10. Percentage of Current Smokers and Recent Quitters Who Received Electronic Mail from Companies Trying to Sell Cigarettes, NY-ATS 2005–2009 and NATS 2009 ................................................................................... 14
11. Percentage of Current Smokers Who Received Special Price Offers for Cigarettes in the Past 30 Days, NY-ATS 2004–2009 and NATS 2009 .................. 14
12. Percentage of Adults Who Noticed Tobacco Advertising Almost Every Time or Frequently in Convenience Stores in the Past 30 Days, NY-ATS 2009 and NATS 2009 ................................................................................................. 16
13. Percentage of Adults Who Noticed Tobacco Advertising Almost Every Time or Frequently in Grocery Stores in the Past 30 Days, NY-ATS 2009 and NATS 2009 ................................................................................................. 16
14. Percentage of Adults Who Noticed Tobacco Advertising Almost Every Time or Frequently in Pharmacies in the Past 30 Days, NY-ATS 2009 and NATS 2009 .......................................................................................................... 17
15. Percentage of Youth Who Reported Seeing Tobacco Advertising in Retail Stores in the Past 30 Days, NY-YTS 2000–2008 .............................................. 18
16. Percentage of Youth Who Reported Seeing Ads for Tobacco Products When Using the Internet in the Past 30 Days, NY-YTS 2000–2008 .............................. 18
17. Percentage of Youth Who Reported Seeing Ads for Tobacco Products at Festivals, Fairs, Parades, or Concerts, NY-YTS 2006 and 2008 ........................... 19
18. Percentage of Youth Who Reported Seeing Ads for Tobacco Products When Reading Newspapers or Magazines, NY-YTS 2000–2008 ................................... 20
19. Percentage of Youth Who Reported Buying/Receiving Anything With a Tobacco Company Name or Picture On It, NY-YTS 2000–2008 ........................... 20

vi
Tables
Number Page
1. Domestic Cigarette Advertising and Promotional Expenditures, 2002–2006 (in thousands of dollars), Federal Trade Commission .......................................... 1
2. Number (Percentage) of Licensed Tobacco Retailers by New York Tobacco Control Program Region, 2000–2009 ................................................................ 7
3. Regression Results for Youth Pro-Tobacco Marketing Exposure Outcomes, NY-YTS 2000–2008, Odds Ratio (95% Confidence Interval) .............................. 21
1
Introduction
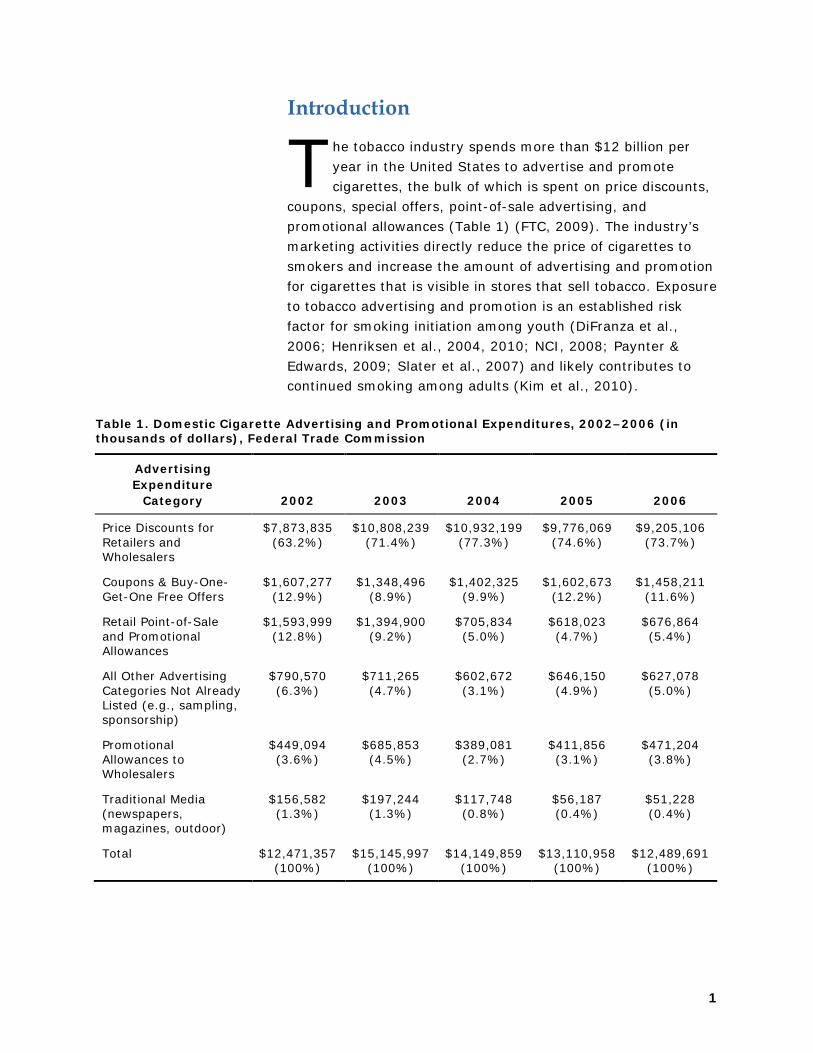
he tobacco industry spends more than $12 billion per year in the United States to advertise and promote cigarettes, the bulk of which is spent on price discounts,
coupons, special offers, point-of-sale advertising, and promotional allowances (Table 1) (FTC, 2009). The industry’s marketing activities directly reduce the price of cigarettes to smokers and increase the amount of advertising and promotion for cigarettes that is visible in stores that sell tobacco. Exposure to tobacco advertising and promotion is an established risk factor for smoking initiation among youth (DiFranza et al., 2006; Henriksen et al., 2004, 2010; NCI, 2008; Paynter & Edwards, 2009; Slater et al., 2007) and likely contributes to continued smoking among adults (Kim et al., 2010).
Table 1. Domestic Cigarette Advertising and Promotional Expenditures, 2002–2006 (in thousands of dollars), Federal Trade Commission
Advertising Expenditure
Category 2002 2003 2004 2005 2006
Price Discounts for Retailers and Wholesalers
$7,873,835 (63.2%)
$10,808,239 (71.4%)
$10,932,199 (77.3%)
$9,776,069 (74.6%)
$9,205,106 (73.7%)
Coupons & Buy-One-Get-One Free Offers
$1,607,277 (12.9%)
$1,348,496 (8.9%)
$1,402,325 (9.9%)
$1,602,673 (12.2%)
$1,458,211 (11.6%)
Retail Point-of-Sale and Promotional Allowances
$1,593,999 (12.8%)
$1,394,900 (9.2%)
$705,834 (5.0%)
$618,023 (4.7%)
$676,864 (5.4%)
All Other Advertising Categories Not Already Listed (e.g., sampling, sponsorship)
$790,570 (6.3%)
$711,265 (4.7%)
$602,672 (3.1%)
$646,150 (4.9%)
$627,078 (5.0%)
Promotional Allowances to Wholesalers
$449,094 (3.6%)
$685,853 (4.5%)
$389,081 (2.7%)
$411,856 (3.1%)
$471,204 (3.8%)
Traditional Media (newspapers, magazines, outdoor)
$156,582 (1.3%)
$197,244 (1.3%)
$117,748 (0.8%)
$56,187 (0.4%)
$51,228 (0.4%)
Total $12,471,357 (100%)
$15,145,997 (100%)
$14,149,859 (100%)
$13,110,958 (100%)
$12,489,691 (100%)
T

Exposure to Pro-Tobacco Marketing and Promotions among New Yorkers
2
Because of the risks posed by exposure to tobacco advertising, wherever it appears, we used established monitoring systems and population surveys to document the extent of tobacco advertising in New York and self-reported exposure to tobacco advertising among adults and youth living in New York. This report is one in a series of reports produced for the New York State Department of Health that examine the relationship between exposure to point-of-sale advertising and smoking-related attitudes, intentions, and behaviors among adults and youth.

Exposure to Pro-Tobacco Marketing and Promotions among New Yorkers
3
Methods and Data
Methods
o describe the extent of tobacco advertising and promotion activities in New York, we examined the trend in the number and types of licensed tobacco retailers
(LTRs) in New York and used the Retail Advertising Tobacco Study (RATS) to describe the level of tobacco advertising and promotional activities in those stores. We present trends in the prevalence of interior and exterior cigarette advertising, price promotions, and cigarette ads or products at child’s eye-level or near candy or toys. Among retailers that have any advertising, we estimated the average number of advertisements and promotions present. We tested for significant increases or decreases over time in the prevalence and number of advertisements and promotions.
To assess New Yorkers’ self-reported exposure to tobacco advertisements and promotions, we analyzed the New York Adult Tobacco Survey (NY-ATS) and the New York Youth Tobacco Survey (NY-YTS). Using the NY-ATS, we estimated the trend in the prevalence of those who received promotional items in the mail or through e-mail and who used special price discounts when they purchased cigarettes. We estimated the percentage of adults who recalled seeing tobacco advertising in grocery stores, convenience stores, and pharmacies. We present trends in these outcomes and compare New York with the rest of the United States in 2009 using the National Adult Tobacco Survey (NATS). We modeled these outcomes using regression analysis to identify smokers who are more likely to receive tobacco advertising and promotions and to recall seeing advertising at the point of sale.
Using the NY-YTS, we estimated the prevalence of youth who recall seeing tobacco advertising in the past 30 days on the Internet, at events such as fairs and concerts, in newspapers or magazines, and in retail stores, and those buying or receiving any product with a tobacco company’s name or picture on it. Using regression analysis, we modeled these outcomes to identify youth who are more likely to recall seeing ads and to use a product with a tobacco logo.
T

Exposure to Pro-Tobacco Marketing and Promotions among New Yorkers
4
Data
Licensed Tobacco Retailers
Any business that wants to sell tobacco in New York must obtain a license from the New York State Department of Taxation and Finance. This license is renewed annually. RTI obtained the list of LTRs from 2000 through 2009. The list provides the retailers’ legal and operating names and mailing and facility addresses, including street address, zip code, and county.
RTI employed a multistage process to clean the list of LTRs, including maintaining name conformity and assigning an outlet type (e.g., pharmacy, convenience store, grocery store). From 2003, there are approximately 22,000 to 25,000 tobacco retailers each year.
Retail Advertising Tobacco Study
RATS is an on-site audit of selected LTRs in New York in which trained data collectors record the number and placement of tobacco advertising and price promotions. RTI began collecting data for RATS in 2004 and has conducted the survey every year since. RATS is composed of a stratified random sample of all LTRs and includes between 4% and 13% of all LTRs in the state.
New York Adult Tobacco Survey
NY-ATS is a survey of representative households, which randomly selects one adult in each responding household in New York. The sample includes list-assisted random-digit-dial and directory-listed numbers. The survey is conducted using computer-assisted telephone interviews and includes items that measure exposure to tobacco advertising and promotion, attitudes and beliefs about tobacco, and perceptions of pro- and antitobacco advertising. Starting in the third quarter of 2003, approximately 2,000 NY-ATS telephone interviews have been completed each quarter, or about 8,000 interviews per year.
Exposure to Pro-Tobacco Marketing and Promotions among New Yorkers
5
National Adult Tobacco Survey
Similar to the NY-ATS, NATS also uses random-digit-dialing and is fielded quarterly to adults aged 18 or older. The survey is conducted using computer-assisted telephone interviews and includes items that measure recollection of exposure to tobacco or antitobacco advertising, perception of risk related to tobacco use, purchasing behavior, and cessation attempt behavior among adult smokers. Since the fourth quarter of 2007, approximately 1,000 telephone interviews have been completed each quarter.
New York Youth Tobacco Survey
NY-YTS is a biennial survey, representative of middle school and high school students in New York. The survey is conducted using a multistage probability proportional to size sampling method to select middle schools and high schools based on their size and region. Within each of these selected schools, various methods were used to randomly select certain classes to participate. Each student in these selected classes is then asked to complete the survey. From 2000 to 2006, nearly 100 schools and approximately 7,000 students participated each year. In 2008, the sample size was increased to 400 schools and more than 40,000 students.

Exposure to Pro-Tobacco Marketing and Promotions among New Yorkers
6
The Extent of Pro-Tobacco Advertising and Promotions in New York
he tobacco industry spends the overwhelming majority of its marketing budget on programs to reduce the price of cigarettes to smokers and to advertise at the point of
sale. Stores that sell tobacco are therefore the most important channel for advertising and promotion still open to the tobacco industry in the United States. In this section, we describe the extent of pro-tobacco advertising in retail stores in New York, including the number of LTRs and the level of cigarette advertising in those stores. While declining overall, the number of LTRs in New York is large, with nearly 23,000 stores that sell tobacco in 2009, and cigarette advertising in these stores is widespread.
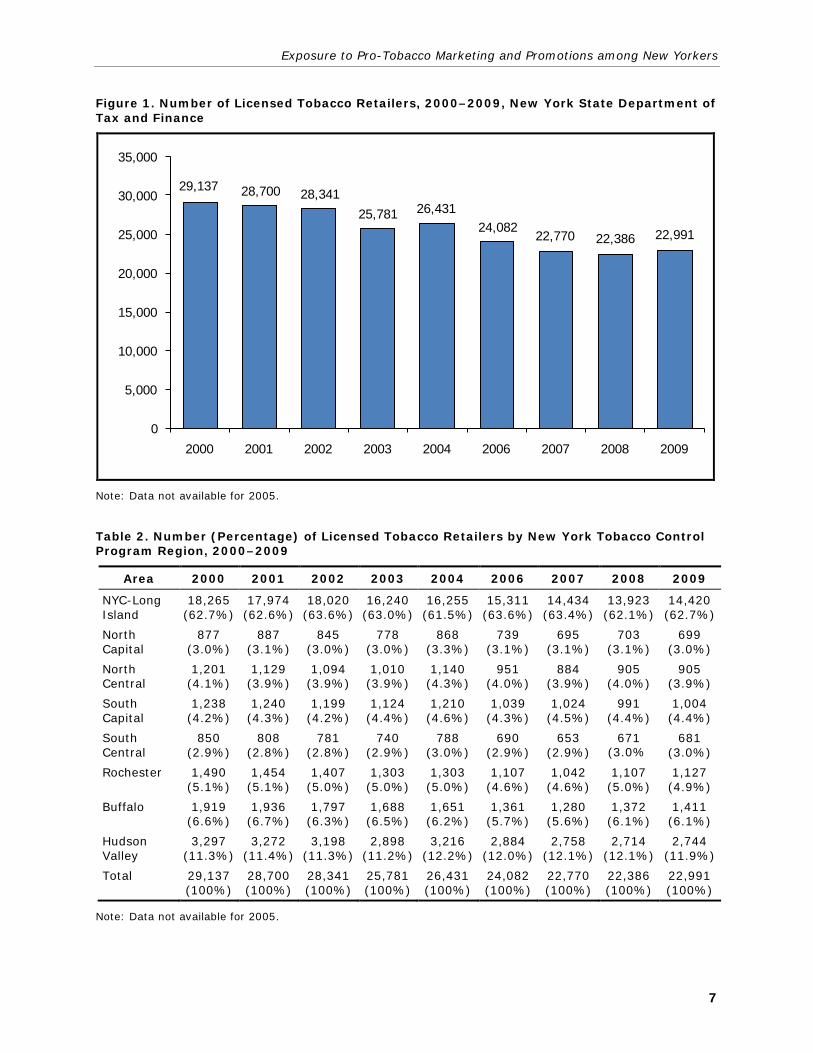
The number of retailers in New York has declined steadily over the past decade (Figure 1). In 2000, there were 29,137 LTRs compared with only 22,991 in 2009, a decrease of 21%. The number of LTRs has been declining steadily, on average by 682, or about 2.5%, per year.
The New York Tobacco Control Program divides the state into eight regions (Table 2). Among these regions, approximately 63% of all LTRs in New York State are located in the New York City and Long Island area, and approximately 12% are in Hudson Valley (Table 2). The decline in the number of LTRs appears to be occurring uniformly in all areas of New York, with each region of the state having very nearly the same proportion of LTRs in 2009 as it did in 2000.
In 2009, 59.1% of retailers had exterior advertising, down from 64.3% in 2008 (Figure 2). Despite the drop in 2009, there is a statistically significant upward trend for retailers with exterior cigarette advertising from 2004 to 2009. The percentage of retailers with interior cigarette advertising has remained nearly constant from 2004 to 2009 (Figure 3), with nearly 95% of all LTRs in New York having interior advertising.
T
Exposure to Pro-Tobacco Marketing and Promotions among New Yorkers
7
Figure 1. Number of Licensed Tobacco Retailers, 2000–2009, New York State Department of Tax and Finance
29,137 28,700 28,34125,781 26,431
24,08222,770 22,386 22,991
0
5,000
10,000
15,000
20,000
25,000
30,000
35,000
2000 2001 2002 2003 2004 2006 2007 2008 2009
Note: Data not available for 2005.
Table 2. Number (Percentage) of Licensed Tobacco Retailers by New York Tobacco Control Program Region, 2000–2009
Area 2000 2001 2002 2003 2004 2006 2007 2008 2009
NYC-Long Island
18,265 (62.7%)
17,974 (62.6%)
18,020 (63.6%)
16,240 (63.0%)
16,255 (61.5%)
15,311 (63.6%)
14,434 (63.4%)
13,923 (62.1%)
14,420 (62.7%)
North Capital
877 (3.0%)
887 (3.1%)
845 (3.0%)
778 (3.0%)
868 (3.3%)
739 (3.1%)
695 (3.1%)
703 (3.1%)
699 (3.0%)
North Central
1,201 (4.1%)
1,129 (3.9%)
1,094 (3.9%)
1,010 (3.9%)
1,140 (4.3%)
951 (4.0%)
884 (3.9%)
905 (4.0%)
905 (3.9%)
South Capital
1,238 (4.2%)
1,240 (4.3%)
1,199 (4.2%)
1,124 (4.4%)
1,210 (4.6%)
1,039 (4.3%)
1,024 (4.5%)
991 (4.4%)
1,004 (4.4%)
South Central
850 (2.9%)
808 (2.8%)
781 (2.8%)
740 (2.9%)
788 (3.0%)
690 (2.9%)
653 (2.9%)
671 (3.0%
681 (3.0%)
Rochester 1,490 (5.1%)
1,454 (5.1%)
1,407 (5.0%)
1,303 (5.0%)
1,303 (5.0%)
1,107 (4.6%)
1,042 (4.6%)
1,107 (5.0%)
1,127 (4.9%)
Buffalo 1,919 (6.6%)
1,936 (6.7%)
1,797 (6.3%)
1,688 (6.5%)
1,651 (6.2%)
1,361 (5.7%)
1,280 (5.6%)
1,372 (6.1%)
1,411 (6.1%)
Hudson Valley
3,297 (11.3%)
3,272 (11.4%)
3,198 (11.3%)
2,898 (11.2%)
3,216 (12.2%)
2,884 (12.0%)
2,758 (12.1%)
2,714 (12.1%)
2,744 (11.9%)
Total 29,137 (100%)
28,700 (100%)
28,341 (100%)
25,781 (100%)
26,431 (100%)
24,082 (100%)
22,770 (100%)
22,386 (100%)
22,991 (100%)
Note: Data not available for 2005.

Exposure to Pro-Tobacco Marketing and Promotions among New Yorkers
8
Figure 2. Percentage of Retailers with Any Exterior Cigarette Advertising, RATS 2004–2009
53.2% 53.1%59.1%
60.2% 64.3%59.1%
0%
20%
40%
60%
80%
100%
2004 2005 2006 2007 2008 2009
Statistically significant upward trend from 2004 to 2009.
Figure 3. Percentage of Retailers with Any Interior Cigarette Advertising, RATS 2004–2009
94.4% 95.5% 96.8% 96.1% 96.1% 94.7%
0%
20%
40%
60%
80%
100%
2004 2005 2006 2007 2008 2009

Exposure to Pro-Tobacco Marketing and Promotions among New Yorkers
9
In 2009, the average number of exterior cigarette advertisements was 2.5 per store, compared with 2.9 in 2008 (Figure 4). The average number of interior cigarette advertisements per store has been trending upward, from 15.5 in 2004 to 17.5 in 2009 (Figure 5).
In 2009, 70.2% of LTRs in New York had promotions that reduce the price of cigarettes (Figure 6). The majority of stores (65.0%) offer sale-price, or cents-off, reductions (e.g., price reduced by 75¢ per pack), whereas a small minority of stores (5.3%) offer buy-one-get-one-free deals, mail-in rebates, coupons, and free gifts. While the trend for all types of price reducing promotions significantly decreased from 2004 to 2009, there was a significant upward trend in the percentage of retailers with sale price promotions.
Figure 4. Average Number of Exterior Cigarette Advertisements, RATS 2004–2009
2.39
3.313.54
3.062.85
2.53
0
1
2
3
4
5
2004 2005 2006 2007 2008 2009

Exposure to Pro-Tobacco Marketing and Promotions among New Yorkers
10
Figure 5. Average Number of Interior Cigarette Advertisements, RATS 2004–2009
15.53
18.2420.18
18.78 18.5217.45
0
5
10
15
20
25
2004 2005 2006 2007 2008 2009
Statistically significant upward trend from 2004 to 2009.
Figure 6. Percentage of Retailers with Price-Reducing Promotions, RATS 2004–2009
16.5% 19.5% 13.5% 11.1%1.8%
5.3%
62.0%
33.7%58.2% 63.4% 75.1% 65.0%
0%
20%
40%
60%
80%
100%
2004 2005 2006 2007 2008 2009
Carton and pack sale price promotions onlyª
78.4%
53.2%
71.6% 74.5% 76.9%70.2%
↓
Price promotions excluding sales priceb
a Statistically significant upward trend from 2004 to 2009. b Statistically significant downward trend from 2004 to 2009.
Note: Price promotions excluding carton and pack sale price include mail-in rebates; coupons; buy-one-get-one-free offers; bundles; and free gifts for Marlboro, Newport, Doral, and cheapest brands.

Exposure to Pro-Tobacco Marketing and Promotions among New Yorkers
11
We estimated the average number of price promotions in stores that have price promotions including and excluding sale price (Figure 7). In 2009, there were 4.4 price-reducing promotions per store, with 2.9 sale price reductions and 1.5 non-sale price promotions, including coupons, buy-one-get-one free offers, and rebates.
Figure 7. Average Number of Price-Reducing Cigarette Promotions Per Store, RATS 2004–2009
1.4 1.8 2.11.4 1.1 1.5
3.6
1.72.2 3.1 3.6 2.9
0
1
2
3
4
5
6
2004 2005 2006 2007 2008 2009
Average number of carton and pack sale price promotions
Average number of price promotions excluding sale
5.0
3.5
4.3 4.54.8
4.4
Note: Price promotions, excluding carton and pack sale price, include mail-in rebates; coupons; buy-one-get-one-free offers; bundles; and free gifts for Marlboro, Newport, Doral, and cheapest brands.
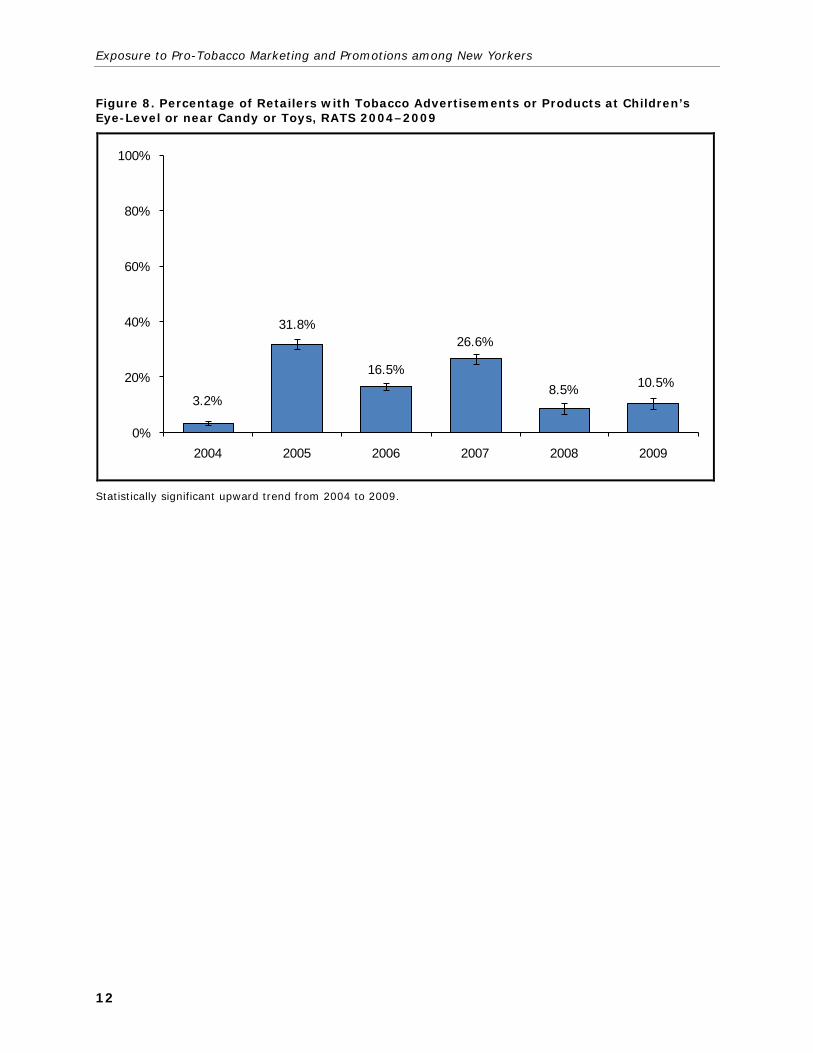
The percentage of retailers with tobacco advertisements or tobacco products at child’s eye-level or near candy or toys has varied considerably in recent years, rising from a low of 3.2% in 2004 to a high of 31.8% of retailers the following year (Figure 8). In 2009, 10.5% of retailers had tobacco advertisements or products in locations where children and youth could see them easily.
Exposure to Pro-Tobacco Marketing and Promotions among New Yorkers
12
Figure 8. Percentage of Retailers with Tobacco Advertisements or Products at Children’s Eye-Level or near Candy or Toys, RATS 2004–2009
3.2%
31.8%
16.5%
26.6%
8.5% 10.5%
0%
20%
40%
60%
80%
100%
2004 2005 2006 2007 2008 2009
Statistically significant upward trend from 2004 to 2009.

Exposure to Pro-Tobacco Marketing and Promotions among New Yorkers
13
Exposure to Tobacco Advertising and Use of Promotions among Adults and Youth
Adults
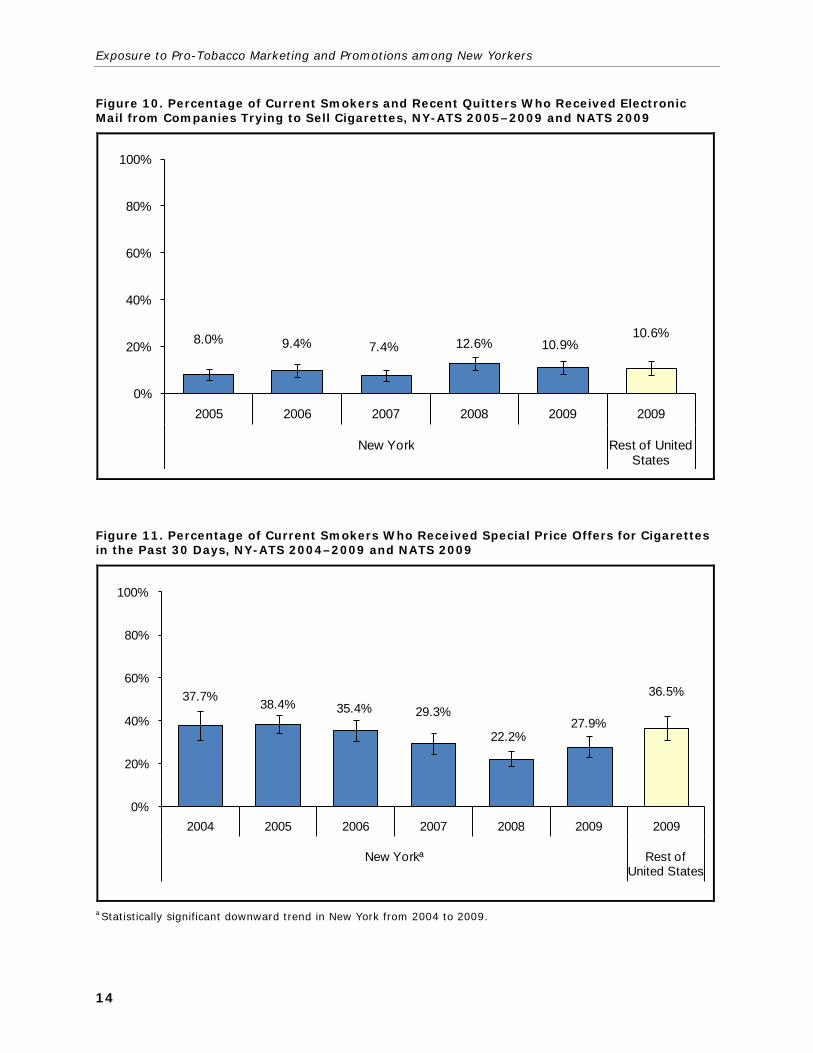
Among current smokers and recent quitters (those who quit smoking within the past 12 months), 36.4% reported receiving promotional items in the mail from tobacco companies, compared with 44.1% in the rest of the United States in 2009, a statistically significant difference (Figure 9). In 2009, 10.9% of current smokers and recent quitters in New York and 10.6% in the rest of the United States reported receiving electronic mail from companies trying to sell cigarettes (Figure 10).
The percentage of current smokers who received special price offers for cigarettes decreased significantly from 2004 to 2009 (Figure 11). In 2009, approximately 27.9% of current smokers in New York reported receiving special price offers for cigarettes, such as discounted price or multipack discounts, compared with 36.5% in the rest of the United States.
Figure 9. Percentage of Current Smokers and Recent Quitters Who Received Promotional Items in the Mail from Tobacco Companies, NY-ATS 2005–2009 and NATS 2009
40.5% 42.0%35.0% 39.2% 36.4%
44.1%
0%
20%
40%
60%
80%
100%
2005 2006 2007 2008 2009 2009
New York Rest of United Statesª
a The difference between New York and the rest of the United States in 2009 is statistically significant.
Exposure to Pro-Tobacco Marketing and Promotions among New Yorkers
14
Figure 10. Percentage of Current Smokers and Recent Quitters Who Received Electronic Mail from Companies Trying to Sell Cigarettes, NY-ATS 2005–2009 and NATS 2009
8.0% 9.4% 7.4% 12.6% 10.9%10.6%
0%
20%
40%
60%
80%
100%
2005 2006 2007 2008 2009 2009
New York Rest of United States
Figure 11. Percentage of Current Smokers Who Received Special Price Offers for Cigarettes in the Past 30 Days, NY-ATS 2004–2009 and NATS 2009
37.7% 38.4% 35.4% 29.3%
22.2%27.9%
36.5%
0%
20%
40%
60%
80%
100%
2004 2005 2006 2007 2008 2009 2009
New Yorkª Rest of United States
a Statistically significant downward trend in New York from 2004 to 2009.
Exposure to Pro-Tobacco Marketing and Promotions among New Yorkers
15
In New York, 48.7% of adults reported seeing tobacco advertising in convenience stores in the past 30 days, compared with 55.8% in the rest of the United States in 2009, a statistically significant difference (Figure 12). Among nonsmokers, 45.7% of New Yorkers reported noticing tobacco advertising almost every time or frequently in convenience stores compared with 53.0% in the rest of the United States.
While almost half of adult New Yorkers reported seeing tobacco advertising in convenience stores in the past 30 days, less than 20% of adults in New York recalled seeing tobacco advertising in grocery stores (Figure 13). In 2009, approximately 19.4% of adults in New York and the rest of the United States recalled seeing tobacco advertising almost every time or frequently in grocery stores.
Approximately 9.0% of adult New Yorkers reported seeing tobacco advertising almost every time or frequently in pharmacies in the past 30 days, compared with 5.5% of adults in the rest of the United States, a statistically significant difference (Figure 14). Among nonsmokers in 2009, 8.0% of adults in New York reported seeing tobacco ads in pharmacies, compared with 3.7% of adults in the rest of the United States, a statistically significant difference.

Exposure to Pro-Tobacco Marketing and Promotions among New Yorkers
16
Figure 12. Percentage of Adults Who Noticed Tobacco Advertising Almost Every Time or Frequently in Convenience Stores in the Past 30 Days, NY-ATS 2009 and NATS 2009
48.7%55.8%
45.7%53.0%
66.5% 68.2%
0%
20%
40%
60%
80%
100%
2009 2009
New York Rest of United States
Overallª Nonsmokersª Smokers
a In 2009, the difference between New York and the rest of the United States is statistically significant.
Figure 13. Percentage of Adults Who Noticed Tobacco Advertising Almost Every Time or Frequently in Grocery Stores in the Past 30 Days, NY-ATS 2009 and NATS 2009
19.4% 19.4%18.1% 16.6%
26.4%32.0%
0%
20%
40%
60%
80%
100%
2009 2009
New York Rest of United States
Overall Nonsmokers Smokers

Exposure to Pro-Tobacco Marketing and Promotions among New Yorkers
17
Figure 14. Percentage of Adults Who Noticed Tobacco Advertising Almost Every Time or Frequently in Pharmacies in the Past 30 Days, NY-ATS 2009 and NATS 2009
9.3%5.5%8.0%
3.7%
17.1% 12.9%
0%
20%
40%
60%
80%
100%
2009 2009
New York Rest of United States
Overallª Nonsmokersª Smokers
a In 2009, the difference between New York and the rest of the United States is statistically significant.
Youth
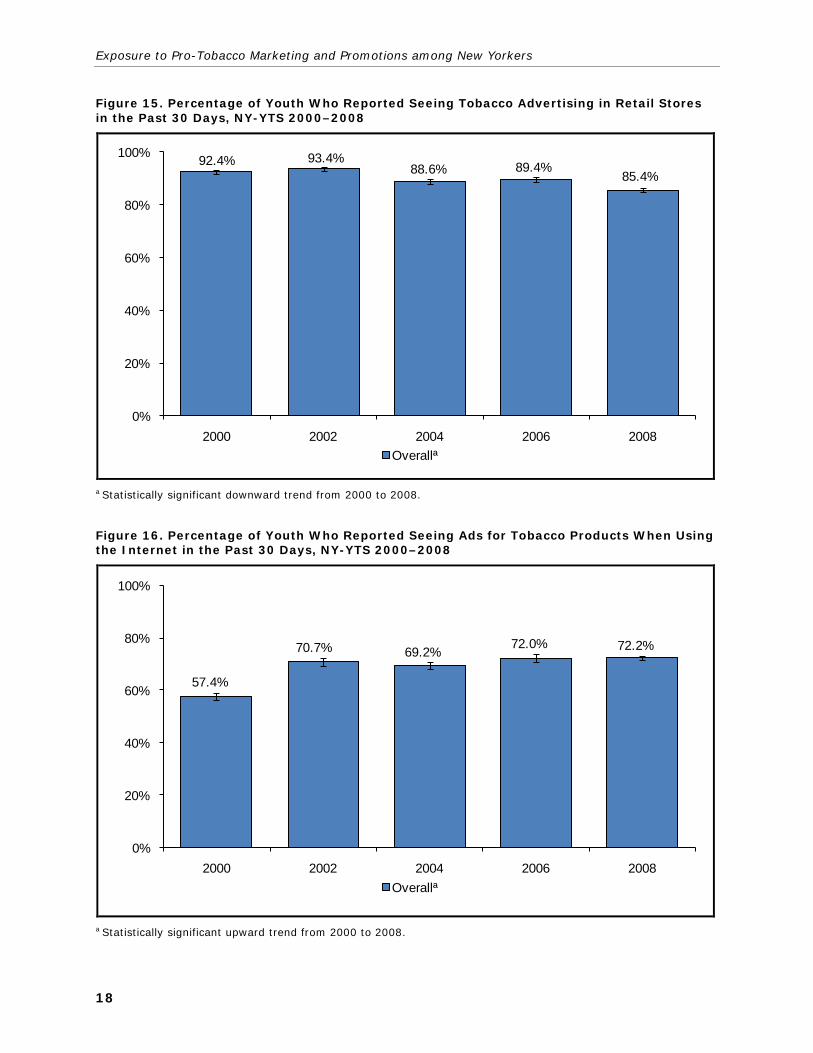
To assess self-reported exposure to tobacco advertising and promotions among youth (those younger than 18 years old), we analyzed the NY-YTS. In 2008, 85.4% of youth in New York reported seeing tobacco advertising in retail stores in the past 30 days (Figure 15). While high, the trend in recall of tobacco advertising in stores has declined significantly from 2000. The percentage of youth who reported seeing tobacco ads on the Internet increased significantly from 57.4% in 2000 to 72.2% in 2008 (Figure 16). There were no differences between smokers and nonsmokers of recall of advertising in retail stores and on the Internet.
Exposure to Pro-Tobacco Marketing and Promotions among New Yorkers
18
Figure 15. Percentage of Youth Who Reported Seeing Tobacco Advertising in Retail Stores in the Past 30 Days, NY-YTS 2000–2008
92.4% 93.4%88.6% 89.4%
85.4%
0%
20%
40%
60%
80%
100%
2000 2002 2004 2006 2008Overallª
a Statistically significant downward trend from 2000 to 2008.
Figure 16. Percentage of Youth Who Reported Seeing Ads for Tobacco Products When Using the Internet in the Past 30 Days, NY-YTS 2000–2008
57.4%
70.7% 69.2% 72.0% 72.2%
0%
20%
40%
60%
80%
100%
2000 2002 2004 2006 2008Overallª
a Statistically significant upward trend from 2000 to 2008.

Exposure to Pro-Tobacco Marketing and Promotions among New Yorkers
19
A majority of New York youth reported seeing advertisements for tobacco products at festivals, fairs, parades, or concerts (Figure 17). In 2008, 77.4% of youth smokers reported seeing ads for tobacco products at festivals and other events. The overall number of youth and nonsmokers in New York who reported seeing tobacco ads significantly decreased from 2006 to 2008.
Figure 17. Percentage of Youth Who Reported Seeing Ads for Tobacco Products at Festivals, Fairs, Parades, or Concerts, NY-YTS 2006 and 2008
70.9% 68.0%70.5% 67.6%
77.8% 77.4%
0%
20%
40%
60%
80%
100%
2006 2008Overallª Nonsmokersª Smokers
a Statistically significant downward trend from 2006 to 2008.
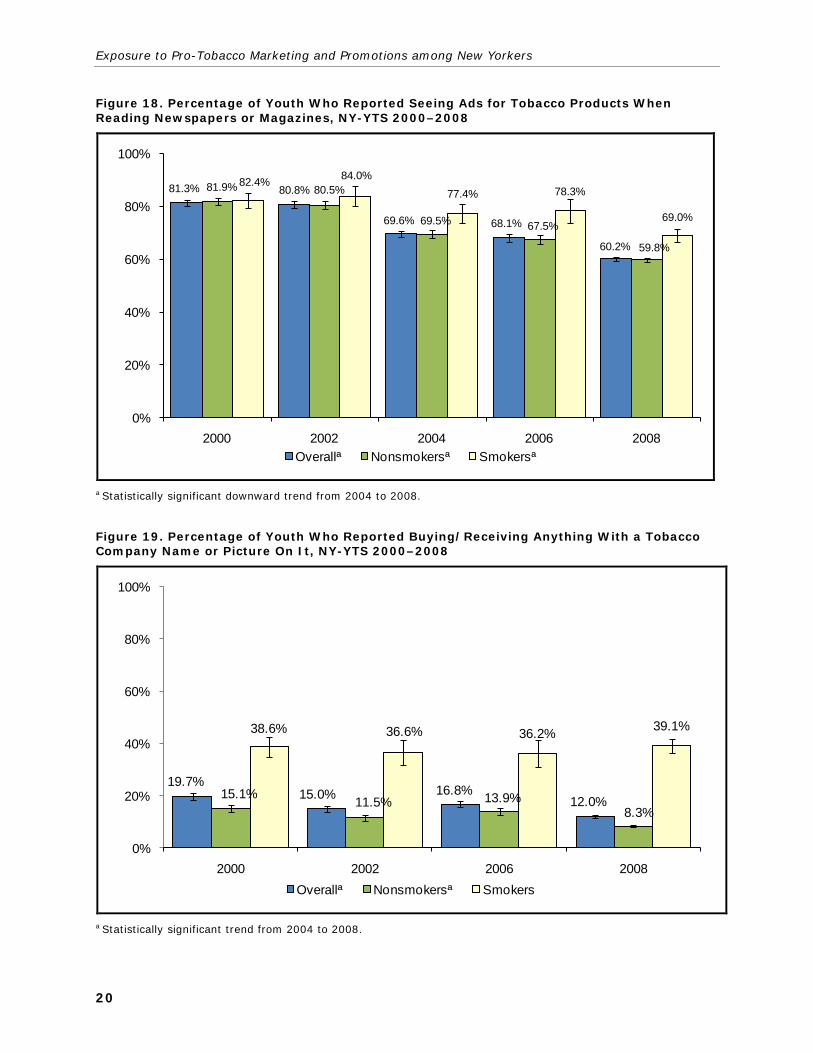
In New York, 60.2% of youth reported seeing tobacco ads when reading newspapers or magazines (Figure 18), down significantly from 81.3% in 2000. Recall of tobacco ads in print materials is consistently higher for youth who smoke than for youth who do not smoke. In addition, exposure to tobacco ads in print appears to be declining more slowly for smokers than for nonsmokers.
In 2008, 39.1% of youth smokers reported buying or receiving an item with a tobacco company name or picture on it (Figure 19). Owning tobacco branded gear is much more prevalent among smokers than among nonsmokers, but just over 8% of nonsmoking youth in New York own such items.
Exposure to Pro-Tobacco Marketing and Promotions among New Yorkers
20
Figure 18. Percentage of Youth Who Reported Seeing Ads for Tobacco Products When Reading Newspapers or Magazines, NY-YTS 2000–2008
81.3% 80.8%
69.6% 68.1%
60.2%
81.9% 80.5%
69.5% 67.5%
59.8%
82.4% 84.0%
77.4% 78.3%
69.0%
0%
20%
40%
60%
80%
100%
2000 2002 2004 2006 2008Overallª Nonsmokersª Smokersª
a Statistically significant downward trend from 2004 to 2008.
Figure 19. Percentage of Youth Who Reported Buying/Receiving Anything With a Tobacco Company Name or Picture On It, NY-YTS 2000–2008
19.7%15.0% 16.8%
12.0%15.1% 11.5% 13.9%8.3%
38.6% 36.6% 36.2% 39.1%
0%
20%
40%
60%
80%
100%
2000 2002 2006 2008Overallª Nonsmokersª Smokers
a Statistically significant trend from 2004 to 2008.

Exposure to Pro-Tobacco Marketing and Promotions among New Yorkers
21
Regression models were developed to estimate differences in self-reported exposure to pro-tobacco marketing among youth by smoking status, school level, sex, and race/ethnicity (Table 3). Nonsmoking youth are just as likely as smokers to recall seeing ads in retail stores, whereas smokers are more likely to recall seeing ads on the Internet; at festivals, fairs, and concerts; and in newspapers and magazines. Smokers are 4 times more likely than nonsmokers to own a tobacco branded object.
Table 3. Odds Ratio (95% Confidence Interval) Regression Results for Youth Pro-Tobacco Marketing Exposure Outcomes, NY-YTS 2000–2008
Explanatory Variable
See Ads in Retail Stores
See Ads on the Internet
See Ads at Festivals
and Concertsa
See Ads in Newspapers
and Magazines
Own Tobacco Branded
Gearb
Smoking Status
Nonsmoker 1.0 1.0 1.0 1.0 1.0
Current smoker 1.01 (0.90–1.14)
1.22*** (1.12–1.33)
1.61*** (1.42–1.82)
1.16*** (1.06–1.26)
4.06*** (3.66–4.51)
School Level
Middle school 1.0 1.0 1.0 1.0 1.0
High school 1.37*** (1.28–1.46)
0.92*** (0.87–0.97)
1.23*** (1.14–1.33)
1.65*** (1.57–1.75)
1.07 (0.98–1.17)
Sex
Female 1.0 1.0 1.0 1.0 1.0
Male 0.70 (0.66–0.75)
0.91*** (0.86–0.96)
0.93** (0.86–1.00)
0.72*** (0.69–0.76)
1.35*** (1.24–1.47)
Race/Ethnicity
White 1.0 1.0 1.0 1.0 1.0
African American 0.50*** (0.46–0.55)
1.07* (0.99–1.15)
0.86*** (0.78–0.95)
0.90*** (0.84–0.96)
0.91 (0.81–1.02)
Hispanic 0.51 (0.47–0.55)
1.09*** (1.02–1.17)
0.98 (0.90–1.06)
0.92*** (0.86–0.98)
1.02 (0.92–1.13)
Asian 0.59*** (0.52–0.66)
1.13** (1.03–1.25)
0.77*** (0.67–0.89)
0.78*** (0.70–0.85)
0.94 (0.80–1.10)
Other 0.51*** (0.39–0.68)
1.00 (0.78–1.29)
1.05 (0.77–1.45)
0.85 (0.67–1.08)
1.32 (0.91–1.92)
a This question was asked only in 2006 and 2008. b This question was not asked in 2004. All models also included indicators for survey year.
* p < 0.10, ** p < 0.05, *** p < 0.01.

Exposure to Pro-Tobacco Marketing and Promotions among New Yorkers
22
In general, high school students are more likely to report exposure to pro-tobacco advertising than are middle school students, with the exception of seeing ads on the Internet. Females are somewhat more likely than males to report seeing ads, but males are more likely to own a piece of tobacco branded gear. Whites are more likely to report exposure to all types of pro-tobacco advertising except for Internet ads and tobacco branded gear.
Exposure to Pro-Tobacco Marketing and Promotions among New Yorkers
23
Conclusions
outh experimentation with cigarettes and progression to established smoking is a constant concern for the tobacco control community. In addition, the number of
adults who successfully quit smoking is low compared with the number who would like to quit. Extensive, persuasive tobacco advertising plays an important role in perpetuating the smoking problem in New York and nationwide. This report used several different data sources to show that tobacco advertising and promotion is widespread in New York retail stores, and a majority of New York youth and adults are exposed. While the number of stores that sell tobacco has fallen by more than 20% in the past 10 years, there were almost 23,000 LTRs in New York in 2009. The vast majority of stores that sell tobacco in New York have tobacco advertising and promotions in them:
59.1% of stores have exterior advertising, with an average of 2.5 ads per store.
94.7% of stores have interior advertising, with an average of 17.5 ads per store.
70.2% of stores offer a price promotion, with an average of 4.4 promotions per store.
10.5% of stores have tobacco advertisements or products at the eye-level of a child or near candy.
Adults and youth in New York report seeing this retail tobacco advertising in high numbers:
66.5% of adult smokers recall seeing tobacco ads in convenience stores, 26.4% in grocery stores, and 17.1% in pharmacies.
89.0% of youth smokers recall seeing tobacco ads in any store.
Other forms of tobacco advertising are also prevalent in New York and affect adults and youth:
Among adult smokers,
– 36.4% receive promotional items in the mail from tobacco companies,
– 27.9% receive special price discounts, and
– 10.9% receive e-mail from tobacco companies trying to sell cigarettes.
Y

Exposure to Pro-Tobacco Marketing and Promotions among New Yorkers
24
Among youth,
– 72.2% report seeing tobacco advertising on the Internet;
– 68.0% report seeing tobacco advertising at fairs, festivals, and concerts;
– 60.2% report seeing tobacco advertising in newspapers and magazines; and
– 39.1% of youth smokers own a tobacco branded object.
– Nonsmoking youth are just as likely as youth who smoke to report seeing tobacco advertising in stores.
– Youth who smoke are more likely than nonsmoking youth to report seeing ads in newspapers and magazines, at festivals and concerts, and to own a tobacco branded object.
This report examined exposure to point-of-sale advertising and smoking-related behaviors among adults and youth. The establishment of monitoring systems and use of population surveys will allow us to document the extent of tobacco advertising in New York and to evaluate progress made by New York’s Tobacco Control Program in countering the impact of ubiquitous tobacco marketing.

R-1
References DiFranza, J. R., Wellman, R. J., Sargent, J. D., Weitzman, M.,
Hipple, B. J., & Winickoff, J. P. (2006). Tobacco promotion and the initiation of tobacco use: Assessing the evidence for causality. Pediatrics, 117, e1237–e1248.
Federal Trade Commission (FTC). (2009). Cigarette report for 2006. Available at: http://www.ftc.gov/os/2009/08/ 090812cigarettereport.pdf
Henriksen, L., Feighery, E. C., Wang, Y., & Fortmann, S. P. (2004). Association of retail tobacco marketing with adolescent smoking. American Journal of Public Health, 94, 2081–2083.
Henriksen, L., Schleicher, N. C., Feighery, E. C., & Fortmann, S. P. (2010). A longitudinal study of exposure to retail cigarette advertising and smoking initiation. Pediatrics, 126, 232–238.
Kim, A., Loomis, B., Busey, A., & Farrelly, M. (2010). Does exposure to pro-tobacco ads and promotions at retail outlets influence smoking attitudes and behaviors among New York adults? Report prepared for the New York State Department of Health. Research Triangle Park, NC: RTI International.
National Cancer Institute (NCI). (2008, June). The role of the media in promoting and reducing tobacco use. Tobacco Control Monograph No. 19. NIH Pub. No. 07-6242. Bethesda, MD: U.S. Department of Health and Human Services, National Institutes of Health, National Cancer Institute.
Paynter, J., & Edwards, R. (2009). The impact of tobacco promotion at the point of sale: A systematic review. Nicotine & Tobacco Research, 11(1), 25–35.
Slater, S. J., Chaloupka, F. J., Wakefield, M., Johnston, L. D., & O’Malley, P. M. (2007). The impact of retail cigarette marketing practices on youth smoking uptake. Archives of Pediatric and Adolescent Medicine, 161, 440–445.