Exposure Levels of Chlorinated Compounds and Metals … · Exposure Levels of Chlorinated Compounds...
30
Exposure Levels of Chlorinated Compounds and Metals in Urban Anglers 2005 Superfund Basic Research Program Annual Meeting Kimberly Morland, Ph.D. Mount Sinai School of Medicine Department of Community and Preventive Medicine
Transcript of Exposure Levels of Chlorinated Compounds and Metals … · Exposure Levels of Chlorinated Compounds...

Exposure Levels of Chlorinated Compounds
and Metals in Urban Anglers
2005 Superfund Basic Research Program Annual Meeting
Kimberly Morland, Ph.D. Mount Sinai School of Medicine Department of
Community and Preventive Medicine

OverviewOverview zz The Lower Hudson River, Newark Bay ComplexThe Lower Hudson River, Newark Bay Complex
and surrounding waters is a complex urban, highlyand surrounding waters is a complex urban, highly industrialized, river system.industrialized, river system.
zz Despite heavy commercial and industrial use, it isDespite heavy commercial and industrial use, it is also used by recreational anglers.also used by recreational anglers.
zz Commercial fishing has been closed in the areas forCommercial fishing has been closed in the areas for many years due to sediment contamination frommany years due to sediment contamination from legal and illegal industrial discharge.legal and illegal industrial discharge.
zz Fish advisories have been in place for about theFish advisories have been in place for about the past 20 years.past 20 years.
BackgroundBackground Fish consumption from the Lower HudsonFish consumption from the Lower Hudson
zzzz MethodsMethods ResultsResults –– 160 people angling at160 people angling at –– 70% reported Hudson River70% reported Hudson River
six locations alongsix locations along was a safe fishing location.was a safe fishing location. Manhattan waterfrontManhattan waterfront –– No posted fish advisory signsNo posted fish advisory signs (May(May--Nov. 1999)Nov. 1999) observedobserved
–– Mostly Latino (64.9%)Mostly Latino (64.9%) –– Averaged fishing 3 times/wk;Averaged fishing 3 times/wk; and Black (27.3%)and Black (27.3%) 6 months/yr6 months/yr
–– Catch 7 fish per outingCatch 7 fish per outing–– Male (97%)Male (97%) –– 75% report take fish home75% report take fish home–– Mean age 46Mean age 46 –– 65.5% eat more than one fish65.5% eat more than one fish –– Annual income <Annual income < meal per monthmeal per month
$25,000 (48%)$25,000 (48%) Ramos AM, Crain EF. Potential health risks of recreational fishing in New York City. Ambulatory Pediatrics
2001;1:252-255.

BackgroundBackground Fish consumption from the Lower HudsonFish consumption from the Lower Hudson
zz MethodsMethods zz ResultsResults –– 267 people angling at267 people angling at –– No ethnic differences inNo ethnic differences in
several locations in Newseveral locations in New fishing or crabbingfishing or crabbing Jersey (MayJersey (May--SeptemberSeptember –– People who both fishedPeople who both fished1999)1999) and crabbed (12%), ateand crabbed (12%), ate
their local catch over 6their local catch over 6 –– 43% White; 23% Black;43% White; 23% Black; times per month.times per month.
21% Latino; 13% Asian21% Latino; 13% Asian –– 30% did not eat catch30% did not eat catch –– Very few reportedVery few reported
angling to obtain foodangling to obtain food Burger J. Consumption patterns and why people fish. Environmental Research 2002;90:125-135.

BackgroundBackground Fish consumption from the East RiverFish consumption from the East River
zz MethodsMethods zz ResultsResults –– Catch between 40Catch between 40--75 fish per75 fish per–– 200 people angling at200 people angling at
week (~9.5 fish per week perweek (~9.5 fish per week perseveral locations alongseveral locations along fafamily memily membmber)er) the East River (Augthe East River (Aug-- –– Blue crab, American eel, blueBlue crab, American eel, blueSeptember 2000)September 2000) fish and striped bass mostfish and striped bass most
–– Mostly Latino and BlackMostly Latino and Black frequently consumedfrequently consumed –– Toxicological tests on fish:Toxicological tests on fish:–– All maleAll male
cadmium, mercury,cadmium, mercury, –– 1616--60 years of age60 years of age chlordane, DDT, dioxins,chlordane, DDT, dioxins,
PCBs, arsenic and lead.PCBs, arsenic and lead.
Corburn J. Combining community-based research and local knowledge to confront asthma and subsistence- fishing hazards in Greenpoint/Williamsburg, Brooklyn, New York. Environmental Health Perspectives 2002;110:241-248.

BackgroundBackground Perception and knowledge of risk from localPerception and knowledge of risk from local
fish consumptionfish consumption zz ResultsResultszz MethodsMethods
–– 47% reported fish from local47% reported fish from local–– 300 anglers along the300 anglers along the waters werewaters were safesafe toto eaea t; 3t; 344%% Newark BayNewark Bay (July(July--Oct.Oct. reported not safe to eat.reported not safe to eat. 1995)1995) –– Response foResponse for ‘Safe tr ‘Safe too eaea t’t’
•• “If the water were polluted“If the water were polluted–– Mostly White (55%);Mostly White (55%); there would be no fish”there would be no fish”
Latino (20%) and BlackLatino (20%) and Black •• “I have been eating them all“I have been eating them all(17%)(17%) of my life and never gottenof my life and never gotten
sick”sick” –– Male (91%)Male (91%) –– 60% aware of fish advisories60% aware of fish advisories –– mean age 46mean age 46 –– Only 1Only 155% co% correctlyrrectly
understood the advisoriesunderstood the advisories Pflug KK, Lurig L, Von Hagen LA, Von Hagen S, Burger J. Urban Anglers’ perceptions of risk from contaminated
fish. The Science of the Total Environment 1999;228:203-218.

Goals and Objectives ofGoals and Objectives of the Urban Anglers Studythe Urban Anglers Study
To determine current bodyTo determine current body burdens of persistent,burdens of persistent, bioaccumulativebioaccumulative environmental pollutantenvironmental pollutants, including PCBs,s, including PCBs, organochlorineorganochlorine pesticidepesticide residues and mercury through a seroresidues and mercury through a serological survey of persons whological survey of persons who consume fish and crabs from theconsume fish and crabs from the estuestuarine waters oarine waters off thethe lower Hulower Hu dsondson RiverRiver
To quantitatively examine associatTo quantitatively examine associations between self reported conions between self reported consumptionsumption of fish and crabs taken from thof fish and crabs taken from the lower Hudson River watershed ane lower Hudson River watershed and bodyd body burdens of persistent pollutantsburdens of persistent pollutants
To determine whether patterns ofTo determine whether patterns of exposure toexposure to persistent pollutanpersistent pollutants diffets differramong persons who consume fish andamong persons who consume fish and crabscrabs from various regions offrom various regions of thethe lower Hudson River watershed withlower Hudson River watershed with differentdifferent known sources and paknown sources and patternstterns of contaminantsof contaminants

Locations of Recruitments for theLocations of Recruitments for the Urban Anglers StudyUrban Anglers Study

Study DescriptionStudy Description zz Enrolled 191 anglers duringEnrolled 191 anglers during
fishing seasons 2001fishing seasons 2001 ––2004.2004.
zz Anglers were recruited fromAnglers were recruited from fishing piers and fishingfishing piers and fishing clubs from the followingclubs from the following locations:locations: Harlem, NY;Harlem, NY; CanarsiCanarsiee Pier in Brooklyn, NY; StatenPier in Brooklyn, NY; StatenIsland, NY; Ridgefield, NJ;Island, NY; Ridgefield, NJ;Englewood NJ; Bayonne, NJ;Englewood NJ; Bayonne, NJ;Elizabeth, NJElizabeth, NJ
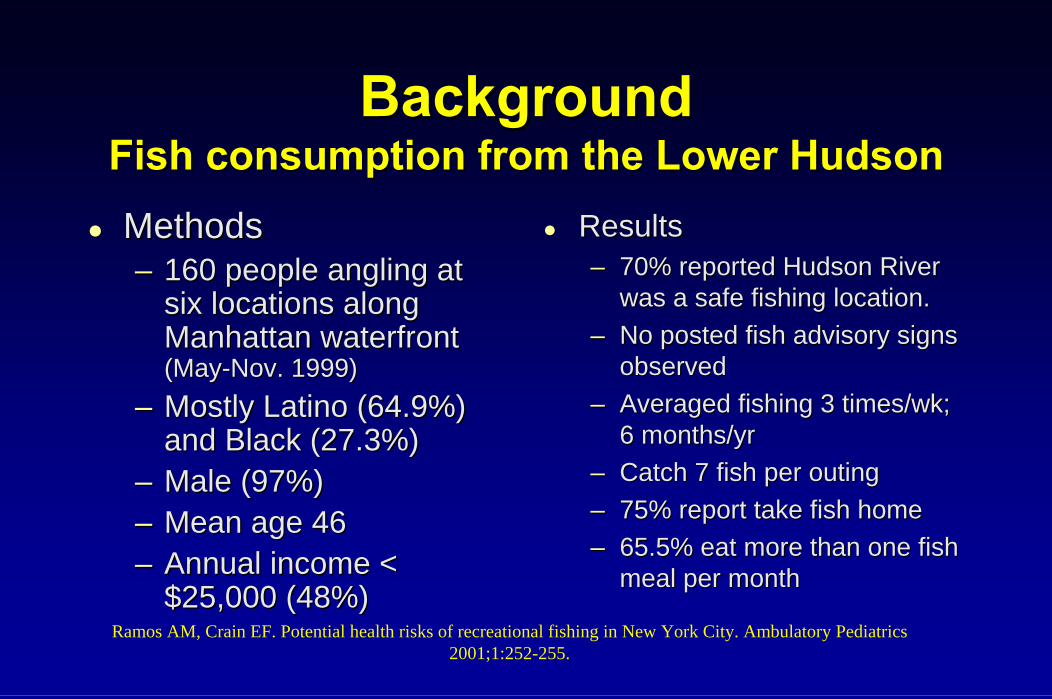
Data Collection: QuestionnairesData Collection: Questionnaires
zz QuestionnairesQuestionnaires –– Local fish intake (Local fish intake (speciesspecies
specific; frequency; amountspecific; frequency; amount)) –– Fish preparation andFish preparation and
cooking practices;cooking practices; –– Knowledge of local fishKnowledge of local fish
advisories;advisories; –– Share fish;Share fish; –– Demographic informationDemographic information

Data Collection: Blood SamplesData Collection: Blood Samples zz Venipuncture bloodVenipuncture blood
samples collected andsamples collected and centrifuged on sitecentrifuged on site
zz 68% response rate for68% response rate for blood collectionblood collection
zz Three Vacutaner tubesThree Vacutaner tubes collected for analysis of:collected for analysis of: PolychlorinatedPolychlorinated biphenlysbiphenlys, mercury,, mercury, chlordane, DDT/DDE andchlordane, DDT/DDE and polybrominated diphenylpolybrominated diphenyl ethersethers

Description of Urban Angler StudyDescription of Urban Angler Study Population (N=191)Population (N=191)
zz MaleMale 84%84% zz Mean age in yrsMean age in yrs 52 (15)52 (15) zz Mean BMIMean BMI 30 (5.5)30 (5.5) zz Share CatchShare Catch 63%63% zz EducationEducation
–– High SchoolHigh School 55%55% –– > High School> High School 44%44%
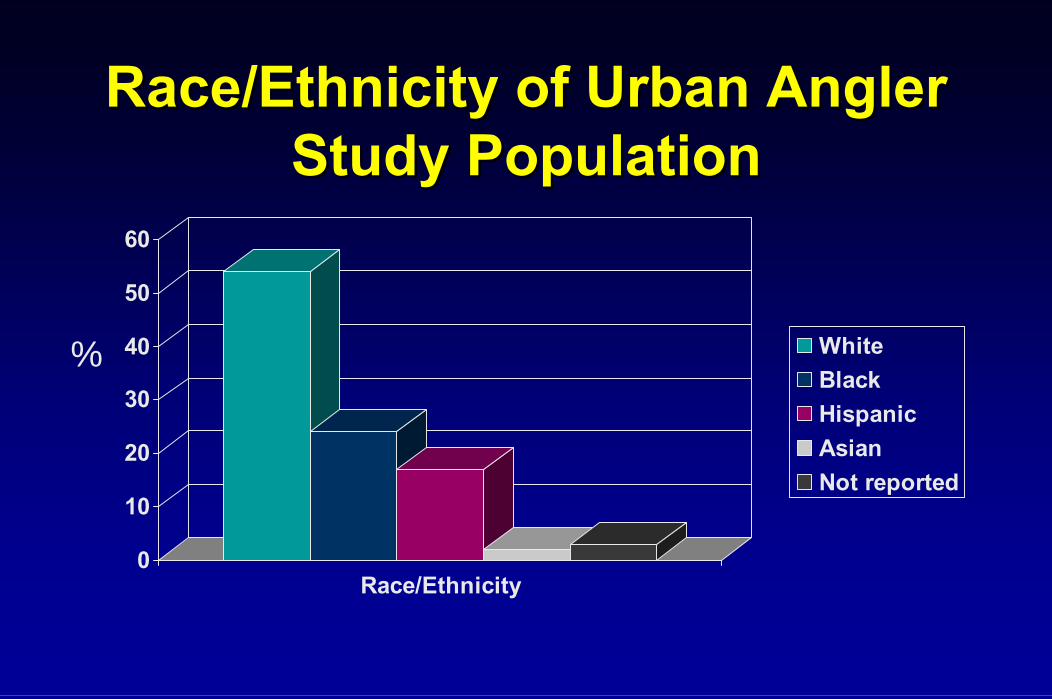
Race/Ethnicity of Urban AnglerRace/Ethnicity of Urban Angler Study PopulationStudy Population
Race/Ethnicity 0
10
20
30
40
50
60
White Black Hispanic Asian Not reported
%

Household Income of UrbanHousehold Income of Urban Angler Study PopulationAngler Study Population
0
5
10
15
20
25
30
35
< $30,000 $30,000 -$49, 999 > $49,000 Not Reported
%
Household Income
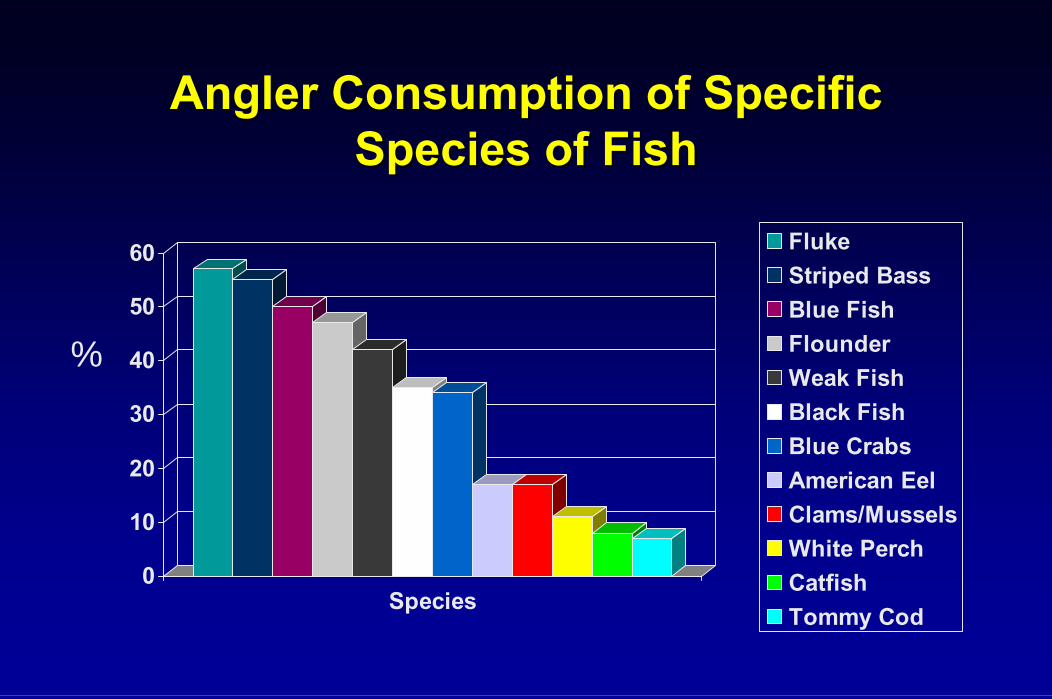
Angler Consumption of SpecificAngler Consumption of Specific Species of FishSpecies of Fish
Fluke60 Striped Bass
50 Blue Fish Flounder% 40 Weak Fish
30 Black Fish Blue Crabs
20 American Eel Clams/Mussels10 White Perch
0 Catfish Species Tommy Cod

Proportion Report Eating LocallyProportion Report Eating Locally Caught & Commercial FishCaught & Commercial Fish
Local Fish Commercial Fish 0
10
20
30
40
50
60
Never < 1/ week > 1/ week
%
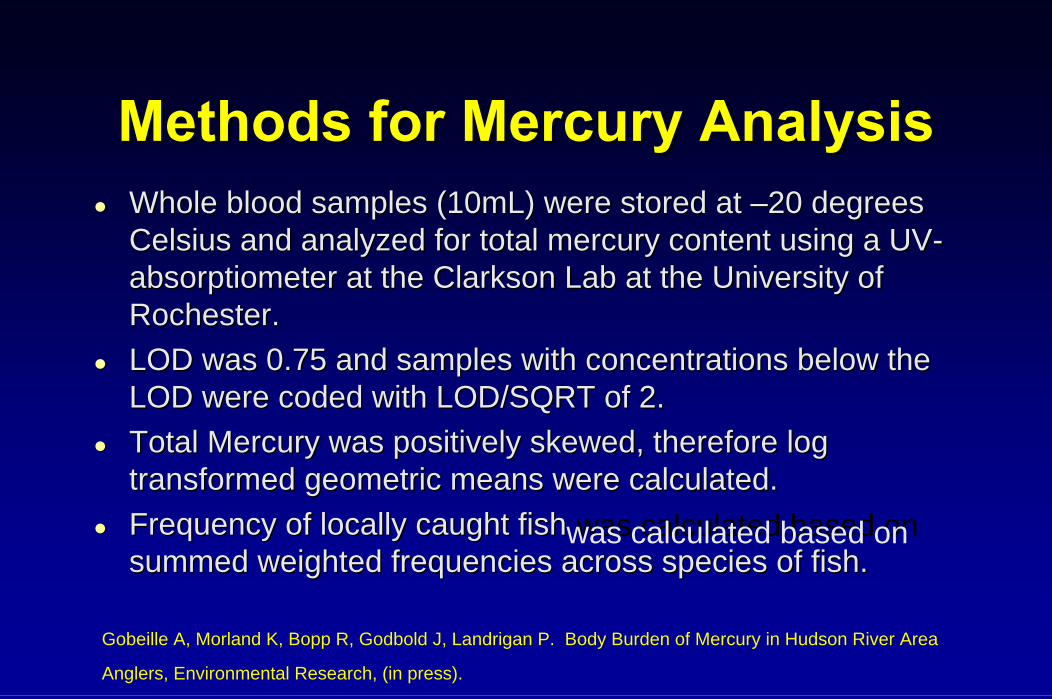
Methods for Mercury AnalysisMethods for Mercury Analysis zz Whole blood samples (10mL) were stored atWhole blood samples (10mL) were stored at ––20 degrees20 degrees
Celsius and analyzed for total mercury content using a UVCelsius and analyzed for total mercury content using a UV--absorptiometerabsorptiometer at the Clarkson Lab at the University ofat the Clarkson Lab at the University of Rochester.Rochester.
zz LOD was 0.75 and samples with concentrations below theLOD was 0.75 and samples with concentrations below the LOD were coded with LOD/SQRT of 2.LOD were coded with LOD/SQRT of 2.
zz Total Mercury was positively skewed, therefore logTotal Mercury was positively skewed, therefore log transformed geometric means were calculated.transformed geometric means were calculated.
zz Frequency of locally caught fishFrequency of locally caught fish was calculated based onwas calculated based on summed weighted frequencies across species of fish.summed weighted frequencies across species of fish.
Gobeille A, Morland K, Bopp R, Godbold J, Landrigan P. Body Burden of Mercury in Hudson River Area
Anglers, Environmental Research, (in press).
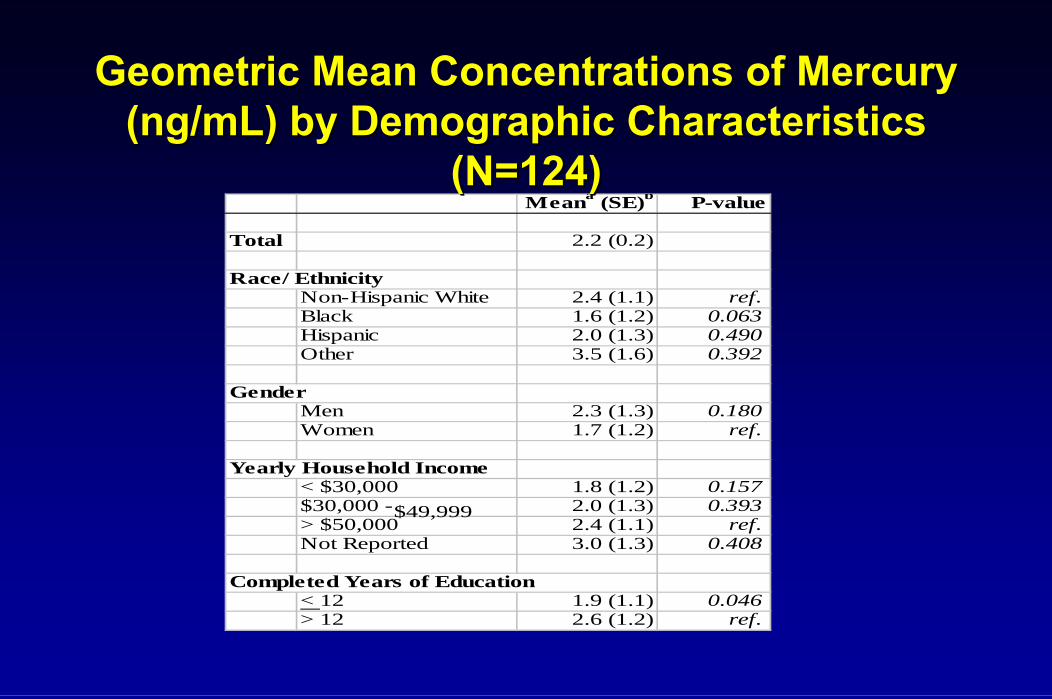
Geometric Mean Concentrations of MercuryGeometric Mean Concentrations of Mercury ((ngng//mLmL) by Demographic Characteristics) by Demographic Characteristics
(N=124)(N=124) Mean a (SE)b P-value
Total 2.2 (0.2)
Race/ Ethnicity Non-Hispanic White 2.4 (1.1) ref. Black 1.6 (1.2) 0.063 Hispanic 2.0 (1.3) 0.490 Other 3.5 (1.6) 0.392
Gender Men 2.3 (1.3) 0.180 Women 1.7 (1.2) ref.
Yearly Household Income < $30,000 1.8 (1.2) 0.157 $30,000 -$49,999 2.0 (1.3) 0.393 > $50,000 2.4 (1.1) ref. Not Reported 3.0 (1.3) 0.408
Completed Years of Education < 12 1.9 (1.1) 0.046 > 12 2.6 (1.2) ref.

Geometric Mean ConcentrationGeometric Mean Concentration of Mercury by Ageof Mercury by Age
Ng/ mL
0
0.5
1
1.5
2
2.5
3
3.5
Age
18-29 30-49 >49

Geometric Mean ConcentrationGeometric Mean Concentration of Mercury by BMIof Mercury by BMI
0 0.5
1 1.5
2 2.5
3 3.5
4
< 25 25-29.9 > 29.9
Ng/ mL
Body Mass Index

Unadjusted Adjusted
an is the number of participants ; bMean is log transformed (geometric mean); cSD is log transformed (geometric standard error); dModel adjusted for race, gender, income, education age and BMI; ep values presented against reference dose (never eats local fish)
na Meanb (SE)c P value Meanb (SE)c P value Never versus Any Local Fish Intake
Never 20 1.3 (1.2) ref. 0.2 (2.1) ref. Any Fish Intake 104 2.4 (1.2) 0.009 0.4 (1.2) 0.002
Average Frequency per Weeke
Never Any fish < once per week Any fish > once per week
20 1.3 (1.2) ref. 31 2.0 (1.3) 0.142 73 2.6 (1.3) 0.004
0.2 (2.1) ref. 0.4 (1.3) 0.031 0.5 (1.3) 0.001
Mercury Concentration (ng/mL) by Reported Fish Consumption
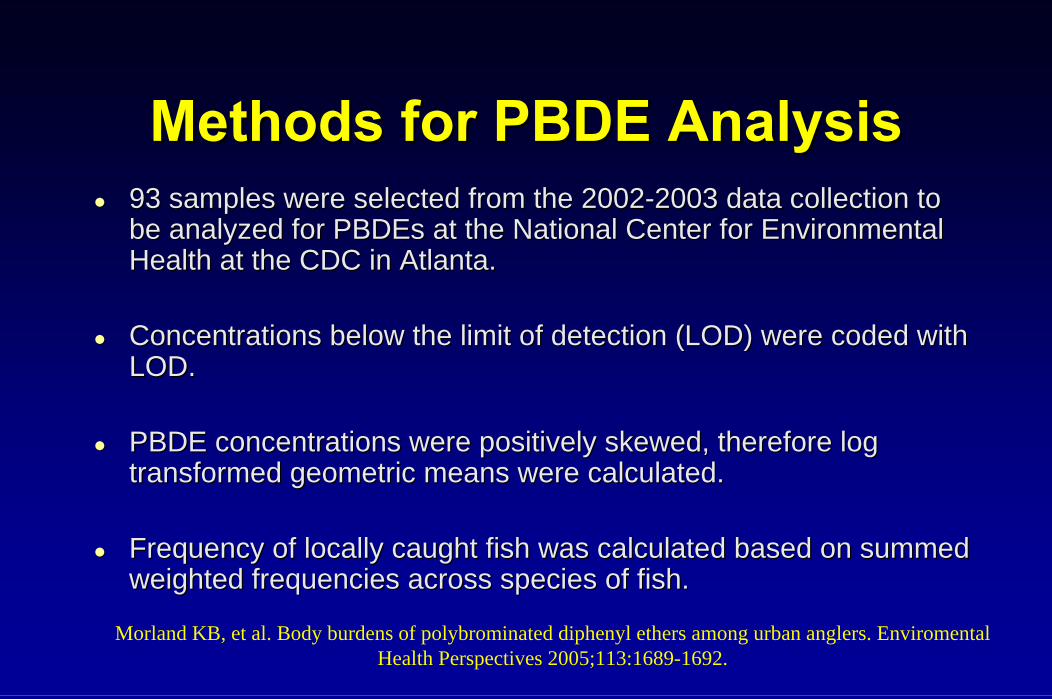
Methods for PBDE AnalysisMethods for PBDE Analysis zz 93 samples were selected from the 200293 samples were selected from the 2002--2003 data collection to2003 data collection to
be analyzed forbe analyzed for PBDEsPBDEs at the National Center for Environmentalat the National Center for Environmental Health at the CDC in Atlanta.Health at the CDC in Atlanta.
zz Concentrations below the limit ofConcentrations below the limit of detection (LOD) were coded witdetection (LOD) were coded withh LOD.LOD.
zz PBDE concentrations were positPBDE concentrations were positively skewed, therefore logively skewed, therefore log transformed geometric means were calculated.transformed geometric means were calculated.
zz Frequency of locally caught fishFrequency of locally caught fish was calculated based on summedwas calculated based on summed weighted frequencies across species of fish.weighted frequencies across species of fish.
Morland KB, et al. Body burdens of polybrominated diphenyl ethers among urban anglers. Enviromental Health Perspectives 2005;113:1689-1692.

MeanMean concentratationconcentratation ofof polybrominated diphenylpolybrominated diphenyl ethersethers
((PBDEsPBDEs) in human serum) in human serum U
nadjusted L
ipid adjusted (pg/g fresh weight) (ng/g lipid weight)
PBDE Congener N‡ Mean§ STD† Mean§ STD†
47 93 91.4 3.8 13.3 3.6 85 92 7.3 3.5 1.0 3.6 99 93 21.5 3.6 3.2 3.4
100 93 18.6 3.4 2.7 3.2 153 93 21.8 3.2 3.2 3.1 154 89 4.4 2.3 0.6 2.3 183 93 3.6 1.7 0.5 1.7
‡ Number of participants § Geometric mean † Geometric standard deviation

Mean concentration ofMean concentration of polybrominatedpolybrominated diphenyldiphenyl ethers (ethers (PBDEsPBDEs) by local) by local
fish intake (fish intake (ngng/g lipid weight)/g lipid weight)
N
o local fish intake
A
ny local fish intake PBDE
Congener N‡ Mean§ STD† N‡ Mean§ STD† p-value 47 14 12.61 5.42 79 13.41 3.30 0.87 85 14 0.70 3.56 78 1.11 3.54 0.21 99 14 2.83 4.69 79 3.30 3.24 0.67
100 14 2.32 4.66 79 2.77 2.94 0.59 153 14 2.02 4.13 79 3.43 2.88 0.10 154 12 0.56 3.74 77 0.64 2.09 0.57 183 14 0.38 1.99 79 0.56 1.65 0.01
‡ Number of participants § Geometric mean † Geometric standard deviation

MeanMean concentratationconcentratation ofof polybrominatedpolybrominated diphenyldiphenyl ethers (ethers (PBDEsPBDEs) by frequency of) by frequency of
reported local fish intake (reported local fish intake (ngng/g lipid weight)/g lipid weight)
N
o local fish intake
F
ish Intake <= 1 wk
F
ish Intake > 1 wk PBDE
Congener N‡ Mean§ STD† N‡ Mean§ STD† N‡ Mean§ STD†
47 14 12.61 5.42 25 11.55 3.07 54 14.37 3.41 85 14 0.70 3.56 25 0.89 3.28 53 1.23 3.65 99 14 2.83 4.69 25 2.68 2.92 54 3.63 3.38
100 14 2.32 4.66 25 2.34 2.63 54 3.00 3.08 153 14 2.02 4.13 25 2.58 3.06 54 3.91 2.76 154 12 0.56 3.74 23 0.51 1.91 54 0.71 2.13 183 14 0.38 1.99 25 0.49 1.70 54 0.59 1.62
‡ Number of participants § Geometric mean † Geometric standard deviation

Comparison of mean concentrations (BDEComparison of mean concentrations (BDE--47)47)
Akutsu (2003)
Lind (2003)
Schecter (2003)
Sjodin ( 2004)
Mazdai (2003)
MSSM (2004)
Breast Milk – Austin TX 2002
Mean concentration Archived Serum Pools –Seattle 1999-2002
Maternal Serum – Indiana 2001
Urban Anglers –2001 - 2003
Breast Milk – Sweden 1996-1999
Breast Milk – Japan – pooled milk 1988-2000
0 10 20 30 40 50
Mean ng/g lipid

Geometric Mean Concentration of MajorGeometric Mean Concentration of Major PCBs by Local Fish IntakePCBs by Local Fish Intake
0.52
0 .73
0 .40
0 .66
0 .43
0 .33
0.00
0 .10
0 .20
0 .30
0 .40
0 .50
0 .60
0 .70
0 .80
P C B 138 P C B 153 P C B 180
ng P
CB
s/ u
L Se
rum
N o fis h (n= 16) A ny fis h (n= 110)

Geometric Mean Concentration of Tetra &Geometric Mean Concentration of Tetra & PentaPenta Chlorinated PCBs by Fish IntakeChlorinated PCBs by Fish Intake
0.18
0.08 0.07
0.09
0.15
0.110.10 0.09
0.00 0.02 0.04 0.06 0.08 0.10 0.12 0.14 0.16 0.18 0.20
PCB 56 PCB 66 PCB 99 PCB 118
(ng
PCB
s /u
L Se
rum
)
No fish (n=16)
Any fish (n=110)

SummarySummary zz Observed higher levels of total mercury among urbanObserved higher levels of total mercury among urban
anglers reporting eating locally caught fishanglers reporting eating locally caught fish zz Levels of mercury higher than other US populations (ex.Levels of mercury higher than other US populations (ex.
NHANES)NHANES) zz Significant differences in PBDE levels were not observedSignificant differences in PBDE levels were not observed
between anglers reporting eatbetween anglers reporting eating locally caught fish anding locally caught fish and those that do not.those that do not.
zz Observed concentrations lower than other US populationsObserved concentrations lower than other US populations but higher than nonbut higher than non--US populations.US populations.
zz Differences in levels of PCBsDifferences in levels of PCBs were not observed by fishwere not observed by fish consumption.consumption.

AcknowledgementsAcknowledgementsAcknowledgements
Drs.Drs. LandriganLandrigan and Golden (previous Project Director)and Golden (previous Project Director)
Dr. Wolff at Mount Sinai; Drs. Patterson andDr. Wolff at Mount Sinai; Drs. Patterson and SjodinSjodin at CDC, and Dr.at CDC, and Dr. Clarkson at the University of RochesterClarkson at the University of Rochester
Dr.Dr. GodboldGodbold
Research Team:Research Team:
•• MohammedMohammed AdamuAdamu andand Alayne GobeilleAlayne Gobeille
•• ShonaShona Fang, HelenaFang, Helena FurbergFurberg, Teresa, Teresa JanevicJanevic, Kristina, Kristina NwazotaNwazota, Rochelle Osborne, Leon, Rochelle Osborne, Leon TultonTulton
•• Donna Colon and JoanneDonna Colon and Joanne OcasioOcasio
••Mark GaryMark Gary
NIEHS/EPA Superfund ProgramNIEHS/EPA Superfund Program