
Exposure Factors Handbook - Chapter 9: Intake of Fruits ...
84
Exposure Factors Handbook Chapter 9—Intake of Fruits and Vegetables Exposure Factors Handbook Page September 2011 9-i TABLE OF CONTENTS LIST OF TABLES ..................................................................................................................................................... 9-ii 9. INTAKE OF FRUITS AND VEGETABLES ...............................................................................................9-1 9.1. INTRODUCTION .........................................................................................................................9-1 9.2. RECOMMENDATIONS ...............................................................................................................9-2 9.3. INTAKE STUDIES........................................................................................................................9-5 9.3.1. Key Fruits and Vegetables Intake Study ..........................................................................9-5 9.3.1.1. U.S. EPA Analysis of Consumption Data From 2003−2006 National Health and Nutrition Examination Survey (NHANES) .................................9-5 9.3.2. Relevant Fruit and Vegetable Intake Studies ...................................................................9-7 9.3.2.1. U.S. Department of Agriculture (USDA) (1996a, b, 1993, 1980)— Food and Nutrient Intakes of Individuals in One Day in the United States ..............................................................................................................9-7 9.3.2.2. U.S. Department of Agriculture (USDA) (1999b)—Food Consumption, Prices, and Expenditures, 1970−1997 ....................................9-7 9.3.2.3. U.S. Department of Agriculture (USDA) (1999a)—Food and Nutrient Intakes by Children 1994−1996, 1998, Table Set 17 .......................9-7 9.3.2.4. U.S. EPA Analysis of Continuing Survey of Food Intake Among Individuals (CSFII) 1994−1996, 1998 Based on U.S. Department of Agriculture (USDA) (2000) and U.S. EPA (2000) .........................................9-8 9.3.2.5. Smiciklas-Wright et al. (2002)—Foods Commonly Eaten in the United States: Quantities Consumed per Eating Occasion and in a Day, 1994−1996 .............................................................................................9-9 9.3.2.6. Vitolins et al. (2002)—Quality of Diets Consumed by Older Rural Adults .............................................................................................................9-9 9.3.2.7. Fox et al. (2004)—Feeding Infants and Toddlers Study: What Foods Are Infants and Toddlers Eating ..................................................................9-10 9.3.2.8. Ponza et al. (2004)—Nutrient Food Intakes and Food Choices of Infants and Toddlers Participating in Women, Infants, and Children (WIC) ........................................................................................................... 9-11 9.3.2.9. Fox et al. (2006)—Average Portion of Foods Commonly Eaten by Infants and Toddlers in the United States..................................................... 9-11 9.3.2.10. Mennella et al. (2006)—Feeding Infants and Toddlers Study: The Types of Foods Fed to Hispanic Infants and Toddlers ................................. 9-11 9.4. CONVERSION BETWEEN WET- AND DRY-WEIGHT INTAKE RATES ..............................9-12 9.5. REFERENCES FOR CHAPTER 9 ..............................................................................................9-12
Transcript of Exposure Factors Handbook - Chapter 9: Intake of Fruits ...

Exposure Factors Handbook
Chapter 9—Intake of Fruits and Vegetables
Exposure Factors Handbook Page September 2011 9-i
TABLE OF CONTENTS LIST OF TABLES ..................................................................................................................................................... 9-ii 9. INTAKE OF FRUITS AND VEGETABLES ...............................................................................................9-1
9.1. INTRODUCTION .........................................................................................................................9-1 9.2. RECOMMENDATIONS ...............................................................................................................9-2 9.3. INTAKE STUDIES ........................................................................................................................9-5
9.3.1. Key Fruits and Vegetables Intake Study ..........................................................................9-5 9.3.1.1. U.S. EPA Analysis of Consumption Data From 2003−2006 National
Health and Nutrition Examination Survey (NHANES) .................................9-5 9.3.2. Relevant Fruit and Vegetable Intake Studies ...................................................................9-7
9.3.2.1. U.S. Department of Agriculture (USDA) (1996a, b, 1993, 1980)— Food and Nutrient Intakes of Individuals in One Day in the United States ..............................................................................................................9-7
9.3.2.2. U.S. Department of Agriculture (USDA) (1999b)—Food Consumption, Prices, and Expenditures, 1970−1997 ....................................9-7
9.3.2.3. U.S. Department of Agriculture (USDA) (1999a)—Food and Nutrient Intakes by Children 1994−1996, 1998, Table Set 17 .......................9-7
9.3.2.4. U.S. EPA Analysis of Continuing Survey of Food Intake Among Individuals (CSFII) 1994−1996, 1998 Based on U.S. Department of Agriculture (USDA) (2000) and U.S. EPA (2000) .........................................9-8
9.3.2.5. Smiciklas-Wright et al. (2002)—Foods Commonly Eaten in the United States: Quantities Consumed per Eating Occasion and in a Day, 1994−1996 .............................................................................................9-9
9.3.2.6. Vitolins et al. (2002)—Quality of Diets Consumed by Older Rural Adults .............................................................................................................9-9
9.3.2.7. Fox et al. (2004)—Feeding Infants and Toddlers Study: What Foods Are Infants and Toddlers Eating ..................................................................9-10
9.3.2.8. Ponza et al. (2004)—Nutrient Food Intakes and Food Choices of Infants and Toddlers Participating in Women, Infants, and Children (WIC) ........................................................................................................... 9-11
9.3.2.9. Fox et al. (2006)—Average Portion of Foods Commonly Eaten by Infants and Toddlers in the United States ..................................................... 9-11
9.3.2.10. Mennella et al. (2006)—Feeding Infants and Toddlers Study: The Types of Foods Fed to Hispanic Infants and Toddlers ................................. 9-11
9.4. CONVERSION BETWEEN WET- AND DRY-WEIGHT INTAKE RATES ..............................9-12 9.5. REFERENCES FOR CHAPTER 9 ..............................................................................................9-12

Exposure Factors Handbook
Chapter 9—Intake of Fruits and Vegetables
Page Exposure Factors Handbook September 2011 9-ii
LIST OF TABLES
Table 9-1. Recommended Values for Intake of Fruits and Vegetables, Edible Portion, Uncooked .................9-3 Table 9-2. Confidence in Recommendations for Intake of Fruits and Vegetables ...........................................9-4 Table 9-3. Per Capita Intake of Fruits and Vegetables Based on the 2003−2006 NHANES (g/kg-day,
edible portion, uncooked weight) .................................................................................................9-14 Table 9-4. Consumer-Only Intake of Fruits and Vegetables Based on the 2003−2006 NHANES
(g/kg-day, edible portion, uncooked weight) ................................................................................9-15 Table 9-5. Per Capita Intake of Individual Fruits and Vegetables Based on the 2003−2006 NHANES
(g/kg-day, edible portion, uncooked weight) ................................................................................9-16 Table 9-6. Consumer-Only Intake of Individual Fruits and Vegetables Based on the 2003−2006
NHANES (g/kg-day, edible portion, uncooked weight) ..............................................................9-24 Table 9-7. Mean Total Fruit and Total Vegetable Intake (as-consumed) in a Day by S ex and Age
(1977−1978) .................................................................................................................................9-31 Table 9-8. Mean Total Fruit and Total Vegetable Intake (as-consumed) in a Day by S ex and Age
(1987−1988, 1994, and 1995) ......................................................................................................9-32 Table 9-9. Per Capita Consumption of Fresh Fruits and Vegetables in 1997 ................................................9-33 Table 9-10. Mean Quantities of Vegetables Consumed Daily by Sex and Age, for Children, per Capita
(g/day, as-consumed) ...................................................................................................................9-34 Table 9-11. Percentage of Individuals Consuming Vegetables, by Sex and Age, for Children (%) ................9-35 Table 9-12. Mean Quantities of Fruits Consumed Daily by Sex and Age, for Children, per Capita
(g/day, as-consumed) ...................................................................................................................9-36 Table 9-13. Percentage of Individuals Consuming, Fruits by Sex and Age, for Children (%) ........................9-37 Table 9-14. Per Capita Intake of Fruits and Vegetables Based on 1994−1996, 1998 CSFII (g/kg-day,
edible portion, uncooked weight) .................................................................................................9-38 Table 9-15. Consumer-Only Intake of Fruits and Vegetables Based on 1994−1996, 1998 CSFII (g/kg
day, edible portion, uncooked weight) .........................................................................................9-40 Table 9-16. Per Capita Intake of Individual Fruits and Vegetables Based on 1994−1996, 1998 CSFII
(g/kg-day, edible portion, uncooked weight) ................................................................................9-42 Table 9-17. Consumer-Only Intake of Individual Fruits and Vegetables Based on 1994−1996, 1998
CSFII ............................................................................................................................................9-51 Table 9-18. Per Capita Intake of Exposed Fruits Based on 1994−1996 CSFII (g/kg-day, as-consumed) .......9-58 Table 9-19. Per Capita Intake of Protected Fruits Based on 1994−1996 CSFII (g/kg-day, as-
consumed) ....................................................................................................................................9-59 Table 9-20. Per Capita Intake of Exposed Vegetables (g/kg-day, as-consumed) .............................................9-60 Table 9-21. Per Capita Intake of Protected Vegetables Based on 1994−1996 CSFII (g/kg-day, as-
consumed) ....................................................................................................................................9-61 Table 9-22. Per Capita Intake of Root Vegetables Based on 1994−1996 CSFII (g/kg-day, as-
consumed) ....................................................................................................................................9-62 Table 9-23. Quantity (as-consumed) of Fruits and Vegetables Consumed per Eating Occasion and the
Percentage of Individuals Consuming These Foods in Two Days ...............................................9-63 Table 9-24. Quantity (as-consumed) of Fruits and Vegetables Consumed per Eating Occasion and
Percentage of Individuals Consuming These Foods in Two Days, by Food ................................9-64 Table 9-25. Consumption of Major Food Groups: Median Servings (and ranges) by Demographic and
Health Characteristics, for Older Adults ......................................................................................9-66 Table 9-26. Characteristics of the Feeding Infants and Toddlers Study (FITS) Sample Population ...............9-67 Table 9-27. Percentage of Infants and Toddlers Consuming Different Types of Vegetables ...........................9-68 Table 9-28. Top Five Vegetables Consumed by Infants and Toddlers .............................................................9-69 Table 9-29. Percentage of Infants and Toddlers Consuming Different Types of Fruits...................................9-70 Table 9-30. Top Five Fruits Consumed by I nfants and Toddlers .....................................................................9-71 Table 9-31. Characteristics of Women, Infants, and Children (WIC) Participants and Non-Participants
(percentages) ................................................................................................................................9-72 Table 9-32. Food Choices for Infants and Toddlers by Women, Infants, and Children (WIC)
Participation Status ......................................................................................................................9-73
Exposure Factors Handbook
Chapter 9—Intake of Fruits and Vegetables
Exposure Factors Handbook Page September 2011 9-iii
LIST OF TABLES (continued) Table 9-33. Average Portion Sizes per Eating Occasion of Fruits and Vegetables Commonly
Consumed by Infants From the 2002 Feeding Infants and Toddlers Study ..................................9-74 Table 9-34. Average Portion Sizes per Eating Occasion of Fruits and Vegetables Commonly
Consumed by Toddlers From the 2002 Feeding Infants and Toddlers Study ...............................9-75 Table 9-35. Percentage of Hispanic and Non-Hispanic Infants and Toddlers Consuming Different
Types of Fruits and Vegetables on a Given Day...........................................................................9-76 Table 9-36. Top Five Fruits and Vegetables Consumed by Hispanic and Non-Hispanic Infants and
Toddlers per Age Group ...............................................................................................................9-77 Table 9-37. Mean Moisture Content of Selected Food Groups Expressed as Percentages of
Edible Portions .............................................................................................................................9-78

Exposure Factors Handbook
Chapter 9—Intake of Fruits and Vegetables
This page intentionally left blank
Page Exposure Factors Handbook September 2011 9-iv

Exposure Factors Handbook
Chapter 9—Intake of Fruits and Vegetables 9. INTAKE OF FRUITS AND
VEGETABLES 9.1. INTRODUCTION
The American food supply is generally considered to be one of the safest in the world. Nevertheless, fruits and vegetables may become contaminated with toxic chemicals by several different pathways. Ambient pollutants from the air may be deposited on or absorbed by the plants or dissolved in rainfall or irrigation waters that contact the plants. Pollutants may also be absorbed through plant roots from contaminated soil and ground water. The addition of pesticides, soil additives, and fertilizers may also result in contamination of fruits and vegetables. To assess exposure through this pathway, information on fruit and vegetable ingestion rates is needed.
A variety of terms may be used to define intake of fruits and vegetables (e.g., consumer-only intake, per capita intake, total fruit intake, total vegetable intake, as-consumed intake, dry-weight intake). These terms are defined below to assist the reader in interpreting and using the intake rates that are appropriate for the exposure scenario being assessed.
Consumer-only intake is defined as the quantity of fruits and vegetables consumed by individuals during the survey period. These data are generated by averaging intake across only the individuals in the survey w ho consumed these food items. Per capita intake rates are generated by averaging consumer-only intakes over the entire population (including those individuals that reported no intake). In general, per capita intake rates are appropriate for use in exposure assessments for which average dose estimates are of interest because they represent both individuals who ate the foods during the survey period and individuals who may eat the food items at some time, but did not consume them during the survey period. Per capita intake, therefore, represents an average across the entire population of interest, but does so at the expense of underestimating consumption for the subset of the population that consumed the food in question. Total fruit intake refers to the sum of all fruits consumed in a day including canned, dried, frozen, and fresh fruits. Likewise, total vegetable intake refers to the sum of all vegetables consumed in a day including canned, dried, frozen, and fresh vegetables.
Intake rates may be expressed on the basis of the as-consumed weight (e.g., cooked or prepared) or on the uncooked or unprepared w eight. As-consumed intake rates are based on the weight of the food in the form that it is consumed and should be used in assessments where the basis for the contaminant
concentrations in foods is also indexed to the as-consumed weight. Some of the food ingestion values provided in this chapter are expressed as as-consumed intake rates because this is the fashion in which data were reported by survey respondents. Others are provided as uncooked weights based on analyses of survey data that account for weight changes that occur during cooking. This is of importance because concentration data to be used in the dose equation are often measured in uncooked food samples. It should be recognized that cooking can either increase or decrease food weight. Similarly, cooking can increase the mass of contaminant in food (due to formation reactions, or absorption from cooking oils or water) or decrease the mass of contaminant in food (due to vaporization, fat loss, or leaching). The combined effects of changes in weight and changes in contaminant mass can result in either an increase or decrease in contaminant concentration in cooked food. Therefore, if the as-consumed ingestion rate and the uncooked concentration are used in the dose equation, dose may be under-estimated or over-estimated. It is important for the assessor to be aware of these issues and choose intake rate data that best match the concentration data that are being used. For more information on cooking losses and conversions necessary to account for such losses, refer to Chapter 13 of this handbook.
Sometimes contaminant concentrations in food are reported on a dry-weight basis. When these data are used in an exposure assessment, it is recommended that dry-weight intake rates also be used. Dry-weight food concentrations and intake rates are based on the weight of the food consumed after the moisture content has been removed. For information on converting the intake rates presented in this chapter to dry-weight intake rates, refer to Section 9.4.
The purpose of this chapter is to provide intake data for fruits and vegetables. The recommendations for fruit and vegetable ingestion rates are provided in the next section, along with a summary of the confidence ratings for these recommendations. The recommended values are based on the key study identified by U.S. Environmental Protection Agency (EPA) for this factor. Following the recommendations, the key study on fruit and vegetable ingestion is summarized. Relevant data on ingestion of fruits and vegetables are also provided. These data are presented to provide the reader with added perspective on the current state-of-knowledge pertaining to ingestion of fruits and vegetables.
Exposure Factors Handbook Page September 2011 9-1
Exposure Factors Handbook
Chapter 9—Intake of Fruits and Vegetables 9.2. RECOMMENDATIONS
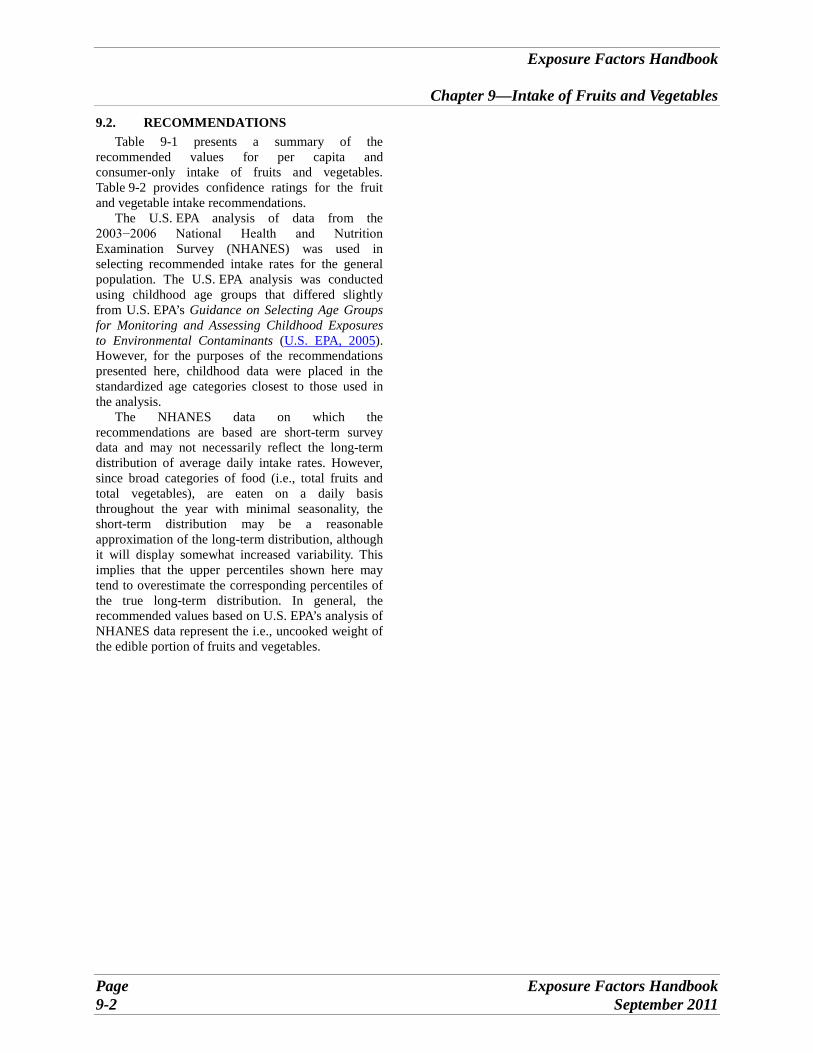
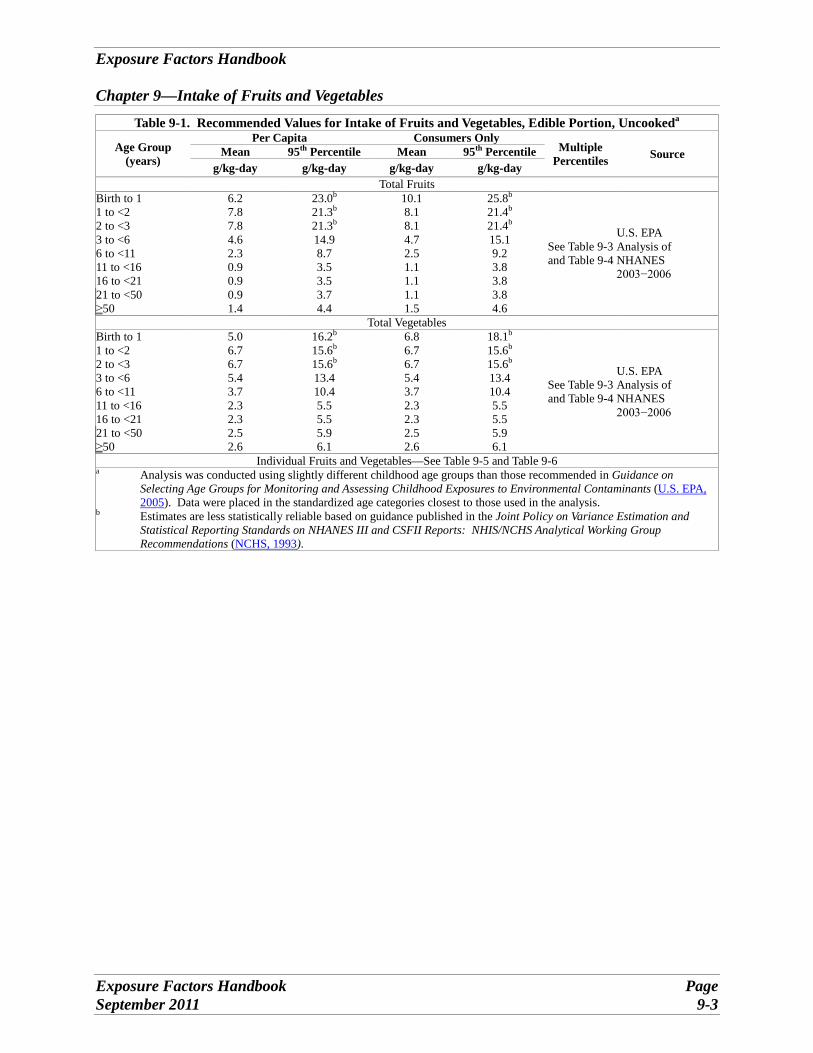
Table 9-1 presents a summary of the recommended values for per capita and consumer-only intake of fruits and vegetables. Table 9-2 provides confidence ratings for the fruit and vegetable intake recommendations.
The U.S. EPA analysis of data from the 2003−2006 National Health and Nutrition Examination Survey (NHANES) was used in selecting recommended intake rates for the general population. The U.S. EPA analysis was conducted using childhood age groups that differed slightly from U.S. EPA’s Guidance on Selecting Age Groups for Monitoring and Assessing Childhood Exposures to Environmental Contaminants (U.S. EPA, 2005). However, for the purposes of the recommendations presented here, childhood data were placed in the standardized age categories closest to those used in the analysis.
The NHANES data on which the recommendations are based are short-term survey data and may not necessarily reflect the long-term distribution of average daily intake rates. However, since broad categories of food (i.e., total fruits and total vegetables), are eaten on a daily basis throughout the year with minimal seasonality, the short-term distribution may be a reasonable approximation of the long-term distribution, although it will display somewhat increased variability. This implies that the upper percentiles shown here may tend to overestimate the corresponding percentiles of the true long-term distribution. In general, the recommended values based on U.S. EPA’s analysis of NHANES data represent the i.e., uncooked weight of the edible portion of fruits and vegetables.
Page Exposure Factors Handbook September 2011 9-2
Exposure Factors Handbook
Chapter 9—Intake of Fruits and Vegetables
Table 9-1. Recommended Values for Intake of Fruits and Vegetables, Edible Portion, Uncookeda
Age Group (years)
Per Capita Consumers Only Multiple
Percentiles Source Mean 95th Percentile Mean 95th Percentile g/kg-day g/kg-day g/kg-day g/kg-day
Total Fruits Birth to 1 6.2 23.0b 10.1 25.8b
See Table 9-3 and Table 9-4
U.S. EPA Analysis of NHANES 2003−2006
1 to <2 7.8 21.3b 8.1 21.4b
2 to <3 7.8 21.3b 8.1 21.4b
3 to <6 4.6 14.9 4.7 15.1 6 to <11 2.3 8.7 2.5 9.2 11 to <16 0.9 3.5 1.1 3.8 16 to <21 0.9 3.5 1.1 3.8 21 to <50 0.9 3.7 1.1 3.8 ≥50 1.4 4.4 1.5 4.6
Total Vegetables Birth to 1 5.0 16.2b 6.8 18.1b
See Table 9-3 and Table 9-4
U.S. EPA Analysis of NHANES 2003−2006
1 to <2 6.7 15.6b 6.7 15.6b
2 to <3 6.7 15.6b 6.7 15.6b
3 to <6 5.4 13.4 5.4 13.4 6 to <11 3.7 10.4 3.7 10.4 11 to <16 2.3 5.5 2.3 5.5 16 to <21 2.3 5.5 2.3 5.5 21 to <50 2.5 5.9 2.5 5.9 ≥50 2.6 6.1 2.6 6.1
Individual Fruits and Vegetables—See Table 9-5 and Table 9-6 a Analysis was conducted using slightly different childhood age groups than those recommended in Guidance on
Selecting Age Groups for Monitoring and Assessing Childhood Exposures to Environmental Contaminants (U.S. EPA, 2005). Data were placed in the standardized age categories closest to those used in the analysis.
b Estimates are less statistically reliable based on guidance published in the Joint Policy on Variance Estimation and Statistical Reporting Standards on NHANES III and CSFII Reports: NHIS/NCHS Analytical Working Group Recommendations (NCHS, 1993).
Exposure Factors Handbook Page September 2011 9-3
Exposure Factors Handbook
Chapter 9—Intake of Fruits and Vegetables
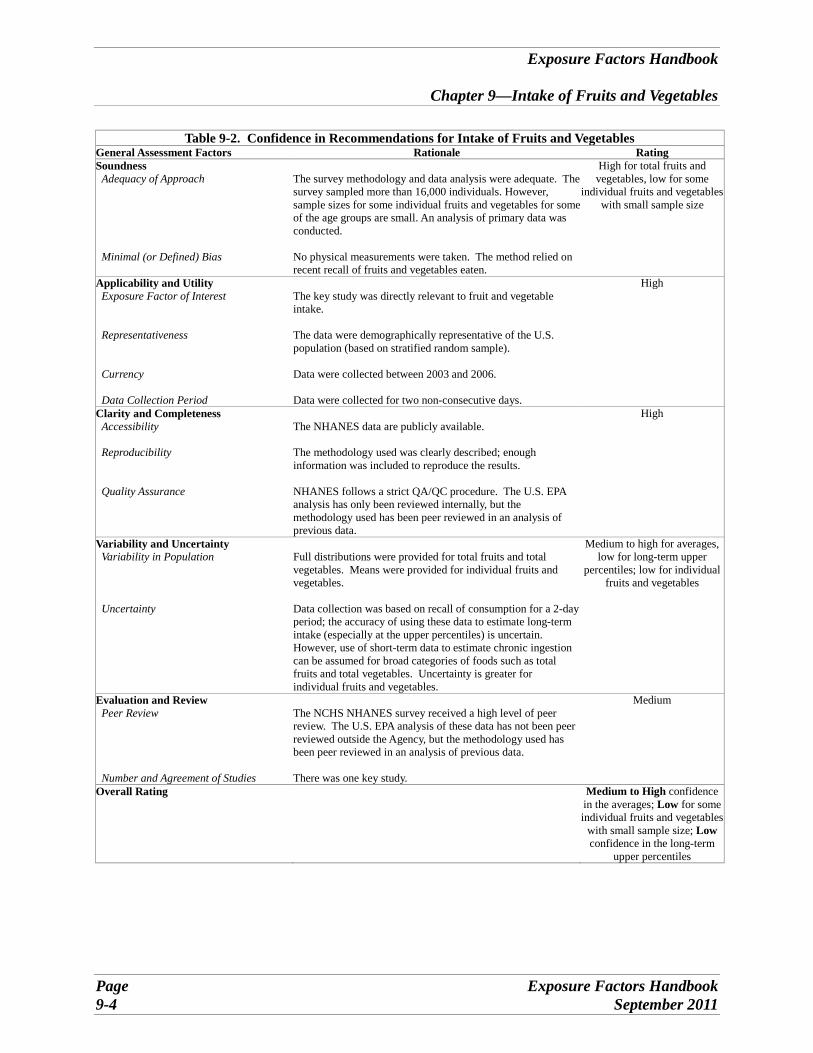
Table 9-2. Confidence in Recommendations for Intake of Fruits and Vegetables General Assessment Factors Rationale Rating Soundness
Adequacy of Approach
Minimal (or Defined) Bias
The survey methodology and data analysis were adequate. The survey sampled more than 16,000 individuals. However, sample sizes for some individual fruits and vegetables for some of the age groups are small. An analysis of primary data was conducted.
No physical measurements were taken. The method relied on recent recall of fruits and vegetables eaten.
High for total fruits and vegetables, low for some
individual fruits and vegetables with small sample size
Applicability and Utility Exposure Factor of Interest
Representativeness
Currency
Data Collection Period
The key study was directly relevant to fruit and vegetable intake.
The data were demographically representative of the U.S. population (based on stratified random sample).
Data were collected between 2003 and 2006.
Data were collected for two non-consecutive days.
High
Clarity and Completeness Accessibility
Reproducibility
Quality Assurance
The NHANES data are publicly available.
The methodology used was clearly described; enough information was included to reproduce the results.
NHANES follows a strict QA/QC procedure. The U.S. EPA analysis has only been reviewed internally, but the methodology used has been peer reviewed in an analysis of previous data.
High
Variability and Uncertainty Variability in Population
Uncertainty
Full distributions were provided for total fruits and total vegetables. Means were provided for individual fruits and vegetables.
Data collection was based on recall of consumption for a 2-day period; the accuracy of using these data to estimate long-term intake (especially at the upper percentiles) is uncertain. However, use of short-term data to estimate chronic ingestion can be assumed for broad categories of foods such as total fruits and total vegetables. Uncertainty is greater for individual fruits and vegetables.
Medium to high for averages, low for long-term upper
percentiles; low for individual fruits and vegetables
Evaluation and Review Peer Review
Number and Agreement of Studies
The NCHS NHANES survey received a high level of peer review. The U.S. EPA analysis of these data has not been peer reviewed outside the Agency, but the methodology used has been peer reviewed in an analysis of previous data.
There was one key study.
Medium
Overall Rating Medium to High confidence in the averages; Low for some individual fruits and vegetables
with small sample size; Low confidence in the long-term
upper percentiles
Page Exposure Factors Handbook September 2011 9-4

Exposure Factors Handbook
Chapter 9—Intake of Fruits and Vegetables
9.3. INTAKE STUDIES 9.3.1. Key Fruits and Vegetables Intake Study 9.3.1.1. U.S. EPA Analysis of Consumption Data
From 2003−2006 National Health and Nutrition Examination Survey (NHANES)
The key source of recent information on consumption rates of fruits and vegetables is the U.S. Centers for Disease Control and Prevention’s National Center for Health Statistics’ (NCHS) NHANES. Data from NHANES 2003−2006 have been used by the U.S. EPA, Office of Pesticide Programs (OPP) to generate per capita and consumer-only intake rates for both individual fruits and vegetables and total fruits and vegetables.
NHANES is designed to assess the health and nutritional status of adults and children in the United States. In 1999, the survey became a continuous program that interviews a nationally representative sample of approximately 7,000 persons each year and examines a nationally representative sample of about 5,000 persons each year, located in counties across the country, 15 of which are visited each year. Data are released on a 2-year basis, thus, for example, the 2003 data are combined with the 2004 data to produce NHANES 2003−2004.
The dietary interview component of NHANES is called What We Eat in America and is conducted by the U.S. Department of Agriculture (USDA) and the U.S. Department of Health and Human Services (DHHS). DHHS’ NCHS is responsible for the sample design and data collection, and USDA’s Food Surveys Research Group is responsible for the dietary data collection methodology, maintenance of the databases used to code and process the data, and data review and processing. Beginning in 2003, 2 non-consecutive days of 24-hour intake data were collected. The first day is collected in-person, and the second day is collected by telephone 3 to 10 days later. These data are collected using USDA’s dietary data collection instrument, the Automated Multiple Pass Method. This method provides an efficient and accurate means of collecting intakes for large-scale national surveys. It is fully computerized and uses a 5-step interview. Details can be found at USDA’s Agriculture Research Service (http://www.ars.usda.gov/ba/bhnrc/fsrg). For NHANES 2003−2004, there were
12,761 persons selected; of these, 9,643 were considered respondents to the mobile examination center (MEC) examination and data collection. However, only 9,034 of the MEC respondents provided complete dietary intakes for Day 1. Furthermore, of those providing the Day 1 data, only 8,354 provided complete dietary intakes for Day 2.
For NHANES 2005−2006, there were 12,862 persons selected; of these, 9,950 were considered respondents to the MEC examination and data collection. However, only 9,349 of the MEC respondents provided complete dietary intakes for Day 1. Furthermore, of those providing the Day 1 data, only 8,429 provided complete dietary intakes for Day 2.
The 2003−2006 NHANES surveys are stratified, multistage probability samples of the civilian non-institutionalized U.S. population. The sampling frame was organized using 2000 U.S. population census estimates. NHANES oversamples low-income persons, adolescents 12 to 19 years, persons 60 years and older, African Americans, and Mexican Americans. Several sets of sampling weights are available for use with the intake data. By using appropriate weights, data for all four years of the surveys can be combined. Additional information on NHANES can be obtained at http://www.cdc.gov/nchs/nhanes.htm.
In 2010, U.S. EPA, OPP used NHANES 2003−2006 data to update the Food Commodity Intake Database (FCID) that was developed in earlier analyses of data from the USDA’s Continuing Survey of Food Intake among Individuals (CSFII) (U.S. EPA, 2000; USDA, 2000) (see Section 9.3.2.4), NHANES data on the foods people reported eating were converted to the quantities of agricultural commodities eaten. “Agricultural commodity” is a term used by U.S. EPA to mean plant (or animal) parts consumed by humans as food; when such items are raw or unprocessed, they are referred to as “raw agricultural commodities.” For example, an apple pie may contain the commodities apples, flour, fat, sugar, and spices. FCID contains approximately 558 unique commodity names and 8-digit codes. The FCID commodity names and codes were selected and defined by U.S. EPA and were based on the U.S. EPA Food Commodity Vocabulary (http://www.epa.gov/pesticides/foodfeed/).
Intake rates were generated for a variety of food items/groups based on the agricultural commodities included in the FCID. These intake rates represent intake of all forms of the product (e.g., both home produced and commercially produced) for individuals who provided data for 2 days of the survey. Note that if the person reported consuming food for only one day, their 2-day average would be half the amount reported for the one day of consumption. Individuals who did not provide information on body weight or for whom identifying information was unavailable were excluded from the analysis. Two-day average intake rates were calculated for all individuals in the database for each of the food items/groups. These average daily intake rates were divided by each
Exposure Factors Handbook Page September 2011 9-5

Exposure Factors Handbook
Chapter 9—Intake of Fruits and Vegetables individual’s reported body weight to generate intake rates in units of grams per kilogram of body weight per day (g/kg-day). The data were weighted according to the 4-year, 2-day sample weights provided in NHANES 2003−2006 to adjust the data for the sample population to reflect the national population.
Summary statistics were generated on a consumer-only and on a per capita basis. Summary statistics, including: number of observations, percentage of the population consuming the fruits or vegetables being analyzed, mean intake rate, and standard error of the mean intake rate were calculated for total fruits, total vegetables, and selected individual fruits and vegetables. Individual fruits and vegetables were selected to be consistent with Chapter 13, which was based on having at least 30 households reporting consumption for the particular fruit or vegetable. Percentiles of the intake rate distribution (i.e., 1st, 5th, 10th, 25th, 50th, 75th, 90th, 95th, 99th, and the maximum value) were also provided for total fruits and total vegetables. Data were provided for the following age groups: birth to 1 year, 1 to 2 years, 3 to 5 years, 6 to 12 years, 13 to 19 years, 20 to 49 years, and ≥50 years. Data for females 13 to 49 years were also provided. Because these data were developed for use in U.S. EPA’s pesticide registration program, the childhood age groups used are slightly different than those recommended in U.S. EPA’s Guidance on Selecting Age Groups for Monitoring and Assessing Childhood Exposures to Environmental Contaminants (U.S. EPA, 2005).
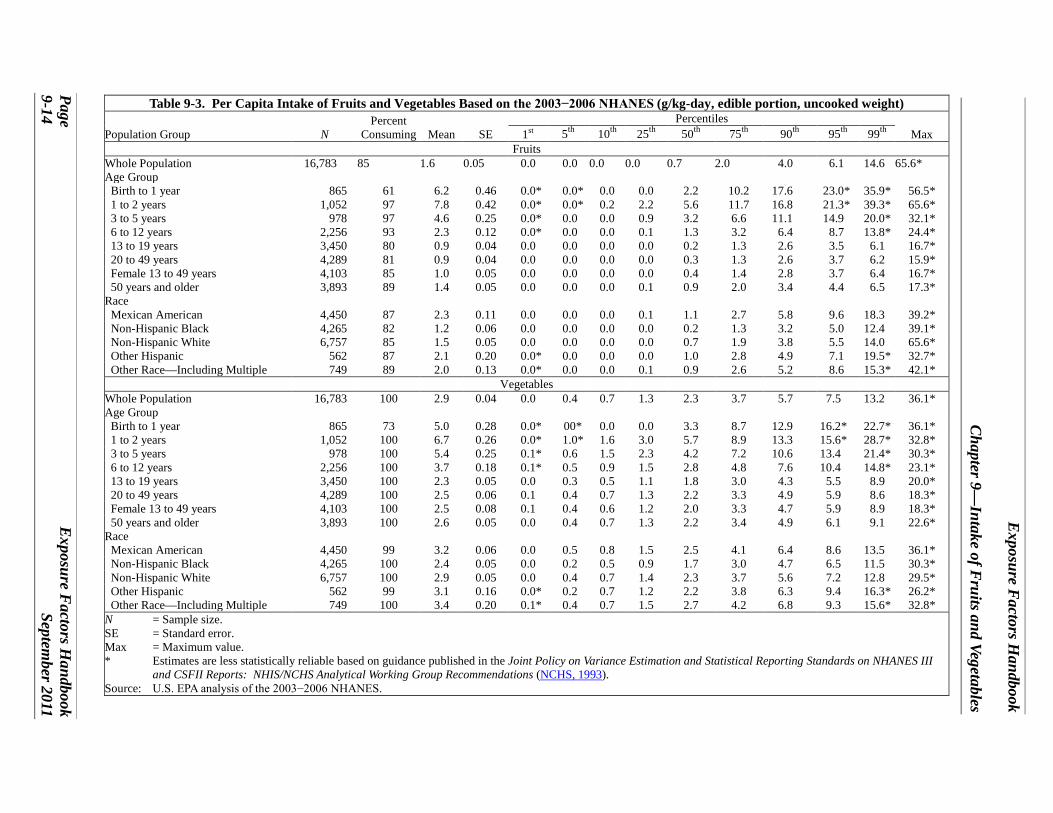
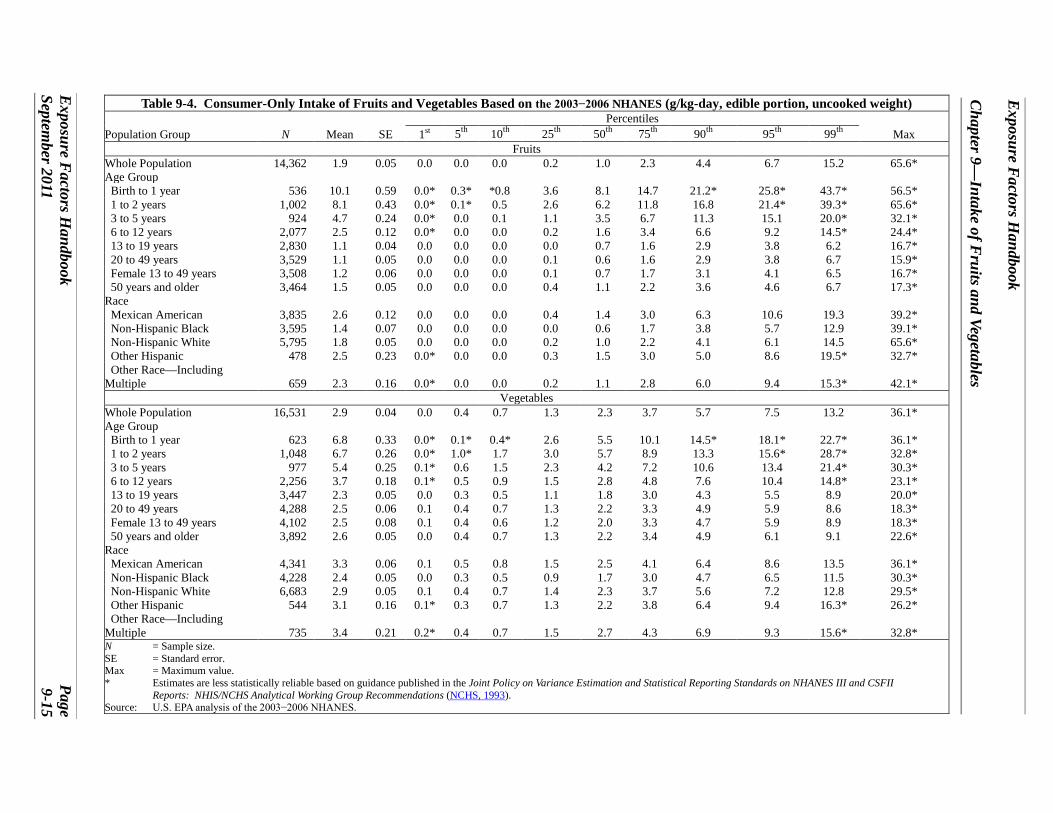
Table 9-3 presents per capita intake data for total fruits and total vegetables in g/kg-day; Table 9-4 provides consumer-only intake data for total fruits and total vegetables in g/kg-day. Table 9-5 provides per capita intake data for individual fruits and vegetables in g/kg-day, and Table 9-6 provides consumer-only intake data for individual fruits and vegetables in g/kg-day. In general, these data represent intake of the edible portions of uncooked foods.
The results are presented in units of g/kg-day. Thus, use of these data in calculating potential dose does not require the body-weight factor to be included in the denominator of the average daily dose (ADD) equation. It should be noted that converting these intake rates into units of g/day by multiplying by a single average body weight is inappropriate, because individual intake rates were indexed to the reported body weights of the survey respondents. Also, it should be noted that the distribution of average daily intake rates generated using short-term data (e.g., 2-day) does not necessarily reflect the
long-term distribution of average daily intake rates. The distributions generated from short-term and long-term data will differ to the extent that each individual’s intake varies from day to day; the distributions will be similar to the extent that individuals’ intakes are constant from day to day. Day-to-day variation in intake among individuals will be high for fruits and vegetables that are highly seasonal and for fruits and vegetables that are eaten year-round, but that are not typically eaten every day. For these fruits and vegetables, the intake distribution generated from short-term data will not be a good reflection of the long-term distribution. On the other hand, for broad categories of foods (e.g., total fruits and total vegetables) that are eaten on a daily basis throughout the year, the short-term distribution may be a reasonable approximation of the true long-term distribution, although it will show somewhat more variability. In this chapter, distributions are provided only for broad categories of fruits and vegetables (i.e., total fruits and total vegetables). Because of the increased variability of the short-term distribution, the short-term upper percentiles shown here may overestimate the corresponding percentiles of the long-term distribution. For individual foods, only the mean, standard error, and percent consuming are provided.
An advantage of using the U.S. EPA’s analysis of NHANES data is that it provides distributions of intake rates for various age groups of children and adults, normalized by body weight. The data set was designed to be representative of the U.S. population and includes four years of intake data combined. Another advantage is the currency of the data; the NHANES data are from 2003−2006. However, short-term dietary data may not accurately reflect long-term eating patterns and may under-represent infrequent consumers of a given food. This is particularly true for the tails (extremes) of the distribution of food intake. Because these are 2-day averages, consumption estimates at the upper end of the intake distribution may be underestimated if these consumption values are used to assess acute (i.e., short-term) exposures, also, the analysis was conducted using slightly different childhood age groups than those recommended in U.S. EPA’s Guidance on Selecting Age Groups for Monitoring and Assessing Childhood Exposures to Environmental Contaminants (U.S. EPA, 2005). However, given the similarities in the age groups used, the data should provide suitable intake estimates for the age groups of interest.
Page Exposure Factors Handbook September 2011 9-6
Exposure Factors Handbook
Chapter 9—Intake of Fruits and Vegetables
9.3.2. Relevant Fruit and Vegetable Intake Studies
9.3.2.1. U.S. Department of Agriculture (USDA) (1996a, b, 1993, 1980)—Food and Nutrient Intakes of Individuals in One Day in the United States
USDA calculated mean intake rates for total fruits and total vegetables using data from the 1977−1978 and 1987−1988 Nationwide Food Consumption Surveys (NFCS) (USDA, 1993, 1980) and CSFII data from 1994 and 1995 (USDA, 1996a, b). Table 9-7 presents the mean per capita total intake rates for total fruits and total vegetables from the 1977−1978 NFCS. Table 9-8 presents similar data from the 1987−1988 NFCS and the 1994 and 1995 CSFII. Note that the age classifications used in these surveys were slightly different than those used in the 1977−1978 NFCS. Table 9-7 and Table 9-8 include both per capita intake rates and intake rates for consumers only for various ages of individuals. Intake rates for consumers only were calculated by dividing the per capita consumption rate by the fraction of the population consuming vegetables or fruits in a day.
The advantages of using these data are that they provide intake estimates for all fruits or all vegetables, combined. Again, these estimates are based on one-day dietary data, which may not reflect usual consumption patterns. These data are based on older surveys and may not be entirely representative of current eating patterns.
9.3.2.2. U.S. Department of Agriculture (USDA) (1999b)—Food Consumption, Prices, and Expenditures, 1970−1997
The USDA’s Economic Research Service calculates the amount of food available for human consumption in the United States on an annual basis (USDA, 1999b). Supply and utilization balance sheets are generated based on the flow of food items from production to end uses for the years 1970 to 1997. Total available supply is estimated as the sum of production and imports (USDA, 1999b). The availability of food for human use commonly termed as “food disappearance” is determined by subtracting exported foods from the total available supply (USDA, 1999b). USDA (1999b) calculates the per capita food consumption by dividing the total food disappearance by the total U.S. population. USDA (1999b) estimated per capita consumption data for various fruit and vegetable products from 1970−1997. Table 9-9 presents retail weight per capita data. These data have been derived from the annual per capita values in units of pounds per year,
presented by USDA (1999b), by converting to units of g/day.
An advantage of this study is that it provides per capita consumption rates for fruits and vegetables that are representative of long-term intake because disappearance data are generated annually. One of the limitations of this study is that disappearance data do not account for losses from the food supply from waste or spoilage. As a result, intake rates based on these data may overestimate daily consumption because they are based on the total quantity of marketable commodity utilized. Thus, these data represent bounding estimates of intake rates only. It should also be noted that per capita estimates based on food disappearance are not a direct measure of actual consumption or quantity ingested; instead, the data are used as indicators of changes in usage over time (USDA, 1999b). These data are based on older surveys and may not be entirely representative of current consumption patterns.
9.3.2.3. U.S. Department of Agriculture (USDA) (1999a)—Food and Nutrient Intakes by Children 1994−1996, 1998, Table Set 17
USDA (1999a) calculated national probability estimates of food and nutrient intake by children based on four years of the CSFII (1994−1996 and 1998) for children age nine years and under, and on CSFII 1994−1996 only for children age 10 years and over. The CSFII was a series of surveys designed to measure the kinds and amounts of foods eaten by Americans. Intake data, based on 24-hour dietary recall, were collected through in-person interviews on two non-consecutive days. Section 9.3.2.4 provides additional information on these surveys.
USDA (1999a) used sample weights to adjust for non-response, to match the sample to the U.S. population in terms of demographic characteristics, and to equalize intakes over the four quarters of the year and the seven days of the week. A total of 503 breast-fed children were excluded from the estimates, but both consumers and non-consumers were included in the analysis.
USDA (1999a) provided data on the mean per capita quantities (grams) of various food products/groups consumed per individual for one day, and the percent of individuals consuming those foods in one day of the survey. Table 9-10 through Table 9-13 present data on the mean quantities (grams) of fruits and vegetables consumed per individual for one day, and the percentage of survey individuals consuming fruits and vegetables on that survey day. Data on mean intakes or mean percentages are based on respondents’ Day-1 intakes.
Exposure Factors Handbook Page September 2011 9-7
Exposure Factors Handbook
Chapter 9—Intake of Fruits and Vegetables The advantage of the USDA (1999a) study is that
it uses the 1994−1996, 1998 CSFII data set, which includes four years of intake data, combined, and includes the supplemental data on children. These data are expected to be generally representative of the U.S. population, and they include data on a wide variety of fruits and vegetables. The data set is one of a series of USDA data sets that are publicly available. One limitation of this data set is that it is based on 1 day, and short-term dietary data may not accurately reflect long-term eating patterns. Other limitations of this study are that it only provides mean values of food intake rates, consumption is not normalized by body weight, and presentation of results is not consistent with U.S. EPA’s recommended age groups. These data are based on older surveys and may not be entirely representative of current eating patterns.
9.3.2.4. U.S. EPA Analysis of Continuing Survey of Food Intake Among Individuals (CSFII) 1994−1996, 1998 Based on U.S. Department of Agriculture (USDA) (2000) and U.S. EPA (2000)
U.S. EPA/OPP, in cooperation with USDA’s Agricultural Research Service, used data from the 1994−1996, 1998 CSFII to develop the FCID (U.S. EPA, 2000; USDA, 2000), as described in Section 9.3.1.1. The CSFII 1994−1996 was conducted between January 1994 and January 1997 with a target population of non-institutionalized individuals in all 50 states and Washington, DC. In each of the three survey years, data were collected for a nationally representative sample of individuals of all ages. The CSFII 1998 was conducted between December 1997 and December 1998 and surveyed children 9 years of age and younger. It used the same sample design as the CSFII 1994−1996 and was intended to be merged with CSFII 1994−1996 to increase the sample size for children. The merged surveys are designated as CSFII 1994−1996, 1998 (USDA, 2000). Additional information on the CSFII can be obtained at http://www.ars.usda.gov/Services/ docs.htm?docid=14531. The CSFII 1994−1996, 1998 collected dietary
intake data through in-person interviews on 2 non-consecutive days. The data were based on 24-hour recall. A total of 21,662 individuals provided data for the first day; of those individuals, 20,607 provided data for a second day. The 2-day response rate for the 1994−1996 CSFII was approximately 76%. The 2-day response rate for CSFII 1998 was 82%. The CSFII 1994−1996, 1998 surveys were based on a complex multistage area probability sample design. The sampling frame was organized
using 1990 U.S. population census estimates, and the stratification plan took into account geographic location, degree of urbanization, and socioeconomic characteristics. Several sets of sampling weights are available for use with the intake data. By using appropriate weights, data for all four years of the surveys can be combined. USDA recommends that all four years be combined in order to provide an adequate sample size for children.
The fruits and vegetable items/groups selected for the U.S. EPA analysis included total fruits and vegetables, and various individual fruits and vegetables. CSFII data on the foods people reported eating were converted to the quantities of agricultural commodities eaten. Intake rates for these food items/groups were calculated, and summary statistics were generated on both a per capita and a consumer-only basis using the same general methodology as in the U.S. EPA analysis of 2003−2006 NHANES data, as described in Section 9.3.1.1. Because these data were developed for use in U.S. EPA’s pesticide registration program, the childhood age groups used are slightly different than those recommended in U.S. EPA’s Guidance on Selecting Age Groups for Monitoring and Assessing Childhood Exposures to Environmental Contaminants (U.S. EPA, 2005).
Table 9-14 presents per capita intake data for total fruits and total vegetables in g/kg-day; Table 9-15 provides consumer-only intake data for total fruits and total vegetables in g/kg-day. Table 9-16 provides per capita intake data for individual fruits and vegetables, and Table 9-17 provides consumer-only intake data for individual fruits and vegetables. In general, these data represent intake of the edible portions of uncooked foods. Table 9-18 through Table 9-22 present data for exposed/protected fruits and vegetables and root vegetables. These five tables were created using only CSFII 1994−1996. These data represent as-consumed intake rates.
The results are presented in units of g/kg-day. Thus, use of these data in calculating potential dose does not require the body-weight factor to be included in the denominator of the ADD equation. The cautions concerning converting these intake rates into units of g/day by multiplying by a single average body weight and the discussion of the use of short term data in the NHANES description in Section 9.3.1.1, apply to the CSFII estimates as well. A strength of U.S. EPA’s analysis is that it provides distributions of intake rates for various age groups of children and adults, normalized by body weight. The analysis uses the 1994−1996, 1998 CSFII data set, which was designed to be representative of the U.S. population. Also, the data set includes four years of
Page Exposure Factors Handbook September 2011 9-8

Exposure Factors Handbook
Chapter 9—Intake of Fruits and Vegetables
intake data combined and is based on a 2-day survey period. However, as discussed above, short-term dietary data may not accurately reflect long-term eating patterns and may under-represent infrequent consumers of a given food. This is particularly true for the tails (extremes) of the distribution of food intake. Also, the analysis was conducted using slightly different childhood age groups than those recommended in U.S. EPA’s Guidance on Selecting Age Groups for Monitoring and Assessing Childhood Exposures to Environmental Contaminants (U.S. EPA, 2005). However, given the similarities in the age groups used, the data should provide suitable intake estimates for the age groups of interest. While the CSFII data are older than the NHANES data, they provide relevant information on consumption by season, region of the United States, and urbanization, breakdowns that are not available in the publicly released NHANES data.
9.3.2.5. Smiciklas-Wright et al. (2002)—Foods Commonly Eaten in the United States: Quantities Consumed per Eating Occasion and in a Day, 1994−1996
Using data gathered in the 1994−1996 USDA CSFII, Smiciklas-Wright et al. (2002) calculated distributions for the quantities of fruits and vegetables consumed per eating occasion by members of the U.S. population (i.e., serving sizes). The estimates of serving size were based on data obtained from 14,262 respondents, ages 2 years and above, who provided 2 days of dietary intake information. Only dietary intake data from users of the specified food were used in the analysis (i.e., consumer-only data).
Table 9-23 presents serving size data for selected fruits and vegetables, and Table 9-24 presents serving size data by age group. These data are presented on an as-consumed basis (grams) and represent the quantity of fruits and vegetables consumed per eating occasion. These estimates may be useful for assessing acute exposures to contaminants in specific foods, or other assessments where the amount consumed per eating occasion is necessary. Only the mean and standard deviation serving size data and percent of the population consuming the food during the 2-day survey period are presented in this handbook. Percentiles of serving sizes of the foods consumed by these age groups of the U.S. population can be found in Smiciklas-Wright et al. (2002).
The advantages of using these data are that they were derived from the USDA CSFII and are representative of the U.S. population. The analysis conducted by Smiciklas-Wright et al. (2002)
accounted for individual foods consumed as ingredients of mixed foods. Mixed foods were disaggregated via recipe files so that the individual ingredients could be grouped together with similar foods that were reported separately. Thus, weights of foods consumed as ingredients were combined with weights of foods reported separately to provide a more thorough representation of consumption. However, it should be noted that since the recipes for the mixed foods consumed were not provided by the respondents, standard recipes were used. As a result, the estimates of quantity consumed for some food types are based on assumptions about the types and quantities of ingredients consumed as part of mixed foods. This study used data from the 1994 to 1996 CSFII; data from the 1998 children’s supplement were not included.
9.3.2.6. Vitolins et al. (2002)—Quality of Diets Consumed by Older Rural Adults
Vitolins et al. (2002) conducted a survey to evaluate the dietary intake, by food groups, of older (>70 years) rural adults. The sample consisted of 130 community dwelling residents from two rural counties in North Carolina. Data on dietary intake over the preceding year were obtained in face-to-face interviews conducted in participants’ homes, or in a few cases, a senior center. The food frequency questionnaire used in the survey was a modified version of the National Cancer Institute Health Habits and History Questionnaire; this modified version included an expanded food list containing a greater number of ethnic foods than the original food frequency form. Demographic and personal data collected included sex, ethnicity, age, education, denture use, marital status, chronic disease, and weight. Food items reported in the survey were separated into food groups similar to the USDA Food Guide Pyramid and the National Cancer Institute’s 5 A Day for Better Health program. These groups are: (1) fruits and vegetables; (2) bread, cereal, rice, and pasta; (3) milk, yogurt, and cheese; (4) meat, fish, poultry, beans, and eggs; and (5) fats, oils, sweets, and snacks. Medians, ranges, frequencies, and percentages were used to summarize intake of each food group, broken down by demographic and health characteristics. To assess the univariate associations of these characteristics with consumption, Wilcoxon rank-sum tests were used. In addition, multivariate regression models were used to determine which demographic and health factors were jointly predictive of intake of each of the five food groups.
Thirty-four percent of the survey participants were African American, 36% were European
Exposure Factors Handbook Page September 2011 9-9

Exposure Factors Handbook
Chapter 9—Intake of Fruits and Vegetables American, and 30% were Native American. Sixty-two percent were female, 62% were not married at the time of the interview, and 65% had some high school education or were high school graduates. Almost all of the participants (95%) had one or more chronic diseases. Sixty percent of the respondents were between 70 and 79 years of age; the median age was 78 years old. Table 9-25 presents the median servings of fruits and vegetables broken down by demographic and health characteristic. The only variable predictive of fruit and vegetable intake was ethnicity (p = 0.02), with European Americans consuming significantly more than either African Americans or Native Americans. The multiple regression model indicated a statistically significant interaction between sex and ethnicity (p = 0.04) and a significant main effect for chronic disease (p = 0.04) for fruit and vegetable consumption. Among males, European Americans consumed significantly more fruits and vegetables than either African Americans or Native Americans. Men and women did not differ significantly in their fruit and vegetable consumption, except for African Americans, where women had a significantly greater intake (p = 0.01).
An advantage of this study is that dietary information was collected on older individuals (>70 years of age). One limitation of the study, as noted by the study authors, is that the study did not collect information on the length of time the participants had been practicing the dietary behaviors reported in the survey. Also, the survey results are based on dietary recall; the questionnaire required participants to report the frequency of food consumption during the past year. The study authors noted that, currently, there are no dietary assessment tools that allow collecting comprehensive dietary data over years of food consumption. Another limitation of the study is that the small sample size used makes associations by sex and ethnicity difficult.
9.3.2.7. Fox et al. (2004)—Feeding Infants and Toddlers Study: What Foods Are Infants and Toddlers Eating
Fox et al. (2004) used data from the Feeding Infants and Toddlers Study (FITS) to assess food consumption patterns in infants and toddlers. The FITS was sponsored by Gerber Products Company and was conducted to obtain current information on food and nutrient intakes of children, ages 4 to 24 months old, in the 50 states and the District of Columbia. The FITS is described in detail in Devaney et al. (2004). FITS was based on a random sample of 3,022 infants and toddlers for which
dietary intake data were collected by telephone from their parents or caregivers between March and July 2002. An initial recruitment and household interview was conducted, followed by an interview to obtain information on intake based on 24-hour recall. The interview also addressed growth, development, and feeding patterns. A second dietary recall interview was conducted for a subset of 703 randomly selected respondents. The study over-sampled children in the 4 to 6 and 9 to 11 months age groups; sample weights were adjusted for non-response, over-sampling, and under-coverage of some population groups. The response rate for the FITS was 73% for the recruitment interview. Of the recruited households, there was a response rate of 94% for the dietary recall interviews (Devaney et al., 2004). Table 9-26 shows the characteristics of the FITS study population.
Fox et al. (2004) analyzed the first set of 24-hour recall data collected from all study participants. For this analysis, children were grouped into six age categories: 4 to 6 months, 7 to 8 months, 9 to 11 months, 12 to 14 months, 15 to 18 months, and 19 to 24 months. Table 9-27 provides the percentage of infants and toddlers consuming different types of vegetables at least once in a day. The percentages of children eating any type of vegetable ranged from 39.9% for 4 to 6 month olds to 81.6% for 19 to 24 month olds. Table 9-28 provides the top five vegetables consumed by age group. Some of the highest percentages ranged from baby food carrots (9.6%) in the 4 to 6 month old group to French fries (25.5%) in the 19 to 24 month old group. Table 9-29 provides the percentage of children consuming different types of fruit at least once per day. The percentages of children eating any type of fruit ranged from 41.9% to 4 to 6 month olds to 77.2% for 12 to 14 month olds. Table 9-30 provides information on the top five fruits eaten by infants and toddlers at least once per day. The highest percentages were for bananas among infants 9 to 24 months, and baby food applesauce among infants 4 to 8 months old.
The advantages of this study are that the study population represented the U.S. population and the sample size was large. One limitation of the analysis done by Fox et al. (2004) was that only frequency data were provided; no information on actual intake rates was included. In addition, Devaney et al. (2004) noted several limitations associated with the FITS data. For the FITS, a commercial list of infants and toddlers was used to obtain the sample used in the study. Since many of the households could not be located and did not have children in the target population, a lower response rate than would have occurred in a true national sample was obtained
Page Exposure Factors Handbook 9-10 September 2011

Exposure Factors Handbook
Chapter 9—Intake of Fruits and Vegetables
(Devaney et al., 2004). In addition, the sample was likely from a higher socioeconomic status when compared with all U.S. infants in this age group (4 to 24 months old), and the use of a telephone survey may have omitted lower-income households without telephones (Devaney et al., 2004).
9.3.2.8. Ponza et al. (2004)—Nutrient Food Intakes
and Food Choices of Infants and Toddlers Participating in Women, Infants, and Children (WIC)
Ponza et al. (2004) conducted a study using selected data from the FITS to assess feeding patterns, food choices, and nutrient intake of infants and toddlers participating in the Special Supplemental Nutrition Program for Women, Infants, and Children (WIC). Ponza et al. (2004) evaluated FITS data for the following age groups: 4 to 6 months (N = 862), 7 to 11 months (N = 1,159), and 12 to 24 months (N = 996). Table 9-31 shows the total sample size described by WIC participants and non-participants.
The foods consumed were analyzed by tabulating the percentage of infants who consumed specific foods/food groups per day (Ponza et al., 2004). Weighted data were used in all of the analyses used in the study (Ponza et al., 2004). Table 9-31 presents the demographic data for WIC participants and non-participants. Table 9-32 provides information on the food choices for the infants and toddlers studied. There was little difference in vegetable choices among WIC participants and non-participants (see Table 9-32). However, there were some differences for fruits.
An advantage of this study is that it had a relatively large sample size and was representative of the U.S. general population of infants and children. A limitation of the study is that intake values for foods were not provided. Other limitations are those associated with the FITS data, as described previously in Section 9.3.2.7.
9.3.2.9. Fox et al. (2006)—Average Portion of
Foods Commonly Eaten by Infants and Toddlers in the United States
Fox et al. (2006) estimated average portion sizes consumed per eating occasion by children 4 to 24 months of age who participated in the FITS. Section 9.3.2.7 describes the FITS, which is a cross-sectional study designed to collect and analyze data on feeding practices, food consumption, and usual nutrient intake of U.S. infants and toddlers. It included a stratified random sample of 3,022 children between 4 and 24 months of age.
Using the 24-hour recall data, Fox et al. (2006) derived average portion sizes for major food groups, including fruits and vegetables. Average portion sizes for select individual foods within these major groups were also estimated. For this analysis, children were grouped into six age categories: 4 to 5 months, 6 to 8 months, 9 to 11 months, 12 to 14 months, 15 to 18 months, and 19 to 24 months. Table 9-33 and Table 9-34 present the average portion sizes for fruits and vegetables for infants and toddlers, respectively.
An advantage of this study is that it had a relatively large sample size and was representative of the U.S. general population of infants and children. Limitations are those associated with the FITS data, as described previously in Section 9.3.2.7.
9.3.2.10.Mennella et al. (2006)—Feeding Infants and Toddlers Study: The Types of Foods Fed to Hispanic Infants and Toddlers
Mennella et al. (2006) investigated the types of food and beverages consumed by Hispanic infants and toddlers in comparison to the non-Hispanic infants and toddlers in the United States. The FITS 2002 data for children between 4 and 24 months of age were used for the study. The data represent a random sample of 371 Hispanic and 2,367 non-Hispanic infants and toddlers (Mennella et al., 2006). Menella et al. (2006) grouped the infants as follows: 4 to 5 months (N = 84 Hispanic; 538 non-Hispanic), 6 to 11 months (N = 163 Hispanic; 1,228 non-Hispanic), and 12 to 24 months (N = 124 Hispanic; 871 non-Hispanic) of age.
Table 9-35 provides the percentages of Hispanic and non-Hispanic infants and toddlers consuming fruits and vegetables. In most instances, the percentages consuming the different types of fruits and vegetables were similar. However, 4-to-5-monthold Hispanic infants were more likely to eat fruits than non-Hispanic infants in this age group. Table 9-36 provides the top five fruits and vegetables consumed and the percentage of children consuming these foods at least once in a day. Apples and bananas were the foods with the highest percent consuming for both the Hispanic and non-Hispanic study groups. Potatoes and carrots were the vegetables with the highest percentage of infants and toddlers consuming in both study groups.
The advantage of the study is that it provides information on food preferences for Hispanic and non-Hispanic infants and toddlers. A limitation is that the study did not provide food intake data, but provided frequency-of-use data instead. Other limitations are those noted previously in Section 9.3.2.7 for the FITS data.
Exposure Factors Handbook Page September 2011 9-11

Exposure Factors Handbook
Chapter 9—Intake of Fruits and Vegetables 9.4. CONVERSION BETWEEN WET- AND
DRY-WEIGHT INTAKE RATES The intake data presented in this chapter are
reported in units of wet weight (i.e., as-consumed or edible portion uncooked fruits and vegetables consumed per day or per eating occasion). However, data on the concentration of contaminants in fruits and vegetables may be reported in units of either wet or dry weight (e.g., mg contaminant per gram dry weight of fruits and vegetables). It is essential that exposure assessors be aware of this difference so that they may ensure consistency between the units used for intake rates and those used for concentration data (i.e., if the contaminant concentration is measured in dry weight of fruits and vegetables, then the dry-weight units should be used for their intake values).
If necessary, wet-weight (e.g., as-consumed) intake rates may be converted to dry-weight intake rates using the moisture content percentages presented in Table 9-37 (USDA, 2007) and the following equation:
IRdw = IRww 100 −W (Eqn. 9-1) 100
where:
IRdw = dry-weight intake rate, IRww = wet-weight intake rate, and W = percent water content.
Alternatively, dry-weight residue levels in fruits and vegetables may be converted to wet-weight residue levels for use with wet-weight (e.g., as-consumed) intake rates as follows:
Cww = Cdw 100 −W (Eqn. 9-2) 100
where:
Cww = wet-weight concentration, Cdw = dry-weight concentration, and W = percent water content.
Table 9-37 presents moisture data for selected fruits and vegetables taken from USDA (2007).
9.5. REFERENCES FOR CHAPTER 9 Devaney, B; Kalb, L; Briefel, R; Zavitsky-Novak, T;
Clusen, N; Ziegler, P. (2004). Feeding infants and toddlers study: overview of the study design. J Am Diet Assoc 104: s8-13. http://dx.doi.org/10.1016/j.jada.2003.10.023.
Fox, MK; Pac, S; Devaney, B; Jankowski, L. (2004). Feeding infants and toddlers study: What foods are infants and toddlers eating? J Am Diet Assoc 104: s22-s30. http://dx.doi.org/10.1016/j.jada.2003.10.026.
Fox, MK; Reidy, K; Karwe, V; Ziegler, P. (2006). Average portions of foods commonly eaten by infants and toddlers in the United States. J Am Diet Assoc 106: S66-S76. http://dx.doi.org/10.1016/j.jada.2005.09.042.
Mennella, JA; Ziegler, P; Briefel, R; Novak, T. (2006). Feeding Infants and Toddlers Study: the types of foods fed to Hispanic infants and toddlers. J Am Diet Assoc 106: S96106. http://dx.doi.org/10.1016/j.jada.2005.09.038.
NCHS (National Center for Health Statistics). (1993). Joint policy on variance estimation and statistical reporting standards on NHANES III and CSFII reports: HNIS/NCHS Analytic Working Group recommendations. Riverdale, MD: Human Nutrition Information Service (HNIS)/Analytic Working Group. Agricultural Research Service, Survey Systems/Food Consumption Laboratory.
Ponza, M; Devaney, B; Ziegler, P; Reidy, K; Squatrito, C. (2004). Nutrient intakes and food choices of infants and toddlers participating in WIC. J Am Diet Assoc 104: s71-s79. http://dx.doi.org/10.1016/j.jada.2003.10.018.
Smiciklas-Wright, H; Mitchell, DC; Mickle, SJ; Cook, AJ; Goldman, JD. (2002). Foods commonly eaten in the United States: Quantities consumed per eating occasion and in a day, 1994−96 [pre-publication version]. (NFS Report No. 96-5). Beltsville, MD: U.S. Department of Agriculture. http://www.ars.usda.gov/sp2userfiles/place/1 2355000/pdf/portion.pdf.
U.S. EPA (U.S. Environmental Protection Agency). (2000). Food commodity intake database [Database].
Page Exposure Factors Handbook 9-12 September 2011

Exposure Factors Handbook
Chapter 9—Intake of Fruits and Vegetables
U.S. EPA (U.S. Environmental Protection Agency). (2005). Guidance on selecting age groups for monitoring and assessing childhood exposures to environmental contaminants (final). (EPA/630/P-03/003F). Washington, DC: U.S. Environmental Protection Agency, Risk Assessment Forum. http://www.epa.gov/raf/publications/guidanc e-on-selecting-age-groups.htm.
USDA (U.S. Department of Agriculture). (1980). Food and nutrient intakes of individuals in 1 day in the United States, Spring 1977. Nationwide Food Consumption Survey 1977–78: Preliminary report no. 2. Washington, DC. http://www.ars.usda.gov/SP2UserFiles/Place /12355000/pdf/7778/nfcs7778_prelim_2.pdf .
USDA (U.S. Department of Agriculture). (1993). Food and nutrient intakes by individuals in the United States, 1 day, 1987–88. Nationwide Food Consumption Survey 1987-88: Report no. 87-I-1. (87-I-1). Washington, DC. http://www.ars.usda.gov/SP2UserFiles/Place /12355000/pdf/8788/nfcs8788_rep_87-i1.pdf.
USDA (U.S. Department of Agriculture). (1996a). Data tables: Results from USDA's 1994 continuing survey of food intakes by individuals and 1994 diet and health knowledge survey. Riverdale, MD.
USDA (U.S. Department of Agriculture). (1996b). Data tables: results from USDA’s 1995 Continuing survey of food intakes by individuals and 1995 diet and health knowledge survey. Riverdale, MD.
USDA (U.S. Department of Agriculture). (1999a). Food and nutrient intakes by children 199496, 1998: table set 17. Beltsville, MD. http://www.ars.usda.gov/SP2UserFiles/Place /12355000/pdf/scs_all.pdf.
USDA (U.S. Department of Agriculture). (1999b). Food consumption prices and expenditures (1970−1997). Statistical Bulletin, No. 965. Washington, DC: Economic Research Service.
USDA (U.S. Department of Agriculture). (2000). 1994-1996, 1998 continuing survey of food intakes by individuals (CSFII). Beltsville, MD: Agricultural Research Service, Beltsville Human Nutrition Research Center.
USDA (U.S. Department of Agriculture). (2007). USDA nutrient database for standard reference, release 20. Riverdale, MD. http://www.ars.usda.gov/main/site_main.htm ?modecode=12-35-45-00.
Vitolins, MZ; Quandt, SA; Bell, RA; Arcury, TA; Case, LD. (2002). Quality of diets consumed by older rural adults. J Rural Health 18: 4956.
Exposure Factors Handbook Page September 2011 9-13
Exposure F
actors Handbook
Chapter 9—
Intake of Fruits and Vegetables
Table 9-3. Per Capita Intake of Fruits and Vegetables Based on the 2003−2006 NHANES (g/kg-day, edible portion, uncooked weight) Percent
Consuming Percentiles
Population Group N Mean SE 1st 5th 10th 25th 50th 75th 90th 95th 99th Max Fruits
Whole Population 16,783 85 1.6 0.05 0.0 0.0 0.0 0.0 0.7 2.0 4.0 6.1 14.6 65.6* Age Group
Birth to 1 year 865 61 6.2 0.46 0.0* 0.0* 0.0 0.0 2.2 10.2 17.6 23.0* 35.9* 56.5* 1 to 2 years 1,052 97 7.8 0.42 0.0* 0.0* 0.2 2.2 5.6 11.7 16.8 21.3* 39.3* 65.6* 3 to 5 years 978 97 4.6 0.25 0.0* 0.0 0.0 0.9 3.2 6.6 11.1 14.9 20.0* 32.1* 6 to 12 years 2,256 93 2.3 0.12 0.0* 0.0 0.0 0.1 1.3 3.2 6.4 8.7 13.8* 24.4* 13 to 19 years 3,450 80 0.9 0.04 0.0 0.0 0.0 0.0 0.2 1.3 2.6 3.5 6.1 16.7* 20 to 49 years 4,289 81 0.9 0.04 0.0 0.0 0.0 0.0 0.3 1.3 2.6 3.7 6.2 15.9* Female 13 to 49 years 4,103 85 1.0 0.05 0.0 0.0 0.0 0.0 0.4 1.4 2.8 3.7 6.4 16.7* 50 years and older 3,893 89 1.4 0.05 0.0 0.0 0.0 0.1 0.9 2.0 3.4 4.4 6.5 17.3*
Race Mexican American 4,450 87 2.3 0.11 0.0 0.0 0.0 0.1 1.1 2.7 5.8 9.6 18.3 39.2* Non-Hispanic Black 4,265 82 1.2 0.06 0.0 0.0 0.0 0.0 0.2 1.3 3.2 5.0 12.4 39.1* Non-Hispanic White 6,757 85 1.5 0.05 0.0 0.0 0.0 0.0 0.7 1.9 3.8 5.5 14.0 65.6* Other Hispanic 562 87 2.1 0.20 0.0* 0.0 0.0 0.0 1.0 2.8 4.9 7.1 19.5* 32.7* Other Race—Including Multiple 749 89 2.0 0.13 0.0* 0.0 0.0 0.1 0.9 2.6 5.2 8.6 15.3* 42.1*
Vegetables Whole Population 16,783 100 2.9 0.04 0.0 0.4 0.7 1.3 2.3 3.7 5.7 7.5 13.2 36.1* Age Group
Birth to 1 year 865 73 5.0 0.28 0.0* 00* 0.0 0.0 3.3 8.7 12.9 16.2* 22.7* 36.1* 1 to 2 years 1,052 100 6.7 0.26 0.0* 1.0* 1.6 3.0 5.7 8.9 13.3 15.6* 28.7* 32.8* 3 to 5 years 978 100 5.4 0.25 0.1* 0.6 1.5 2.3 4.2 7.2 10.6 13.4 21.4* 30.3* 6 to 12 years 2,256 100 3.7 0.18 0.1* 0.5 0.9 1.5 2.8 4.8 7.6 10.4 14.8* 23.1* 13 to 19 years 3,450 100 2.3 0.05 0.0 0.3 0.5 1.1 1.8 3.0 4.3 5.5 8.9 20.0* 20 to 49 years 4,289 100 2.5 0.06 0.1 0.4 0.7 1.3 2.2 3.3 4.9 5.9 8.6 18.3* Female 13 to 49 years 4,103 100 2.5 0.08 0.1 0.4 0.6 1.2 2.0 3.3 4.7 5.9 8.9 18.3* 50 years and older 3,893 100 2.6 0.05 0.0 0.4 0.7 1.3 2.2 3.4 4.9 6.1 9.1 22.6*
Race Mexican American 4,450 99 3.2 0.06 0.0 0.5 0.8 1.5 2.5 4.1 6.4 8.6 13.5 36.1* Non-Hispanic Black 4,265 100 2.4 0.05 0.0 0.2 0.5 0.9 1.7 3.0 4.7 6.5 11.5 30.3* Non-Hispanic White 6,757 100 2.9 0.05 0.0 0.4 0.7 1.4 2.3 3.7 5.6 7.2 12.8 29.5* Other Hispanic 562 99 3.1 0.16 0.0* 0.2 0.7 1.2 2.2 3.8 6.3 9.4 16.3* 26.2* Other Race—Including Multiple 749 100 3.4 0.20 0.1* 0.4 0.7 1.5 2.7 4.2 6.8 9.3 15.6* 32.8*
N = Sample size. SE = Standard error. Max = Maximum value. * Estimates are less statistically reliable based on guidance published in the Joint Policy on Variance Estimation and Statistical Reporting Standards on NHANES III
and CSFII Reports: NHIS/NCHS Analytical Working Group Recommendations (NCHS, 1993). Source: U.S. EPA analysis of the 2003−2006 NHANES.
Page E
xposure Factors H
andbook 9-14
September 2011
Exposure F
actors Handbook
Chapter 9—
Intake of Fruits and Vegetables
Table 9-4. Consumer-Only Intake of Fruits and Vegetables Based on the 2003−2006 NHANES (g/kg-day, edible portion, uncooked weight) Percentiles
Population Group N Mean SE 1st 5th 10th 25th 50th 75th 90th 95th 99th Max Fruits
Whole Population 14,362 1.9 0.05 0.0 0.0 0.0 0.2 1.0 2.3 4.4 6.7 15.2 65.6* Age Group
Birth to 1 year 536 10.1 0.59 0.0* 0.3* *0.8 3.6 8.1 14.7 21.2* 25.8* 43.7* 56.5* 1 to 2 years 1,002 8.1 0.43 0.0* 0.1* 0.5 2.6 6.2 11.8 16.8 21.4* 39.3* 65.6* 3 to 5 years 924 4.7 0.24 0.0* 0.0 0.1 1.1 3.5 6.7 11.3 15.1 20.0* 32.1* 6 to 12 years 2,077 2.5 0.12 0.0* 0.0 0.0 0.2 1.6 3.4 6.6 9.2 14.5* 24.4* 13 to 19 years 2,830 1.1 0.04 0.0 0.0 0.0 0.0 0.7 1.6 2.9 3.8 6.2 16.7* 20 to 49 years 3,529 1.1 0.05 0.0 0.0 0.0 0.1 0.6 1.6 2.9 3.8 6.7 15.9* Female 13 to 49 years 3,508 1.2 0.06 0.0 0.0 0.0 0.1 0.7 1.7 3.1 4.1 6.5 16.7* 50 years and older 3,464 1.5 0.05 0.0 0.0 0.0 0.4 1.1 2.2 3.6 4.6 6.7 17.3*
Race Mexican American 3,835 2.6 0.12 0.0 0.0 0.0 0.4 1.4 3.0 6.3 10.6 19.3 39.2* Non-Hispanic Black 3,595 1.4 0.07 0.0 0.0 0.0 0.0 0.6 1.7 3.8 5.7 12.9 39.1* Non-Hispanic White 5,795 1.8 0.05 0.0 0.0 0.0 0.2 1.0 2.2 4.1 6.1 14.5 65.6* Other Hispanic 478 2.5 0.23 0.0* 0.0 0.0 0.3 1.5 3.0 5.0 8.6 19.5* 32.7* Other Race—Including
Multiple 659 2.3 0.16 0.0* 0.0 0.0 0.2 1.1 2.8 6.0 9.4 15.3* 42.1* Vegetables
Whole Population 16,531 2.9 0.04 0.0 0.4 0.7 1.3 2.3 3.7 5.7 7.5 13.2 36.1* Age Group
Birth to 1 year 623 6.8 0.33 0.0* 0.1* 0.4* 2.6 5.5 10.1 14.5* 18.1* 22.7* 36.1* 1 to 2 years 1,048 6.7 0.26 0.0* 1.0* 1.7 3.0 5.7 8.9 13.3 15.6* 28.7* 32.8* 3 to 5 years 977 5.4 0.25 0.1* 0.6 1.5 2.3 4.2 7.2 10.6 13.4 21.4* 30.3* 6 to 12 years 2,256 3.7 0.18 0.1* 0.5 0.9 1.5 2.8 4.8 7.6 10.4 14.8* 23.1* 13 to 19 years 3,447 2.3 0.05 0.0 0.3 0.5 1.1 1.8 3.0 4.3 5.5 8.9 20.0* 20 to 49 years 4,288 2.5 0.06 0.1 0.4 0.7 1.3 2.2 3.3 4.9 5.9 8.6 18.3* Female 13 to 49 years 4,102 2.5 0.08 0.1 0.4 0.6 1.2 2.0 3.3 4.7 5.9 8.9 18.3* 50 years and older 3,892 2.6 0.05 0.0 0.4 0.7 1.3 2.2 3.4 4.9 6.1 9.1 22.6*
Race Mexican American 4,341 3.3 0.06 0.1 0.5 0.8 1.5 2.5 4.1 6.4 8.6 13.5 36.1* Non-Hispanic Black 4,228 2.4 0.05 0.0 0.3 0.5 0.9 1.7 3.0 4.7 6.5 11.5 30.3* Non-Hispanic White 6,683 2.9 0.05 0.1 0.4 0.7 1.4 2.3 3.7 5.6 7.2 12.8 29.5* Other Hispanic 544 3.1 0.16 0.1* 0.3 0.7 1.3 2.2 3.8 6.4 9.4 16.3* 26.2* Other Race—Including
Multiple 735 3.4 0.21 0.2* 0.4 0.7 1.5 2.7 4.3 6.9 9.3 15.6* 32.8* N = Sample size. SE = Standard error. Max = Maximum value. * Estimates are less statistically reliable based on guidance published in the Joint Policy on Variance Estimation and Statistical Reporting Standards on NHANES III and CSFII
Reports: NHIS/NCHS Analytical Working Group Recommendations (NCHS, 1993). Source: U.S. EPA analysis of the 2003−2006 NHANES.
Exposure F
actors Handbook
Page Septem
ber 2011 9-15

Exposure F
actors Handbook
Chapter 9—
Intake of Fruits and Vegetables
Table 9-5. Per Capita Intake of Individual Fruits and Vegetables Based on the 2003−2006 NHANES (g/kg-day, edible portion, uncooked weight)
Population Group N Percent
Consuming Mean SE Percent
Consuming Mean SE Percent
Consuming Mean SE Percent
Consuming Mean SE
Apples Asparagus Bananas Beans
Whole Population 16,783
Age Group
33 0.41 0.01 2 0.01 0.00 55 0.37 0.01 45 0.24 0.01
Birth to 1 year 865 39 2.23 0.24 1 0.00 0.00 46 1.83 0.19 30 0.54 0.06
1 to 2 years 1,052 50 1.96 0.14 2 0.03 0.01 77 2.35 0.26 49 0.69 0.06
3 to 5 years 978 42 1.21 0.10 1 0.01 0.01 73 1.00 0.09 43 0.61 0.07
6 to 12 years 2,256 39 0.74 0.06 1 0.01 0.00 68 0.42 0.04 37 0.30 0.03
13 to 19 years 3,450 27 0.27 0.02 1 0.00 0.00 50 0.15 0.01 31 0.13 0.01
20 to 49 years 4,289 28 0.21 0.02 2 0.01 0.00 48 0.20 0.01 46 0.19 0.01
Female 13 to 49 years 4,103 29 0.23 0.02 2 0.01 0.00 50 0.20 0.01 45 0.17 0.01
50 years and older 3,893
Race
38 0.28 0.02 3 0.02 0.00 58 0.33 0.02 51 0.22 0.01
Mexican American 4,450 33 0.58 0.03 1 0.00 0.00 56 0.56 0.04 59 0.32 0.01
Non-Hispanic Black 4,265 27 0.31 0.02 0 0.00 0.00 55 0.25 0.02 43 0.25 0.01
Non-Hispanic White 6,757 35 0.40 0.02 3 0.02 0.00 54 0.36 0.02 43 0.22 0.01
Other Hispanic 562 32 0.47 0.06 1 0.00 0.00 55 0.53 0.06 58 0.25 0.03
Other Race—Including Multiple 749 32 0.47 0.04 3 0.01 0.00 58 0.43 0.04 50 0.30 0.04
Page E
xposure Factors H
andbook 9-16
September 2011

Exposure F
actors Handbook
Chapter 9—
Intake of Fruits and Vegetables
Table 9-5. Per Capita Intake of Individual Fruits and Vegetables Based on the 2003−2006 (g/kg-day, edible portion, uncooked weight) (continued)
Population Group N Percent
Consuming Mean SE Percent
Consuming Mean SE Percent
Consuming Mean SE Percent
Consuming Mean SE
Beets Berries and Small Fruit Broccoli Bulb Vegetables
Whole Population 16,783
Age Group
3 0.01 0.00 67 0.30 0.01 15 0.10 0.01 97 0.18 0.00
Birth to 1 year 865 5 0.00 0.00 19 0.24 0.09 6 0.07 0.02 39 0.07 0.01
1 to 2 years 1,052 1 0.00 0.00 83 1.46 0.14 16 0.30 0.06 94 0.28 0.02
3 to 5 years 978 1 0.01 0.01 84 0.97 0.11 12 0.19 0.04 96 0.28 0.02
6 to 12 years 2,256 0 0.00 0.00 80 0.46 0.04 11 0.10 0.02 98 0.21 0.02
13 to 19 years 3,450 1 0.00 0.00 64 0.19 0.01 9 0.05 0.01 98 0.15 0.01
20 to 49 years 4,289 2 0.01 0.00 62 0.17 0.01 16 0.09 0.01 98 0.19 0.01
Female 13 to 49 years 4,103 2 0.01 0.00 67 0.20 0.01 17 0.09 0.01 97 0.16 0.01
50 years and older 3,893
Race
5 0.01 0.00 71 0.28 0.02 16 0.09 0.01 97 0.16 0.00
Mexican American 4,450 1 0.00 0.00 59 0.23 0.02 12 0.07 0.01 96 0.27 0.01
Non-Hispanic Black 4,265 1 0.00 0.00 64 0.18 0.01 12 0.07 0.01 96 0.13 0.01
Non-Hispanic White 6,757 4 0.01 0.00 69 0.33 0.02 15 0.10 0.01 97 0.17 0.00
Other Hispanic 562 3 0.00 0.00 59 0.30 0.05 16 0.13 0.04 93 0.23 0.01
Other Race—Including Multiple 749 1 0.00 0.00 66 0.38 0.06 19 0.13 0.03 97 0.25 0.02
Exposure F
actors Handbook
Page Septem
ber 2011 9-17

Exposure F
actors Handbook
Chapter 9—
Intake of Fruits and Vegetables
Table 9-5. Per Capita Intake of Individual Fruits and Vegetables Based on the 2003−2006 (g/kg-day, edible portion, uncooked weight) (continued)
Population Group N Percent
Consuming Mean SE Percent
Consuming Mean SE Percent
Consuming Mean SE Percent
Consuming Mean SE
Cabbage Carrots Citrus Fruits Corn
Whole Population 16,783
Age Group
13 0.05 0.00 47 0.14 0.00 20 0.16 0.01 96 0.43 0.01
Birth to 1 year 865 1 0.01 0.01 15 0.17 0.05 2 0.05 0.02 56 0.62 0.10
1 to 2 years 1,052 7 0.05 0.02 50 0.47 0.04 25 0.65 0.08 97 1.13 0.05
3 to 5 years 978 5 0.04 0.01 45 0.32 0.05 18 0.46 0.06 100 1.26 0.07
6 to 12 years 2,256 7 0.04 0.01 43 0.21 0.03 15 0.21 0.02 99 0.88 0.03
13 to 19 years 3,450 6 0.02 0.00 35 0.08 0.01 13 0.08 0.01 96 0.37 0.01
20 to 49 years 4,289 13 0.05 0.01 46 0.11 0.01 20 0.11 0.01 96 0.32 0.01
Female 13 to 49 years 4,103 12 0.05 0.01 46 0.11 0.01 21 0.11 0.01 96 0.31 0.01
50 years and older 3,893
Race
18 0.08 0.00 54 0.12 0.01 25 0.14 0.01 96 0.27 0.01
Mexican American 4,450 10 0.03 0.00 45 0.15 0.01 27 0.37 0.03 96 0.78 0.03
Non-Hispanic Black 4,265 12 0.06 0.01 36 0.08 0.01 16 0.17 0.03 96 0.46 0.02
Non-Hispanic White 6,757 13 0.05 0.00 49 0.14 0.01 20 0.12 0.01 97 0.37 0.01
Other Hispanic 562 9 0.03 0.01 49 0.17 0.02 23 0.26 0.03 94 0.45 0.05
Other Race—Including Multiple 749 17 0.12 0.02 52 0.23 0.02 21 0.20 0.05 91 0.41 0.03
Page E
xposure Factors H
andbook 9-18
September 2011

Exposure F
actors Handbook
Chapter 9—
Intake of Fruits and Vegetables
Table 9-5. Per Capita Intake of Individual Fruits and Vegetables Based on the 2003−2006 (g/kg-day, edible portion, uncooked weight) (continued)
Population Group N Percent
Consuming Mean SE Percent
Consuming Mean SE Percent
Consuming Mean SE Percent
Consuming Mean SE
Cucumbers Cucurbits Fruiting Vegetables Leafy Vegetables
Whole Population 16,783
Age Group
40 0.09 0.00 48 0.34 0.03 95 0.80 0.02 92 0.54 0.01
Birth to 1 year 865 3 0.02 0.01 20 0.64 0.09 31 0.30 0.05 40 0.22 0.04
1 to 2 years 1,052 24 0.14 0.02 37 1.01 0.18 93 1.45 0.07 82 0.71 0.07
3 to 5 years 978 26 0.19 0.03 36 0.66 0.08 95 1.53 0.08 87 0.61 0.06
6 to 12 years 2,256 30 0.11 0.01 38 0.56 0.11 97 1.05 0.05 90 0.43 0.02
13 to 19 years 3,450 34 0.06 0.01 40 0.20 0.02 96 0.75 0.03 89 0.35 0.01
20 to 49 years 4,289 45 0.09 0.01 52 0.26 0.03 97 0.76 0.02 94 0.55 0.02
Female 13 to 49 years 4,103 44 0.10 0.01 51 0.30 0.04 96 0.70 0.03 93 0.58 0.03
50 years and older 3,893
Race
43 0.08 0.01 54 0.31 0.02 95 0.66 0.03 93 0.60 0.02
Mexican American 4,450 30 0.07 0.01 42 0.27 0.02 96 1.13 0.03 90 0.40 0.02
Non-Hispanic Black 4,265 37 0.06 0.01 42 0.18 0.02 94 0.62 0.03 90 0.46 0.02
Non-Hispanic White 6,757 43 0.10 0.01 51 0.37 0.03 96 0.78 0.02 92 0.56 0.02
Other Hispanic 562 33 0.09 0.02 41 0.25 0.05 92 0.97 0.06 90 0.48 0.05
Other Race—Including Multiple 749 38 0.11 0.03 47 0.44 0.14 92 0.75 0.04 91 0.69 0.07
Exposure F
actors Handbook
Page Septem
ber 2011 9-19
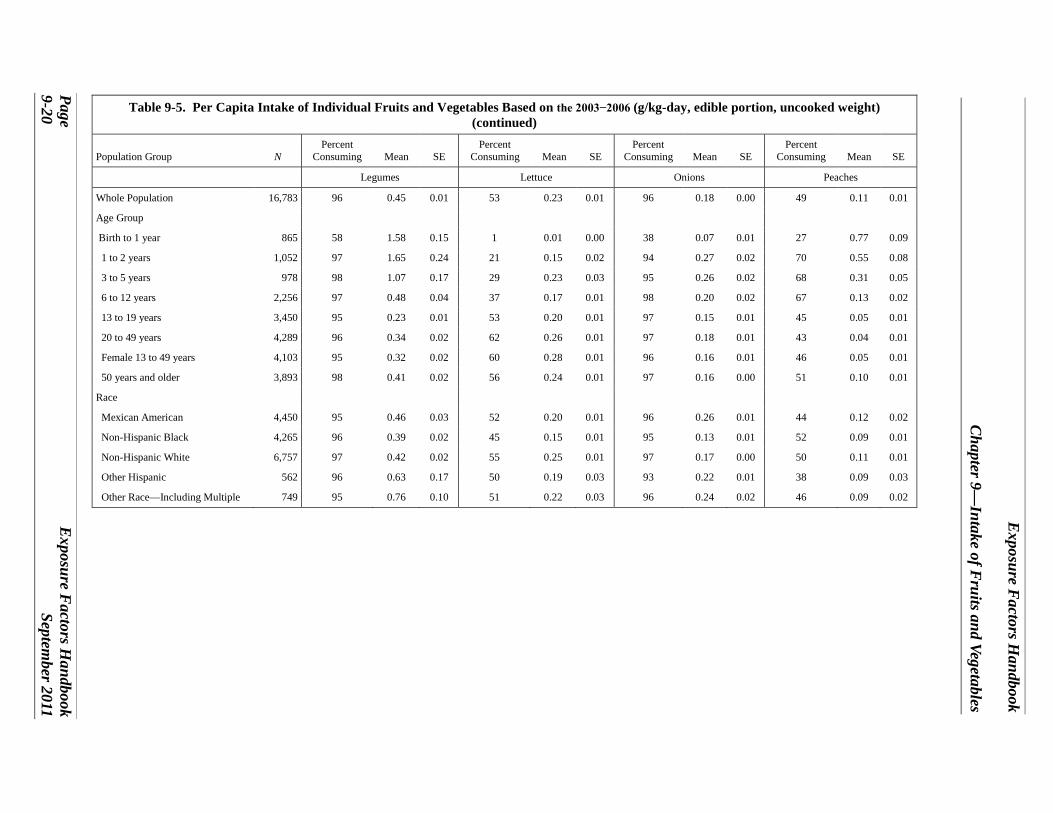
Exposure F
actors Handbook
Chapter 9—
Intake of Fruits and Vegetables
Table 9-5. Per Capita Intake of Individual Fruits and Vegetables Based on the 2003−2006 (g/kg-day, edible portion, uncooked weight) (continued)
Population Group N Percent
Consuming Mean SE Percent
Consuming Mean SE Percent
Consuming Mean SE Percent
Consuming Mean SE
Legumes Lettuce Onions Peaches
Whole Population 16,783
Age Group
96 0.45 0.01 53 0.23 0.01 96 0.18 0.00 49 0.11 0.01
Birth to 1 year 865 58 1.58 0.15 1 0.01 0.00 38 0.07 0.01 27 0.77 0.09
1 to 2 years 1,052 97 1.65 0.24 21 0.15 0.02 94 0.27 0.02 70 0.55 0.08
3 to 5 years 978 98 1.07 0.17 29 0.23 0.03 95 0.26 0.02 68 0.31 0.05
6 to 12 years 2,256 97 0.48 0.04 37 0.17 0.01 98 0.20 0.02 67 0.13 0.02
13 to 19 years 3,450 95 0.23 0.01 53 0.20 0.01 97 0.15 0.01 45 0.05 0.01
20 to 49 years 4,289 96 0.34 0.02 62 0.26 0.01 97 0.18 0.01 43 0.04 0.01
Female 13 to 49 years 4,103 95 0.32 0.02 60 0.28 0.01 96 0.16 0.01 46 0.05 0.01
50 years and older 3,893
Race
98 0.41 0.02 56 0.24 0.01 97 0.16 0.00 51 0.10 0.01
Mexican American 4,450 95 0.46 0.03 52 0.20 0.01 96 0.26 0.01 44 0.12 0.02
Non-Hispanic Black 4,265 96 0.39 0.02 45 0.15 0.01 95 0.13 0.01 52 0.09 0.01
Non-Hispanic White 6,757 97 0.42 0.02 55 0.25 0.01 97 0.17 0.00 50 0.11 0.01
Other Hispanic 562 96 0.63 0.17 50 0.19 0.03 93 0.22 0.01 38 0.09 0.03
Other Race—Including Multiple 749 95 0.76 0.10 51 0.22 0.03 96 0.24 0.02 46 0.09 0.02
Page E
xposure Factors H
andbook 9-20
September 2011

Exposure F
actors Handbook
Chapter 9—
Intake of Fruits and Vegetables
Table 9-5. Per Capita Intake of Individual Fruits and Vegetables Based on the 2003−2006 (g/kg-day, edible portion, uncooked weight) (continued)
Population Group N Percent
Consuming Mean SE Percent
Consuming Mean SE Percent
Consuming Mean SE Percent
Consuming Mean SE
Pears Peas Pome Fruit Pumpkins
Whole Population 16,783
Age Group
10 0.09 0.01 19 0.07 0.00 38 0.50 0.02 2 0.00 0.00
Birth to 1 year 865 19 0.70 0.10 36 0.66 0.07 45 2.94 0.29 0 0.00 0.00
1 to 2 years 1,052 25 0.44 0.07 27 0.29 0.04 61 2.40 0.15 0 0.01 0.01
3 to 5 years 978 25 0.32 0.06 17 0.17 0.02 54 1.53 0.11 0 0.00 0.00
6 to 12 years 2,256 17 0.13 0.02 13 0.06 0.01 48 0.87 0.06 1 0.01 0.00
13 to 19 years 3,450 8 0.03 0.00 13 0.04 0.01 31 0.30 0.02 1 0.00 0.00
20 to 49 years 4,289 6 0.04 0.01 18 0.05 0.00 31 0.25 0.02 2 0.00 0.00
Female 13 to 49 years 4,103 8 0.04 0.01 18 0.05 0.00 32 0.28 0.02 2 0.00 0.00
50 years and older 3,893
Race
9 0.07 0.01 23 0.07 0.00 42 0.35 0.02 3 0.00 0.00
Mexican American 4,450 10 0.13 0.02 15 0.05 0.01 39 0.71 0.04 5 0.01 0.00
Non-Hispanic Black 4,265 9 0.05 0.01 20 0.08 0.01 31 0.36 0.02 0 0.00 0.00
Non-Hispanic White 6,757 10 0.08 0.01 19 0.07 0.00 39 0.48 0.02 2 0.00 0.00
Other Hispanic 562 8 0.07 0.02 19 0.07 0.02 35 0.54 0.08 4 0.01 0.01
Other Race—Including Multiple 749 11 0.16 0.05 27 0.13 0.02 36 0.63 0.06 2 0.00 0.00
Exposure F
actors Handbook
Page Septem
ber 2011 9-21

Exposure F
actors Handbook
Chapter 9—
Intake of Fruits and Vegetables
Table 9-5. Per Capita Intake of Individual Fruits and Vegetables Based on the 2003−2006 (g/kg-day, edible portion, uncooked weight) (continued)
Population Group N Percent
Consuming Mean SE Percent
Consuming Mean SE Percent
Consuming Mean SE Percent
Consuming Mean SE
Root Tuber Vegetables Stalk/Stem Vegetables Stone Fruit Strawberries
Whole Population 16,783
Age Group
99 1.15 0.02 19 0.05 0.00 52 0.16 0.01 41 0.10 0.01
Birth to 1 year 865 69 2.66 0.19 3 0.01 0.00 32 0.94 0.11 10 0.06 0.03
1 to 2 years 1,052 100 3.15 0.13 13 0.07 0.02 72 0.67 0.08 52 0.36 0.06
3 to 5 years 978 100 2.60 0.16 10 0.05 0.02 72 0.41 0.06 53 0.27 0.05
6 to 12 years 2,256 100 1.79 0.07 11 0.03 0.00 68 0.21 0.03 50 0.14 0.03
13 to 19 years 3,450 100 0.99 0.04 12 0.02 0.00 47 0.08 0.01 35 0.07 0.01
20 to 49 years 4,289 100 0.89 0.03 24 0.05 0.00 46 0.08 0.01 36 0.06 0.01
Female 13 to 49 years 4,103 100 0.87 0.02 21 0.04 0.00 49 0.09 0.01 39 0.07 0.01
50 years and older 3,893
Race
100 0.91 0.03 21 0.05 0.01 55 0.17 0.02 45 0.10 0.01
Mexican American 4,450 99 1.17 0.04 12 0.02 0.00 47 0.18 0.03 34 0.07 0.01
Non-Hispanic Black 4,265 99 1.09 0.03 12 0.02 0.00 54 0.13 0.01 29 0.04 0.01
Non-Hispanic White 6,757 100 1.14 0.03 21 0.06 0.00 54 0.17 0.01 44 0.11 0.01
Other Hispanic 562 98 1.24 0.09 15 0.03 0.01 41 0.13 0.03 33 0.09 0.02
Other Race—Including Multiple 749 99 1.35 0.08 27 0.06 0.01 49 0.13 0.03 36 0.10 0.02
Page E
xposure Factors H
andbook 9-22
September 2011

Exposure F
actors Handbook
Chapter 9—
Intake of Fruits and Vegetables
Table 9-5. Per Capita Intake of Individual Fruits and Vegetables Based on the 2003−2006 (g/kg-day, edible portion, uncooked weight) (continued)
Population Group N Percent
Consuming Mean SE Percent
Consuming Mean SE Percent
Consuming Mean SE Percent
Consuming Mean SE
Tomatoes Tropical Fruits White Potatoes
Whole Population 16,783
Age Group
87 0.72 0.02 66 0.46 0.02 91 0.65 0.02
Birth to 1 year 865 26 0.29 0.04 48 1.97 0.20 46 0.52 0.08
1 to 2 years 1,052 83 1.40 0.07 83 2.65 0.28 94 1.74 0.10
3 to 5 years 978 85 1.46 0.08 81 1.19 0.09 94 1.38 0.15
6 to 12 years 2,256 91 0.99 0.04 75 0.52 0.04 93 0.96 0.07
13 to 19 years 3,450 89 0.69 0.03 59 0.22 0.02 92 0.61 0.03
20 to 49 years 4,289 89 0.66 0.02 61 0.27 0.02 91 0.54 0.02
Female 13 to 49 years 4,103 88 0.62 0.02 64 0.28 0.02 90 0.50 0.02
50 years and older 3,893
Race
84 0.59 0.03 68 0.40 0.02 93 0.54 0.03
Mexican American 4,450 91 0.99 0.03 70 0.73 0.05 87 0.65 0.03
Non-Hispanic Black 4,265 84 0.57 0.02 64 0.32 0.03 91 0.64 0.03
Non-Hispanic White 6,757 87 0.71 0.02 65 0.42 0.02 93 0.65 0.03
Other Hispanic 562 86 0.90 0.05 71 0.86 0.09 86 0.66 0.08
Other Race—Including Multiple 749 82 0.66 0.03 68 0.59 0.04 87 0.69 0.06
N = Sample size. SE = Standard error. Note: Data for fruits and vegetables for which only small percentages of the population reported consumption may be less reliable than data for fruits and vegetables with higher
percentages consuming.
Source: U.S. EPA analysis of the 2003−2006 NHANES.
Exposure F
actors Handbook
Page Septem
ber 2011 9-23

Exposure F
actors Handbook
Chapter 9—
Intake of Fruits and Vegetables
Table 9-6. Consumer-Only Intake of Individual Fruits and Vegetables Based on the 2003−2006 NHANES (g/kg-day, edible portion, uncooked weight)
Population Group N Mean SE N Mean SE N Mean SE N Mean SE N Mean SE
Whole Population
Age Group
Apples Asparagus Bananas Beans Beets
5,743 1.23 0.03 204 0.63 0.05 9,644 0.68 0.02 7,635 0.53 0.01 353 0.29 0.04
Birth to 1 year 318 5.79 0.38 1 0.21 -- 396 3.97 0.31 235 1.80 0.20 30 0.01 0.00
1 to 2 years 508 3.95 0.23 8 1.61 0.15 795 3.04 0.34 530 1.41 0.10 12 0.00 0.00
3 to 5 years 432 2.91 0.21 5 0.77 0.31 716 1.37 0.12 461 1.42 0.13 11 0.97 0.63
6 to 12 years 837 1.88 0.12 15 0.60 0.15 1,553 0.61 0.05 936 0.79 0.05 8 0.78 0.33
13 to 19 years 938 1.00 0.05 13 0.26 0.06 1,817 0.31 0.02 1,264 0.41 0.02 20 0.10 0.03
20 to 49 years 1,233 0.75 0.04 61 0.50 0.07 2,142 0.41 0.03 2,141 0.41 0.01 81 0.30 0.09
Female 13 to 49 years 1,195 0.81 0.05 41 0.42 0.07 2,215 0.39 0.03 1,845 0.39 0.01 58 0.39 0.13
50 years and older
Race
1,477 0.75 0.03 101 0.73 0.06 2,225 0.58 0.02 2,068 0.43 0.01 191 0.28 0.05
Mexican American 1,601 1.72 0.09 18 0.44 0.08 2,490 1.00 0.05 2,482 0.54 0.02 55 0.07 0.04
Non-Hispanic Black 1,228 1.16 0.05 14 0.57 0.13 2,533 0.46 0.04 1,722 0.58 0.03 42 0.21 0.04
Non-Hispanic White 2,458 1.15 0.04 154 0.67 0.05 3,863 0.66 0.03 2,809 0.52 0.02 235 0.31 0.05
Other Hispanic 202 1.45 0.19 3 0.61 0.25 322 0.98 0.08 291 0.44 0.05 12 0.12 0.04
Other Race—Including Multiple 254 1.45 0.13 15 0.38 0.11 436 0.74 0.07 331 0.61 0.06 9 0.11 0.07
Page E
xposure Factors H
andbook 9-24
September 2011

Exposure F
actors Handbook
Chapter 9—
Intake of Fruits and Vegetables
Table 9-6. Consumer-Only Intake of Individual Fruits and Vegetables Based on the 2003−2006 NHANES (g/kg-day, edible portion, uncooked weight) (continued)
Population Group N Mean SE N Mean SE N Mean SE N Mean SE N Mean SE
Whole Population
Age Group
Berries and Small Fruit Broccoli Bulb Vegetables Cabbage Carrots
10,981 0.45 0.02 2,047 0.65 0.03 15,773 0.19 0.00 1,833 0.43 0.02 7,231 0.30 0.01
Birth to 1 year 166 1.26 0.42 45 1.14 0.19 346 0.19 0.03 13 0.96 0.44 166 1.13 0.23
1 to 2 years 839 1.76 0.15 132 1.84 0.27 1,003 0.30 0.02 72 0.73 0.26 525 0.93 0.08
3 to 5 years 788 1.15 0.12 108 1.50 0.25 947 0.29 0.02 67 0.71 0.15 449 0.71 0.09
6 to 12 years 1,751 0.57 0.05 228 0.96 0.12 2,216 0.21 0.02 164 0.56 0.16 912 0.49 0.05
13 to 19 years 2,210 0.30 0.02 289 0.53 0.04 3,354 0.16 0.01 218 0.31 0.04 1,152 0.24 0.02
20 to 49 years 2,601 0.27 0.01 664 0.53 0.03 4,194 0.19 0.01 577 0.41 0.03 1,948 0.24 0.01
Female 13 to 49 years 2,705 0.31 0.02 560 0.54 0.04 3,994 0.17 0.01 461 0.41 0.05 1,755 0.24 0.01
50 years and older
Race
2,626 0.40 0.02 581 0.56 0.02 3,713 0.17 0.00 722 0.43 0.02 2,079 0.23 0.01
Mexican American 2,563 0.38 0.02 456 0.61 0.07 4,132 0.28 0.01 390 0.32 0.04 1,912 0.33 0.02
Non-Hispanic Black 2,899 0.28 0.02 474 0.61 0.04 4,022 0.14 0.01 442 0.51 0.04 1,471 0.22 0.01
Non-Hispanic White 4,686 0.47 0.02 925 0.65 0.04 6,410 0.18 0.00 852 0.41 0.02 3,220 0.29 0.01
Other Hispanic 333 0.51 0.08 82 0.85 0.22 514 0.25 0.01 48 0.32 0.04 272 0.34 0.05
Other Race—Including Multiple 500 0.58 0.10 110 0.66 0.09 695 0.25 0.02 101 0.70 0.08 356 0.44 0.04
Exposure F
actors Handbook
Page Septem
ber 2011 9-25

Exposure F
actors Handbook
Chapter 9—
Intake of Fruits and Vegetables
Table 9-6. Consumer-Only Intake of Individual Fruits and Vegetables Based on the 2003−2006 NHANES (g/kg-day, edible portion, uncooked weight) (continued)
Population Group N Mean SE N Mean SE N Mean SE N Mean SE N Mean SE
Whole Population
Age Group
Citrus Fruits Corn Cucumbers Cucurbits Fruiting Vegetables
3,398 0.77 0.04 15,899 0.44 0.01 5,728 0.23 0.01 7,109 0.70 0.05 15,483 0.84 0.02
Birth to 1 year 30 2.90 0.96 465 1.12 0.14 25 0.70 0.31 138 3.16 0.16 281 0.98 0.12
1 to 2 years 256 2.61 0.30 1,028 1.16 0.06 210 0.58 0.09 332 2.75 0.42 987 1.56 0.07
3 to 5 years 191 2.50 0.29 971 1.26 0.07 247 0.74 0.12 335 1.86 0.25 926 1.61 0.09
6 to 12 years 440 1.39 0.09 2,237 0.88 0.04 666 0.37 0.03 828 1.47 0.22 2,192 1.08 0.05
13 to 19 years 549 0.66 0.04 3,332 0.38 0.01 1,191 0.18 0.01 1,347 0.50 0.06 3,304 0.78 0.03
20 to 49 years 896 0.55 0.05 4,134 0.33 0.01 1,827 0.20 0.01 2,138 0.50 0.06 4,155 0.78 0.02
Female 13 to 49 years 860 0.53 0.04 3,967 0.32 0.01 1,596 0.24 0.01 1,874 0.59 0.08 3,945 0.73 0.03
50 years and older
Race
1,036 0.57 0.04 3,732 0.28 0.01 1,562 0.19 0.01 1,991 0.57 0.03 3,638 0.69 0.03
Mexican American 1,148 1.40 0.06 4,185 0.81 0.03 1,218 0.25 0.02 1,733 0.65 0.05 4,079 1.18 0.03
Non-Hispanic Black 669 1.04 0.14 4,058 0.48 0.02 1,471 0.17 0.01 1,647 0.44 0.04 3,943 0.66 0.03
Non-Hispanic White 1,323 0.59 0.04 6,454 0.39 0.01 2,627 0.23 0.01 3,211 0.73 0.06 6,293 0.82 0.02
Other Hispanic 127 1.10 0.14 516 0.48 0.05 166 0.26 0.05 212 0.60 0.10 498 1.05 0.06
Other Race—Including Multiple 131 0.96 0.24 686 0.45 0.03 246 0.29 0.06 306 0.94 0.29 670 0.81 0.04
Page E
xposure Factors H
andbook 9-26
September 2011
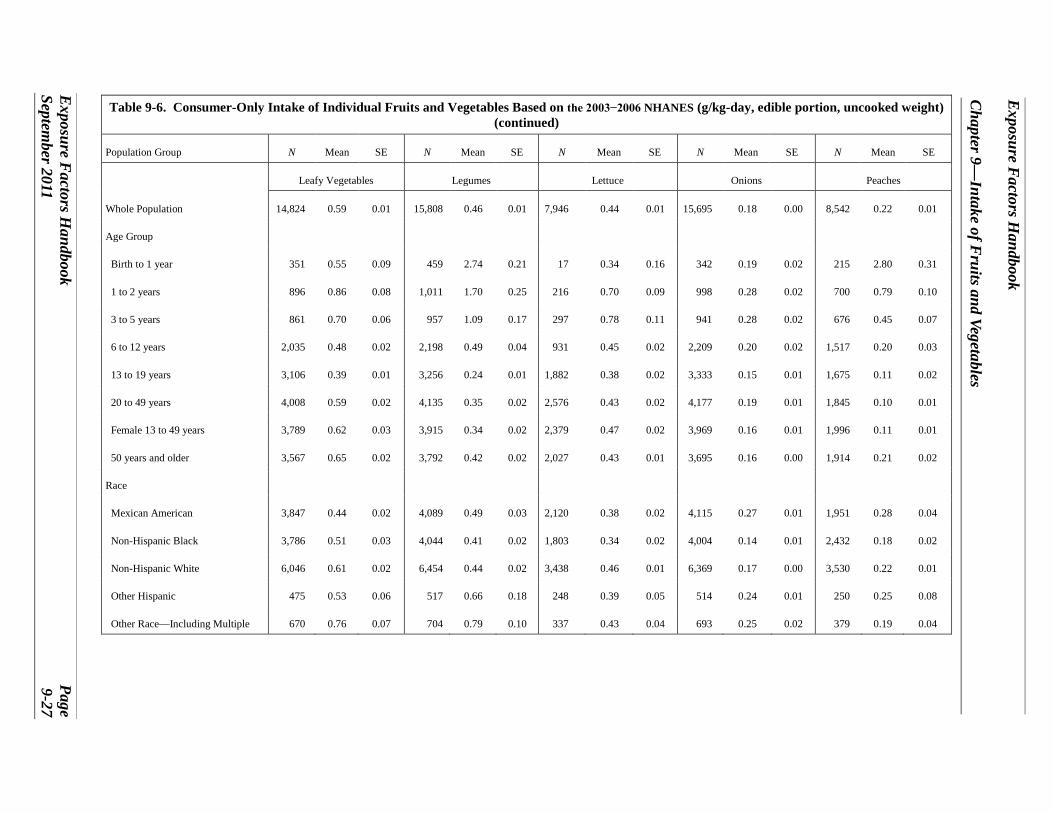
Exposure F
actors Handbook
Chapter 9—
Intake of Fruits and Vegetables
Table 9-6. Consumer-Only Intake of Individual Fruits and Vegetables Based on the 2003−2006 NHANES (g/kg-day, edible portion, uncooked weight) (continued)
Population Group N Mean SE N Mean SE N Mean SE N Mean SE N Mean SE
Whole Population
Age Group
Leafy Vegetables Legumes Lettuce Onions Peaches
14,824 0.59 0.01 15,808 0.46 0.01 7,946 0.44 0.01 15,695 0.18 0.00 8,542 0.22 0.01
Birth to 1 year 351 0.55 0.09 459 2.74 0.21 17 0.34 0.16 342 0.19 0.02 215 2.80 0.31
1 to 2 years 896 0.86 0.08 1,011 1.70 0.25 216 0.70 0.09 998 0.28 0.02 700 0.79 0.10
3 to 5 years 861 0.70 0.06 957 1.09 0.17 297 0.78 0.11 941 0.28 0.02 676 0.45 0.07
6 to 12 years 2,035 0.48 0.02 2,198 0.49 0.04 931 0.45 0.02 2,209 0.20 0.02 1,517 0.20 0.03
13 to 19 years 3,106 0.39 0.01 3,256 0.24 0.01 1,882 0.38 0.02 3,333 0.15 0.01 1,675 0.11 0.02
20 to 49 years 4,008 0.59 0.02 4,135 0.35 0.02 2,576 0.43 0.02 4,177 0.19 0.01 1,845 0.10 0.01
Female 13 to 49 years 3,789 0.62 0.03 3,915 0.34 0.02 2,379 0.47 0.02 3,969 0.16 0.01 1,996 0.11 0.01
50 years and older
Race
3,567 0.65 0.02 3,792 0.42 0.02 2,027 0.43 0.01 3,695 0.16 0.00 1,914 0.21 0.02
Mexican American 3,847 0.44 0.02 4,089 0.49 0.03 2,120 0.38 0.02 4,115 0.27 0.01 1,951 0.28 0.04
Non-Hispanic Black 3,786 0.51 0.03 4,044 0.41 0.02 1,803 0.34 0.02 4,004 0.14 0.01 2,432 0.18 0.02
Non-Hispanic White 6,046 0.61 0.02 6,454 0.44 0.02 3,438 0.46 0.01 6,369 0.17 0.00 3,530 0.22 0.01
Other Hispanic 475 0.53 0.06 517 0.66 0.18 248 0.39 0.05 514 0.24 0.01 250 0.25 0.08
Other Race—Including Multiple 670 0.76 0.07 704 0.79 0.10 337 0.43 0.04 693 0.25 0.02 379 0.19 0.04
Exposure F
actors Handbook
Page Septem
ber 2011 9-27

Exposure F
actors Handbook
Chapter 9—
Intake of Fruits and Vegetables
Table 9-6. Consumer-Only Intake of Individual Fruits and Vegetables Based on the 2003−2006 NHANES (g/kg-day, edible portion, uncooked weight) (continued)
Population Group N Mean SE N Mean SE N Mean SE N Mean SE N Mean SE
Whole Population
Age Group
Pears Peas Pome Fruit Pumpkins Root Tuber Vegetables
1,965 0.89 0.04 3,133 0.39 0.02 6,699 1.31 0.03 285 0.22 0.02 16,478 1.16 0.02
Birth to 1 year 144 3.77 0.38 236 1.83 0.11 371 6.50 0.42 3 0.73 0.39 583 3.88 0.24
1 to 2 years 243 1.79 0.21 257 1.05 0.11 621 3.92 0.23 4 2.13 0.41 1,050 3.15 0.13
3 to 5 years 221 1.31 0.20 180 0.97 0.13 537 2.82 0.18 8 0.80 0.21 978 2.60 0.16
6 to 12 years 403 0.77 0.12 309 0.51 0.06 1,071 1.82 0.10 35 0.55 0.16 2,256 1.79 0.07
13 to 19 years 272 0.35 0.04 416 0.34 0.04 1,085 0.98 0.05 40 0.19 0.06 3,447 0.99 0.04
20 to 49 years 278 0.63 0.05 780 0.26 0.02 1,362 0.81 0.04 95 0.20 0.04 4,278 0.90 0.03
Female 13 to 49 years 323 0.56 0.07 675 0.27 0.02 1,352 0.87 0.05 87 0.22 0.04 4,097 0.87 0.02
50 years and older
Race
404 0.72 0.06 955 0.29 0.01 1,652 0.84 0.04 100 0.17 0.02 3,886 0.92 0.03
Mexican American 518 1.25 0.14 644 0.37 0.04 1,851 1.81 0.09 160 0.28 0.06 4,316 1.18 0.04
Non-Hispanic Black 489 0.61 0.07 812 0.42 0.04 1,512 1.15 0.05 10 0.71 0.33 4,218 1.10 0.03
Non-Hispanic White 807 0.84 0.05 1,364 0.38 0.02 2,821 1.23 0.03 91 0.17 0.02 6,667 1.15 0.03
Other Hispanic 54 0.90 0.12 116 0.39 0.08 223 1.55 0.21 11 0.28 0.12 544 1.26 0.09
Other Race—Including Multiple 97 1.51 0.32 197 0.49 0.07 292 1.78 0.16 13 0.23 0.14 733 1.36 0.08
Page E
xposure Factors H
andbook 9-28
September 2011

Exposure F
actors Handbook
Chapter 9—
Intake of Fruits and Vegetables
Table 9-6. Consumer-Only Intake of Individual Fruits and Vegetables Based on the 2003−2006 NHANES (g/kg-day, edible portion, uncooked weight) (continued)
Population Group N Mean SE N Mean SE N Mean SE N Mean SE N Mean SE
Whole Population
Age Group
Stalk/Stem Vegetables Stone Fruit Strawberries Tomatoes Tropical Fruits
2,409 0.24 0.01 8,966 0.30 0.02 6,168 0.24 0.02 14,240 0.83 0.02 11,299 0.70 0.02
Birth to 1 year 15 0.26 0.07 235 2.98 0.33 88 0.60 0.28 246 1.11 0.12 423 4.12 0.30
1 to 2 years 101 0.58 0.10 721 0.92 0.10 480 0.70 0.12 895 1.68 0.09 862 3.19 0.33
3 to 5 years 81 0.50 0.10 691 0.56 0.08 460 0.51 0.09 840 1.72 0.09 800 1.47 0.11
6 to 12 years 212 0.24 0.04 1,545 0.31 0.04 1,019 0.28 0.06 2,071 1.09 0.05 1,733 0.69 0.05
13 to 19 years 387 0.15 0.01 1,719 0.16 0.02 1,076 0.20 0.03 3,093 0.77 0.03 2,151 0.37 0.03
20 to 49 years 941 0.22 0.01 1,961 0.17 0.02 1,466 0.17 0.02 3,894 0.74 0.02 2,692 0.44 0.02
Female 13 to 49 years 719 0.20 0.01 2,101 0.18 0.02 1,492 0.19 0.03 3,679 0.71 0.02 2,720 0.44 0.03
50 years and older
Race
672 0.26 0.03 2,094 0.30 0.03 1,579 0.23 0.03 3,201 0.70 0.03 2,638 0.58 0.02
Mexican American 411 0.18 0.02 2,043 0.38 0.05 1,438 0.22 0.02 3,897 1.09 0.03 3,031 1.03 0.07
Non-Hispanic Black 409 0.15 0.01 2,497 0.24 0.02 1,276 0.15 0.02 3,547 0.68 0.02 2,865 0.51 0.05
Non-Hispanic White 1,336 0.26 0.02 3,753 0.31 0.02 2,979 0.25 0.03 5,714 0.82 0.02 4,498 0.64 0.02
Other Hispanic 71 0.17 0.03 270 0.31 0.08 198 0.29 0.06 470 1.05 0.06 399 1.21 0.12
Other Race—Including Multiple 182 0.22 0.02 403 0.27 0.04 277 0.27 0.05 612 0.81 0.04 506 0.86 0.06
Exposure F
actors Handbook
Page Septem
ber 2011 9-29
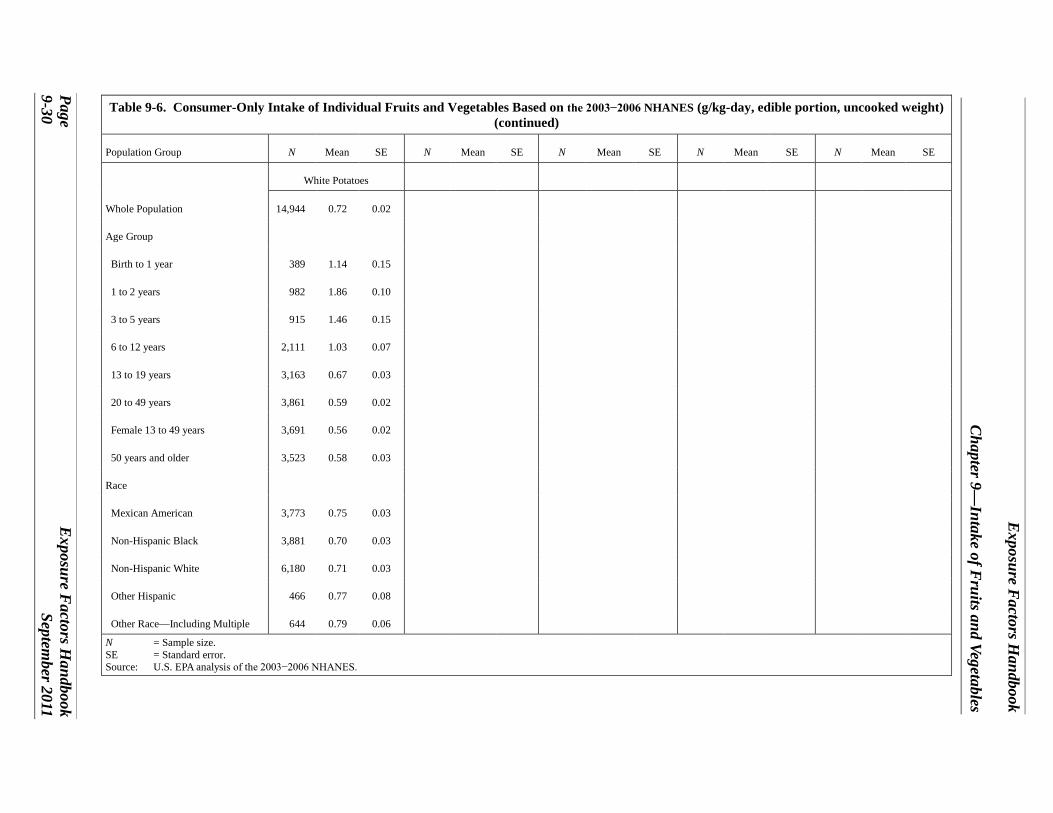
Exposure F
actors Handbook
Chapter 9—
Intake of Fruits and Vegetables
Table 9-6. Consumer-Only Intake of Individual Fruits and Vegetables Based on the 2003−2006 NHANES (g/kg-day, edible portion, uncooked weight) (continued)
Population Group N Mean SE N Mean SE N Mean SE N Mean SE N Mean SE
Whole Population
Age Group
White Potatoes
14,944 0.72 0.02
Birth to 1 year 389 1.14 0.15
1 to 2 years 982 1.86 0.10
3 to 5 years 915 1.46 0.15
6 to 12 years 2,111 1.03 0.07
13 to 19 years 3,163 0.67 0.03
20 to 49 years 3,861 0.59 0.02
Female 13 to 49 years 3,691 0.56 0.02
50 years and older
Race
3,523 0.58 0.03
Mexican American 3,773 0.75 0.03
Non-Hispanic Black 3,881 0.70 0.03
Non-Hispanic White 6,180 0.71 0.03
Other Hispanic 466 0.77 0.08
Other Race—Including Multiple 644 0.79 0.06
N = Sample size. SE = Standard error. Source: U.S. EPA analysis of the 2003−2006 NHANES.
Page E
xposure Factors H
andbook 9-30
September 2011

Exposure Factors Handbook
Chapter 9—Intake of Fruits and Vegetables
Table 9-7. Mean Total Fruit and Total Vegetable Intake (as-consumed) in a Day by Sex and Age (1977−1978)a
Age (years)
Per Capita Intake (g/day)
Percent of Population Consuming in a Day
Consumer-Only Intake (g/day)b
Fruits Males and Females ≤1 1 to 2 3 to 5 6 to 8
169 146 134 152
86.8 62.9 56.1 60.1
196 231 239 253
Males 9 to 11
12 to 14 15 to 18 19 to 22 23 to 34 35 to 50 51 to 64 65 to 74 ≥75
133 120 147 107 141 115 171 174 186
50.5 51.2 47.0 39.4 46.4 44.0 62.4 62.2 62.6
263 236 313 271 305 262 275 281 197
Females 9 to 11
12 to 14 15 to 18 19 to 22 23 to 34 35 to 50 51 to 64 65 to 74 ≥75
148 120 126 133 122 133 171 179 189
59.7 48.7 49.9 48.0 47.7 52.8 66.7 69.3 64.7
247 247 251 278 255 252 256 259 292
Males and Females All ages 142 54.2 263
Vegetables Males and Females ≤1 1 to 2 3 to 5 6 to 8
76 91 100 136
62.7 78.0 79.3 84.3
121 116 126 161
Males 9 to 11
12 to 14 15 to 18 19 to 22 23 to 34 35 to 50 51 to 64 65 to 74 ≥75
138 184 216 226 248 261 285 265 264
83.5 84.5 85.9 84.7 88.5 86.8 90.3 88.5 93.6
165 217 251 267 280 300 316 300 281
Females 9 to 11
12 to 14 15 to 18 19 to 22 23 to 34 35 to 50 51 to 64 65 to 74 ≥75
139 154 178 184 187 187 229 221 198
83.7 84.6 83.8 81.1 84.7 84.6 89.8 87.2 88.1
166 183 212 227 221 221 255 253 226
Males and Females All ages 201 85.6 235
a Based on USDA Nationwide Food Consumption Survey (1977−1978) data for one day. b Intake for users only was calculated by dividing the per capita intake rate by the fraction of the population consuming fruit
in a day. Source: USDA (1980).
Exposure Factors Handbook Page September 2011 9-31

Exposure Factors Handbook
Chapter 9—Intake of Fruits and Vegetables
Table 9-8. Mean Total Fruit and Total Vegetable Intake (as-consumed) in a Day by Sex and Age (1987−1988, 1994, and 1995)a
Age (years)
Per Capita Intake (g/day)
Percent of Population Consuming in 1 Day
Consumer-Only Intake (g/day)b
1987−1988 1994 1995 1987−1988 1994 1995 1987−1988 1994 1995 Fruits
Males and Females 5 and under
Males 157 230 221 59.2 70.6 72.6 265 326 304
6 to 11 182 176 219 63.8 59.8 62.2 285 294 352 12 to 19 158 169 210 49.4 44.0 47.1 320 384 446 ≥20
Females 133 175 170 46.5 50.2 49.6 286 349 342
6 to 11 154 174 172 58.3 59.3 63.6 264 293 270 12 to 19 131 148 167 47.1 47.1 44.4 278 314 376 ≥20
Males and Females 140 157 155 52.7 55.1 54.4 266 285 285
All Ages 142 171 173 51.4 54.1 54.2 276 316 319 Vegetables
Males and Females 5 and under
Males 81 80 83 74.0 75.2 75.0 109 106 111
6 to 11 129 118 111 86.8 82.4 80.6 149 143 138 12 to 19 173 154 202 85.2 74.9 79.0 203 206 256 ≥20
Females 232 242 241 85.0 85.9 86.4 273 282 278
6 to 11 129 115 108 80.6 82.9 79.1 160 139 137 12 to 19 129 132 144 75.8 78.5 76.0 170 168 189 ≥20
Males and Females 183 190 189 82.9 84.7 83.2 221 224 227
All Ages 182 186 188 82.6 83.2 82.6 220 223 228 a Based on USDA NFCS (1987−1988) and CSFII (1994 and 1995) data for one day. b Intake for users only was calculated by dividing the per capita intake rate by the fraction of the population consuming
fruits in a day.
Source: USDA (1996a, b).
Page Exposure Factors Handbook 9-32 September 2011
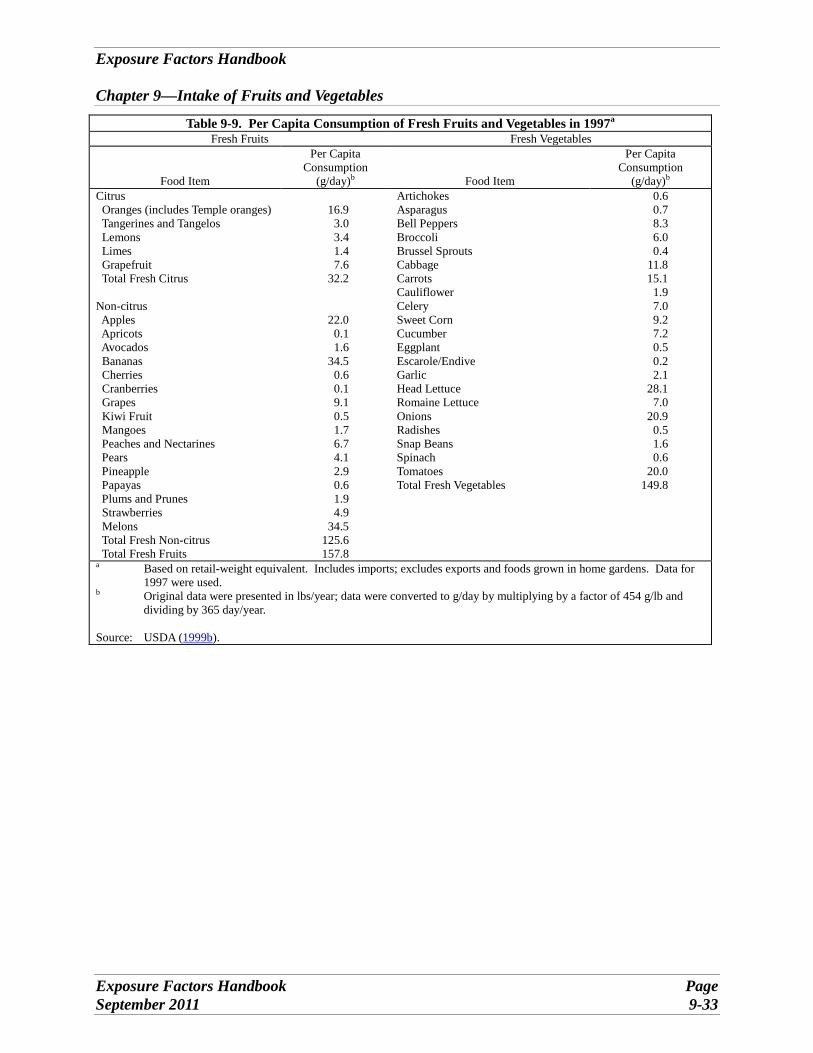
Exposure Factors Handbook
Chapter 9—Intake of Fruits and Vegetables
Table 9-9. Per Capita Consumption of Fresh Fruits and Vegetables in 1997a
Fresh Fruits Fresh Vegetables
Food Item
Per Capita Consumption
(g/day)b Food Item
Per Capita Consumption
(g/day)b
Citrus Oranges (includes Temple oranges) Tangerines and Tangelos Lemons Limes Grapefruit Total Fresh Citrus
Non-citrus Apples Apricots Avocados Bananas Cherries Cranberries Grapes Kiwi Fruit Mangoes Peaches and Nectarines Pears Pineapple Papayas Plums and Prunes Strawberries Melons Total Fresh Non-citrus Total Fresh Fruits
16.9 3.0 3.4 1.4 7.6
32.2
22.0 0.1 1.6
34.5 0.6 0.1 9.1 0.5 1.7 6.7 4.1 2.9 0.6 1.9 4.9
34.5 125.6 157.8
Artichokes Asparagus Bell Peppers Broccoli Brussel Sprouts Cabbage Carrots Cauliflower Celery Sweet Corn Cucumber Eggplant Escarole/Endive Garlic Head Lettuce Romaine Lettuce Onions Radishes Snap Beans Spinach Tomatoes Total Fresh Vegetables
0.6 0.7 8.3 6.0 0.4
11.8 15.1
1.9 7.0 9.2 7.2 0.5 0.2 2.1
28.1 7.0
20.9 0.5 1.6 0.6
20.0 149.8
a Based on retail-weight equivalent. Includes imports; excludes exports and foods grown in home gardens. Data for 1997 were used.
b Original data were presented in lbs/year; data were converted to g/day by multiplying by a factor of 454 g/lb and dividing by 365 day/year.
Source: USDA (1999b).
Exposure Factors Handbook Page September 2011 9-33

Exposure F
actors Handbook
Chapter 9—
Intake of Fruits and Vegetables
Table 9-10. Mean Quantities of Vegetables Consumed Daily by Sex and Age, for Children, per Capita (g/day, as-consumed)a
Age Group (years) Sample Size Total
White Potatoes Dark Green Vegetables
Deep Yellow Vegetables Tomatoes
Lettuce, Lettuce-based Salads
Green Beans
Corn, Green Peas, Lima
Beans Total Fried Other
Vegetables Males and Females
Under 1 1,126 57 9 1 2 19 1b b,c 6 5 1 1,016 79 26 11 5 9 7 1 8 9 2 1,102 87 32 17 4 5 11 2 7 10 1 to 2 2,118 83 29 14 5 7 9 1 7 9 3 1,831 91 34 17 5 5 13 2 5 11 4 1,859 97 37 19 6 5 11 3 5 12 5 884 103 44 22 4 6 12 3 6 12 3 to 5 4,574 97 38 20 5 5 12 3 5 11 ≤5 7,818 88 31 16 4 7 10 2 6 10
16 16 17 17 16 18 17 17 17
Males 6 to 9 787 110 47 26 4 5 16 5 5 11 6 to 11 1,031 115 50 27 5 5 16 5 5 11 12 to 19 737 176 85 44 6 6 28 12 3b 10
16 18 25
Females 6 to 9 704 110 42 22 5 4 14 6 5 13 6 to 11 969 116 46 25 5 4 15 7 5 12 12 to 19 732 145 61 31 9 4 18 12 4 8
21 22 28
Males and Females ≤9 9,309 97 37 19 4 6 12 3 6 11 ≤19 11,287 125 53 27 6 6 17 7 5 10
18 22
a Based on data from 1994−1996, 1998 CSFII. b Estimate is not statistically reliable due to small samples size reporting intake. c Value less than 0.5, but greater than 0. Note: Consumption amounts shown are representative of the first day of each participant’s survey response.
Source: USDA (1999a).
Page E
xposure Factors H
andbook 9-34
September 2011
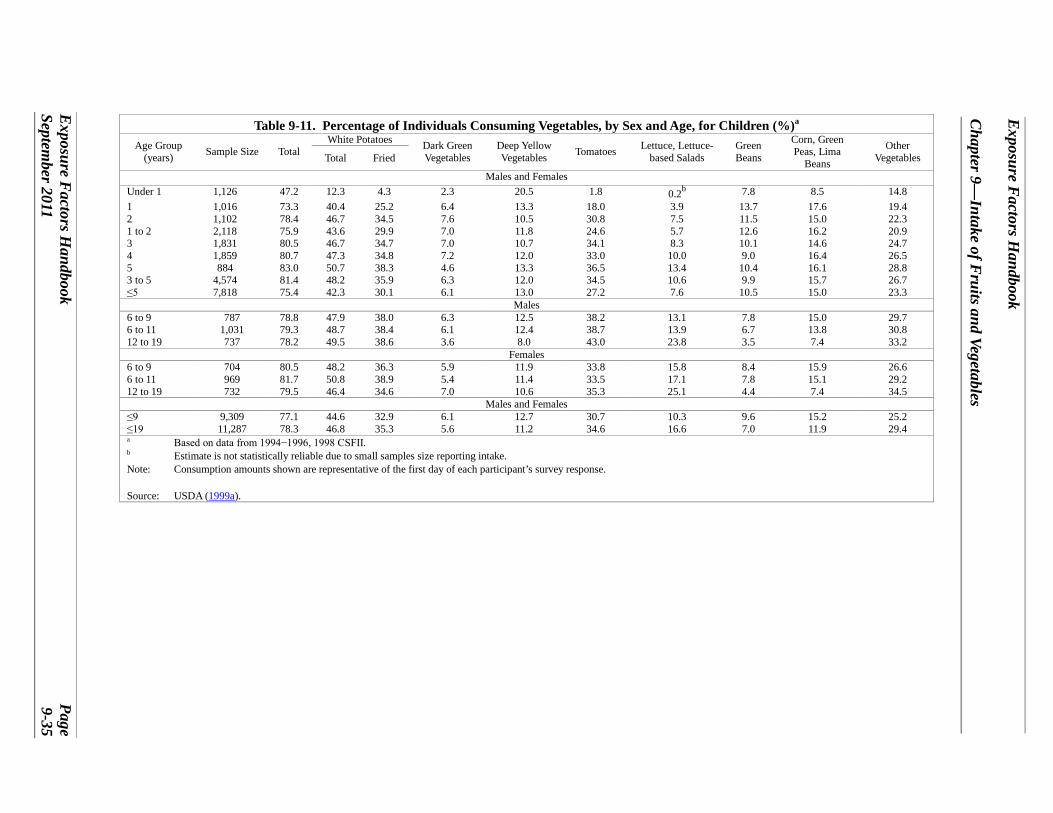
Exposure F
actors Handbook
Chapter 9—
Intake of Fruits and Vegetables
Table 9-11. Percentage of Individuals Consuming Vegetables, by Sex and Age, for Children (%)a
Age Group (years) Sample Size Total
White Potatoes Dark Green Vegetables
Deep Yellow Vegetables Tomatoes Lettuce, Lettuce-
based Salads Green Beans
Corn, Green Peas, Lima
Beans Total Fried Other
Vegetables
Males and Females Under 1 1,126 47.2 12.3 4.3 2.3 20.5 1.8 0.2b 7.8 8.5 1 1,016 73.3 40.4 25.2 6.4 13.3 18.0 3.9 13.7 17.6 2 1,102 78.4 46.7 34.5 7.6 10.5 30.8 7.5 11.5 15.0 1 to 2 2,118 75.9 43.6 29.9 7.0 11.8 24.6 5.7 12.6 16.2 3 1,831 80.5 46.7 34.7 7.0 10.7 34.1 8.3 10.1 14.6 4 1,859 80.7 47.3 34.8 7.2 12.0 33.0 10.0 9.0 16.4 5 884 83.0 50.7 38.3 4.6 13.3 36.5 13.4 10.4 16.1 3 to 5 4,574 81.4 48.2 35.9 6.3 12.0 34.5 10.6 9.9 15.7 ≤5 7,818 75.4 42.3 30.1 6.1 13.0 27.2 7.6 10.5 15.0
14.8 19.4 22.3 20.9 24.7 26.5 28.8 26.7 23.3
Males 6 to 9 787 78.8 47.9 38.0 6.3 12.5 38.2 13.1 7.8 15.0 6 to 11 1,031 79.3 48.7 38.4 6.1 12.4 38.7 13.9 6.7 13.8 12 to 19 737 78.2 49.5 38.6 3.6 8.0 43.0 23.8 3.5 7.4
29.7 30.8 33.2
Females 6 to 9 704 80.5 48.2 36.3 5.9 11.9 33.8 15.8 8.4 15.9 6 to 11 969 81.7 50.8 38.9 5.4 11.4 33.5 17.1 7.8 15.1 12 to 19 732 79.5 46.4 34.6 7.0 10.6 35.3 25.1 4.4 7.4
26.6 29.2 34.5
Males and Females ≤9 9,309 77.1 44.6 32.9 6.1 12.7 30.7 10.3 9.6 15.2 ≤19 11,287 78.3 46.8 35.3 5.6 11.2 34.6 16.6 7.0 11.9
25.2 29.4
a Based on data from 1994−1996, 1998 CSFII. b Estimate is not statistically reliable due to small samples size reporting intake. Note: Consumption amounts shown are representative of the first day of each participant’s survey response.
Source: USDA (1999a).
Exposure F
actors Handbook
Page Septem
ber 2011 9-35

Page
Exposure F
actors Handbook
Chapter 9—
Intake of Fruits and Vegetables
Exposure F
actors Handbook
September 2011
9-36
Table 9-12. Mean Quantities of Fruits Consumed Daily by Sex and Age, for Children, per Capita (g/day, as-consumed)a
Citrus Fruits and Juices Other Fruits, Mixtures, and Juices Age Group
(years) Sample Size Total Total Juices
Dried Fruits Total Apples Bananas Melons and
Berries
Other Fruits and Mixtures (mainly fruit)
Non-Citrus Juices and
Nectars
Males and Females
Under 1 1,126 131 4 4 -b,c 126 14 10 1b 39 61 1 1,016 267 47 42 2 216 22 23 8 29 134 2 1,102 276 65 56 2 207 27 20 10 20 130 1 to 2 2,118 271 56 49 2 212 24 22 9 24 132 3 1,831 256 61 51 1 191 27 18 13 24 110 4 5
1,859 884
243 218
62 55
52 44
1 -b,c
177 160
31 31
17 14
14 13
22 24
92 78
3 to 5 4,574 239 59 49 1 176 30 16 13 23 93 ≤5 7,818 237 52 44 1 182 26 17 10 26 103
Males
6 to 9 787 194 58 51 -b,c 133 32 11 21 20 50 6 to 11 12 to 19
1,031 737
183 174
67 102
60 94
-b,c
1b 113 70
28 13
11 8
16 11b
19 10
40 29
Females
6 to 9 704 180 63 54 1b 113 23 10 10 25 46 6 to 11 969 169 64 54 -b,c 103 21 8 8 23 42 12 to 19 732 157 72 67 -b,c 83 13 5 15 14 35
Males and Females
≤9 9,309 217 55 47 1 159 27 15 12 24 81 ≤19 11,287 191 70 62 1 118 21 11 12 19 56 a Based on data from 1994−1996, 1998 CSFII. b Estimate is not statistically reliable due to small samples size reporting intake. c Value less than 0.5, but greater than 0. - Indicates value as not statistically significant or less than 0.5, but greater than 0. Note: Consumption amounts shown are representative of the first day of each participant’s survey response.
Source: USDA (1999a).

Exposure F
actors Handbook
Chapter 9—
Intake of Fruits and Vegetables
Exposure F
actors Handbook
Page Septem
ber 2011 9-37
Table 9-13. Percentage of Individuals Consuming, Fruits by Sex and Age, for Children (%)a
Age Group (years) Sample Size Total
Citrus Fruits and Juices Dried Fruits
Other Fruits, Mixtures, and Juices
Total Juices Total Apples Bananas Melons and Berries
Other Fruits and Mixtures (mainly fruit)
Non-Citrus Juices and
Nectars
Males and Females
Under 1 1 2 1 to 2 3 4 5 3 to 5 ≤5
1,126 1,016 1,102 2,118 1,831 1,859 884
4,574 7,818
59.7 81.0 76.6 78.8 74.5 72.6 67.6 71.6 72.6
3.6 23.6 30.6 27.2 27.9 28.0 26.9 27.6 24.6
2.7 19.0 23.4 21.3 21.4 21.8 19.5 20.9 18.8
0.4b
5.9 5.3 5.6 4.1 3.0 1.3b
2.8 3.5
59.0 73.0 64.7 68.8 64.2 62.1 56.9 61.0 63.5
15.7 23.4 24.0 23.7 22.4 23.7 21.9 22.7 22.2
13.3 25.1 20.2 22.6 17.5 15.7 12.6 15.3 17.6
1.8 6.9 8.5 7.7 7.8 7.6 7.4 7.6 6.9
29.9 26.5 19.4 22.9 20.1 20.0 19.0 19.7 22.0
33.0 43.2 37.0 40.0 33.3 30.8 24.5 29.5 33.5
Males
6 to 9 6 to 11 12 to 19
787 1,031 737
59.0 56.5 44.5
24.8 25.2 24.7
20.5 21.6 21.7
0.8b
1.1b
1.0b
49.1 44.2 27.1
20.3 18.2 8.2
8.7 8.0 6.0
7.3 6.6 4.1
16.8 15.4 7.1
15.5 12.7 8.2
Females
6 to 9 6 to 11 12 to 19
704 969 732
64.9 62.1 45.6
27.9 27.7 22.4
22.3 21.5 18.1
1.5b
1.1b
1.1b
50.4 47.2 30.2
17.3 16.2 8.2
8.8 7.3 4.4
7.4 7.4 6.0
20.4 19.0 11.3
17.3 14.9 9.7
Males and Females
≤9 ≤19
9,309 11,287
68.3 57.8
25.2 24.8
19.8 20.1
2.5 1.8
58.0 44.4
20.9 15.2
14.0 9.7
7.1 6.2
20.6 15.5
26.7 17.9
a Based on data from 1994−1996, 1998 CSFII. b Estimate is not statistically reliable due to small sample size reporting intake. Note: Percentages shown are representative of the first day of each participant’s survey response.
Source: USDA (1999a).

Table 9-14. Per Capita Intake of Fruits and Vegetables Based on 1994−1996, 1998 CSFII (g/kg-day, edible portion, uncooked weight)
Population Group N Percent Consuming Mean SE
Percentiles 1st 5th 10th 25th 50th 75th 90th 95th 99th Max
Fruits Whole Population
Age Group Birth to 1 year 1 to 2 years 3 to 5 years 6 to 12 years 13 to 19 years 20 to 49 years ≥50 years
Season Fall Spring Summer Winter Race Asian, Pacific Islander American Indian, Alaskan Native Black Other/NA White Region Midwest Northeast South West
Urbanization City Center Suburban Non-metropolitan
20,607
1,486 2,096 4,391 2,089 1,222 4,677 4,646
4,687 5,308 5,890 4,722
557
177 2,740 1,638 15,495
4,822 3,692 7,208 4,885
6,164 9,598 4,845
80.0
56.4 89.5 90.0 88.3 73.2 75.3 85.8
79.6 80.2 78.3 81.7
78.8
77.8 71.3 78.5 81.5
82.3 83.4 74.7 82.7
79.0 82.5 75.9
1.6
5.7 6.2 4.6 2.4 0.8 0.9 1.4
1.5 1.6 1.5 1.7
2.1
1.9 1.2 2.2 1.6
1.6 1.7 1.3 2.0
1.6 1.7 1.3
0.0
0.3 0.2 0.1 0.1 0.1 0.0 0.0
0.1 0.1 0.1 0.0
0.2
0.3 0.1 0.2 0.0
0.0 0.1 0.1 0.1
0.0 0.0 0.1
0.0
0.0 0.0 0.0 0.0 0.0 0.0 0.0
0.0 0.0 0.0 0.0
0.0
0.0 0.0 0.0 0.0
0.0 0.0 0.0 0.0
0.0 0.0 0.0
0.0
0.0 0.0 0.0 0.0 0.0 0.0 0.0
0.0 0.0 0.0 0.0
0.0
0.0 0.0 0.0 0.0
0.0 0.0 0.0 0.0
0.0 0.0 0.0
0.0
0.0 0.0 0.0 0.0 0.0 0.0 0.0
0.0 0.0 0.0 0.0
0.0
0.0 0.0 0.0 0.0
0.0 0.0 0.0 0.0
0.0 0.0 0.0
0.0
0.0 0.5 0.2 0.1 0.0 0.0 0.1
0.0 0.0 0.0 0.0
0.0
0.0 0.0 0.0 0.0
0.0 0.0 0.0 0.0
0.0 0.0 0.0
0.5
1.5 4.7 3.2 1.3 0.1 0.2 0.9
0.5 0.5 0.4 0.7
1.1
0.9 0.1 0.9 0.6
0.6 0.8 0.2 0.9
0.5 0.7 0.3
2.0
9.6 9.4 7.0 3.3 1.1 1.3 2.1
2.0 1.9 1.9 2.1
3.2
1.9 1.2 2.9 2.0
2.0 2.2 1.5 2.6
2.0 2.1 1.6
4.2
17.1 14.6
11.4 6.4 2.4 2.7 3.6
4.2 4.2 4.0 4.4
6.0
5.3 3.6 6.1 4.1
4.1 4.2 3.5 5.2
4.4 4.5 3.6
6.5
21.3 18.5 14.4 8.8 3.5 3.9 4.8
6.4 6.7 6.2 6.6
7.4
9.6 5.6 10.0 6.3
6.2 6.3 5.7 8.0
6.3 6.9 5.4
14.0
32.2 26.4 22.3 14.3 6.9 6.2 7.6
13.3 14.7 12.8 14.3
14.7
16.4 13.3 18.5 13.4
13.1 14.1 13.0 15.3
14.1 14.5 12.8
73.8
73.8 44.0 45.5 25.0 12.8 16.7 18.4
43.8 73.8 53.2 37.5
43.5
20.9 40.0 45.5 73.8
43.5 40.0 73.8 45.5
45.5 43.8 73.8
Exposure F
actors Handbook
Chapter 9—
Intake of Fruits and Vegetables
Page E
xposure Factors H
andbook 9-38
September 2011
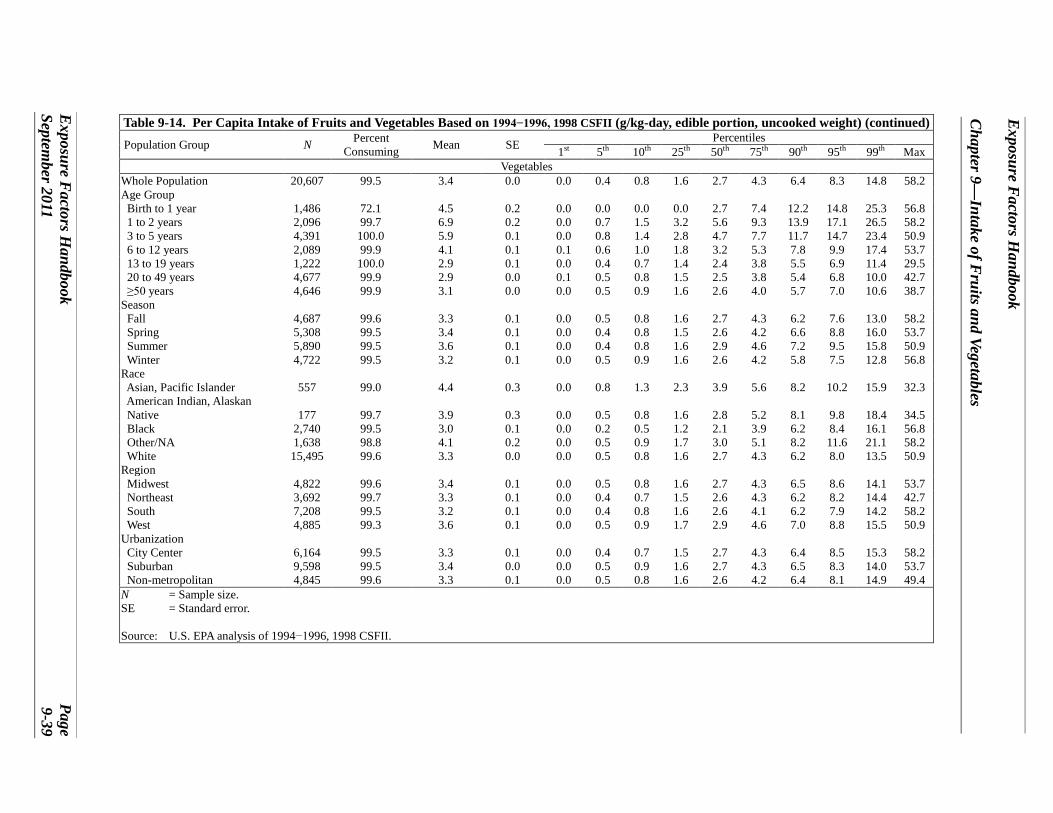
Exposure F
actors Handbook
Chapter 9—
Intake of Fruits and Vegetables
Exposure F
actors Handbook
Page Septem
ber 2011 9-39
Table 9-14. Per Capita Intake of Fruits and Vegetables Based on 1994−1996, 1998 CSFII (g/kg-day, edible portion, uncooked weight) (continued) Population Group N Percent
Consuming Mean SE Percentiles 1st 5th 10th 25th 50th 75th 90th 95th 99th Max
Vegetables Whole Population
Age Group Birth to 1 year 1 to 2 years 3 to 5 years 6 to 12 years 13 to 19 years 20 to 49 years ≥50 years
Season Fall Spring Summer Winter Race Asian, Pacific Islander American Indian, Alaskan Native Black Other/NA White Region Midwest Northeast South West
Urbanization City Center Suburban Non-metropolitan
20,607
1,486 2,096 4,391 2,089 1,222 4,677 4,646
4,687 5,308 5,890 4,722
557
177 2,740 1,638 15,495
4,822 3,692 7,208 4,885
6,164 9,598 4,845
99.5
72.1 99.7 100.0
99.9 100.0
99.9 99.9
99.6 99.5 99.5 99.5
99.0
99.7 99.5 98.8 99.6
99.6 99.7 99.5 99.3
99.5 99.5 99.6
3.4
4.5 6.9 5.9 4.1 2.9 2.9 3.1
3.3 3.4 3.6 3.2
4.4
3.9 3.0 4.1 3.3
3.4 3.3 3.2 3.6
3.3 3.4 3.3
0.0
0.2 0.2 0.1 0.1 0.1 0.0 0.0
0.1 0.1 0.1 0.1
0.3
0.3 0.1 0.2 0.0
0.1 0.1 0.1 0.1
0.1 0.0 0.1
0.0
0.0 0.0 0.0 0.1 0.0 0.1 0.0
0.0 0.0 0.0 0.0
0.0
0.0 0.0 0.0 0.0
0.0 0.0 0.0 0.0
0.0 0.0 0.0
0.4
0.0 0.7 0.8 0.6 0.4 0.5 0.5
0.5 0.4 0.4 0.5
0.8
0.5 0.2 0.5 0.5
0.5 0.4 0.4 0.5
0.4 0.5 0.5
0.8
0.0 1.5 1.4 1.0 0.7 0.8 0.9
0.8 0.8 0.8 0.9
1.3
0.8 0.5 0.9 0.8
0.8 0.7 0.8 0.9
0.7 0.9 0.8
1.6
0.0 3.2 2.8 1.8 1.4 1.5 1.6
1.6 1.5 1.6 1.6
2.3
1.6 1.2 1.7 1.6
1.6 1.5 1.6 1.7
1.5 1.6 1.6
2.7
2.7 5.6 4.7 3.2 2.4 2.5 2.6
2.7 2.6 2.9 2.6
3.9
2.8 2.1 3.0 2.7
2.7 2.6 2.6 2.9
2.7 2.7 2.6
4.3
7.4 9.3 7.7 5.3 3.8 3.8 4.0
4.3 4.2 4.6 4.2
5.6
5.2 3.9 5.1 4.3
4.3 4.3 4.1 4.6
4.3 4.3 4.2
6.4
12.2 13.9
11.7 7.8 5.5 5.4 5.7
6.2 6.6 7.2 5.8
8.2
8.1 6.2 8.2 6.2
6.5 6.2 6.2 7.0
6.4 6.5 6.4
8.3
14.8 17.1 14.7
9.9 6.9 6.8 7.0
7.6 8.8 9.5 7.5
10.2
9.8 8.4
11.6 8.0
8.6 8.2 7.9 8.8
8.5 8.3 8.1
14.8
25.3 26.5 23.4 17.4
11.4 10.0 10.6
13.0 16.0 15.8 12.8
15.9
18.4 16.1 21.1 13.5
14.1 14.4 14.2 15.5
15.3 14.0 14.9
58.2
56.8 58.2 50.9 53.7 29.5 42.7 38.7
58.2 53.7 50.9 56.8
32.3
34.5 56.8 58.2 50.9
53.7 42.7 58.2 50.9
58.2 53.7 49.4
N SE
Source:
= Sample size. = Standard error.
U.S. EPA analysis of 1994−1996, 1998 CSFII.
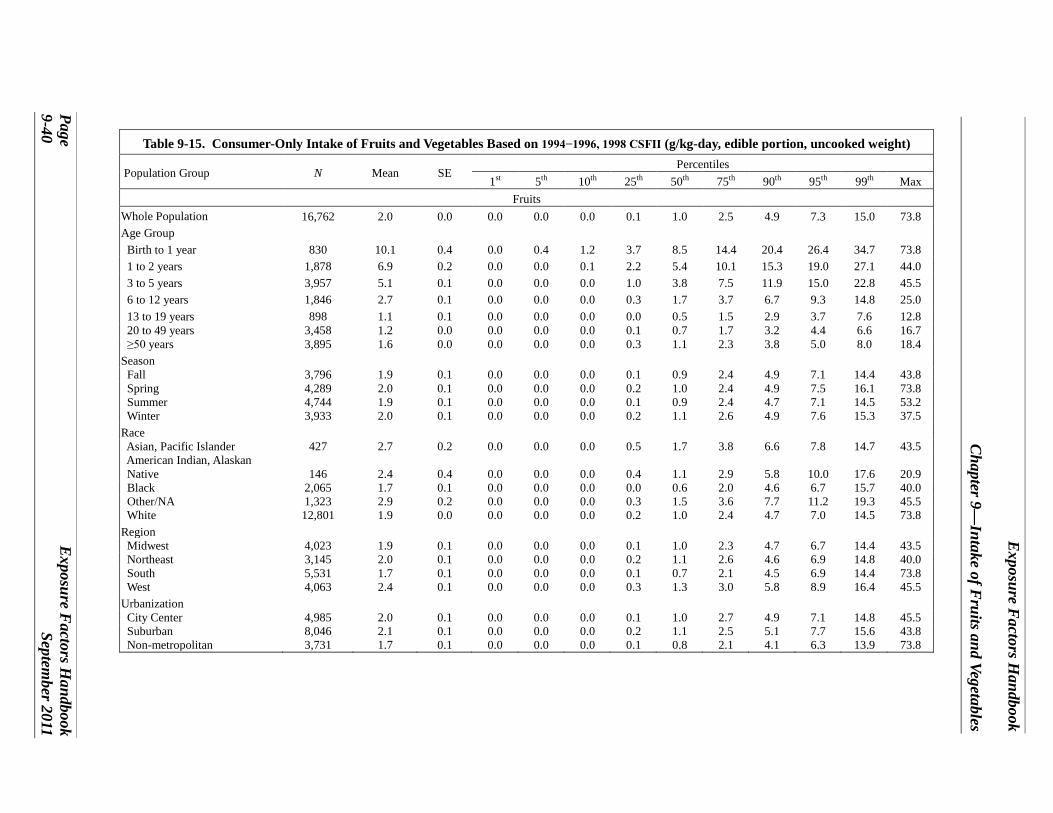
Table 9-15. Consumer-Only Intake of Fruits and Vegetables Based on 1994−1996, 1998 CSFII (g/kg-day, edible portion, uncooked weight)
Population Group N Mean SE Percentiles
1st 5th 10th 25th 50th 75th 90th 95th 99th Max Fruits
Whole Population Age Group
Birth to 1 year 1 to 2 years 3 to 5 years 6 to 12 years 13 to 19 years 20 to 49 years ≥50 years
Season Fall Spring Summer Winter Race Asian, Pacific Islander American Indian, Alaskan Native Black Other/NA White Region Midwest Northeast South West
Urbanization City Center Suburban Non-metropolitan
16,762
830 1,878 3,957 1,846
898 3,458 3,895
3,796 4,289 4,744 3,933
427
146 2,065 1,323 12,801
4,023 3,145 5,531 4,063
4,985 8,046 3,731
2.0
10.1 6.9 5.1 2.7 1.1 1.2 1.6
1.9 2.0 1.9 2.0
2.7
2.4 1.7 2.9 1.9
1.9 2.0 1.7 2.4
2.0 2.1 1.7
0.0
0.4 0.2 0.1 0.1 0.1 0.0 0.0
0.1 0.1 0.1 0.1
0.2
0.4 0.1 0.2 0.0
0.1 0.1 0.1 0.1
0.1 0.1 0.1
0.0
0.0 0.0 0.0 0.0 0.0 0.0 0.0
0.0 0.0 0.0 0.0
0.0
0.0 0.0 0.0 0.0
0.0 0.0 0.0 0.0
0.0 0.0 0.0
0.0
0.4 0.0 0.0 0.0 0.0 0.0 0.0
0.0 0.0 0.0 0.0
0.0
0.0 0.0 0.0 0.0
0.0 0.0 0.0 0.0
0.0 0.0 0.0
0.0
1.2 0.1 0.0 0.0 0.0 0.0 0.0
0.0 0.0 0.0 0.0
0.0
0.0 0.0 0.0 0.0
0.0 0.0 0.0 0.0
0.0 0.0 0.0
0.1
3.7 2.2 1.0 0.3 0.0 0.1 0.3
0.1 0.2 0.1 0.2
0.5
0.4 0.0 0.3 0.2
0.1 0.2 0.1 0.3
0.1 0.2 0.1
1.0
8.5 5.4 3.8 1.7 0.5 0.7 1.1
0.9 1.0 0.9 1.1
1.7
1.1 0.6 1.5 1.0
1.0 1.1 0.7 1.3
1.0 1.1 0.8
2.5
14.4 10.1
7.5 3.7 1.5 1.7 2.3
2.4 2.4 2.4 2.6
3.8
2.9 2.0 3.6 2.4
2.3 2.6 2.1 3.0
2.7 2.5 2.1
4.9
20.4 15.3
11.9 6.7 2.9 3.2 3.8
4.9 4.9 4.7 4.9
6.6
5.8 4.6 7.7 4.7
4.7 4.6 4.5 5.8
4.9 5.1 4.1
7.3
26.4 19.0 15.0
9.3 3.7 4.4 5.0
7.1 7.5 7.1 7.6
7.8
10.0 6.7
11.2 7.0
6.7 6.9 6.9 8.9
7.1 7.7 6.3
15.0
34.7 27.1 22.8 14.8
7.6 6.6 8.0
14.4 16.1 14.5 15.3
14.7
17.6 15.7 19.3 14.5
14.4 14.8 14.4 16.4
14.8 15.6 13.9
73.8
73.8 44.0 45.5 25.0 12.8 16.7 18.4
43.8 73.8 53.2 37.5
43.5
20.9 40.0 45.5 73.8
43.5 40.0 73.8 45.5
45.5 43.8 73.8
Exposure F
actors Handbook
Chapter 9—
Intake of Fruits and Vegetables
Page E
xposure Factors H
andbook 9-40
September 2011

Exposure F
actors Handbook
Chapter 9—
Intake of Fruits and Vegetables
Exposure F
actors Handbook
Page Septem
ber 2011 9-41
Table 9-15. Consumer-Only Intake of Fruits and Vegetables Based on 1994−1996, 1998 CSFII (g/kg-day, edible portion, uncooked weight) (continued)
Percentiles Population Group N Mean SE
1st 5th 10th 25th 50th 75th 90th 95th 99th Max Vegetables
Whole Population 20,163 3.4 0.0 0.0 0.5 0.8 1.6 2.7 4.3 6.4 8.4 14.8 58.2 Age Group
Birth to 1 year 1,062 6.2 0.3 0.0 0.1 0.1 2.0 4.9 9.4 13.4 16.1 26.4 56.8 1 to 2 years 2,090 6.9 0.2 0.0 0.7 1.5 3.2 5.6 9.3 13.9 17.1 26.5 58.2 3 to 5 years 4,389 5.9 0.1 0.0 0.8 1.4 2.8 4.7 7.7 11.7 14.7 23.4 50.9 6 to 12 years 2,087 4.1 0.1 0.1 0.6 1.0 1.8 3.2 5.3 7.8 9.9 17.4 53.7 13 to 19 years 1,222 2.9 0.1 0.0 0.4 0.7 1.4 2.4 3.8 5.5 6.9 11.4 29.5 20 to 49 years 4,673 2.9 0.0 0.1 0.5 0.8 1.5 2.5 3.8 5.4 6.8 10.0 42.7 ≥50 years 4,640 3.1 0.0 0.0 0.5 0.9 1.6 2.6 4.0 5.7 7.0 10.6 38.7
Season Fall 4,606 3.3 0.1 0.1 0.5 0.8 1.6 2.8 4.3 6.2 7.7 13.0 58.2 Spring 5,185 3.4 0.1 0.0 0.5 0.8 1.5 2.6 4.2 6.7 8.8 16.0 53.7 Summer 5,740 3.6 0.1 0.1 0.4 0.8 1.7 2.9 4.6 7.2 9.5 15.8 50.9 Winter 4,632 3.2 0.1 0.0 0.6 0.9 1.6 2.7 4.2 5.9 7.5 12.8 56.8 Race Asian, Pacific Islander 530 4.4 0.3 0.1 1.0 1.4 2.4 3.9 5.6 8.2 10.2 15.9 32.3 American Indian, Alaskan Native 174 3.9 0.3 0.0 0.5 0.9 1.7 2.9 5.2 8.1 9.8 18.4 34.5 Black 2,683 3.1 0.1 0.0 0.2 0.5 1.2 2.1 3.9 6.2 8.4 16.1 56.8 Other/NA 1,577 4.2 0.2 0.1 0.6 0.9 1.8 3.0 5.2 8.3 11.7 21.3 58.2 White 15,199 3.3 0.0 0.1 0.5 0.9 1.6 2.7 4.3 6.2 8.0 13.6 50.9 Region Midwest 4,721 3.4 0.1 0.1 0.5 0.8 1.6 2.7 4.3 6.5 8.6 14.2 53.7 Northeast 3,634 3.3 0.1 0.0 0.4 0.8 1.5 2.6 4.3 6.2 8.2 14.4 42.7 South 7,078 3.3 0.1 0.0 0.5 0.8 1.6 2.6 4.1 6.2 7.9 14.2 58.2 West 4,730 3.6 0.1 0.1 0.5 0.9 1.7 2.9 4.6 7.1 8.9 15.6 50.9
Urbanization City Center 6,029 3.4 0.1 0.0 0.4 0.8 1.5 2.7 4.3 6.4 8.6 15.4 58.2 Suburban 9,381 3.4 0.0 0.1 0.5 0.9 1.7 2.8 4.4 6.5 8.4 14.0 53.7 Non-metropolitan 4,753 3.3 0.1 0.0 0.5 0.9 1.6 2.7 4.2 6.4 8.1 14.9 49.4
N = Sample size. SE = Standard error.
Source: U.S. EPA analysis of 1994−1996, 1998 CSFII.

Exposure F
actors Handbook
Chapter 9—
Intake of Fruits and Vegetables
Table 9-16. Per Capita Intake of Individual Fruits and Vegetables Based on 1994−1996, 1998 CSFII (g/kg-day, edible portion, uncooked weight)
Population Group N Percent Consuming Mean SE Percent
Consuming Mean SE Percent Consuming Mean SE Percent
Consuming Mean SE
Apples Asparagus Bananas Beans Whole Population 20,607 Age Group
30.5 0.45 0.01 1.4 0.01 0.00 48.1 0.35 0.01 44.9 0.27 0.01
Birth to 1 year 1,486 34.6 2.32 0.13 0.2 0.01 0.00 40.7 1.24 0.06 21.6 0.43 0.04 1 to 2 years 2,096 44.8 1.79 0.09 0.8 0.02 0.01 62.8 1.77 0.09 46.8 0.76 0.04 3 to 5 years 4,391 44.6 1.64 0.05 0.5 0.01 0.00 60.7 0.93 0.04 43.0 0.52 0.02 6 to 12 years 2,089 38.2 0.83 0.05 0.7 0.01 0.00 57.7 0.38 0.03 38.8 0.32 0.02 13 to 19 years 1,222 22.5 0.20 0.02 0.6 0.00 0.00 42.1 0.13 0.02 36.0 0.18 0.02 20 to 49 years 4,677 25.7 0.21 0.01 1.3 0.01 0.00 41.7 0.21 0.01 45.5 0.22 0.01 ≥50 years 4,646
Season 34.5 0.32 0.02 2.5 0.02 0.00 54.1 0.35 0.01 51.4 0.26 0.01
Fall 4,687 35.0 0.55 0.03 1.2 0.01 0.00 45.6 0.36 0.02 47.3 0.29 0.01 Spring 5,308 29.6 0.45 0.02 1.9 0.02 0.00 49.8 0.35 0.02 43.3 0.25 0.01 Summer 5,890 25.5 0.34 0.02 0.9 0.01 0.00 49.6 0.33 0.02 43.6 0.28 0.01 Winter 4,722
Race 32.2 0.46 0.02 1.6 0.02 0.00 47.3 0.38 0.01 45.5 0.26 0.01
Asian, Pacific Islander 557 33.5 0.53 0.06 1.0 0.01 0.00 45.4 0.43 0.04 52.0 0.25 0.02 American Indian, Alaskan Native 177 31.0 0.60 0.12 2.5 0.02 0.01 44.1 0.39 0.05 37.8 0.26 0.06 Black 2,740 22.0 0.36 0.02 0.4 0.00 0.00 45.4 0.43 0.04 45.2 0.32 0.02 Other/NA 1,638 27.7 0.55 0.05 0.2 0.00 0.00 44.1 0.26 0.02 60.6 0.43 0.03 White 15,495
Region 32.0 0.45 0.01 1.7 0.01 0.00 47.5 0.58 0.07 43.6 0.25 0.01
Midwest 4,822 34.5 0.47 0.02 1.5 0.01 0.00 51.1 0.35 0.02 43.6 0.26 0.01 Northeast 3,692 32.7 0.48 0.03 1.3 0.01 0.00 52.9 0.36 0.01 36.7 0.21 0.01 South 7,208 25.3 0.36 0.01 1.1 0.01 0.00 42.4 0.30 0.02 48.8 0.33 0.01 West 4,885
Urbanization 32.7 0.55 0.02 1.9 0.01 0.00 49.6 0.44 0.03 47.5 0.25 0.02
City Center 6,164 28.9 0.42 0.02 1.7 0.01 0.00 48.4 0.36 0.02 46.2 0.29 0.01 Suburban 9,598 33.2 0.49 0.02 1.1 0.01 0.00 50.5 0.38 0.01 42.4 0.25 0.01 Non-metropolitan 4,845 27.0 0.39 0.02 1.5 0.01 0.00 42.3 0.28 0.03 48.7 0.30 0.02
Page E
xposure Factors H
andbook 9-42
September 2011

Exposure F
actors Handbook
Chapter 9—
Intake of Fruits and Vegetables
Table 9-16. Per Capita Intake of Individual Fruits and Vegetables Based on 1994−1996, 1998 CSFII (g/kg-day, edible portion, uncooked weight) (continued)
Population Group N Percent Consuming Mean SE Percent
Consuming Mean SE Percent Consuming Mean SE Percent
Consuming Mean SE
Beets Berries and Small Fruit Broccoli Bulb Vegetables Whole Population 20,607 Age Group
2.2 0.01 0.00 58.7 0.23 0.01 13.9 0.11 0.01 95.3 0.20 0.00
Birth to 1 year 1,486 0.4 0.01 0.01 16.5 0.13 0.02 3.5 0.07 0.02 33.4 0.07 0.01 1 to 2 years 2,096 0.7 0.01 0.00 66.2 0.91 0.05 12.0 0.25 0.03 93.3 0.30 0.01 3 to 5 years 4,391 0.8 0.01 0.00 72.7 0.72 0.03 10.7 0.18 0.01 95.8 0.27 0.01 6 to 12 years 2,089 0.8 0.01 0.00 73.4 0.40 0.03 11.0 0.14 0.02 97.3 0.21 0.01 13 to 19 years 1,222 0.7 0.00 0.00 55.4 0.15 0.02 8.3 0.06 0.01 97.7 0.19 0.01 20 to 49 years 4,677 1.9 0.00 0.00 53.1 0.14 0.01 14.7 0.10 0.01 97.4 0.21 0.01 ≥50 years 4,646
Season 4.6 0.02 0.00 63.0 0.19 0.01 17.3 0.11 0.01 93.4 0.17 0.00
Fall 4,687 2.0 0.01 0.00 57.4 0.18 0.01 14.6 0.12 0.01 95.8 0.21 0.01 Spring 5,308 2.3 0.01 0.00 60.6 0.27 0.02 13.5 0.11 0.02 95.4 0.20 0.01 Summer 5,890 2.3 0.01 0.00 60.4 0.29 0.02 13.7 0.11 0.01 94.3 0.19 0.01 Winter 4,722
Race 2.3 0.01 0.00 56.6 0.20 0.01 13.7 0.10 0.01 95.5 0.21 0.01
Asian, Pacific Islander 557 2.7 0.00 0.00 41.7 0.28 0.06 25.7 0.23 0.06 95.0 0.38 0.03 American Indian, Alaskan Native 177 0.3 0.00 0.00 49.6 0.13 0.02 9.1 0.11 0.07 99.3 0.25 0.04 Black 2,740 0.9 0.00 0.00 50.6 0.14 0.01 13.2 0.14 0.02 92.9 0.16 0.01 Other/NA 1,638 1.3 0.01 0.00 47.5 0.21 0.03 8.2 0.09 0.02 95.0 0.31 0.02 White 15,495
Region 2.5 0.01 0.00 61.6 0.25 0.01 14.0 0.10 0.01 95.6 0.19 0.00
Midwest 4,822 2.3 0.01 0.00 63.1 0.25 0.02 13.0 0.09 0.01 96.2 0.19 0.01 Northeast 3,692 2.4 0.01 0.00 63.2 0.24 0.02 15.3 0.13 0.01 94.5 0.19 0.01 South 7,208 1.7 0.01 0.00 53.3 0.19 0.01 13.1 0.11 0.01 94.4 0.18 0.01 West 4,885
Urbanization 2.8 0.01 0.00 58.7 0.28 0.03 14.6 0.12 0.02 96.3 0.25 0.01
City Center 6,164 2.3 0.01 0.00 57.3 0.22 0.01 15.1 0.13 0.01 95.0 0.21 0.01 Suburban 9,598 2.2 0.01 0.00 62.0 0.27 0.02 14.9 0.12 0.01 95.7 0.20 0.01 Non-metropolitan 4,845 2.4 0.01 0.00 53.6 0.17 0.02 9.7 0.06 0.01 94.7 0.19 0.01
Exposure F
actors Handbook
Page Septem
ber 2011 9-43

Exposure F
actors Handbook
Chapter 9—
Intake of Fruits and Vegetables
Table 9-16. Per Capita Intake of Individual Fruits and Vegetables Based on 1994−1996, 1998 CSFII (g/kg-day, edible portion, uncooked weight) (continued)
Population Group N Percent Consuming Mean SE Percent
Consuming Mean SE Percent Consuming Mean SE Percent
Consuming Mean SE
Cabbage Carrots Citrus Fruits Corn Whole Population 20,607 Age Group
15.5 0.08 0.01 49.8 0.17 0.00 19.3 0.19 0.01 94.6 0.44 0.01
Birth to 1 year 1,486 1.0 0.01 0.00 12.3 0.17 0.03 2.5 0.07 0.02 46.0 0.48 0.03 1 to 2 years 2,096 8.0 0.06 0.01 46.8 0.41 0.02 15.5 0.47 0.05 96.5 1.13 0.05 3 to 5 years 4,391 8.9 0.07 0.01 46.2 0.34 0.02 18.2 0.50 0.03 98.7 1.24 0.03 6 to 12 years 2,089 9.5 0.06 0.01 44.4 0.22 0.01 16.0 0.26 0.02 98.9 0.87 0.03 13 to 19 years 1,222 9.0 0.04 0.01 40.3 0.11 0.01 12.3 0.11 0.02 95.7 0.43 0.02 20 to 49 years 4,677 16.0 0.07 0.01 50.2 0.14 0.01 18.1 0.12 0.01 94.7 0.32 0.01 ≥50 years 4,646
Season 22.8 0.12 0.01 58.1 0.17 0.01 27.1 0.23 0.01 94.2 0.26 0.01
Fall 4,687 16.2 0.07 0.01 53.9 0.19 0.01 16.6 0.16 0.01 94.2 0.42 0.01 Spring 5,308 15.1 0.08 0.01 46.5 0.17 0.01 20.3 0.20 0.01 94.5 0.44 0.02 Summer 5,890 14.5 0.08 0.01 44.3 0.14 0.01 15.8 0.08 0.01 95.1 0.50 0.02 Winter 4,722
Race 16.3 0.08 0.01 54.5 0.18 0.01 24.6 0.33 0.02 94.8 0.41 0.02
Asian, Pacific Islander 557 33.9 0.24 0.04 59.4 0.28 0.04 23.4 0.35 0.07 85.6 0.32 0.04 American Indian, Alaskan Native 177 15.8 0.05 0.04 47.3 0.12 0.02 20.4 0.33 0.13 93.6 0.51 0.06 Black 2,740 15.9 0.14 0.03 36.6 0.10 0.01 13.0 0.15 0.02 93.7 0.49 0.02 Other/NA 1,638 9.5 0.02 0.01 46.2 0.21 0.02 22.4 0.37 0.06 92.6 0.70 0.05 White 15,495
Region 15.2 0.07 0.00 51.9 0.18 0.01 20.0 0.18 0.01 95.3 0.42 0.01
Midwest 4,822 15.5 0.08 0.01 50.9 0.17 0.01 18.9 0.16 0.01 96.6 0.46 0.02 Northeast 3,692 13.4 0.08 0.01 53.8 0.18 0.01 22.4 0.21 0.02 93.3 0.40 0.01 South 7,208 16.8 0.09 0.01 44.9 0.14 0.01 15.1 0.14 0.01 94.4 0.44 0.01 West 4,885
Urbanization 15.5 0.06 0.01 52.8 0.21 0.01 23.7 0.28 0.02 94.1 0.47 0.02
City Center 6,164 16.4 0.09 0.01 48.8 0.16 0.01 19.8 0.20 0.01 93.8 0.44 0.01 Suburban 9,598 16.0 0.07 0.00 52.3 0.19 0.01 20.0 0.19 0.01 94.8 0.45 0.01 Non-metropolitan 4,845 13.4 0.06 0.01 45.7 0.15 0.01 17.0 0.17 0.01 95.5 0.43 0.02
Page E
xposure Factors H
andbook 9-44
September 2011

Exposure F
actors Handbook
Chapter 9—
Intake of Fruits and Vegetables
Table 9-16. Per Capita Intake of Individual Fruits and Vegetables Based on 1994−1996, 1998 CSFII (g/kg-day, edible portion, uncooked weight) (continued)
Population Group N Percent Consuming Mean SE Percent
Consuming Mean SE Percent Consuming Mean SE Percent
Consuming Mean SE
Cucumbers Cucurbits Fruiting Vegetables Leafy Vegetables Whole Population 20,607 Age Group
40.1 0.10 0.01 48.9 0.40 0.02 93.8 0.82 0.01 90.1 0.59 0.01
Birth to 1 year 1,486 1.7 0.00 0.00 14.0 0.45 0.04 25.5 0.32 0.04 44.2 0.29 0.05 1 to 2 years 2,096 20.5 0.11 0.01 31.3 0.72 0.06 92.1 1.56 0.06 82.1 0.71 0.04 3 to 5 years 4,391 29.3 0.16 0.02 38.7 0.83 0.07 95.4 1.46 0.03 86.9 0.67 0.02 6 to 12 years 2,089 32.6 0.14 0.02 39.9 0.54 0.06 95.9 1.05 0.03 89.5 0.55 0.03 13 to 19 years 1,222 41.3 0.11 0.03 46.7 0.32 0.08 96.1 0.79 0.03 90.3 0.43 0.02 20 to 49 years 4,677 44.8 0.09 0.01 52.8 0.29 0.01 96.0 0.75 0.02 92.2 0.58 0.02 ≥50 years 4,646
Season 41.0 0.08 0.01 52.8 0.43 0.03 92.0 0.66 0.02 90.7 0.66 0.02
Fall 4,687 36.7 0.08 0.01 45.4 0.21 0.01 92.6 0.81 0.03 89.7 0.59 0.02 Spring 5,308 43.3 0.10 0.01 51.8 0.48 0.04 94.3 0.77 0.02 90.9 0.60 0.02 Summer 5,890 43.2 0.14 0.02 55.6 0.73 0.06 94.5 0.88 0.02 90.1 0.56 0.02 Winter 4,722
Race 37.2 0.07 0.01 43.0 0.16 0.01 93.7 0.80 0.02 89.6 0.59 0.02
Asian, Pacific Islander 557 34.9 0.24 0.16 46.9 0.90 0.39 88.4 0.86 0.06 92.8 1.13 0.12 American Indian, Alaskan Native 177 41.0 0.09 0.03 51.3 0.53 0.13 98.2 0.91 0.08 89.3 0.52 0.17 Black 2,740 39.1 0.06 0.01 43.4 0.27 0.04 91.9 0.69 0.04 89.5 0.65 0.04 Other/NA 1,638 33.4 0.10 0.01 46.1 0.53 0.09 93.6 1.25 0.05 85.3 0.50 0.03 White 15,495
Region 40.9 0.10 0.01 50.1 0.39 0.02 94.3 0.80 0.01 90.4 0.56 0.01
Midwest 4,822 42.1 0.10 0.01 49.6 0.37 0.03 94.8 0.81 0.02 92.1 0.55 0.03 Northeast 3,692 39.4 0.10 0.01 50.7 0.43 0.05 92.3 0.82 0.02 87.4 0.62 0.03 South 7,208 39.7 0.09 0.01 46.7 0.33 0.03 93.3 0.76 0.03 90.1 0.55 0.02 West 4,885
Urbanization 39.3 0.11 0.03 50.1 0.50 0.06 94.9 0.91 0.03 90.3 0.64 0.03
City Center 6,164 39.7 0.09 0.00 48.3 0.34 0.02 93.9 0.84 0.03 89.2 0.64 0.02 Suburban 9,598 40.6 0.11 0.01 49.9 0.44 0.04 93.5 0.81 0.01 90.5 0.60 0.02 Non-metropolitan 4,845 39.7 0.10 0.01 47.8 0.37 0.03 94.3 0.80 0.04 90.5 0.46 0.03
Exposure F
actors Handbook
Page Septem
ber 2011 9-45

Exposure F
actors Handbook
Chapter 9—
Intake of Fruits and Vegetables
Table 9-16. Per Capita Intake of Individual Fruits and Vegetables Based on 1994−1996, 1998 CSFII (g/kg-day, edible portion, uncooked weight) (continued)
Population Group N Percent Consuming Mean SE Percent
Consuming Mean SE Percent Consuming Mean SE Percent
Consuming Mean SE
Legumes Lettuce Okra Onions Whole Population 20,607 Age Group
95.5 0.43 0.01 52.2 0.24 0.01 1.4 0.01 0.00 94.9 0.19 0.00
Birth to 1 year 1,486 51.7 1.21 0.06 1.1 0.00 0.00 0.2 0.00 0.00 32.8 0.07 0.01 1 to 2 years 2,096 96.9 1.30 0.08 23.3 0.14 0.01 1.3 0.01 0.00 93.0 0.29 0.01 3 to 5 years 4,391 98.3 0.85 0.06 33.4 0.21 0.01 0.8 0.01 0.00 95.6 0.26 0.01 6 to 12 years 2,089 98.1 0.48 0.03 41.7 0.22 0.01 1.3 0.01 0.00 96.8 0.20 0.01 13 to 19 years 1,222 94.9 0.27 0.02 55.2 0.22 0.02 0.8 0.00 0.00 97.3 0.18 0.01 20 to 49 years 4,677 95.7 0.34 0.01 60.1 0.27 0.01 1.3 0.01 0.00 97.1 0.20 0.01 ≥50 years 4,646
Season 96.2 0.40 0.01 51.4 0.23 0.01 2.1 0.01 0.00 93.2 0.16 0.00
Fall 4,687 96.0 0.44 0.02 50.6 0.23 0.01 1.7 0.01 0.00 95.5 0.20 0.01 Spring 5,308 95.3 0.40 0.02 54.5 0.25 0.01 1.1 0.01 0.00 95.0 0.19 0.01 Summer 5,890 95.2 0.43 0.02 51.7 0.23 0.01 1.7 0.01 0.00 94.0 0.18 0.00 Winter 4,722
Race 95.5 0.44 0.02 52.1 0.24 0.01 1.0 0.01 0.00 95.3 0.20 0.01
Asian, Pacific Islander 557 96.1 0.76 0.09 48.1 0.28 0.05 4.8 0.01 0.01 94.9 0.37 0.03 American Indian, Alaskan Native 177 97.5 0.42 0.07 61.3 0.21 0.04 0.6 0.00 0.00 99.3 0.25 0.04 Black 2,740 95.6 0.50 0.04 42.7 0.15 0.01 2.4 0.01 0.00 92.6 0.16 0.01 Other/NA 1,638 93.5 0.55 0.04 52.1 0.25 0.02 0.6 0.00 0.00 95.0 0.30 0.02 White 15,495
Region 95.6 0.40 0.01 53.8 0.25 0.01 1.2 0.01 0.00 95.3 0.18 0.00
Midwest 4,822 96.9 0.40 0.02 53.3 0.25 0.02 0.4 0.00 0.00 96.0 0.18 0.01 Northeast 3,692 93.4 0.38 0.02 49.3 0.24 0.01 0.8 0.00 0.00 94.0 0.18 0.01 South 7,208 96.1 0.47 0.02 50.7 0.21 0.01 2.6 0.01 0.00 94.1 0.18 0.01 West 4,885
Urbanization 95.0 0.44 0.02 56.0 0.27 0.01 1.2 0.00 0.00 96.1 0.24 0.01
City Center 6,164 95.1 0.47 0.02 51.3 0.24 0.01 1.8 0.01 0.00 94.8 0.20 0.01 Suburban 9,598 95.4 0.41 0.01 53.0 0.26 0.01 1.0 0.01 0.00 95.3 0.19 0.01 Non-metropolitan 4,845 96.2 0.41 0.02 51.6 0.20 0.01 1.7 0.01 0.00 94.3 0.19 0.01
Page E
xposure Factors H
andbook 9-46
September 2011
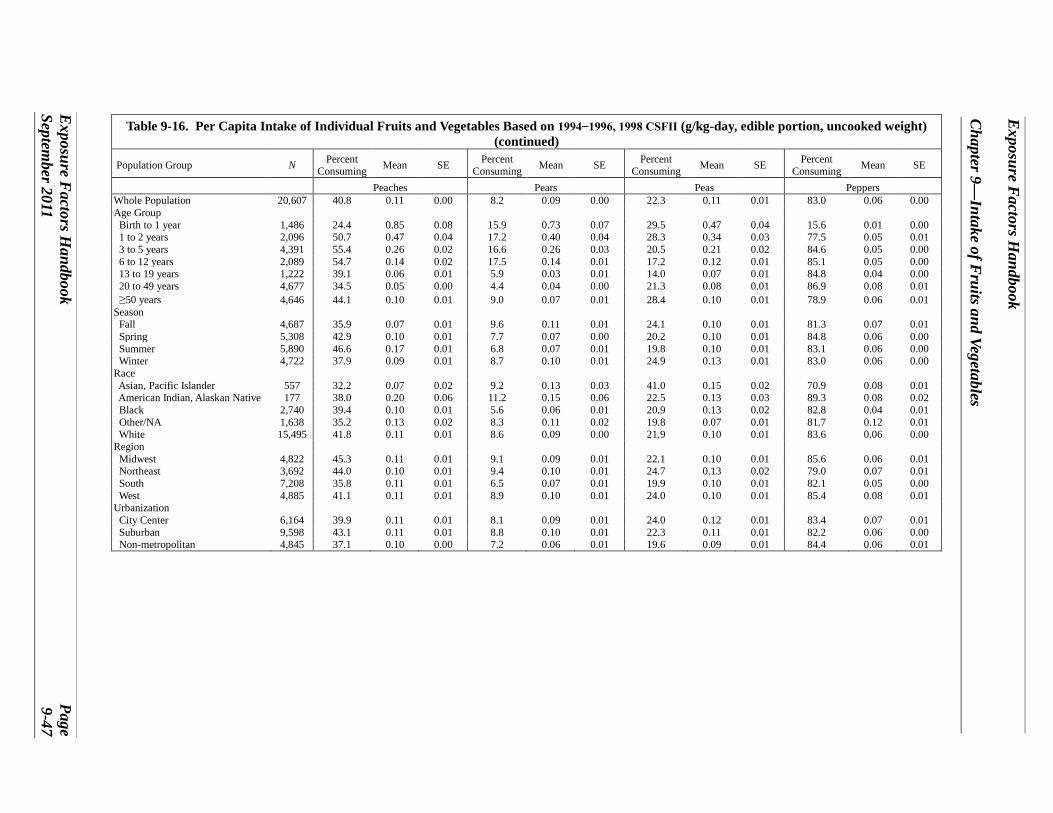
Exposure F
actors Handbook
Chapter 9—
Intake of Fruits and Vegetables
Table 9-16. Per Capita Intake of Individual Fruits and Vegetables Based on 1994−1996, 1998 CSFII (g/kg-day, edible portion, uncooked weight) (continued)
Population Group N Percent Consuming Mean SE Percent
Consuming Mean SE Percent Consuming Mean SE Percent
Consuming Mean SE
Peaches Pears Peas Peppers Whole Population 20,607 Age Group
40.8 0.11 0.00 8.2 0.09 0.00 22.3 0.11 0.01 83.0 0.06 0.00
Birth to 1 year 1,486 24.4 0.85 0.08 15.9 0.73 0.07 29.5 0.47 0.04 15.6 0.01 0.00 1 to 2 years 2,096 50.7 0.47 0.04 17.2 0.40 0.04 28.3 0.34 0.03 77.5 0.05 0.01 3 to 5 years 4,391 55.4 0.26 0.02 16.6 0.26 0.03 20.5 0.21 0.02 84.6 0.05 0.00 6 to 12 years 2,089 54.7 0.14 0.02 17.5 0.14 0.01 17.2 0.12 0.01 85.1 0.05 0.00 13 to 19 years 1,222 39.1 0.06 0.01 5.9 0.03 0.01 14.0 0.07 0.01 84.8 0.04 0.00 20 to 49 years 4,677 34.5 0.05 0.00 4.4 0.04 0.00 21.3 0.08 0.01 86.9 0.08 0.01 ≥50 years 4,646
Season 44.1 0.10 0.01 9.0 0.07 0.01 28.4 0.10 0.01 78.9 0.06 0.01
Fall 4,687 35.9 0.07 0.01 9.6 0.11 0.01 24.1 0.10 0.01 81.3 0.07 0.01 Spring 5,308 42.9 0.10 0.01 7.7 0.07 0.00 20.2 0.10 0.01 84.8 0.06 0.00 Summer 5,890 46.6 0.17 0.01 6.8 0.07 0.01 19.8 0.10 0.01 83.1 0.06 0.00 Winter 4,722
Race 37.9 0.09 0.01 8.7 0.10 0.01 24.9 0.13 0.01 83.0 0.06 0.00
Asian, Pacific Islander 557 32.2 0.07 0.02 9.2 0.13 0.03 41.0 0.15 0.02 70.9 0.08 0.01 American Indian, Alaskan Native 177 38.0 0.20 0.06 11.2 0.15 0.06 22.5 0.13 0.03 89.3 0.08 0.02 Black 2,740 39.4 0.10 0.01 5.6 0.06 0.01 20.9 0.13 0.02 82.8 0.04 0.01 Other/NA 1,638 35.2 0.13 0.02 8.3 0.11 0.02 19.8 0.07 0.01 81.7 0.12 0.01 White 15,495
Region 41.8 0.11 0.01 8.6 0.09 0.00 21.9 0.10 0.01 83.6 0.06 0.00
Midwest 4,822 45.3 0.11 0.01 9.1 0.09 0.01 22.1 0.10 0.01 85.6 0.06 0.01 Northeast 3,692 44.0 0.10 0.01 9.4 0.10 0.01 24.7 0.13 0.02 79.0 0.07 0.01 South 7,208 35.8 0.11 0.01 6.5 0.07 0.01 19.9 0.10 0.01 82.1 0.05 0.00 West 4,885
Urbanization 41.1 0.11 0.01 8.9 0.10 0.01 24.0 0.10 0.01 85.4 0.08 0.01
City Center 6,164 39.9 0.11 0.01 8.1 0.09 0.01 24.0 0.12 0.01 83.4 0.07 0.01 Suburban 9,598 43.1 0.11 0.01 8.8 0.10 0.01 22.3 0.11 0.01 82.2 0.06 0.00 Non-metropolitan 4,845 37.1 0.10 0.00 7.2 0.06 0.01 19.6 0.09 0.01 84.4 0.06 0.01
Exposure F
actors Handbook
Page Septem
ber 2011 9-47

Exposure F
actors Handbook
Chapter 9—
Intake of Fruits and Vegetables
Table 9-16. Per Capita Intake of Individual Fruits and Vegetables Based on 1994−1996, 1998 CSFII (g/kg-day, edible portion, uncooked weight) (continued)
Population Group N Percent Consuming Mean SE Percent
Consuming Mean SE Percent Consuming Mean SE Percent
Consuming Mean SE
Pome Fruit Pumpkins Root Tuber Vegetables Stalk, Stem Vegetables Whole Population 20,607 Age Group
34.7 0.54 0.01 1.8 0.01 0.00 99.2 1.42 0.02 19.4 0.05 0.00
Birth to 1 year 1,486 40.0 3.04 0.17 0.3 0.00 0.00 61.7 2.60 0.15 1.9 0.01 0.00 1 to 2 years 2,096 52.0 2.19 0.10 0.7 0.01 0.00 99.6 3.38 0.09 13.2 0.06 0.01 3 to 5 years 4,391 51.7 1.90 0.06 0.9 0.01 0.00 100.0 2.96 0.07 10.9 0.04 0.00 6 to 12 years 2,089 47.9 0.97 0.06 1.8 0.01 0.00 100.0 2.09 0.07 10.7 0.03 0.01 13 to 19 years 1,222 26.5 0.23 0.02 1.3 0.01 0.00 99.9 1.36 0.06 16.6 0.03 0.01 20 to 49 years 4,677 27.9 0.25 0.01 1.7 0.00 0.00 99.7 1.12 0.02 24.5 0.05 0.00 ≥50 years 4,646
Season 39.0 0.39 0.02 2.3 0.01 0.00 99.7 1.13 0.02 18.3 0.05 0.00
Fall 4,687 39.5 0.66 0.04 4.9 0.01 0.00 99.4 1.49 0.04 18.5 0.04 0.00 Spring 5,308 33.6 0.52 0.03 0.4 0.00 0.00 99.3 1.41 0.03 20.1 0.05 0.00 Summer 5,890 29.1 0.41 0.02 0.7 0.00 0.00 99.2 1.34 0.03 17.0 0.03 0.00 Winter 4,722
Race 36.7 0.56 0.03 1.0 0.00 0.00 99.0 1.45 0.04 21.8 0.06 0.01
Asian, Pacific Islander 557 36.5 0.66 0.08 1.0 0.00 0.00 97.3 1.31 0.10 36.5 0.11 0.01 American Indian, Alaskan Native 177 39.5 0.75 0.14 1.2 0.00 0.00 99.7 1.71 0.30 21.6 0.05 0.02 Black 2,740 24.8 0.42 0.03 0.5 0.00 0.00 99.0 1.31 0.09 8.1 0.01 0.00 Other/NA 1,638 32.7 0.67 0.06 3.5 0.01 0.00 98.0 1.47 0.05 14.5 0.03 0.00 White 15,495
Region 36.4 0.54 0.01 1.9 0.01 0.00 99.4 1.44 0.02 20.9 0.05 0.00
Midwest 4,822 38.9 0.55 0.03 2.4 0.01 0.00 99.5 1.57 0.05 22.1 0.05 0.00 Northeast 3,692 37.3 0.57 0.02 2.0 0.01 0.00 99.4 1.33 0.05 17.2 0.05 0.01 South 7,208 28.9 0.43 0.02 1.1 0.00 0.00 99.2 1.40 0.04 16.4 0.04 0.00 West 4,885
Urbanization 37.2 0.65 0.03 1.9 0.01 0.00 98.8 1.38 0.05 23.1 0.06 0.00
City Center 6,164 33.2 0.51 0.02 1.5 0.00 0.00 99.0 1.34 0.04 19.6 0.05 0.00 Suburban 9,598 37.6 0.59 0.02 1.8 0.00 0.00 99.3 1.44 0.03 20.0 0.05 0.00 Non-metropolitan 4,845 30.7 0.45 0.03 2.0 0.01 0.00 99.4 1.52 0.06 17.8 0.04 0.00
Page E
xposure Factors H
andbook 9-48
September 2011
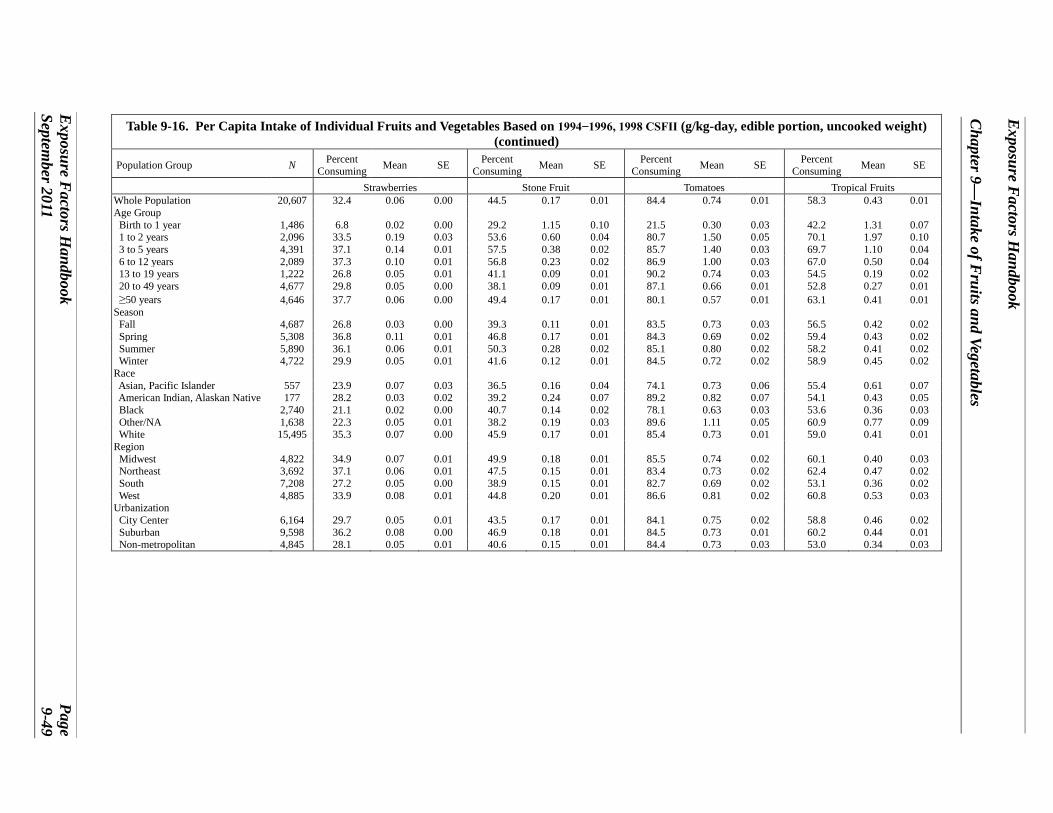
Exposure F
actors Handbook
Chapter 9—
Intake of Fruits and Vegetables
Table 9-16. Per Capita Intake of Individual Fruits and Vegetables Based on 1994−1996, 1998 CSFII (g/kg-day, edible portion, uncooked weight) (continued)
Population Group N Percent Consuming Mean SE Percent
Consuming Mean SE Percent Consuming Mean SE Percent
Consuming Mean SE
Strawberries Stone Fruit Tomatoes Tropical Fruits Whole Population 20,607 Age Group
32.4 0.06 0.00 44.5 0.17 0.01 84.4 0.74 0.01 58.3 0.43 0.01
Birth to 1 year 1,486 6.8 0.02 0.00 29.2 1.15 0.10 21.5 0.30 0.03 42.2 1.31 0.07 1 to 2 years 2,096 33.5 0.19 0.03 53.6 0.60 0.04 80.7 1.50 0.05 70.1 1.97 0.10 3 to 5 years 4,391 37.1 0.14 0.01 57.5 0.38 0.02 85.7 1.40 0.03 69.7 1.10 0.04 6 to 12 years 2,089 37.3 0.10 0.01 56.8 0.23 0.02 86.9 1.00 0.03 67.0 0.50 0.04 13 to 19 years 1,222 26.8 0.05 0.01 41.1 0.09 0.01 90.2 0.74 0.03 54.5 0.19 0.02 20 to 49 years 4,677 29.8 0.05 0.00 38.1 0.09 0.01 87.1 0.66 0.01 52.8 0.27 0.01 ≥50 years 4,646
Season 37.7 0.06 0.00 49.4 0.17 0.01 80.1 0.57 0.01 63.1 0.41 0.01
Fall 4,687 26.8 0.03 0.00 39.3 0.11 0.01 83.5 0.73 0.03 56.5 0.42 0.02 Spring 5,308 36.8 0.11 0.01 46.8 0.17 0.01 84.3 0.69 0.02 59.4 0.43 0.02 Summer 5,890 36.1 0.06 0.01 50.3 0.28 0.02 85.1 0.80 0.02 58.2 0.41 0.02 Winter 4,722
Race 29.9 0.05 0.01 41.6 0.12 0.01 84.5 0.72 0.02 58.9 0.45 0.02
Asian, Pacific Islander 557 23.9 0.07 0.03 36.5 0.16 0.04 74.1 0.73 0.06 55.4 0.61 0.07 American Indian, Alaskan Native 177 28.2 0.03 0.02 39.2 0.24 0.07 89.2 0.82 0.07 54.1 0.43 0.05 Black 2,740 21.1 0.02 0.00 40.7 0.14 0.02 78.1 0.63 0.03 53.6 0.36 0.03 Other/NA 1,638 22.3 0.05 0.01 38.2 0.19 0.03 89.6 1.11 0.05 60.9 0.77 0.09 White 15,495
Region 35.3 0.07 0.00 45.9 0.17 0.01 85.4 0.73 0.01 59.0 0.41 0.01
Midwest 4,822 34.9 0.07 0.01 49.9 0.18 0.01 85.5 0.74 0.02 60.1 0.40 0.03 Northeast 3,692 37.1 0.06 0.01 47.5 0.15 0.01 83.4 0.73 0.02 62.4 0.47 0.02 South 7,208 27.2 0.05 0.00 38.9 0.15 0.01 82.7 0.69 0.02 53.1 0.36 0.02 West 4,885
Urbanization 33.9 0.08 0.01 44.8 0.20 0.01 86.6 0.81 0.02 60.8 0.53 0.03
City Center 6,164 29.7 0.05 0.01 43.5 0.17 0.01 84.1 0.75 0.02 58.8 0.46 0.02 Suburban 9,598 36.2 0.08 0.00 46.9 0.18 0.01 84.5 0.73 0.01 60.2 0.44 0.01 Non-metropolitan 4,845 28.1 0.05 0.01 40.6 0.15 0.01 84.4 0.73 0.03 53.0 0.34 0.03
Exposure F
actors Handbook
Page Septem
ber 2011 9-49

Exposure F
actors Handbook
Chapter 9—
Intake of Fruits and Vegetables
Table 9-16. Per Capita Intake of Individual Fruits and Vegetables Based on 1994−1996, 1998 CSFII (g/kg-day, edible portion, uncooked weight) (continued)
Population Group N Percent Consuming Mean SE
White Potatoes Whole Population 20,607 Age Group
91.3 0.89 0.02
Birth to 1 year 1,486 39.9 0.64 0.07 1 to 2 years 2,096 91.2 1.95 0.08 3 to 5 years 4,391 95.1 1.75 0.06 6 to 12 years 2,089 93.9 1.21 0.06 13 to 19 years 1,222 92.6 0.93 0.05 20 to 49 years 4,677 91.5 0.74 0.02 ≥50 years 4,646
Season 91.7 0.72 0.02
Fall 4,687 91.5 0.91 0.04 Spring 5,308 91.3 0.87 0.03 Summer 5,890 91.3 0.86 0.03 Winter 4,722
Race 91.1 0.90 0.03
Asian, Pacific Islander 557 82.3 0.72 0.09 American Indian, Alaskan Native 177 92.7 1.29 0.32 Black 2,740 88.5 0.81 0.07 Other/NA 1,638 86.5 0.86 0.07 White 15,495
Region 92.4 0.90 0.02
Midwest 4,822 94.5 1.00 0.03 Northeast 3,692 88.6 0.79 0.04 South 7,208 91.8 0.90 0.04 West 4,885
Urbanization 89.6 0.82 0.06
City Center 6,164 89.5 0.81 0.04 Suburban 9,598 91.2 0.87 0.02 Non-metropolitan 4,845 94.2 1.02 0.06
N = Sample size. SE = Standard error. Note: Data for fruits and vegetables for which only small percentages of the population reported consumption may be less reliable than data for fruits and vegetables with higher
percentages consuming.
Source: U.S. EPA analysis of 1994−1996, 1998 CSFII.
Page E
xposure Factors H
andbook 9-50
September 2011

Exposure F
actors Handbook
Chapter 9—
Intake of Fruits and Vegetables
Table 9-17. Consumer-Only Intake of Individual Fruits and Vegetables Based on 1994−1996, 1998 CSFII (g/kg-day, edible portion, uncooked weight)
Population Group N Mean SE N Mean SE N Mean SE N Mean SE N Mean SE Apples Asparagus Bananas Beans Beets
Whole Population Age Group
7,193 1.47 0.03 233 0.85 0.04 10,734 0.73 0.02 9,086 0.60 0.01 374 0.35 0
Birth to 1 year 496 6.71 0.31 3 2.59 1.16 605 3.04 0.12 313 2.00 0.16 6 1.42 0.9 1 to 2 years 947 4.00 0.15 19 1.99 0.54 1,328 2.82 0.12 996 1.63 0.08 13 0.98 0.3 3 to 5 years 1,978 3.68 0.08 23 1.37 0.32 2,746 1.54 0.06 1,909 1.22 0.04 36 0.9 0.2 6 to 12 years 792 2.17 0.12 13 1.77 0.43 1,214 0.66 0.05 833 0.82 0.05 16 0.66 0.3 13 to 19 years 271 0.90 0.06 4 0.56 0.08 511 0.30 0.04 472 0.49 0.03 9 0.2 0.1 20 to 49 years 1,171 0.82 0.03 58 0.79 0.08 1,887 0.50 0.01 2,153 0.48 0.01 93 0.23 0 ≥ 50 years
Season 1,538 0.92 0.04 113 0.77 0.07 2,443 0.65 0.02 2,410 0.52 0.02 201 0.38 0
Fall 1,841 1.57 0.06 44 0.80 0.13 2,292 0.79 0.04 2,122 0.60 0.02 90 0.25 0 Spring 1,818 1.52 0.07 91 0.90 0.07 2,856 0.70 0.03 2,311 0.59 0.02 92 0.45 0.1 Summer 1,801 1.32 0.06 36 0.66 0.12 3,124 0.66 0.03 2,539 0.65 0.02 104 0.34 0.1 Winter
Race 1,733 1.44 0.05 62 0.94 0.10 2,462 0.80 0.03 2,114 0.57 0.02 88 0.33 0.1
Asian, Pacific Islander 182 1.59 0.12 5 0.62 0.15 265 0.95 0.10 265 0.48 0.05 16 0.04 0 American Indian, Alaskan Native 58 1.93 0.27 2 0.81 - 88 0.87 0.15 74 0.70 0.12 1 0.02 -Black 762 1.62 0.12 8 1.01 0.64 1,288 0.59 0.05 1,205 0.71 0.04 18 0.29 0.1 Other/NA 536 2.00 0.13 5 0.31 0.09 865 1.21 0.11 911 0.71 0.04 16 0.39 0.2 White
Region 5,655 1.42 0.03 213 0.86 0.05 8,228 0.71 0.02 6,631 0.58 0.01 323 0.36 0
Midwest 1,792 1.35 0.06 63 0.91 0.08 2,589 0.68 0.04 2,071 0.59 0.02 90 0.35 0.1 Northeast 1,385 1.46 0.05 43 0.72 0.10 2,122 0.68 0.02 1,342 0.56 0.02 78 0.42 0.1 South 2,201 1.44 0.05 64 1.07 0.09 3,356 0.70 0.04 3,465 0.68 0.02 99 0.29 0 West
Urbanization 1,815 1.67 0.06 63 0.69 0.04 2,667 0.89 0.03 2,208 0.52 0.03 107 0.33 0.1
City Center 2,091 1.46 0.05 81 0.85 0.07 3,182 0.75 0.03 2,840 0.62 0.02 110 0.28 0 Suburban 3,647 1.49 0.05 97 0.78 0.07 5,303 0.75 0.02 3,957 0.58 0.01 171 0.39 0.1 Non-metropolitan 1,455 1.45 0.03 55 0.98 0.11 2,249 0.67 0.04 2,289 0.61 0.01 93 0.35 0
Exposure F
actors Handbook
Page Septem
ber 2011 9-51

Exposure F
actors Handbook
Chapter 9—
Intake of Fruits and Vegetables
Table 9-17. Consumer-Only Intake of Individual Fruits and Vegetables Based on 1994−1996, 1998 CSFII (g/kg-day, edible portion, uncooked weight) (continued)
Population Group N Mean SE N Mean SE N Mean SE N Mean SE N Mean SE Berries and Small Fruits Broccoli Bulb Vegetables Cabbage Carrots
Whole Population Age Group
12,206 0.40 0.01 2,474 0.80 0.03 18,738 0.21 0.00 2,633 0.50 0.03 9,513 0.34 0.01
Birth to 1 year 229 0.81 0.07 49 2.09 0.33 489 0.22 0.02 15 0.61 0.41 179 1.39 0.20 1 to 2 years 1,396 1.38 0.06 242 2.11 0.16 1,957 0.32 0.01 160 0.73 0.11 999 0.87 0.05 3 to 5 years 3,166 0.99 0.04 475 1.67 0.09 4,207 0.28 0.01 369 0.78 0.07 2,048 0.74 0.03 6 to 12 years 1,523 0.54 0.04 213 1.29 0.16 2,040 0.22 0.01 190 0.63 0.11 904 0.50 0.03 13 to 19 years 679 0.27 0.03 102 0.69 0.07 1,194 0.20 0.01 106 0.40 0.06 482 0.27 0.02 20 to 49 years 2,393 0.27 0.02 640 0.68 0.04 4,546 0.22 0.01 746 0.45 0.03 2,289 0.28 0.01 ≥ 50 years
Season 2,820 0.31 0.01 753 0.63 0.03 4,305 0.18 0.00 1,047 0.52 0.02 2,612 0.29 0.01
Fall 2,706 0.31 0.02 582 0.81 0.05 4,310 0.22 0.01 623 0.44 0.03 2,338 0.35 0.02 Spring 3,202 0.45 0.03 651 0.82 0.07 4,835 0.21 0.01 684 0.52 0.03 2,345 0.36 0.02 Summer 3,558 0.48 0.02 660 0.79 0.05 5,280 0.20 0.01 676 0.56 0.07 2,440 0.33 0.01 Winter
Race 2,740 0.35 0.02 581 0.76 0.07 4,313 0.22 0.01 650 0.48 0.04 2,390 0.34 0.01
Asian, Pacific Islander 252 0.66 0.13 118 0.89 0.12 481 0.40 0.03 152 0.69 0.09 329 0.47 0.05 American Indian, Alaskan Native 85 0.26 0.04 16 1.18 0.43 169 0.25 0.04 18 0.34 0.13 82 0.26 0.03 Black 1,430 0.27 0.02 286 1.06 0.12 2,438 0.18 0.01 359 0.87 0.11 958 0.28 0.02 Other/NA 782 0.45 0.06 131 1.09 0.10 1,484 0.33 0.02 144 0.24 0.05 749 0.45 0.03 White
Region 9,657 0.41 0.01 1,923 0.73 0.03 14,166 0.20 0.00 1,960 0.43 0.02 7,395 0.34 0.01
Midwest 3,042 0.40 0.03 533 0.66 0.03 4,457 0.20 0.01 629 0.49 0.04 2,313 0.34 0.02 Northeast 2,383 0.37 0.03 511 0.84 0.07 3,324 0.20 0.01 413 0.56 0.06 1,843 0.34 0.01 South 3,896 0.35 0.02 810 0.83 0.04 6,497 0.19 0.01 978 0.52 0.06 2,981 0.31 0.01 West
Urbanization 2,885 0.48 0.03 620 0.83 0.08 4,460 0.26 0.01 613 0.41 0.03 2,376 0.40 0.01
City Center 3,525 0.38 0.02 741 0.83 0.06 5,547 0.22 0.01 794 0.58 0.07 2,759 0.34 0.01 Suburban 6,039 0.44 0.02 1,283 0.81 0.03 8,768 0.21 0.01 1,251 0.45 0.02 4,690 0.36 0.01 Non-metropolitan 2,642 0.31 0.03 450 0.64 0.05 4,423 0.20 0.01 588 0.48 0.04 2,064 0.32 0.01
Page E
xposure Factors H
andbook 9-52
September 2011

Exposure F
actors Handbook
Chapter 9—
Intake of Fruits and Vegetables
Table 9-17. Consumer-Only Intake of Individual Fruits and Vegetables Based on 1994−1996, 1998 CSFII (g/kg-day, edible portion, uncooked weight) (continued)
Population Group N Mean SE N Mean SE N Mean SE N Mean SE N Mean SE Citrus Fruits Corn Cucumbers Cucurbits Fruiting Vegetables
Whole Population Age Group
3,656 0.99 0.03 19,059 0.47 0.01 6,779 0.24 0.02 8,763 0.81 0.04 18,407 0.87 0.01
Birth to 1 year 37 2.79 0.53 671 1.05 0.07 25 0.28 0.11 213 3.19 0.29 371 1.24 0.11 1 to 2 years 336 3.06 0.20 2,027 1.17 0.05 439 0.52 0.05 682 2.29 0.17 1,927 1.70 0.06 3 to 5 years 751 2.75 0.15 4,334 1.26 0.03 1,266 0.56 0.05 1,694 2.15 0.17 4,180 1.53 0.03 6 to 12 years 324 1.60 0.12 2,064 0.88 0.03 667 0.43 0.06 833 1.34 0.15 2,014 1.10 0.03 13 to 19 years 157 0.90 0.15 1,176 0.45 0.01 500 0.26 0.06 563 0.69 0.16 1,176 0.82 0.03 20 to 49 years 841 0.68 0.04 4,415 0.34 0.01 2,033 0.20 0.01 2,400 0.55 0.03 4,489 0.78 0.02 ≥ 50 years
Season 1,210 0.84 0.03 4,372 0.28 0.01 1,849 0.21 0.01 2,378 0.81 0.05 4,250 0.71 0.02
Fall 761 0.93 0.06 4,342 0.44 0.01 1,374 0.22 0.02 1,778 0.46 0.03 4,186 0.87 0.03 Spring 1,002 0.97 0.05 4,909 0.47 0.02 1,906 0.23 0.01 2,408 0.94 0.07 4,755 0.82 0.02 Summer 815 0.53 0.04 5,423 0.52 0.02 2,070 0.32 0.05 2,855 1.32 0.10 5,262 0.93 0.02 Winter
Race 1,078 1.32 0.06 4,385 0.44 0.02 1,429 0.20 0.02 1,722 0.36 0.03 4,204 0.85 0.03
Asian, Pacific Islander 117 1.50 0.19 454 0.37 0.05 134 0.68 0.43 217 1.92 0.79 439 0.98 0.06 American Indian, Alaskan Native 41 1.61 0.17 165 0.55 0.06 60 0.23 0.06 75 1.04 0.32 162 0.93 0.08 Black 369 1.15 0.08 2,502 0.52 0.02 858 0.17 0.01 987 0.62 0.08 2,398 0.75 0.04 Other/NA 347 1.66 0.16 1,475 0.76 0.05 413 0.30 0.03 633 1.14 0.19 1,447 1.34 0.05 White
Region 2,782 0.89 0.03 14,463 0.44 0.01 5,314 0.24 0.01 6,851 0.77 0.03 13,961 0.85 0.01
Midwest 842 0.84 0.06 4,562 0.48 0.02 1,693 0.23 0.02 2,091 0.75 0.05 4,379 0.85 0.02 Northeast 754 0.94 0.06 3,377 0.43 0.01 1,191 0.25 0.02 1,614 0.85 0.08 3,254 0.88 0.02 South 998 0.94 0.04 6,648 0.46 0.01 2,356 0.22 0.02 2,905 0.70 0.06 6,416 0.81 0.03 West
Urbanization 1,062 1.20 0.07 4,472 0.49 0.02 1,539 0.29 0.07 2,153 0.99 0.12 4,358 0.96 0.03
City Center 1,146 1.01 0.04 5,641 0.47 0.01 1,965 0.22 0.01 2,570 0.71 0.05 5,477 0.89 0.03 Suburban 1,738 0.97 0.04 8,886 0.47 0.01 3,151 0.26 0.03 4,119 0.89 0.07 8,563 0.86 0.01 Non-metropolitan 772 0.99 0.07 4,532 0.45 0.02 1,663 0.25 0.03 2,074 0.78 0.06 4,367 0.85 0.04
Exposure F
actors Handbook
Page Septem
ber 2011 9-53

Exposure F
actors Handbook
Chapter 9—
Intake of Fruits and Vegetables
Table 9-17. Consumer-Only Intake of Individual Fruits and Vegetables Based on 1994−1996, 1998 CSFII (g/kg-day, edible portion, uncooked weight) (continued)
Population Group N Mean SE N Mean SE N Mean SE N Mean SE N Mean SE Leafy Vegetables Legumes Lettuce Okra Onions
Whole Population Age Group
17,637 0.65 0.01 19,258 0.45 0.01 8,430 0.46 0.01 272 0.51 0.04 18,678 0.20 0.00
Birth to 1 year 639 0.65 0.11 754 2.34 0.11 15 0.17 0.02 4 1.50 0.54 481 0.22 0.02 1 to 2 years 1,729 0.87 0.05 2,037 1.34 0.08 481 0.58 0.04 29 0.64 0.19 1,948 0.31 0.01 3 to 5 years 3,815 0.77 0.03 4,308 0.86 0.06 1,415 0.62 0.03 34 1.16 0.32 4,200 0.27 0.01 6 to 12 years 1,860 0.62 0.03 2,045 0.49 0.03 858 0.53 0.02 21 0.62 0.15 2,030 0.21 0.01 13 to 19 years 1,101 0.47 0.02 1,168 0.29 0.02 669 0.40 0.03 12 0.43 0.13 1,190 0.19 0.01 20 to 49 years 4,308 0.63 0.02 4,477 0.36 0.01 2,693 0.45 0.01 62 0.44 0.06 4,533 0.21 0.01 ≥ 50 years
Season 4,185 0.72 0.02 4,469 0.41 0.01 2,299 0.45 0.01 110 0.50 0.05 4,296 0.17 0.00
Fall 4,046 0.66 0.03 4,412 0.46 0.02 1,894 0.46 0.02 58 0.39 0.04 4,300 0.21 0.01 Spring 4,579 0.66 0.02 4,952 0.42 0.02 2,279 0.46 0.02 66 0.47 0.09 4,815 0.20 0.01 Summer 4,964 0.62 0.02 5,476 0.45 0.02 2,325 0.45 0.01 106 0.65 0.08 5,265 0.19 0.01 Winter
Race 4,048 0.66 0.02 4,418 0.46 0.02 1,932 0.46 0.02 42 0.53 0.13 4,298 0.21 0.01
Asian, Pacific Islander 469 1.22 0.12 503 0.79 0.09 191 0.58 0.09 15 0.20 0.06 480 0.39 0.03 American Indian, Alaskan Native 151 0.59 0.19 170 0.44 0.08 88 0.34 0.04 2 0.40 - 169 0.25 0.04 Black 2,367 0.73 0.04 2,563 0.52 0.04 884 0.35 0.02 67 0.63 0.08 2,431 0.17 0.01 Other/NA 1,329 0.59 0.04 1,478 0.58 0.05 643 0.49 0.04 15 0.70 0.25 1,484 0.32 0.02 White
Region 13,321 0.62 0.01 14,544 0.42 0.01 6,624 0.47 0.01 173 0.51 0.05 14,114 0.19 0.00
Midwest 4,226 0.60 0.03 4,577 0.41 0.02 2,035 0.47 0.03 24 0.42 0.20 4,448 0.19 0.01 Northeast 3,081 0.71 0.03 3,421 0.40 0.02 1,396 0.49 0.02 22 0.50 0.18 3,308 0.19 0.01 South 6,174 0.61 0.02 6,771 0.49 0.02 2,830 0.41 0.02 178 0.58 0.05 6,479 0.19 0.01 West
Urbanization 4,156 0.71 0.04 4,489 0.47 0.03 2,169 0.49 0.03 48 0.30 0.07 4,443 0.25 0.01
City Center 5,232 0.72 0.03 5,735 0.50 0.02 2,414 0.46 0.02 96 0.49 0.07 5,531 0.21 0.01 Suburban 8,220 0.67 0.02 8,950 0.43 0.02 3,999 0.49 0.01 102 0.59 0.07 8,739 0.20 0.01 Non-metropolitan 4,185 0.51 0.03 4,573 0.43 0.02 2,017 0.39 0.02 74 0.42 0.04 4,408 0.20 0.01
Page E
xposure Factors H
andbook 9-54
September 2011
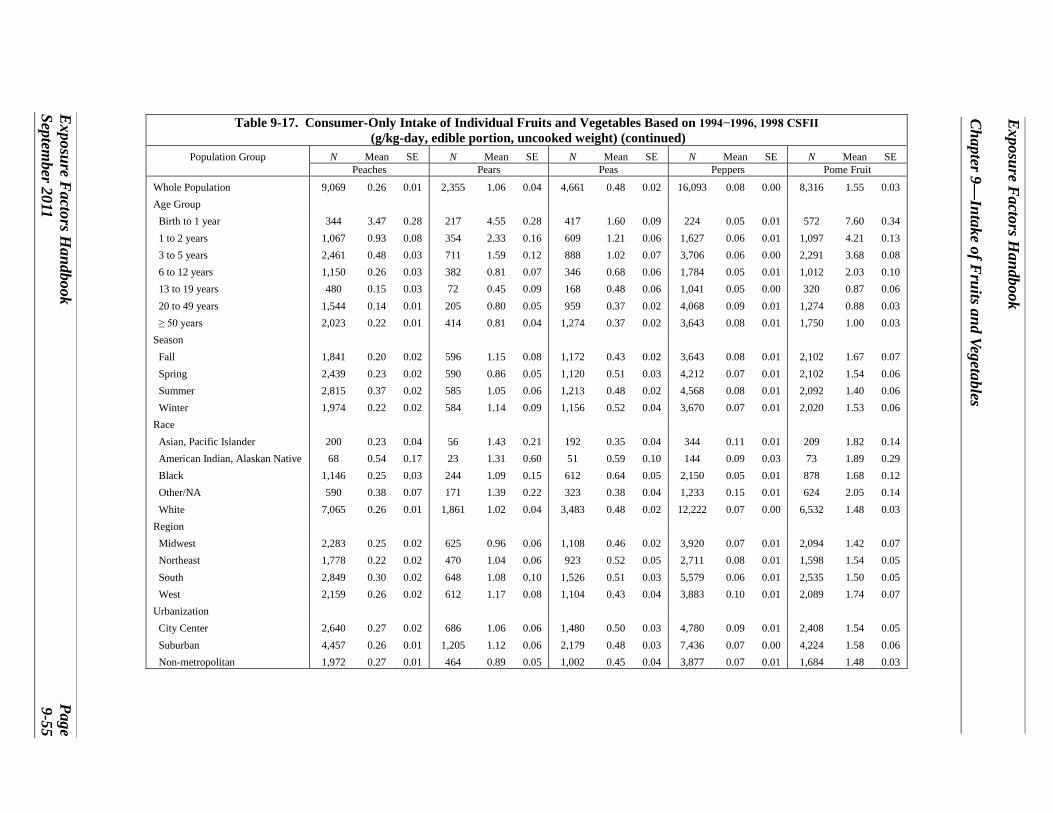
Exposure F
actors Handbook
Chapter 9—
Intake of Fruits and Vegetables
Table 9-17. Consumer-Only Intake of Individual Fruits and Vegetables Based on 1994−1996, 1998 CSFII (g/kg-day, edible portion, uncooked weight) (continued)
Population Group N Mean SE N Mean SE N Mean SE N Mean SE N Mean SE Peaches Pears Peas Peppers Pome Fruit
Whole Population Age Group
9,069 0.26 0.01 2,355 1.06 0.04 4,661 0.48 0.02 16,093 0.08 0.00 8,316 1.55 0.03
Birth to 1 year 344 3.47 0.28 217 4.55 0.28 417 1.60 0.09 224 0.05 0.01 572 7.60 0.34 1 to 2 years 1,067 0.93 0.08 354 2.33 0.16 609 1.21 0.06 1,627 0.06 0.01 1,097 4.21 0.13 3 to 5 years 2,461 0.48 0.03 711 1.59 0.12 888 1.02 0.07 3,706 0.06 0.00 2,291 3.68 0.08 6 to 12 years 1,150 0.26 0.03 382 0.81 0.07 346 0.68 0.06 1,784 0.05 0.01 1,012 2.03 0.10 13 to 19 years 480 0.15 0.03 72 0.45 0.09 168 0.48 0.06 1,041 0.05 0.00 320 0.87 0.06 20 to 49 years 1,544 0.14 0.01 205 0.80 0.05 959 0.37 0.02 4,068 0.09 0.01 1,274 0.88 0.03 ≥ 50 years
Season 2,023 0.22 0.01 414 0.81 0.04 1,274 0.37 0.02 3,643 0.08 0.01 1,750 1.00 0.03
Fall 1,841 0.20 0.02 596 1.15 0.08 1,172 0.43 0.02 3,643 0.08 0.01 2,102 1.67 0.07 Spring 2,439 0.23 0.02 590 0.86 0.05 1,120 0.51 0.03 4,212 0.07 0.01 2,102 1.54 0.06 Summer 2,815 0.37 0.02 585 1.05 0.06 1,213 0.48 0.02 4,568 0.08 0.01 2,092 1.40 0.06 Winter
Race 1,974 0.22 0.02 584 1.14 0.09 1,156 0.52 0.04 3,670 0.07 0.01 2,020 1.53 0.06
Asian, Pacific Islander 200 0.23 0.04 56 1.43 0.21 192 0.35 0.04 344 0.11 0.01 209 1.82 0.14 American Indian, Alaskan Native 68 0.54 0.17 23 1.31 0.60 51 0.59 0.10 144 0.09 0.03 73 1.89 0.29 Black 1,146 0.25 0.03 244 1.09 0.15 612 0.64 0.05 2,150 0.05 0.01 878 1.68 0.12 Other/NA 590 0.38 0.07 171 1.39 0.22 323 0.38 0.04 1,233 0.15 0.01 624 2.05 0.14 White
Region 7,065 0.26 0.01 1,861 1.02 0.04 3,483 0.48 0.02 12,222 0.07 0.00 6,532 1.48 0.03
Midwest 2,283 0.25 0.02 625 0.96 0.06 1,108 0.46 0.02 3,920 0.07 0.01 2,094 1.42 0.07 Northeast 1,778 0.22 0.02 470 1.04 0.06 923 0.52 0.05 2,711 0.08 0.01 1,598 1.54 0.05 South 2,849 0.30 0.02 648 1.08 0.10 1,526 0.51 0.03 5,579 0.06 0.01 2,535 1.50 0.05 West
Urbanization 2,159 0.26 0.02 612 1.17 0.08 1,104 0.43 0.04 3,883 0.10 0.01 2,089 1.74 0.07
City Center 2,640 0.27 0.02 686 1.06 0.06 1,480 0.50 0.03 4,780 0.09 0.01 2,408 1.54 0.05 Suburban 4,457 0.26 0.01 1,205 1.12 0.06 2,179 0.48 0.03 7,436 0.07 0.00 4,224 1.58 0.06 Non-metropolitan 1,972 0.27 0.01 464 0.89 0.05 1,002 0.45 0.04 3,877 0.07 0.01 1,684 1.48 0.03
Exposure F
actors Handbook
Page Septem
ber 2011 9-55
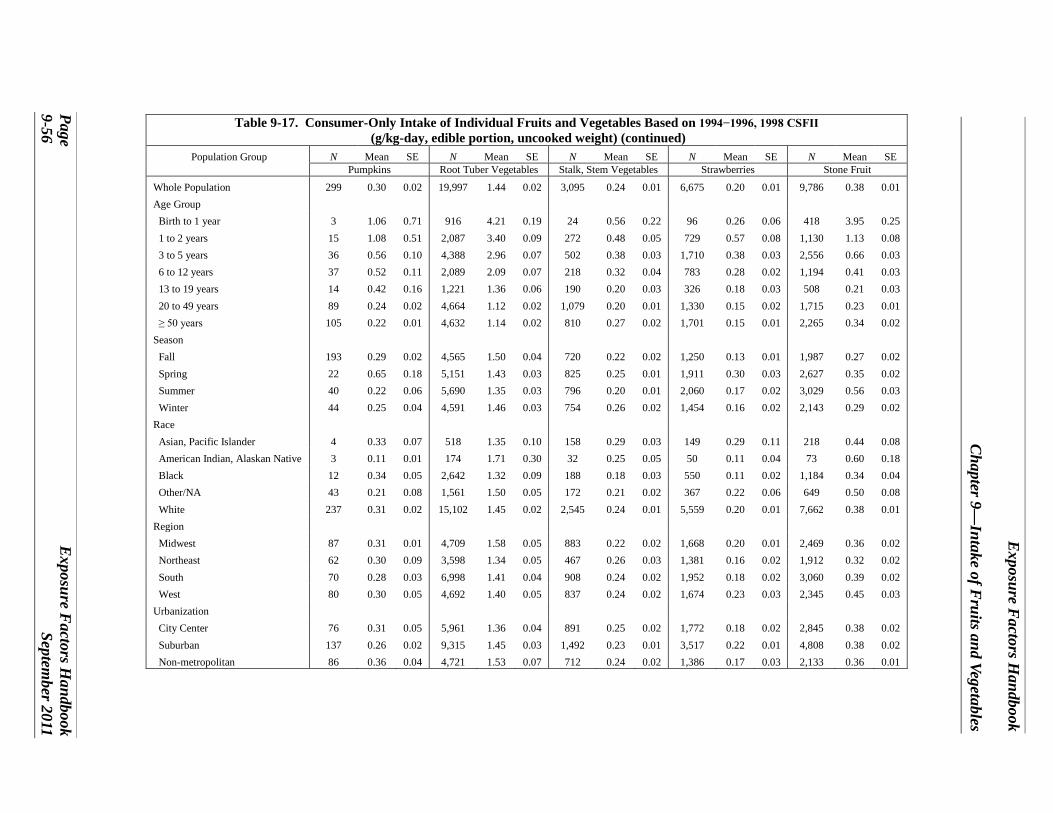
Exposure F
actors Handbook
Chapter 9—
Intake of Fruits and Vegetables
Table 9-17. Consumer-Only Intake of Individual Fruits and Vegetables Based on 1994−1996, 1998 CSFII (g/kg-day, edible portion, uncooked weight) (continued)
Population Group N Mean SE N Mean SE N Mean SE N Mean SE N Mean SE Pumpkins Root Tuber Vegetables Stalk, Stem Vegetables Strawberries Stone Fruit
Whole Population Age Group
299 0.30 0.02 19,997 1.44 0.02 3,095 0.24 0.01 6,675 0.20 0.01 9,786 0.38 0.01
Birth to 1 year 3 1.06 0.71 916 4.21 0.19 24 0.56 0.22 96 0.26 0.06 418 3.95 0.25 1 to 2 years 15 1.08 0.51 2,087 3.40 0.09 272 0.48 0.05 729 0.57 0.08 1,130 1.13 0.08 3 to 5 years 36 0.56 0.10 4,388 2.96 0.07 502 0.38 0.03 1,710 0.38 0.03 2,556 0.66 0.03 6 to 12 years 37 0.52 0.11 2,089 2.09 0.07 218 0.32 0.04 783 0.28 0.02 1,194 0.41 0.03 13 to 19 years 14 0.42 0.16 1,221 1.36 0.06 190 0.20 0.03 326 0.18 0.03 508 0.21 0.03 20 to 49 years 89 0.24 0.02 4,664 1.12 0.02 1,079 0.20 0.01 1,330 0.15 0.02 1,715 0.23 0.01 ≥ 50 years
Season 105 0.22 0.01 4,632 1.14 0.02 810 0.27 0.02 1,701 0.15 0.01 2,265 0.34 0.02
Fall 193 0.29 0.02 4,565 1.50 0.04 720 0.22 0.02 1,250 0.13 0.01 1,987 0.27 0.02 Spring 22 0.65 0.18 5,151 1.43 0.03 825 0.25 0.01 1,911 0.30 0.03 2,627 0.35 0.02 Summer 40 0.22 0.06 5,690 1.35 0.03 796 0.20 0.01 2,060 0.17 0.02 3,029 0.56 0.03 Winter
Race 44 0.25 0.04 4,591 1.46 0.03 754 0.26 0.02 1,454 0.16 0.02 2,143 0.29 0.02
Asian, Pacific Islander 4 0.33 0.07 518 1.35 0.10 158 0.29 0.03 149 0.29 0.11 218 0.44 0.08 American Indian, Alaskan Native 3 0.11 0.01 174 1.71 0.30 32 0.25 0.05 50 0.11 0.04 73 0.60 0.18 Black 12 0.34 0.05 2,642 1.32 0.09 188 0.18 0.03 550 0.11 0.02 1,184 0.34 0.04 Other/NA 43 0.21 0.08 1,561 1.50 0.05 172 0.21 0.02 367 0.22 0.06 649 0.50 0.08 White
Region 237 0.31 0.02 15,102 1.45 0.02 2,545 0.24 0.01 5,559 0.20 0.01 7,662 0.38 0.01
Midwest 87 0.31 0.01 4,709 1.58 0.05 883 0.22 0.02 1,668 0.20 0.01 2,469 0.36 0.02 Northeast 62 0.30 0.09 3,598 1.34 0.05 467 0.26 0.03 1,381 0.16 0.02 1,912 0.32 0.02 South 70 0.28 0.03 6,998 1.41 0.04 908 0.24 0.02 1,952 0.18 0.02 3,060 0.39 0.02 West
Urbanization 80 0.30 0.05 4,692 1.40 0.05 837 0.24 0.02 1,674 0.23 0.03 2,345 0.45 0.03
City Center 76 0.31 0.05 5,961 1.36 0.04 891 0.25 0.02 1,772 0.18 0.02 2,845 0.38 0.02 Suburban 137 0.26 0.02 9,315 1.45 0.03 1,492 0.23 0.01 3,517 0.22 0.01 4,808 0.38 0.02 Non-metropolitan 86 0.36 0.04 4,721 1.53 0.07 712 0.24 0.02 1,386 0.17 0.03 2,133 0.36 0.01
Page E
xposure Factors H
andbook 9-56
September 2011

Exposure F
actors Handbook
Chapter 9—
Intake of Fruits and Vegetables
Table 9-17. Consumer-Only Intake of Individual Fruits and Vegetables Based on 1994−1996, 1998 CSFII (g/kg-day, edible portion, uncooked weight) (continued)
Population Group N Mean SE N Mean SE N Mean SE Tomatoes Tropical Fruits White Potatoes
Whole Population Age Group
16,403 0.87 0.01 12,539 0.73 0.02 18,261 0.97 0.02
Birth to 1 year 315 1.42 0.13 630 3.09 0.12 577 1.60 0.15 1 to 2 years 1,684 1.86 0.06 1,476 2.81 0.12 1,918 2.14 0.09 3 to 5 years 3,764 1.63 0.03 3,106 1.57 0.05 4,147 1.84 0.06 6 to 12 years 1,832 1.15 0.03 1,407 0.75 0.05 1,963 1.29 0.06 13 to 19 years 1,098 0.82 0.03 652 0.35 0.04 4,271 0.81 0.02 20 to 49 years 4,053 0.75 0.02 2,428 0.51 0.02 2,664 0.75 0.02 ≥ 50 years
Season 3,657 0.72 0.01 2,840 0.64 0.02 4,254 0.78 0.02
Fall 3,732 0.87 0.03 2,748 0.75 0.03 4,205 1.00 0.04 Spring 4,173 0.82 0.02 3,291 0.72 0.03 4,703 0.96 0.03 Summer 4,731 0.94 0.02 3,595 0.70 0.02 5,190 0.94 0.03 Winter
Race 3,767 0.86 0.03 2,905 0.77 0.03 4,163 0.99 0.03
Asian, Pacific Islander 373 0.99 0.08 314 1.10 0.13 428 0.88 0.09 American Indian, Alaskan Native 146 0.92 0.08 103 0.79 0.12 162 1.40 0.33 Black 2,017 0.80 0.04 1,541 0.67 0.05 2,365 0.92 0.08 Other/NA 1,369 1.24 0.05 1,034 1.26 0.10 1,353 1.00 0.06 White
Region 12,498 0.85 0.01 9,547 0.69 0.02 13,953 0.98 0.02
Midwest 3,915 0.87 0.02 2,989 0.67 0.04 4,436 1.06 0.04 Northeast 2,906 0.88 0.02 2,412 0.75 0.02 3,199 0.90 0.03 South 5,629 0.83 0.02 4,016 0.67 0.03 6,415 0.98 0.04 West
Urbanization 3,953 0.93 0.02 3,122 0.87 0.03 4,211 0.92 0.06
City Center 4,867 0.89 0.02 3,750 0.79 0.03 5,337 0.91 0.04 Suburban 7,647 0.87 0.01 6,092 0.73 0.02 8,488 0.96 0.02 Non-metropolitan 3,889 0.86 0.03 2,697 0.64 0.05 4,436 1.08 0.06
N = Sample size. SE = Standard error. Note: Data for fruits and vegetables for which only small percentages of the population reported consumption may be less reliable than data for fruits and vegetables
with higher percentages consuming.
Source: U.S. EPA analysis of 1994−1996, 1998 CSFII.
Exposure F
actors Handbook
Page Septem
ber 2011 9-57
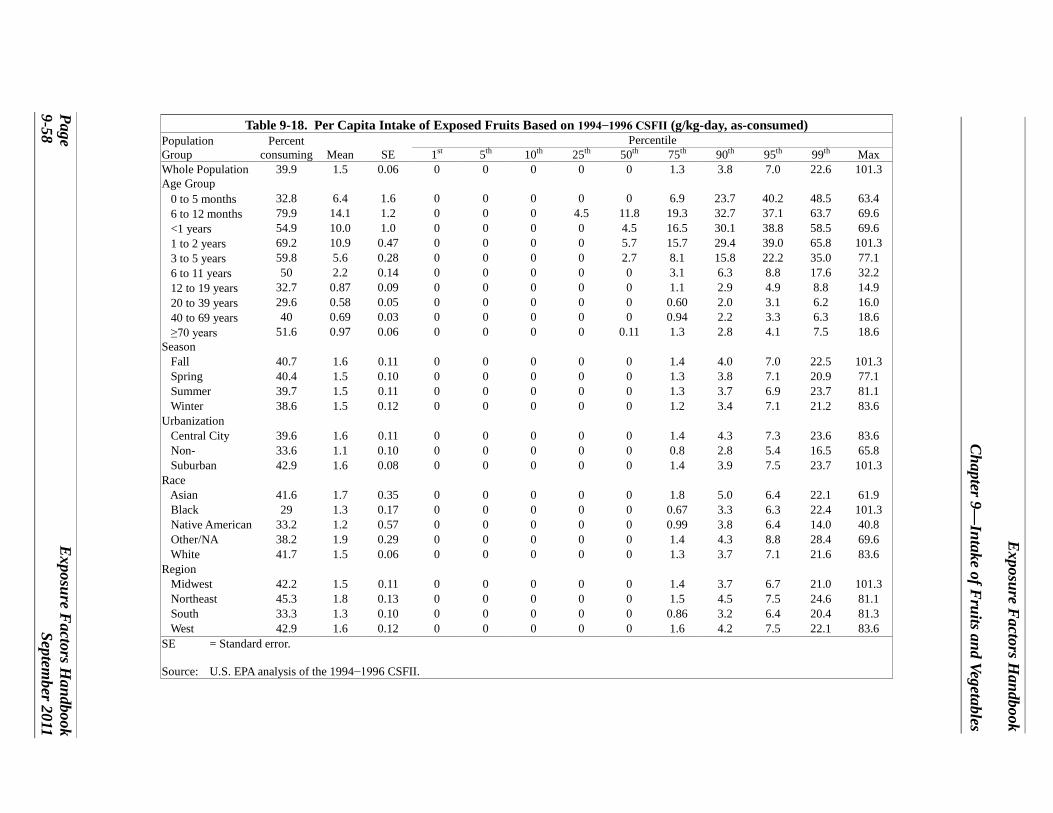
Exposure F
actors Handbook
Chapter 9—
Intake of Fruits and Vegetables
Page E
xposure Factors H
andbook 9-58
September 2011
Table 9-18. Per Capita Intake of Exposed Fruits Based on 1994−1996 CSFII (g/kg-day, as-consumed) Population
Group Percent
consuming
Mean
SE Percentile
1st 5th 10th 25th 50th 75th 90th 95th 99th Max Whole Population
Age Group 0 to 5 months 6 to 12 months <1 years 1 to 2 years 3 to 5 years 6 to 11 years 12 to 19 years 20 to 39 years 40 to 69 years ≥70 years
Season Fall Spring Summer Winter
Urbanization Central City Non Suburban Race Asian Black Native American Other/NA White Region Midwest Northeast South West
39.9
32.8 79.9 54.9 69.2 59.8
50 32.7 29.6
40 51.6
40.7 40.4 39.7 38.6
39.6 33.6 42.9
41.6 29 33.2 38.2 41.7
42.2 45.3 33.3 42.9
1.5
6.4 14.1 10.0 10.9 5.6 2.2 0.87 0.58 0.69 0.97
1.6 1.5 1.5 1.5
1.6 1.1 1.6
1.7 1.3 1.2 1.9 1.5
1.5 1.8 1.3 1.6
0.06
1.6 1.2 1.0 0.47 0.28 0.14 0.09 0.05 0.03 0.06
0.11 0.10 0.11 0.12
0.11 0.10 0.08
0.35 0.17 0.57 0.29 0.06
0.11 0.13 0.10 0.12
0
0 0 0 0 0 0 0 0 0 0
0 0 0 0
0 0 0
0 0 0 0 0
0 0 0 0
0
0 0 0 0 0 0 0 0 0 0
0 0 0 0
0 0 0
0 0 0 0 0
0 0 0 0
0
0 0 0 0 0 0 0 0 0 0
0 0 0 0
0 0 0
0 0 0 0 0
0 0 0 0
0
0 4.5
0 0 0 0 0 0 0 0
0 0 0 0
0 0 0
0 0 0 0 0
0 0 0 0
0
0 11.8
4.5 5.7 2.7
0 0 0 0
0.11
0 0 0 0
0 0 0
0 0 0 0 0
0 0 0 0
1.3
6.9 19.3 16.5 15.7 8.1 3.1 1.1 0.60 0.94 1.3
1.4 1.3 1.3 1.2
1.4 0.8 1.4
1.8 0.67 0.99 1.4 1.3
1.4 1.5 0.86 1.6
3.8
23.7 32.7 30.1 29.4 15.8 6.3 2.9 2.0 2.2 2.8
4.0 3.8 3.7 3.4
4.3 2.8 3.9
5.0 3.3 3.8 4.3 3.7
3.7 4.5 3.2 4.2
7.0
40.2 37.1 38.8 39.0 22.2 8.8 4.9 3.1 3.3 4.1
7.0 7.1 6.9 7.1
7.3 5.4 7.5
6.4 6.3 6.4 8.8 7.1
6.7 7.5 6.4 7.5
22.6
48.5 63.7 58.5 65.8 35.0 17.6 8.8 6.2 6.3 7.5
22.5 20.9 23.7 21.2
23.6 16.5 23.7
22.1 22.4 14.0 28.4 21.6
21.0 24.6 20.4 22.1
101.3
63.4 69.6 69.6 101.3
77.1 32.2 14.9 16.0 18.6 18.6
101.3 77.1 81.1 83.6
83.6 65.8 101.3
61.9 101.3
40.8 69.6 83.6
101.3 81.1 81.3 83.6
SE
Source:
= Standard error.
U.S. EPA analysis of the 1994−1996 CSFII.

Exposure F
actors Handbook
Chapter 9—
Intake of Fruits and Vegetables
Exposure F
actors Handbook
Page Septem
ber 2011 9-59
Table 9-19. Per Capita Intake of Protected Fruits Based on 1994−1996 CSFII (g/kg-day, as-consumed) Population
Group Percent
consuming
Mean
SE Percentile
1st 5th 10th 25th 50th 75th 90th 95th 99th Max Whole Population
Age Group 0 to 5 months 6 to 12 months <1 years 1 to 2 years 3 to 5 years 6 to 11 years 12 to 19 years 20 to 39 years 40 to 69 years ≥70 years
Season Fall Spring Summer Winter
Urbanization Central City Non-metropolitan Suburban Race Asian Black Native American Other/NA White Region Midwest Northeast South West
53
10.8 49 28.7 61.8 56.2 50.7 47.3
48 56.5 68.7
50.8 53.5 52.4 55.4
55.5 45.6 54.6
62.3 48.1 44.1 60.3
53
51 62.5 47.6 55.3
1.9
0.5 3.1 1.7 6.5 4.4 2.7 1.8 1.4 1.4 1.8
1.8 2.0 2.0 1.9
2.1 1.5 2.0
3.0 1.8 2.0 2.8 1.8
1.8 2.4 1.6 2.0
0.04
0.34 0.58 0.39 0.31 0.22 0.17 0.12 0.07 0.04 0.07
0.08 0.08 0.08 0.07
0.07 0.08 0.06
0.30 0.11 0.65 0.21 0.04
0.08 0.09 0.06 0.09
0
0 0 0 0 0 0 0 0 0 0
0 0 0 0
0 0 0
0 0 0 0 0
0 0 0 0
0
0 0 0 0 0 0 0 0 0 0
0 0 0 0
0 0 0
0 0 0 0 0
0 0 0 0
0
0 0 0 0 0 0 0 0 0 0
0 0 0 0
0 0 0
0 0 0 0 0
0 0 0 0
0
0 0 0 0 0 0 0 0 0 0
0 0 0 0
0 0 0
0 0 0 0 0
0 0 0 0
0.38
0 0 0
3.6 2.1 0.17
0 0
0.61 1.3
0.06 0.46 0.29 0.61
0.67 0
0.59
1.5 0 0
0.98 0.37
0.08 1.1
0 0.61
2.6
0 4.4 2.0 9.2 6.7 3.8 2.6 1.9 2.2 2.8
2.3 2.6 2.7 2.6
2.8 1.9 2.7
4.1 2.2 2.5 3.9 2.5
2.4 3.2 2.1 2.8
5.4
1.3 8.3 6.0 17.8 12.1 8.1 5.4 4.3 4.1 4.7
5.0 5.4 5.5 5.5
5.8 4.4 5.5
8.1 5.4 6.8 7.5 5.1
5.3 6.2 4.7 5.8
8.1
4.3 11.2
8.3 24.2 17.2
11.4 8.4 6.3 5.5 5.9
7.3 8.8 8.4 8.0
8.5 7.0 8.3
11.7 8.1 7.9 10.8 7.7
7.8 9.5 7.1 8.4
16.3
7.7 26.8 16.6 39.0 27.9 19.8 15.4
11.8 9.7 9.2
16.1 18.7 15.9 15.1
17.2 14.9 16.6
18.7 16.6 17.0 22.4 15.7
16.5 19.5 14.9 15.3
113.4
12.5 30.3 30.3
113.4 66.5 31.7 27.0 39.3 45.8 27.6
75.7 47.4
113.4 52.0
66.5 61.9
113.4
64.0 50.1 61.9
113.4 75.7
75.7 66.5 65.7
113.4 SE
Source:
= Standard error.
U.S. EPA analysis of the 1994−1996 CSFII.

Exposure F
actors Handbook
Chapter 9—
Intake of Fruits and Vegetables
Page E
xposure Factors H
andbook 9-60
September 2011
Table 9-20. Per Capita Intake of Exposed Vegetables (g/kg-day, as-consumed) Population
Group Percent
consuming
Mean
SE Percentile
1st 5th 10th 25th 50th 75th 90th 95th 99th Max Whole Population
Age Group 0 to 5 months 6 to 12 months <1 years 1 to 2 years 3 to 5 years 6 to 11 years 12 to 19 years 20 to 39 years 40 to 69 years ≥70 years
Season Fall Spring Summer Winter
Urbanization Central City Non-metropolitan Suburban Race Asian Black Native American Other/NA White Region Midwest Northeast South West
79.2
6 40.8 22.3 63.3 67.8 70.8 77.4 82.6
84 83.2
79.6 78.8 81.2 77.4
79.5 78 79.6
82.2 76.3 70.7 73.8 80.1
80.2 79.4 79.6 77.5
1.3
0.48 2.0 1.2 2.0 1.6 1.2 0.97 1.3 1.4 1.5
1.3 1.3 1.5 1.2
1.4 1.2 1.4
2.1 1.2 1.3 1.3 1.3
1.3 1.4 1.3 1.3
0.02
0.62 0.49 0.37 0.11 0.08 0.06 0.04 0.03 0.02 0.05
0.03 0.03 0.03 0.03
0.03 0.03 0.02
0.15 0.04 0.40 0.08 0.02
0.03 0.04 0.03 0.04
0
0 0 0 0 0 0 0 0 0 0
0 0 0 0
0 0 0
0 0 0 0 0
0 0 0 0
0
0 0 0 0 0 0 0 0 0 0
0 0 0 0
0 0 0
0 0 0 0 0
0 0 0 0
0
0 0 0 0 0 0 0 0 0 0
0 0 0 0
0 0 0
0 0 0 0 0
0 0 0 0
0.11
0 0 0 0 0 0
0.06 0.15 0.28 0.31
0.12 0.09 0.16 0.08
0.12 0.08 0.12
0.34 0.04
0 0
0.13
0.12 0.12 0.12 0.08
0.80
0 0 0
0.59 0.67 0.60 0.53 0.81 0.97 1.09
0.79 0.79 0.92 0.74
0.83 0.69 0.85
1.39 0.66 0.45 0.73 0.82
0.81 0.91 0.78 0.78
1.9
0 3.1
0 2.7 2.2 1.6 1.3 1.8 2.0 2.1
1.9 1.8 2.1 1.7
2.0 1.6 1.9
3.0 1.7 1.5 1.8 1.9
1.8 2.1 1.8 1.8
3.4
0 5.8 5.0 5.8 4.4 3.4 2.5 3.2 3.3 3.6
3.4 3.3 3.5 3.2
3.5 2.9 3.4
4.9 3.3 2.0 3.3 3.3
3.3 3.5 3.2 3.4
4.4
4.6 10.3 7.4 8.6 6.4 4.8 3.6 4.1 4.3 4.4
4.4 4.3 4.8 4.2
4.5 4.1 4.5
7.1 4.1 4.5 4.7 4.4
4.4 4.6 4.2 4.6
7.6
11.8 14.7 14.7 14.9 12.8 8.1 5.8 6.9 6.4 7.2
7.3 7.9 8.6 7.0
8.1 6.9 7.8
13.0 7.2 9.5 10.4 7.2
7.1 7.9 7.1 8.9
45.0
12.5 19.0 19.0 45.0 25.1 19.6 13.0 18.4 16.4 20.1
45.0 25.1 25.1 20.9
25.1 45.0 25.1
20.1 20.9 45.0 24.8 25.1
24.8 25.1 25.1 45.0
SE
Source:
= Standard error.
U.S. EPA analysis of the 1994−1996 CSFII.
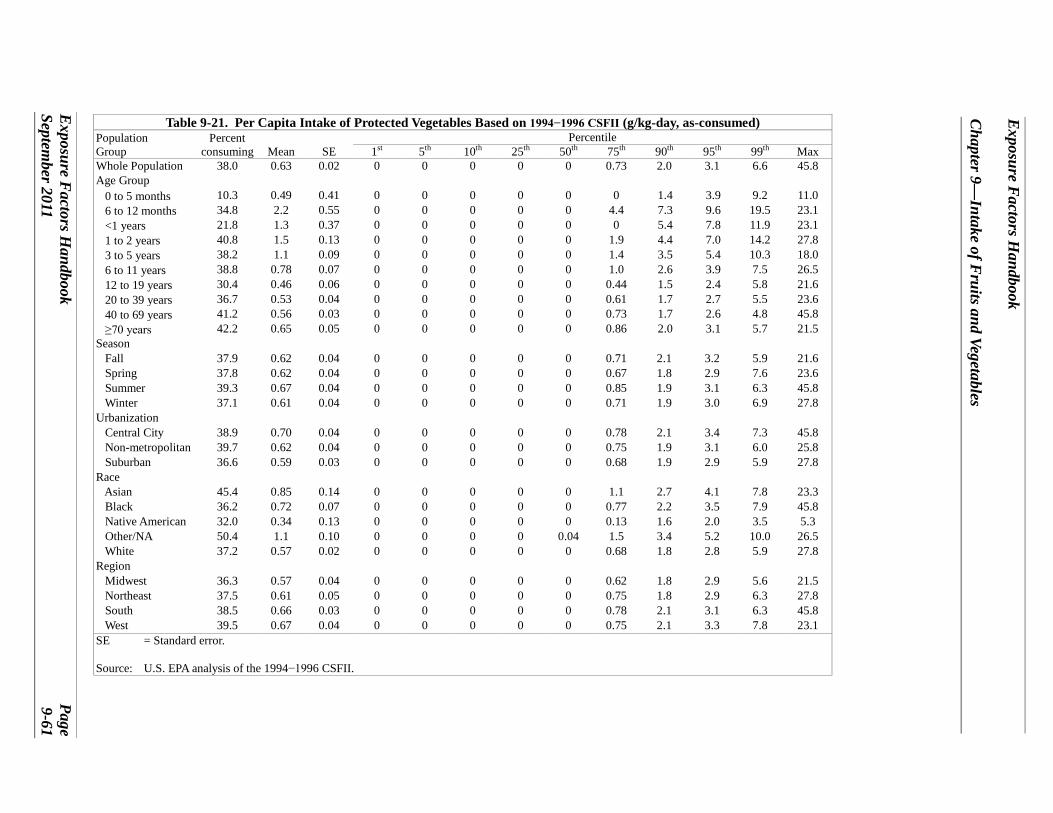
Exposure F
actors Handbook
Chapter 9—
Intake of Fruits and Vegetables
Exposure F
actors Handbook
Page Septem
ber 2011 9-61
Table 9-21. Per Capita Intake of Protected Vegetables Based on 1994−1996 CSFII (g/kg-day, as-consumed) Population
Group Percent
consuming
Mean
SE Percentile
1st 5th 10th 25th 50th 75th 90th 95th 99th Max Whole Population
Age Group 0 to 5 months 6 to 12 months <1 years 1 to 2 years 3 to 5 years 6 to 11 years 12 to 19 years 20 to 39 years 40 to 69 years ≥70 years
Season Fall Spring Summer Winter
Urbanization Central City Non-metropolitan Suburban Race Asian Black Native American Other/NA White Region Midwest Northeast South West
38.0
10.3 34.8 21.8 40.8 38.2 38.8 30.4 36.7 41.2 42.2
37.9 37.8 39.3 37.1
38.9 39.7 36.6
45.4 36.2 32.0 50.4 37.2
36.3 37.5 38.5 39.5
0.63
0.49 2.2 1.3 1.5 1.1 0.78 0.46 0.53 0.56 0.65
0.62 0.62 0.67 0.61
0.70 0.62 0.59
0.85 0.72 0.34 1.1 0.57
0.57 0.61 0.66 0.67
0.02
0.41 0.55 0.37 0.13 0.09 0.07 0.06 0.04 0.03 0.05
0.04 0.04 0.04 0.04
0.04 0.04 0.03
0.14 0.07 0.13 0.10 0.02
0.04 0.05 0.03 0.04
0
0 0 0 0 0 0 0 0 0 0
0 0 0 0
0 0 0
0 0 0 0 0
0 0 0 0
0
0 0 0 0 0 0 0 0 0 0
0 0 0 0
0 0 0
0 0 0 0 0
0 0 0 0
0
0 0 0 0 0 0 0 0 0 0
0 0 0 0
0 0 0
0 0 0 0 0
0 0 0 0
0
0 0 0 0 0 0 0 0 0 0
0 0 0 0
0 0 0
0 0 0 0 0
0 0 0 0
0
0 0 0 0 0 0 0 0 0 0
0 0 0 0
0 0 0
0 0 0
0.04 0
0 0 0 0
0.73
0 4.4
0 1.9 1.4 1.0 0.44 0.61 0.73 0.86
0.71 0.67 0.85 0.71
0.78 0.75 0.68
1.1 0.77 0.13 1.5 0.68
0.62 0.75 0.78 0.75
2.0
1.4 7.3 5.4 4.4 3.5 2.6 1.5 1.7 1.7 2.0
2.1 1.8 1.9 1.9
2.1 1.9 1.9
2.7 2.2 1.6 3.4 1.8
1.8 1.8 2.1 2.1
3.1
3.9 9.6 7.8 7.0 5.4 3.9 2.4 2.7 2.6 3.1
3.2 2.9 3.1 3.0
3.4 3.1 2.9
4.1 3.5 2.0 5.2 2.8
2.9 2.9 3.1 3.3
6.6
9.2 19.5
11.9 14.2 10.3 7.5 5.8 5.5 4.8 5.7
5.9 7.6 6.3 6.9
7.3 6.0 5.9
7.8 7.9 3.5 10.0 5.9
5.6 6.3 6.3 7.8
45.8
11.0 23.1 23.1 27.8 18.0 26.5 21.6 23.6 45.8 21.5
21.6 23.6 45.8 27.8
45.8 25.8 27.8
23.3 45.8 5.3 26.5 27.8
21.5 27.8 45.8 23.1
SE
Source:
= Standard error.
U.S. EPA analysis of the 1994−1996 CSFII.

Exposure F
actors Handbook
Chapter 9—
Intake of Fruits and Vegetables
Page E
xposure Factors H
andbook 9-62
September 2011
Table 9-22. Per Capita Intake of Root Vegetables Based on 1994−1996 CSFII (g/kg-day, as-consumed) Population
Group Percent
consuming
Mean
SE Percentile
1st 5th 10th 25th 50th 75th 90th 95th 99th Max Whole Population
Age Group 0 to 5 months 6 to 12 months <1 years 1 to 2 years 3 to 5 years 6 to 11 years 12 to 19 years 20 to 39 years 40 to 69 years ≥70 years
Season Fall Spring Summer Winter
Urbanization Central City Non-metropolitan Suburban Race Asian Black Native American Other/NA White Region Midwest Northeast South West
75.4
12 56.9
33 67.5 71.9 73.8 76.4 77.5 77.2 73.2
77.3 75.9
74 74.4
71.9 78.5 76.4
64.2 68.9 71.1
67 77.5
79.4 72.3
77 71.3
1.2
0.96 2.8 1.8 2.6 2.2 1.6 1.3 1.1 0.99 1.1
1.3 1.2 1.2 1.2
1.2 1.4 1.2
0.97 1.1 1.4 1.1 1.3
1.4 1.1 1.3 1.1
0.02
0.61 0.45 0.36 0.13 0.09 0.06 0.05 0.03 0.02 0.04
0.04 0.03 0.03 0.03
0.03 0.04 0.02
0.10 0.05 0.27 0.10 0.02
0.04 0.03 0.03 0.03
0
0 0 0 0 0 0 0 0 0 0
0 0 0 0
0 0 0
0 0 0 0 0
0 0 0 0
0
0 0 0 0 0 0 0 0 0 0
0 0 0 0
0 0 0
0 0 0 0 0
0 0 0 0
0
0 0 0 0 0 0 0 0 0 0
0 0 0 0
0 0 0
0 0 0 0 0
0 0 0 0
0.03
0 0 0 0 0 0
0.09 0.10 0.08
0
0.09 0.05
0 0
0 0.14 0.07
0 0 0 0
0.09
0.16 0
0.09 0
0.75
0 0.80
0 1.5 1.4 1.0 0.82 0.73 0.68 0.70
0.83 0.73 0.73 0.74
0.66 0.89 0.77
0.37 0.62 1.0 0.50 0.81
0.90 0.64 0.81 0.61
1.7
0 4.6 2.3 3.6 3.2 2.3 1.8 1.6 1.5 1.6
1.8 1.7 1.6 1.7
1.6 1.9 1.7
1.3 1.4 1.9 1.4 1.8
2.0 1.5 1.8 1.5
3.0
3.9 8.0 6.9 6.8 5.5 4.2 3.0 2.7 2.5 2.7
3.1 3.1 2.9 3.0
2.9 3.2 3.0
2.8 2.9 2.8 2.8 3.1
3.4 2.9 3.0 2.8
4.1
8.3 10.4 9.6 8.3 7.1 5.3 4.0 3.5 3.2 3.4
4.2 4.3 3.9 4.1
4.2 4.5 4.0
4.0 4.2 3.0 3.7 4.2
4.6 3.8 4.1 3.7
7.6
11.9 16.6 15.6 16.8 14.1 9.5 7.7 6.0 4.8 5.3
8.1 7.7 7.4 7.4
7.3 9.5 7.2
7.1 7.6
11.2 9.6 7.5
8.6 7.1 7.6 6.9
83.3
21.9 32.9 32.9 83.3 32.1 20.6 22.5 16.6 15.1 9.8
83.3 30.0 25.8 34.3
83.3 34.3 26.1
17.3 32.9 34.3 83.3 32.1
26.1 20.7 83.3 34.3
SE
Source:
= Standard error.
U.S. EPA analysis of the 1994−1996 CSFII.

Table 9-23. Quantity (as-consumed) of Fruits and Vegetables Consumed per Eating Occasion and the Percentage of Individuals Consuming Exposure F
actors Handbook
Chapter 9—
Intake of Fruits and Vegetables
Exposure F
actors Handbook
Page Septem
ber 2011 9-63
These Foods in Two Days
Food category Percent Consuminga
Quantity Consumed per Eating Occasion (gram) Average SE 5
Consumer-Only Quantity Consumed per Eating Occasion at Specified Percentiles (gram)a
10 25 50 75 90 95 Raw vegetables Cucumbers 10.8 48 3 7 14 16 29 54 100 157 Lettuce 53.3 41 1 7 8 13 27 55 91 110 Mixed lettuce-based salad 2.2 97 6 11 18 55 74 123 167 229 Carrots 14.1 33 1 5 7 14 27 40 61 100 Tomatoes 32.0 53 1 15 20 27 40 61 93 123 Coleslaw 5.0 102 3 18 32 55 91 134 179 183 Onions 14.4 23 1 3 7 10 15 28 41 60
Cooked vegetables Broccoli 7.3 119 4 23 35 61 92 156 232 275 Carrots 5.8 72 2 13 19 36 65 78 146 156 Total tomato sauce 54.3 34 1 1 2 7 17 40 80 124 String beans 13.2 90 2 17 31 52 68 125 136 202 Peas 6.1 86 3 11 21 40 80 120 167 170 Corn 15.1 101 2 20 33 55 82 123 171 228 French-fried potatoes 25.5 83 1 28 35 57 70 112 125 140 Home-fried and hash-browned potatoes 8.9 135 3 36 47 70 105 192 284 308 Baked potatoes 12.4 120 2 48 61 92 106 143 184 217 Boiled potatoes 5.3 157 5 34 52 91 123 197 308 368 Mashed potatoes 15.0 188 3 46 61 105 156 207 397 413 Dried beans and peas 8.0 133 3 22 33 64 101 173 259 345 Baked beans 4.7 171 6 24 47 84 126 235 314 385
Fruits Raw oranges 7.9 132 2 42 64 95 127 131 183 253 Orange juice 27.2 268 4 124 124 187 249 311 447 498 Raw apples 15.6 135 2 46 68 105 134 137 209 211 Applesauce and cooked apples 4.6 134 4 31 59 85 121 142 249 254 Apple juice 7.0 271 7 117 120 182 242 307 481 525 Raw bananas 20.8 111 1 55 58 100 117 118 135 136 a = Percent consuming at least once in two days. SE = Standard error of the mean. Source: Smiciklas-Wright et al. (2002) (based on 1994−1996 CSFII data).

Exposure F
actors Handbook
Chapter 9—
Intake of Fruits and Vegetables
Page E
xposure Factors H
andbook 9-64
September 2011
Table 9-24. Quantity (as-consumed) of Fruits and Vegetables Consumed per Eating Occasion and Percentage of Individuals Consuming These Foods in Two Days, by Food
Food category
Quantity consumed per eating occasion (grams)
2 to 5 years 6 to 11 years 12 to 19 years
Male and Female (N = 2,109)
Male and Female Male (N = 1,432) (N = 696)
Female (N = 702)
PC Mean SE PC Mean SE PC Mean SE PC Mean SE Raw Vegetables
Carrots Cucumbers Lettuce
Onions Tomatoes
10.4 6.4 34.0 3.9 14.8
27 32 17
9 31
2 4 1 2 2
17.8 6.6 40.8
4.5 14.0
32 39 26 17 42
2 6 1 2 4
9.2 6.1 56.0
11.1 25.7
35 71a
32 28 49
6 22a
3 4
5
11.9 6.8 52.3
7.9 23.9
32 48 34 23 44
4 11
2 4
3 Cooked Vegetables
Beans (string) Broccoli
Carrots Corn Peas
Potatoes (French-fried) Potatoes (home-fried and hash-browned)
Potatoes (baked) Potatoes (boiled)
Potatoes (mashed)
16.8 7.2 6.0 18.9 8.4 32.7 9.3 7.6 4.8 14.8
50 61 48 68 48 52 85 70 81
118
2 3 4 3 3 1 5 4 9 6
12.1 5.6 3.8 22.2
6.8 33.7 10.1
8.2 2.7 13.3
71 102
46 79 72 67 93 95 103a
162
6 16
5 4 9 2 6 6
17a
12
8.3 3.9 2.8 12.8
3.6 41.7 10.1
8.6 2.0 14.6
85 127a
81a
125 115a
97 145 152 250a
245
9 17a
16a
9 15a
3 13 15 40a
16
7.6 5.7 2.1 12.3
2.4 38.1
6.1 8.8 3.2
11.9
78 109a
75a
100 93a
81 138
115 144a
170
5 14a
17a
6 17a
4 13 10 16a
17 Fruits
Apples (raw) Apples (cooked and applesauce)
Apple juiceBananas (raw) Oranges (raw)
Orange juice
26.8 10.1 26.3 25.0
11.1 34.4
106 118
207 95 103 190
2 5 5 2 5 4
21.9 9.0 12.2 16.5 10.5 30.9
123 130 223 105
114 224
3 7 10 3 5 6
11.7 2.3 7.8 10.3
4.3 30.8
149 153a
346 122 187a
354
9 19a
22 6
38a
16
12.4 2.6 8.5 8.4 5.4 29.5
129 200a
360 119
109a
305
5 47a
44 5 8a 11

Exposure F
actors Handbook
Chapter 9—
Intake of Fruits and Vegetables
Exposure F
actors Handbook
Page Septem
ber 2011 9-65
Table 9-24. Quantity (as-consumed) of Fruits and Vegetables Consumed Per Eating Occasion and Percentage of Individuals Consuming These Foods in Two Days, by Food (continued)
Food category Quantity consumed per eating occasion (grams)
20 to <40 years 40 to <60 years ≥60 years Male
(N = 1,543) Female
(N = 1,449) Male
(N = 1,663) Female
(N = 1,694) Male
(N = 1,545) Female
(N = 1,429)
PC Mean SE PC Mean SE PC Mean SE PC Mean SE PC Mean SE PC Mean SE Raw Vegetables
Carrots 12.3 35 4 15.4 38 4 14.4 35 2 18.1 31 2 13.6 29 2 12.7 27 1 Cucumbers 10.5 62 12 10.4 45 4 12.5 47 4 15.7 41 3 14.2 51 4 13.2 45 3 Lettuce 63.4 40 2 57.6 44 2 55.5 48 2 59.1 48 1 48.1 47 2 46.1 42 2 Onions 17.9 27 2 14.7 22 1 19.6 26 1 18.3 19 1 19.0 19 1 15.6 19 1 Tomatoes 33.1 57 2 32.3 49 2 38.1 60 2 42.4 53 1 40.0 62 3 41.0 52 2
Cooked Vegetables Beans (string) 10.6 111 5 12.5 89 6 13.7 114 6 13.4 93 4 18.3 99 4 19.7 78 3 Broccoli 7.6 152 13 6.7 129 13 7.8 127 7 7.6 114 7 8.5 117 7 10.9 107 6 Carrots 5.0 79 7 5.3 69 6 6.7 83 7 6.4 66 4 9.6 78 4 9.0 75 4 Corn 12.7 122 5 15.3 98 5 17.1 133 6 13.5 90 3 14.2 109 4 13.0 83 5 Peas 4.4 109 10 4.9 82 9 7.4 113 7 6.3 79 7 8.4 88 7 9.4 73 5 Potatoes (French-fried) 35.3 107 2 23.9 79 3 20.6 89 2 16.8 72 3 11.2 76 3 8.1 58 3 Potatoes (home-fried/hash-browned) 9.5 160 10 8.8 129 7 11. 174 10 6.4 119 7 10.4 152 8 7.1 110 9 Potatoes (baked) 11.4 154 7 11.1 126 5 13.0 133 3 16.5 112 3 17.9 115 3 18.1 100 4 Potatoes (boiled) 3.9 185 16 2.9 162 15 6.3 209 12 7.0 142 9 11.0 166 6 10.2 131 5 Potatoes (mashed) 14.7 269 12 13.5 167 5 16.0 225 11 14.3 156 7 19.7 173 6 18.1 140 5
Fruits Apples (raw) 6.6 153 8 6.3 126 6 7.4 148 8 8.3 132 5 8.9 133 5 11.2 129 4 Apples (cooked and applesauce) 24.3 373 20 23.2 289 12 24.1 285 10 25.2 231 6 30.2 213 5 31.7 196 5 Apple juice 12.1 161 6 12.9 134 3 14.1 145 3 16.2 136 4 17.6 145 8 16.1 128 3 Bananas (raw) 1.3 153a 31a 2.4 155a 21a 3.1 142 12 3.9 125 10 8.1 135 10 9.2 121 7 Oranges (raw) 4.2 345 20 4.7 302 19 4.7 358 33 3.2 259 21 4.8 233 11 5.0 225 13 Orange juice 14.4 126 2 18.5 112 2 21.9 125 3 24.4 111 2 36.5 105 2 34.0 96 2 a Indicates a statistic that is potentially unreliable because of a small sample size and a large SE. PC = Percent consuming at least once in two days. SE = Standard error of the mean. N = Sample size.
Source: Smiciklas-Wright et al. (2002) (based on 1994−1996 CSFII data).

Exposure Factors Handbook
Chapter 9—Intake of Fruits and Vegetables
Table 9-25. Consumption of Major Food Groups: Median Servings (and ranges) by Demographic and Health Characteristics, for Older Adults
Subject Characteristic N Fruits and Vegetables (servings per day)
Sex Female 80 5.7 (1.5−8.1) Male 50 4.5 (0.8−8.8)
Ethnicitya
African American 44 4.5 (0.8−8.0) European American 47 6.0 (1.5−8.0) Native American 39 4.5 (1.6−8.8)
Age 70 to 74 years 42 4.5 (1.6−8.1) 75 to 79 years 36 5.6 (0.8−8.0) 80 to 84 years 36 5.6 (1.5−8.8) ≥ 85 years 16 5.4 (1.8−8.0)
Marital Status Married 49 4.5 (1.6−8.0) Not Married 81 5.6 (0.8−8.8)
Education 8th grade or less 37 5.0 (1.5−8.1) 9th to 12th grades 47 4.5 (0.8−8.0) > High School 46 6.0 (1.5−8.8)
Dentures Yes 83 5.4 (1.5−8.8) No 47 4.7 (0.8−8.0)
Chronic Diseases 0 7 7.0 (5.2−8.8) 1 31 5.4 (1.5−8.0) 2 56 5.4 (1.6−8.1) 3 26 4.5 (2.0−8.0) 4+ 10 5.5 (0.8−8.0)
Weightb
130 pounds 18 6.0 (1.8−8.0) 131 to 150 pounds 32 5.5 (1.5−8.0) 151 to 170 pounds 27 5.7 (1.7−8.1) 171 to 190 pounds 22 5.6 (1.8−8.8) 191 pounds 29 4.5 (0.8−8.0)
a p < 0.05. b Two missing values. N = Number of individuals.
Source: Vitolins et al. (2002).
Page Exposure Factors Handbook 9-66 September 2011

Exposure Factors Handbook
Chapter 9—Intake of Fruits and Vegetables
Table 9-26. Characteristics of the Feeding Infants and Toddlers Study (FITS) Sample Population Sample Size Percentage of Sample
Sex Male Female
1,549 1,473
51.3 48.7
Age of Child 4 to 6 months 7 to 8 months 9 to 11 months 12 to 14 months 15 to 18 months 19 to 24 months
862 483 679 374 308 316
28.5 16.0 22.5 12.4 10.2 10.4
Child’s Ethnicity Hispanic or Latino Non-Hispanic or Latino Missing
367 2,641
14
12.1 87.4 0.5
Child’s Race White Black Other
2,417 225 380
80.0 7.4
12.6 Urbanicity
Urban Suburban Rural Missing data
1,389 1,014 577 42
46.0 33.6 19.1 1.3
Household Income Under $10,000 $10,000 to $14,999 $15,000 to $24,999 $25,000 to $34,999 $35,000 to $49,999 $50,000 to $74,999 $75,000 to $99,999 $100,000 and Over Missing
48 48
221 359 723 588 311 272 452
1.6 1.6 7.3 11.9 23.9 19.5 10.3 9.0
14.9 Receives WIC Yes No Missing
821 2,196
5
27.2 72.6 0.2
Sample Size (Unweighted) 3,022 100.0 WIC = Special Supplemental Nutrition Program for Women, Infants, and Children.
Source: Devaney et al. (2004).
Exposure Factors Handbook Page September 2011 9-67

Table 9-27. Percentage of Infants and Toddlers Consuming Different Types of Vegetables Percentage of Infants and Toddlers Consuming at Least Once in a Day
Food Group/Food 4 to 6 months
7 to 8 months
9 to 11 months
12 to 14 months
15 to 18 months
19 to 24 months
Any Vegetable 39.9 66.5 72.6 76.5 79.2 81.6 Baby Food Vegetables 35.7 54.5 34.4 12.7 3.0 1.6 Cooked Vegetables 5.2 17.4 45.9 66.3 72.9 75.6 Raw Vegetables 0.5 1.6 5.5 7.9 14.3 18.6
Types of Vegetablesa
Dark Green Vegetablesb 0.1 2.9 4.2 5.0 10.4 7.8 Deep Yellow Vegetablesc 26.5 39.3 29.0 24.0 13.6 13.4 White Potatoes 3.6 12.4 24.1 33.2 42.0 40.6 French Fries and Other Fried Potatoes 0.7 2.9 8.6 12.9 19.8 25.5 Other Starchy Vegetablesd 6.5 10.9 16.9 17.3 20.8 24.2 Other Vegetables 11.2 25.9 35.1 39.1 45.6 43.3 a Totals include commercial baby food, cooked vegetables, and raw vegetables. b Reported dark green vegetables include broccoli, spinach and other greens, and romaine lettuce. c Reported deep yellow vegetables include carrots, pumpkin, sweet potatoes, and winter squash. d Reported starchy vegetables include corn, green peas, immature lima beans, black-eyed peas (not dried), cassava, and rutabaga.
Source: Fox et al. (2004).
Exposure Factors Handbook
Chapter 9—Intake of Fruits and Vegetables
Page Exposure Factors Handbook 9-68 September 2011

Exposure Factors Handbook
Chapter 9—Intake of Fruits and Vegetables
Table 9-28. Top Five Vegetables Consumed by Infants and Toddlers Top Vegetables by Age Groupa Percentage Consuming at Least Once in a Day
4 to 6 months Baby Food Carrots 9.6 Baby Food Sweet Potatoes 9.1 Baby Food Squash 8.1 Baby Food Green Beans 7.2 Baby Food Peas 5.0
7 to 8 months Baby Food Carrots 14.2 Baby Food Sweet Potatoes 12.9 Baby Food Squash 12.9 Baby Food Green Beans 11.2 Baby Food Mixed/Garden Vegetables 10.1
9 to 11 months Cooked Green Beans 9.7 Mashed/Whipped Potatoes 9.0 French Fries/Other Fried Potatoes 8.6 Baby Food Mixed/Garden Vegetables 8.4 Cooked Carrots 8.0
12 to 14 months Cooked Green Beans 18.2 French Fries/Other Fried Potatoes 12.9 Cooked Carrots 11.5 Mashed/Whipped Potatoes 10.3 Cooked Peas 8.4
15 to 18 months French Fries/Other Fried Potatoes 19.8 Cooked Green Beans 16.7 Cooked Peas 13.9 Cooked Tomatoes/Tomato Sauce 13.7 Mashed/Whipped Potatoes 12.4
19 to 24 months French Fries/Other Fried Potatoes 25.5 Cooked Green Beans 16.8 Cooked Corn 15.2 Cooked Peas 11.4 Cooked Tomatoes/Tomato Sauce 9.4 a Baby food vegetables include single vegetables (majority of vegetables reported) as well as mixtures with the named
vegetables the predominant vegetable, e.g., broccoli and cauliflower or broccoli and carrots.
Source: Fox et al. (2004).
Exposure Factors Handbook Page September 2011 9-69

Table 9-29. Percentage of Infants and Toddlers Consuming Different Types of Fruits Percentage of Infants and Toddlers Consuming at Least Once in a Day
Food Group/Food 4 to 6 months 7 to 8 months 9 to 11 months 12 to 14 months 15 to 18 months 19 to 24 months Any Fruit 41.9 75.5 75.8 77.2 71.8 67.3 Baby Food Fruit 39.1 67.9 44.8 16.2 4.2 1.8 Non-Baby Food Fruit 5.3 14.3 44.2 67.1 69.4 66.8
Types of Non-Baby Food Fruit Canned Fruit 1.4 5.8 21.6 31.9 25.1 20.2
Packed in Syrup 0.7 0.7 8.1 14.9 12.7 8.1 Packed in Juice or Water 0.7 4.5 13.5 18.5 11.3 11.4 Unknown Pack 0.0 0.7 1.5 1.2 3.1 1.2
Fresh Fruit 4.4 9.5 29.5 52.1 55.0 54.6 Dried Fruit 0.0 0.4 2.1 3.5 7.1 9.4
Types of Fruita
Apples 18.6 33.1 31.6 27.5 19.8 22.4 Bananas 16.0 30.6 34.5 37.8 32.4 30.0 Berries 0.1 0.6 5.3 6.6 11.3 7.7 Citrus Fruits 0.2 0.4 1.6 4.9 7.3 5.1 Melons 0.6 1.0 4.4 7.3 7.2 9.6 a Totals include all baby food and non-baby food fruits.
Source: Fox et al. (2004).
Exposure Factors Handbook
Chapter 9—Intake of Fruits and Vegetables
Page Exposure Factors Handbook 9-70 September 2011

Exposure Factors Handbook
Chapter 9—Intake of Fruits and Vegetables
Table 9-30. Top Five Fruits Consumed by Infants and Toddlers Top Fruits by Age Groupa Percentage Consuming at Least Once in a Day
4 to 6 months Baby Food Applesauce 17.5 Baby Food Bananas 13.0 Baby Food Pears 7.5 Baby Food Peaches 7.4 Fresh Banana 0.3
7 to 8 months Baby Food Applesauce 29.0 Baby Food Bananas 25.2 Baby Food Pears 18.2 Baby Food Peaches 13.1 Fresh Banana 6.6
9 to 11 months Fresh Banana 19.0 Baby Food Applesauce 17.7 Baby Food Bananas 16.8 Baby Food Pears 12.4 Canned Applesauce 11.1
12 to 14 months Fresh Banana 33.0 Canned Applesauce 15.2 Fresh Grapes 9.0 Fresh Apple 8.8 Canned Peaches 7.2 Canned Fruit Cocktail 7.2
15 to 18 months Fresh Banana 30.5 Fresh Grapes 13.2 Fresh Apple 11.2 Fresh Strawberries 10.6 Canned Peaches 8.9
19 to 24 months Fresh Banana 29.6 Fresh Apple 15.0 Fresh Grapes 11.2 Raisins 9.0 Fresh Strawberries 7.6 a Baby food fruits include single fruits (majority of fruits reported) as well as mixtures with the named fruit as the
predominant fruit, e.g., pears and raspberries or prunes with pears. Baby food fruits with tapioca and other baby food dessert fruits were counted as desserts.
Source: Fox et al. (2004).
Exposure Factors Handbook Page September 2011 9-71
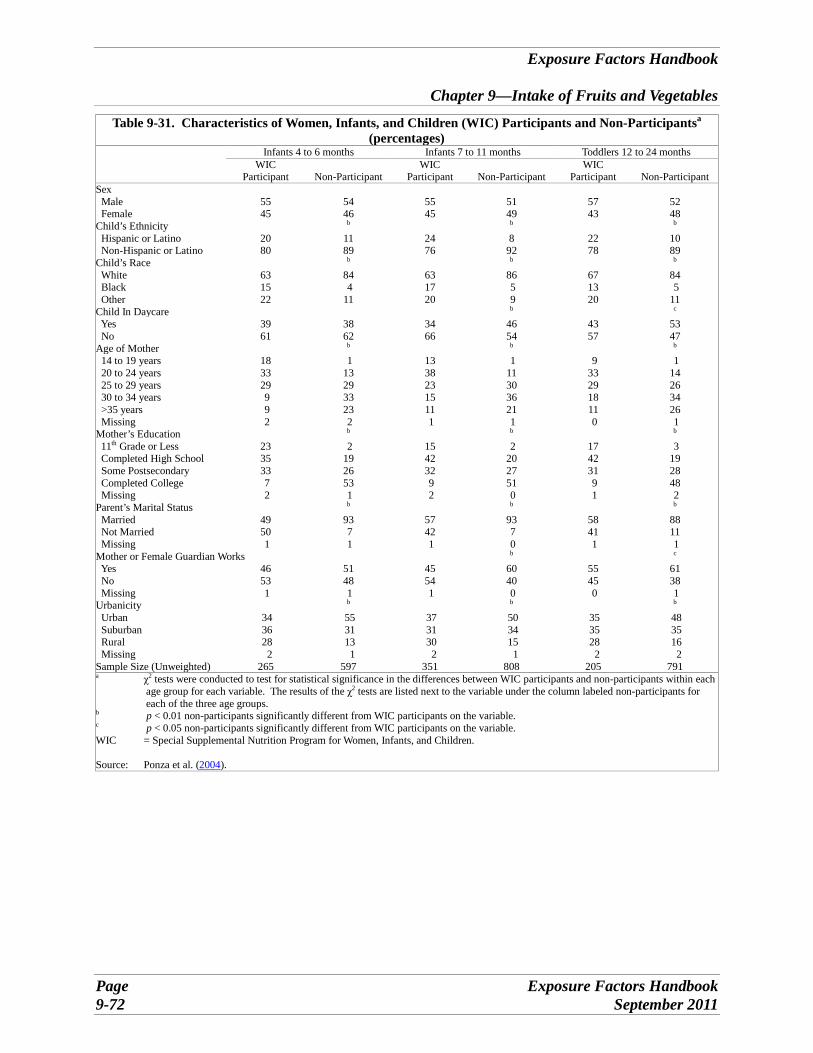
c
Table 9-31. Characteristics of Women, Infants, and Children (WIC) Participants and Non-Participantsa
(percentages) Infants 4 to 6 months Infants 7 to 11 months Toddlers 12 to 24 months
WIC WIC WIC Participant Non-Participant Participant Non-Participant Participant Non-Participant
Sex Male 55 54 55 51 57 52 Female 45 46 45 49 43 48
Child’s Ethnicity b b b
Hispanic or Latino 20 11 24 8 22 10 Non-Hispanic or Latino 80 89 76 92 78 89
Child’s Race b b b
White 63 84 63 86 67 84 Black 15 4 17 5 13 5 Other 22 11 20 9 20 11
Child In Daycare b c
Yes 39 38 34 46 43 53 No 61 62 66 54 57 47
Age of Mother b b b
14 to 19 years 18 1 13 1 9 1 20 to 24 years 33 13 38 11 33 14 25 to 29 years 29 29 23 30 29 26 30 to 34 years 9 33 15 36 18 34 >35 years 9 23 11 21 11 26 Missing 2 2 1 1 0 1
Mother’s Education b b b
11th Grade or Less 23 2 15 2 17 3 Completed High School 35 19 42 20 42 19 Some Postsecondary 33 26 32 27 31 28 Completed College 7 53 9 51 9 48 Missing 2 1 2 0 1 2
Parent’s Marital Status b b b
Married 49 93 57 93 58 88 Not Married 50 7 42 7 41 11 Missing 1 1 1 0 1 1
Mother or Female Guardian Works b c
Yes 46 51 45 60 55 61 No 53 48 54 40 45 38 Missing 1 1 1 0 0 1
Urbanicity b b b
Urban 34 55 37 50 35 48 Suburban 36 31 31 34 35 35 Rural 28 13 30 15 28 16 Missing 2 1 2 1 2 2
Sample Size (Unweighted) 265 597 351 808 205 791 a χ2 tests were conducted to test for statistical significance in the differences between WIC participants and non-participants within each
age group for each variable. The results of the χ2 tests are listed next to the variable under the column labeled non-participants for each of the three age groups.
b p < 0.01 non-participants significantly different from WIC participants on the variable. p < 0.05 non-participants significantly different from WIC participants on the variable.
WIC = Special Supplemental Nutrition Program for Women, Infants, and Children.
Source: Ponza et al. (2004).
Exposure Factors Handbook
Chapter 9—Intake of Fruits and Vegetables
Page Exposure Factors Handbook 9-72 September 2011

Table 9-32. Food Choices for Infants and Toddlers by Women, Infants, and Children (WIC) Participation Status
Infants 4 to 6 months Infants 7 to 11 months Toddlers 12 to 24 months WIC
Participant Non-
Participant WIC
Participant Non-
Participant WIC
Participant Non-
Participant Vegetables
Any Vegetable Baby Food Vegetables Cooked Vegetables Raw Vegetables Dark Green Vegetables Deep Yellow Vegetables Other Starchy Vegetables Potatoes
40.2 32.9 8.0 1.4 0.4
23.2 6.5 6.0
39.8 37.0 3.9a
0.1b
0.0 28.1
6.4 2.4a
68.2 38.2 33.8 3.6 2.9
30.1 12.9 20.7
70.7 45.0 33.8 4.1 4.0
34.8 15.2 18.2
77.5 4.8
73.1 11.8 6.3
12.5 21.1 43.1
80.2 4.7
72.3 15.4
8.4 16.9 21.5 38.3
Fruits Any Fruit Baby Food Fruits Non-Baby Food Fruit Fresh Fruit Canned Fruit
47.8 43.8 8.1 5.4 3.4
39.2a
36.9 4.0 3.8 0.5b
64.7 48.4 22.9 14.3 10.3
81.0b
57.4a
35.9b
24.3b
17.3b
58.5 3.8
56.4 43.6 22.3
74.6b
6.5 70.9b
57.0b
25.3 Sample Size (unweighted) 265 597 351 808 205 791 a = p <0.05 non-participants significantly different from WIC participants. b = p <0.01 non-participants significantly different from WIC participants. WIC = Special Supplemental Nutrition Program for Women, Infants, and Children.
Source: Ponza et al. (2004).
Exposure Factors Handbook
Chapter 9—Intake of Fruits and Vegetables
Exposure Factors Handbook Page September 2011 9-73

Exposure Factors Handbook
Chapter 9—Intake of Fruits and Vegetables
Table 9-33. Average Portion Sizes per Eating Occasion of Fruits and Vegetables Commonly Consumed by Infants From the 2002 Feeding Infants and Toddlers Study
Food Group Reference Unit
4 to 5 months (N = 624)
6 to 8 months (N = 708)
Mean ± SE
9 to 11 months (N = 687)
Fruits and Juices All fruits tablespoon 3.6 ± 0.19 4.7 ± 0.11 5.8 ± 0.17
Baby food fruit tablespoon 3.3 ± 0.16 4.6 ± 0.11 5.6 ± 0.17 Baby food peaches tablespoon 3.6 ± 0.37 4.4 ± 0.26 5.3 ± 0.36 Baby food pears tablespoon 3.5 ± 0.46 4.5 ± 0.21 6.0 ± 0.40 Baby food bananas tablespoon 3.4 ± 0.23 5.0 ± 0.21 5.9 ± 0.35 Baby food applesauce tablespoon 3.7 ± 0.29 4.6 ± 0.17 5.6 ± 0.25 Canned fruit tablespoon - 4.5 ± 0.59 4.8 ± 0.25 Fresh fruit tablespoon - 5.3 ± 0.52 6.4 ± 0.37 100% juice fluid ounce 2.5 ± 0.17 2.8 ± 0.11 3.1 ± 0.09
Apple/apple blends fluid ounce 2.7 ± 0.22 2.9 ± 0.13 3.2 ± 0.11 Grape fluid ounce - 2.6 ± 0.19 3.1 ± 0.21 Pear fluid ounce - 2.6 ± 0.29 3.1 ± 0.28
Vegetables All vegetables tablespoon 3.8 ± 0.20 5.8 ± 0.16 5.6 ± 0.20
Baby food vegetables tablespoon 4.0 ± 0.20 5.9 ± 0.16 6.6 ± 0.21 Baby food green beans tablespoon 3.5 ± 0.33 5.1 ± 0.28 6.1 ± 0.50 Baby food squash tablespoon 4.3 ± 0.47 5.6 ± 0.30 6.9 ± 0.41 Baby food sweet tablespoon 4.3 ± 0.31 6.1 ± 0.34 7.2 ± 0.69 Baby food carrots tablespoon 3.5 ± 0.33 5.6 ± 0.27 6.7 ± 0.48 Cooked vegetables, excluding French fries tablespoon - 4.2 ± 0.47 3.8 ± 0.31 Deep yellow vegetables tablespoon - 3.2 ± 0.59 3.2 ± 0.39 Mashed potatoes tablespoon - 4.1 ± 0.67 2.8 ± 0.37 Green beans tablespoon - 3.2 ± 0.62 5.0 ± 0.61
- = Cell size was too small to generate a reliable estimate. N = Number of respondents. SE = Standard error.
Source: Fox et al. (2006).
Page Exposure Factors Handbook 9-74 September 2011

Table 9-34. Average Portion Sizes per Eating Occasion of Fruits and Vegetables Commonly Consumed by Toddlers From the 2002 Feeding Infants and Toddlers Study
Food Group Reference Unit
12 to 14 months (N = 371)
15 to 18 months (N = 312)
19 to 24 months (N = 320)
Mean ± SE Fruits and Juices
All fruits cup 0.4 ± 0.02 0.5 ± 0.03 0.6 ± 0.03 Canned fruit cup 0.3 ± 0.02 0.4 ± 0.03 0.4 ± 0.04 Fresh fruit cup 0.4 ± 0.02 0.5 ± 0.03 0.6 ± 0.03 Fresh apple cup, slice 0.4 ± 0.05 0.6 ± 0.07 0.8 ± 0.14
1 medium 0.3 ± 0.04 0.5 ± 0.06 0.6 ± 0.11 Fresh banana cup, slice 0.4 ± 0.02 0.5 ± 0.03 0.5 ± 0.03
1 medium 0.6 ± 0.03 0.7 ± 0.03 0.7 ± 0.04 Fresh grapes cup 0.2 ± 0.01 0.3 ± 0.03 0.3 ± 0.02 100% juice fluid ounce 3.7 ± 0.15 5.0 ± 0.20 5.1 ± 0.18
Orange/orange blends fluid ounce 3.3 ± 0.38 4.5 ± 0.33 5.2 ± 0.35 Apple/apple blends fluid ounce 3.6 ± 0.21 4.5 ± 0.29 4.9 ± 0.27 Grape fluid ounce 3.6 ± 0.38 5.6 ± 0.43 4.7 ± 0.31
Vegetables All vegetables cup 0.4 ± 0.02 0.4 ± 0.03 0.4 ± 0.02
Cooked vegetables, excluding French fries cup 0.3 ± 0.03 0.3 ± 0.03 0.3 ± 0.02
Deep yellow vegetables cup 0.2 ± 0.03 0.3 ± 0.05 0.3 ± 0.05 Corn cup 0.2 ± 0.03 0.2 ± 0.03 0.2 ± 0.03 Peas cup 0.2 ± 0.02 0.2 ± 0.02 0.2 ± 0.02 Green beans cup 0.4 ± 0.05 0.4 ± 0.05 0.3 ± 0.03 Mashed potatoes cup 0.3 ± 0.05 0.4 ± 0.05 0.3 ± 0.05 Baked/boiled potatoes cup 0.3 ± 0.05 0.4 ± 0.06 -French fries cup 0.4 ± 0.05 0.6 ± 0.05 0.6 ± 0.05
- Cell size too small to generate reliable estimate. N = Number of respondents. SE = Standard error of the mean.
Source: Fox et al. (2006).
Exposure Factors Handbook
Chapter 9—Intake of Fruits and Vegetables
Exposure Factors Handbook Page September 2011 9-75

Table 9-35. Percentage of Hispanic and Non-Hispanic Infants and Toddlers Consuming Different Types of Fruits and Vegetables on a Given Day
Age 4 to 5 months Age 6 to 11 months Age 12 to 24 months Hispanic (N = 84)
Non-Hispanic (N = 538)
Hispanic (N = 163)
Non-Hispanic (N = 1,228)
Hispanic (N = 124)
Non-Hispanic (N = 871)
Fruits Any Fruit or 100% Fruit Juice Any Fruita
100% Fruit Juice Fruit Preparation
Baby Food Fruit Non-Baby Food Fruit
Canned Fruit Fresh Fruit
45.0 39.4 19.3
32.6 9.1c
2.3c
9.1b,c
35.9 28.8 15.3
28.4 1.3c
--
86.2 68.1 57.8
42.9b
35.8 8.8
30.0d
86.8 76.0 47.7
58.1 27.4 13.7 17.7
84.6 67.6 64.1
5.6c
64.2 12.1d
59.3
87.2 71.5 58.9
6.3 68.0 26.2 53.1
Vegetables Any Vegetable or 100% Vegetable Juicee
Type of Preparation Baby Food Vegetables Cooked Vegetables Raw Vegetables
Types of Vegetablese
Dark Green Vegetablesf
Deep Yellow Vegetablesg
Starchy Vegetable: White Potatoes French Fries/Fried Potatoes Baked/Mashed Other Starchy Vegetablesh
Other Non-Starchy Vegetablesi
30.0
25.7 4.2c
2.3c
-21.0
1.4c
--
5.0c
8.1c
27.3
25.4 2.4c
-
-18.2
2.3c
--4.0 8.0
66.2
34.4b
33.2 8.3c
3.3c
32.2
20.7 5.7c
14.4c
6.7d
28.5
70.3
47.6 29.4 2.6
3.1 25.9
17.4 5.3
10.7 15.1 29.0
76.0
4.1c
71.4 25.0
11.4c
20.0
43.5 23.4 19.8 16.6 42.0
80.5
4.9 72.9 13.1
7.5 15.4
39.0 20.3 17.7 22.2 43.4
a Total includes all baby food and non-baby food fruits and excludes 100% fruit juices and juice drinks. b = Significantly different from non-Hispanic at the p < 0.05. c = Statistic is potentially unreliable because of a high coefficient of variation. d = Significantly different from non-Hispanic at the p < 0.01. e Total includes commercial baby food, cooked vegetables, raw vegetables, and 100% vegetable juices. f Reported dark green vegetables include broccoli, spinach, romaine lettuce, and other greens such as kale. g Reported yellow vegetables include carrots, pumpkin, sweet potatoes, and winter squash. h Reported starchy vegetables include corn, green peas, immature lima beans, black-eyed peas (not dried), cassava, and rutabaga.
Corn is also shown as a subcategory of other starchy vegetables. i Reported non-starchy vegetables include asparagus, cauliflower, cabbage, onions, green beans, mixed vegetables, peppers, and
tomatoes.
- = Less than 1% of the group consumed this food on a given day. N = Sample size.
Source: Mennella et al. (2006).
Exposure Factors Handbook
Chapter 9—Intake of Fruits and Vegetables
Page Exposure Factors Handbook 9-76 September 2011

Table 9-36. Top Five Fruits and Vegetables Consumed by Hispanic and Non-Hispanic Infants and Toddlers per Age Groupa
Ethnicity Age (month) N Hispanic Non-Hispanic
Top Fruits By Age Group 4 to 5 84 Hispanic Bananas (16.3%) Apples (12.5%)
538 non-Hispanic Apples (14.7%) Bananas (10.0%) Peaches (10.9%) Pears (5.9%) Melons (3.5%) Peaches (5.8%) Pears (2.5%) Prunes (1.6%)
6 to 11 136 Hispanic Bananas (35.9%) Apples (32.9%) 1,228 non-Hispanic Apples (29.7%) Bananas (31.5%)
Pears (15.2%) Peaches (11.7%)
Pears (17.5%) Peaches (13.9%)
Melons (4.7%) Apricots (3.7%) 12 to 24 124 Hispanic
871 non-Hispanic Bananas (41.5%) Apples (25.7%)
Bananas (30.9%) Apples (22.0%)
Berries (8.5%) Grapes (12.3%) Melons (7.6%) Pears (7.3%)
Peaches (9.6%) Berries (8.7%)
Top Vegetables By Age Group 4 to 5 84 Hispanic
538 non-Hispanic Carrots (9.9%) Sweet Potatoes (6.8%)
Sweet Potatoes (7.5%) Carrots (6.6%)
Green Beans (5.8%) Green Beans (5.9%) Peas (5.0%) Squash (4.3%)
Squash (5.4%) Peas (3.8%)
6 to 11 136 Hispanic 1,228 non-Hispanic
Potatoes (20.7%) Carrots (19.0%) Mixed Vegetables (11.1%) Green Beans (11.0%) Sweet Potatoes (8.7%)
Carrots (17.5%) Potatoes (16.4%) Green Beans (15.9%) Squash (11.8%) Sweet Potatoes (11.4%)
12 to 24 124 Hispanic 871 non-Hispanic
Potatoes (43.5%) Tomatoes (23.1%) Carrots (18.6%) Onions (11.8%) Corn (10.2%)
Potatoes (39.0%) Green Beans (19.6%) Peas (12.8%) Carrots (12.3%) Tomatoes (11.9%)
a Percentage consuming at least one in a day is in parentheses. N = Sample size.
Source: Mennella et al. (2006).
Exposure Factors Handbook
Chapter 9—Intake of Fruits and Vegetables
Exposure Factors Handbook Page September 2011 9-77
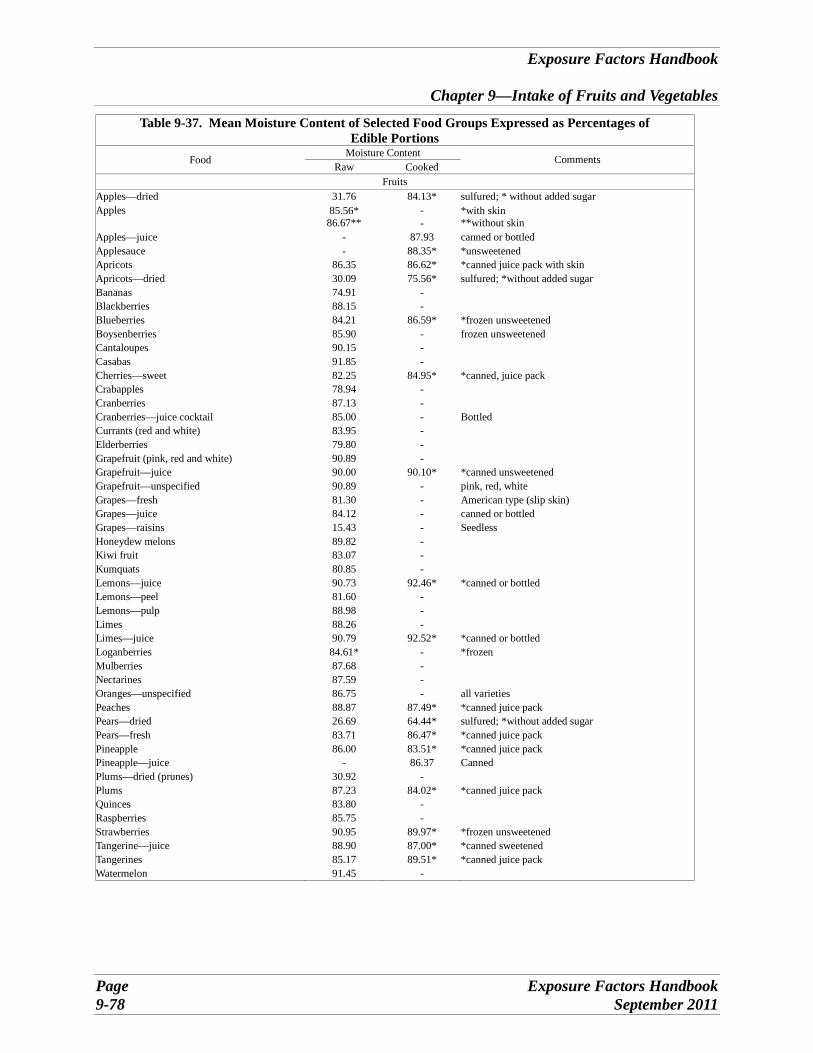
Exposure Factors Handbook
Chapter 9—Intake of Fruits and Vegetables
Table 9-37. Mean Moisture Content of Selected Food Groups Expressed as Percentages of Edible Portions
Food Moisture Content Comments Raw Cooked
Fruits Apples—dried 31.76 84.13* sulfured; * without added sugar Apples 85.56*
86.67** --
*with skin **without skin
Apples—juice - 87.93 canned or bottled Applesauce - 88.35* *unsweetened Apricots 86.35 86.62* *canned juice pack with skin Apricots—dried 30.09 75.56* sulfured; *without added sugar Bananas 74.91 -Blackberries 88.15 -Blueberries 84.21 86.59* *frozen unsweetened Boysenberries 85.90 - frozen unsweetened Cantaloupes 90.15 -Casabas 91.85 -Cherries—sweet 82.25 84.95* *canned, juice pack Crabapples 78.94 -Cranberries 87.13 -Cranberries—juice cocktail 85.00 - Bottled Currants (red and white) 83.95 -Elderberries 79.80 -Grapefruit (pink, red and white) 90.89 -Grapefruit—juice 90.00 90.10* *canned unsweetened Grapefruit—unspecified 90.89 - pink, red, white Grapes—fresh 81.30 - American type (slip skin) Grapes—juice 84.12 - canned or bottled Grapes—raisins 15.43 - Seedless Honeydew melons 89.82 -Kiwi fruit 83.07 -Kumquats 80.85 -Lemons—juice 90.73 92.46* *canned or bottled Lemons—peel 81.60 -Lemons—pulp 88.98 -Limes 88.26 -Limes—juice 90.79 92.52* *canned or bottled Loganberries 84.61* - *frozen Mulberries 87.68 -Nectarines 87.59 -Oranges—unspecified 86.75 - all varieties Peaches 88.87 87.49* *canned juice pack Pears—dried 26.69 64.44* sulfured; *without added sugar Pears—fresh 83.71 86.47* *canned juice pack Pineapple 86.00 83.51* *canned juice pack Pineapple—juice - 86.37 Canned Plums—dried (prunes) 30.92 -Plums 87.23 84.02* *canned juice pack Quinces 83.80 -Raspberries 85.75 -Strawberries 90.95 89.97* *frozen unsweetened Tangerine—juice 88.90 87.00* *canned sweetened Tangerines 85.17 89.51* *canned juice pack Watermelon 91.45 -
Page Exposure Factors Handbook 9-78 September 2011

Exposure Factors Handbook
Chapter 9—Intake of Fruits and Vegetables
Table 9-37. Mean Moisture Content of Selected Food Groups Expressed as Percentages of Edible Portions (continued)
Food Moisture Content Comments Raw Cooked
Vegetables Alfalfa seeds—sprouted 92.82 Artichokes—globe and French 84.94 84.08 boiled, drained Artichokes—Jerusalem 78.01 -Asparagus 93.22 92.63 boiled, drained Bamboo shoots 91.00 95.92 boiled, drained Beans—dry—blackeyed peas (cowpeas) 77.20 75.48 boiled, drained Beans—dry—hyacinth (mature seeds) 87.87 86.90 boiled, drained Beans—dry—navy (mature seeds) 79.15 76.02 boiled, drained Beans—dry—pinto (mature seeds) 81.30 93.39 boiled, drained Beans—lima 70.24 67.17 boiled, drained Beans—snap—green—yellow 90.27 89.22 boiled, drained Beets 87.58 87.06 boiled, drained Beets—tops (greens) 91.02 89.13 boiled, drained Broccoli 90.69 89.25 boiled, drained Brussel sprouts 86.00 88.90 boiled, drained Cabbage—Chinese (pak-choi) 95.32 95.55 boiled, drained Cabbage—red 90.39 90.84 boiled, drained Cabbage—savoy 91.00 92.00 boiled, drained Carrots 88.29 90.17 boiled, drained Cassava (yucca blanca) 59.68 -Cauliflower 91.91 93.00 boiled, drained Celeriac 88.00 92.30 boiled, drained Celery 95.43 94.11 boiled, drained Chives 90.65 -Cole slaw 81.50 -Collards 90.55 91.86 boiled, drained Corn—sweet 75.96 69.57 boiled, drained Cress—garden 89.40 92.50 boiled, drained Cucumbers—peeled 96.73 -Dandelion—greens 85.60 89.80 boiled, drained Eggplant 92.41 89.67 boiled, drained Endive 93.79 -Garlic 58.58 -Kale 84.46 91.20 boiled, drained Kohlrabi 91.00 90.30 boiled, drained Lambsquarter 84.30 88.90 boiled, drained Leeks—bulb and lower leaf-portion 83.00 90.80 boiled, drained Lentils—sprouted 67.34 68.70 stir-fried Lettuce—iceberg 95.64 -Lettuce—cos or romaine 94.61 -Mung beans—mature seeds (sprouted) 90.40 93.39 boiled, drained Mushrooms—unspecified - 91.08 boiled, drained Mushrooms—oyster 88.80 -Mushrooms—Maitake 90.53 -Mushrooms—portabella 91.20 -Mustard greens 90.80 94.46 boiled, drained Okra 90.17 92.57 boiled, drained Onions 89.11 87.86 boiled, drained Onions—dehydrated or dried 3.93 -Parsley 87.71 -Parsnips 79.53 80.24 boiled, drained Peas—edible-podded 88.89 88.91 boiled, drained Peppers—sweet—green 93.89 91.87 boiled, drained Peppers—hot chili-green 87.74 92.50* *canned solids and liquid
Exposure Factors Handbook Page September 2011 9-79

Exposure Factors Handbook
Chapter 9—Intake of Fruits and Vegetables
Table 9-37. Mean Moisture Content of Selected Food Groups Expressed as Percentages of Edible Portions (continued)
Food Moisture Content Comments Raw Cooked
Potatoes (white) 81.58 75.43 Baked Pumpkin 91.60 93.69 boiled, drained Radishes 95.27 -Rutabagas—unspecified 89.66 88.88 boiled, drained Salsify (vegetable oyster) 77.00 81.00 boiled, drained Shallots 79.80 -Soybeans—mature seeds—sprouted 69.05 79.45 Steamed Spinach 91.40 91.21 boiled, drained Squash—summer 94.64 93.70 all varieties; boiled, drained Squash—winter 89.76 89.02 all varieties; baked Sweet potatoes 77.28 75.78 baked in skin Swiss chard 92.66 92.65 boiled, drained Taro—leaves 85.66 92.15 Steamed Taro 70.64 63.80 Tomatoes—juice - 93.90 Canned Tomatoes—paste - 73.50 Canned Tomatoes—puree - 87.88 Canned Tomatoes 93.95 -Towel gourd 93.85 84.29 boiled, drained Turnips 91.87 93.60 boiled, drained Turnips—greens 89.67 93.20 boiled, drained Water chestnuts—Chinese 73.46 86.42* *canned solids and liquids Yambean—tuber 90.07 90.07 boiled, drained - Indicates data are not available for the fruit or vegetable under those conditions. * Number without added sugar.
Source: USDA (2007).
Page Exposure Factors Handbook 9-80 September 2011


![[ ]to serve and prepare them with the healthiest methods ... · grains, raw fruits & vegetables, should make up 50%-60% of your daily caloric intake. Natural sugar sources from fruits](https://static.fdocuments.net/doc/165x107/5f05d4f17e708231d414ee08/-to-serve-and-prepare-them-with-the-healthiest-methods-grains-raw-fruits.jpg)


