Exposure Factors Handbook - Chapter 12: Intake of … Factors Handbook Chapter 12—Intake of Grain...
48
Exposure Factors Handbook Chapter 12—Intake of Grain Products Exposure Factors Handbook Page September 2011 12-i TABLE OF CONTENTS LIST OF TABLES ................................................................................................................................................... 12-ii 12. INTAKE OF GRAIN PRODUCTS ............................................................................................................12-1 12.1. INTRODUCTION .......................................................................................................................12-1 12.2. RECOMMENDATIONS .............................................................................................................12-1 12.3. INTAKE STUDIES......................................................................................................................12-4 12.3.1. Key Grain Intake Study .................................................................................................12-4 12.3.1.1. U.S. EPA Analysis of Consumption Data From 2003−2006 National Health and Nutrition Examination Survey (NHANES) ...................................12-4 12.3.2. Relevant Grain Intake Studies .......................................................................................12-5 12.3.2.1. USDA (1996a, b, 1993, 1980)—Food and Nutrient Intakes of Individuals in 1 Day in the United States ........................................................12-5 12.3.2.2. USDA (1999b)—Food Consumption, Prices, and Expenditures, 1970−1997.......................................................................................................12-6 12.3.2.3. USDA (1999a)—Food and Nutrient Intakes by Children 1994−1996, 1998, Table Set 17 ...........................................................................................12-6 12.3.2.4. U.S. EPA Analysis of Continuing Survey of Food Intake by Individuals (CSFII) 1994−1996, 1998 ...............................................................................12-7 12.3.2.5. Smiciklas-Wright et al. (2002)—Foods Commonly Eaten in the United States: Quantities Consumed per Eating Occasion and in a Day, 1994−1996.......................................................................................................12-8 12.3.2.6. Vitolins et al. (2002)—Quality of Diets Consumed by Older Rural Adults ..............................................................................................................12-8 12.3.2.7. Fox et al. (2004)—Feeding Infants and Toddlers Study: What Foods Are Infants and Toddlers Eating ......................................................................12-9 12.3.2.8. Ponza et al. (2004)—Nutrient Food Intakes and Food Choices of Infants and Toddlers Participating in WIC ......................................................12-9 12.3.2.9. Fox et al. (2006)—Average Portion of Foods Commonly Eaten by Infants and Toddlers in the United States ......................................................12-10 12.3.2.10.Mennella et al. (2006)—Feeding Infants and Toddlers Study: The Types of Foods Fed to Hispanic Infants and Toddlers ...................................12-10 12.4. CONVERSION BETWEEN WET- AND DRY-WEIGHT INTAKE RATES ............................12-10 12.5. REFERENCES FOR CHAPTER 12 .......................................................................................... 12-11
Transcript of Exposure Factors Handbook - Chapter 12: Intake of … Factors Handbook Chapter 12—Intake of Grain...

Exposure Factors Handbook
Chapter 12mdashIntake of Grain Products
Exposure Factors Handbook Page September 2011 12-i
TABLE OF CONTENTS
LIST OF TABLES 12-ii 12 INTAKE OF GRAIN PRODUCTS 12-1
121 INTRODUCTION 12-1 122 RECOMMENDATIONS 12-1 123 INTAKE STUDIES 12-4
1231 Key Grain Intake Study 12-4 12311 US EPA Analysis of Consumption Data From 2003minus2006 National
Health and Nutrition Examination Survey (NHANES) 12-4 1232 Relevant Grain Intake Studies 12-5
12321 USDA (1996a b 1993 1980)mdashFood and Nutrient Intakes of Individuals in 1 Day in the United States 12-5
12322 USDA (1999b)mdashFood Consumption Prices and Expenditures 1970minus1997 12-6
12323 USDA (1999a)mdashFood and Nutrient Intakes by Children 1994minus1996 1998 Table Set 17 12-6
12324 US EPA Analysis of Continuing Survey of Food Intake by I ndividuals (CSFII) 1994minus1996 1998 12-7
12325 Smiciklas-Wright et al (2002)mdashFoods Commonly Eaten in the United States Quantities Consumed per Eating Occasion and in a Day 1994minus1996 12-8
12326 Vitolins et al (2002)mdashQuality of Diets Consumed by Older Rural Adults 12-8
12327 Fox et al (2004)mdashFeeding Infants and Toddlers Study What Foods Are Infants and Toddlers Eating 12-9
12328 Ponza et al (2004)mdashNutrient Food Intakes and Food Choices of Infants and Toddlers Participating in WIC 12-9
12329 Fox et al (2006)mdashAverage Portion of Foods Commonly Eaten by Infants and Toddlers in the United States 12-10
123210Mennella et al (2006)mdashFeeding Infants and Toddlers Study The Types of Foods Fed to Hispanic Infants and Toddlers 12-10
124 CONVERSION BETWEEN WET- AND DRY-WEIGHT INTAKE RATES 12-10 125 REFERENCES FOR CHAPTER 12 12-11
Exposure Factors Handbook
Chapter 12mdashIntake of Grain Products
Page Exposure Factors Handbook 12-ii September 2011
LIST OF TABLES
Table 12-1 Recommended Values for Intake of Grains Edible Portion Uncooked 12-2 Table 12-2 Confidence in Recommendations for Intake of Grain Products 12-3 Table 12-3 Per Capita Intake of Total Grains Based 2003ndash2006 NHANES (gkg-day edible portion
uncooked weight) 12-13 Table 12-4 Consumer-Only Intake of Total Grains Based 2003ndash2006 NHANES (gkg-day edible
portion uncooked weight) 12-14 Table 12-5 Per Capita Intake of Individual Grain Products Based 2003ndash2006 NHANES (gkg-day
edible portion uncooked weight) 12-15 Table 12-6 Consumer-Only Intake of Individual Grain Products Based 2003ndash2006 NHANES (gkgshy
day edible portion uncooked weight) 12-16 Table 12-7 Mean Grain Intake per Individual in a Day by Sex and Age (gday as-consumed) for
1977minus1978 12-17 Table 12-8 Mean Grain Intakes per Individual in a Day by Sex and Age (gday as-consumed) for
1987minus1988 12-18 Table 12-9 Mean Grain Intakes per Individual in a Day by Sex and Age (gday as-consumed) for
1994minus1995 12-18 Table 12-10 Per Capita Consumption of Flour and Cereal Products in 1997 12-19 Table 12-11 Mean Quantities of Grain Products Consumed by Children U nder 20 Years of Age by
Sex and Age per Capita (gday as-consumed) 12-20 Table 12-12 Percentage of Individuals Under 20 Years of Age Consuming Grain Products by Sex and
Age () 12-21 Table 12-13 Per Capita Intake of Total Grains Based on 1994ndash1996 1998 CSFII (gkg-day edible
portion uncooked weight) 12-22 Table 12-14 Consumer-Only Intake of Total Grains Based on 1994ndash1996 1998 CSFII (gkg-day
edible portion uncooked weight) 12-23 Table 12-15 Per Capita Intake of Individual Grain Products Based on 1994ndash1996 1998 CSFII (gkgshy
day edible portion uncooked weight) 12-24 Table 12-16 Consumer-Only Intake of Individual Grain Products Based on 1994ndash1996 1998 CSFII
(gkg-day edible portion uncooked weight) 12-25 Table 12-17 Per Capita Intake of Breads Based on 1994ndash1996 1998 CSFII (gkg-day as-consumed) 12-26 Table 12-18 Per Capita Intake of Sweets Based on 1994ndash1996 1998 CSFII (gkg-day as-consumed) 12-27 Table 12-19 Per Capita Intake of Snacks Containing Grains Based on 1994ndash1996 1998 CSFII (gkgshy
day as-consumed) 12-28 Table 12-20 Per Capita Intake of Breakfast Foods Based on 1994ndash1996 1998 CSFII (gkg-day as-
consumed) 12-29 Table 12-21 Per Capita Intake of Pasta Based on 1994ndash1996 1998 CSFII (gkg-day as-consumed) 12-30 Table 12-22 Per Capita Intake of Cooked Cereals Based on 1994ndash1996 1998 CSFII (gkg-day as-
consumed) 12-31 Table 12-23 Per Capita Intake of Ready-to-Eat Cereals Based on 1994ndash1996 1998 CSFII (gkg-day
as-consumed) 12-32 Table 12-24 Per Capita Intake of Baby Cereals Based on 1994ndash1996 1998 CSFII (gkg-day as-
consumed) 12-33 Table 12-25 Quantity (as-consumed) of Grain Products Consumed per Eating Occasion and the
Percentage of Individuals Using These Foods in 2 Days 12-34 Table 12-26 Quantity (as-consumed) of Grain Products Consumed per Eating Occasion and
Percentage of Individuals Using These Foods in 2 Days by Sex and Age 12-35 Table 12-27 Consumption of Major Food Groups by Older Adults Median Daily Servings (and
ranges) by Demographic and Health Characteristics 12-37 Table 12-28 Characteristics of the Feeding I nfant and Toddlers Study (FITS) Sample Population 12-38 Table 12-29 Percentage of Infants and Toddlers Consuming Different Types of Grain Products 12-39 Table 12-30 Characteristics of Women Infants and Children (WIC) Participants and Non-Participants
(percentages) 12-40
Exposure Factors Handbook
Chapter 12mdashIntake of Grain Products
Exposure Factors Handbook Page September 2011 12-iii
LIST OF TABLES (continued) Table 12-31 Food Choices for Infants and Toddlers by Women Infants and Children (WIC)
Participation Status 12-41 Table 12-32 Average Portion Sizes per Eating Occasion of Grain Products Commonly Consumed by
Infants From the 2002 Feeding Infants and Toddlers Study 12-42 Table 12-33 Average Portion Sizes per Eating Occasion of Grain Products Commonly Consumed by
Toddlers From the 2002 Feeding Infants and Toddlers Study 12-42 Table 12-34 Percentage of Hispanic and Non-Hispanic Infants and Toddlers Consuming Different
Types of Grain Products on a Given Day 12-43 Table 12-35 Mean Moisture Content of Selected Grain Products Expressed as Percentages of Edible
Portions (grams per 100 grams of edible portion) 12-44
Exposure Factors Handbook
Chapter 12mdashIntake of Grain Products
This page intentionally left blank
Page Exposure Factors Handbook 12-iv September 2011
Exposure Factors Handbook
Chapter 12mdashIntake of Grain Products 12 INTAKE OF GRAIN PRODUCTS 121 INTRODUCTION
The American food supply is generally considered to be one of the safest in the world Nevertheless grain products may become contaminated with toxic chemicals by several different pathways Ambient air pollutants may be deposited on or absorbed by the plants or dissolved in rainfall or irrigation waters that contact the plants Pollutants may also be absorbed through plant roots from contaminated soil and ground water The addition of pesticides soil additives and fertilizers may also result in contamination of grain products To assess exposure through this pathway information on ingestion rates of grain products is needed
A variety of terms may be used to define intake of grain products (eg consumer-only intake per capita intake total grain intake as-consumed intake uncooked edible intake dry-weight intake) As described in Chapter 9 (Intake of Fruits and Vegetables) consumer-only intake is defined as the quantity of grain products consumed by individuals during the survey period These data are generated by averaging intake across only the individuals in the survey who consumed these food items Per capita intake rates are generated by averaging consumer-only intakes over the entire population (including those that reported no intake) In general per capita intake rates are appropriate for use in exposure assessments for which average dose estimates for individuals are of interest because they represent both individuals who ate the foods during the survey period and those who may eat the food items at some time but did not consume them during the survey period Per capita intake therefore represents an average across the entire population of interest but does so at the expense of underestimating consumption for the subset of the population that consumed the food in question Total grain intake refers to the sum of all grain products consumed in a day
Intake rates may be expressed on the basis of the as-consumed weight (eg cooked or prepared) or on the uncooked or unprepared weight As-consumed intake rates are based on the weight of the food in the form that it is consumed and should be used in assessments where the basis for the contaminant concentrations in foods is also indexed to the as-consumed weight Some of the food ingestion values provided in this chapter are expressed as as-consumed intake rates because this is the fashion in which data were reported by survey respondents Others are provided as uncooked weights based on analyses of survey data that account for weight
changes that occur during cooking This is of importance because concentration data to be used in the dose equation are often measured in uncooked food samples It should be recognized that cooking can either increase or decrease food weight Similarly cooking can increase the mass of contaminant in food (due to formation reactions or absorption from cooking oils or water) or decrease the mass of contaminant in food (due to vaporization fat loss or leaching) The combined effects of changes in weight and changes in contaminant mass can result in either an increase or decrease in contaminant concentration in cooked food Therefore if the as-consumed ingestion rate and the uncooked concentration are used in the dose equation dose may be under-estimated or over-estimated It is important for the assessor to be aware of these issues and choose intake rate data that best match the concentration data that are being used For more information on cooking losses and conversions necessary to account for such losses refer to Chapter 13 of this handbook
Sometimes contaminant concentrations in food are reported on a dry-weight basis When these data are used in an exposure assessment it is recommended that dry-weight intake rates also be used Dry-weight food concentrations and intake rates are based on the weight of the food consumed after the moisture content has been removed For information on converting the intake rates presented in this chapter to dry-weight intake rates refer to Section 124
The purpose of this chapter is to provide intake data for grain products for the general population The recommendations for ingestion rates of grain products are provided in the next section along with a summary of the confidence ratings for these recommendations The recommended values are based on the key study identified by US Environmental Protection Agency (EPA) for this factor Following the recommendations the key study on ingestion of grain products is summarized Relevant data on ingestion of grain products are also provided These data are presented to provide the reader with added perspective on the current state-ofshyknowledge pertaining to ingestion of grain products among children
122 RECOMMENDATIONS Table 12-1 presents a summary of the
recommended values for per capita and consumer-only intake of grain products Table 12-2 provides confidence ratings for the grain intake recommendations for the general population
Exposure Factors Handbook Page September 2011 12-1
Exposure Factors Handbook
Chapter 12mdashIntake of Grain Products The US EPA analysis of data from the
2003minus2006 National Health and Nutrition Examination Survey (NHANES) was used in selecting recommended intake rates The US EPA analysis was conducted using childhood age groups that differed slightly from US EPArsquos Guidance on Selecting Age Groups for Monitoring and Assessing Childhood Exposures to Environmental Contaminants (US EPA 2005) However for the purposes of the recommendations presented here data were placed in the standardized age categories closest to those used in the analysis
The NHANES data on which the recommendations are based are short-term survey data and may not necessarily reflect the long-term
distribution of average daily intake rates However because broad categories of food (ie total grains) are eaten on a daily basis throughout the year with minimal seasonality the short-term distribution may be a reasonable approximation of the long-term distribution although it will display somewhat increased variability This implies that the upper percentiles shown here will tend to overestimate the corresponding percentiles of the true long-term distribution In general the recommended values based on US EPArsquos analysis of NHANES data represent the uncooked weight of the edible portion of grain products
Table 12-1 Recommended Values for Intake of Grains Edible Portion Uncookeda
Age Group (years) Per Capita Consumers Only
Multiple Percentiles Source Mean 95th Percentile Mean 95th Percentile
gkg-day gkg-day gkg-day gkg-day Total Grains
Birth to 1 31 95b 41 103b
See Table 12-3 and Table 12-4
US EPA Analysis of
NHANES 2003ndash 2006
1 to lt2 64 124b 64 124b
2 to lt3 64 124b 64 124b
3 to lt6 62 111 62 111 6 to lt11 44 82 44 82 11 to lt16 24 50 24 50 16 to lt21 24 50 24 50 20 to lt50 22 46 22 46 gt50 17 35 17 35
Individual Grain ProductsmdashSee Table 12-5 and Table 12-6 a Analysis was conducted using slightly different childhood age groups than those recommended in Guidance on
Selecting Age Groups for Monitoring and Assessing Childhood Exposures to Environmental Contaminants (US EPA 2005) Data were placed in the standardized age categories closest to those used in the analysis
b Estimates are less statistically reliable based on guidance published in the Joint Policy on Variance Estimation and Statistical Reporting Standards on NHANES III and CSFII Reports NHISNCHS Analytical Working Group Recommendations (NCHS 1993)
Page Exposure Factors Handbook 12-2 September 2011
Exposure Factors Handbook
Chapter 12mdashIntake of Grain Products
Table 12-2 Confidence in Recommendations for Intake of Grain Products General Assessment Factors Rationale Rating Soundness
Adequacy of Approach
Minimal (or defined) Bias
The survey methodology and data analysis were adequate The survey sampled more than 16000 individuals An analysis of primary data was conducted
No physical measurements were taken The method relied on recent recall of grain products eaten
High
Applicability and Utility Exposure Factor of Interest
Representativeness
Currency
Data Collection Period
The key study was directly relevant to grain intake
The data were demographically representative of the US population (based on stratified random sample)
Data were collected between 2003 and 2006
Data were collected for two non-consecutive days
High
Clarity and Completeness Accessibility
Reproducibility
Quality Assurance
The NHANES data are publicly available
The methodology used was clearly described enough information was included to reproduce the results
NHANES follows strict QAQC procedures The US EPA analysis has only been reviewed internally but the methodology has been used in an analysis of previous data
High
Variability and Uncertainty Variability in Population
Minimal Uncertainty
Full distributions were provided for total grains Means were provided for individual grain products
Data collection was based on recall for a two-day period the accuracy of using these data to estimate long-term intake (especially at the upper percentiles) is uncertain However use of short-term data to estimate chronic ingestion can be assumed for broad categories of foods such as total grains Uncertainty is greater for individual grain products
Medium to high for averages low for long-term upper percentiles low for
individual foods
Evaluation and Review Peer Review
Number and Agreement of Studies
The NCHS NHANES survey received a high level of peer review The US EPA analysis of these data has not been peer reviewed outside the Agency but the methodology has been used in an analysis of previous data
There was one key study
Medium
Overall Rating Medium to High confidence in the averages Low confidence in the long-
term upper percentiles
Exposure Factors Handbook Page September 2011 12-3
Exposure Factors Handbook
Chapter 12mdashIntake of Grain Products 123 INTAKE STUDIES 1231 Key Grain Intake Study 12311 US EPA Analysis of Consumption Data
From 2003minus2006 National Health and Nutrition Examination Survey (NHANES)
The key source of recent information on consumption rates of grain products is the US Centers for Disease Control and Preventionrsquos National Center for Health Statisticsrsquo (NCHS) NHANES Data from NHANES 2003minus2006 have been used by the US EPA Office of Pesticide Programs (OPP) to generate per capita and consumer-only intake rates for both individual grain products and total grain products
NHANES is designed to assess the health and nutritional status of adults and children in the United States In 1999 the survey became a continuous program that interviews a nationally representative sample of approximately 7000 persons each year and examines a nationally representative sample of about 5000 persons each year located in counties across the country 15 of which are visited each year Data are released on a 2-year basis thus for example the 2003 data are combined with the 2004 data to produce NHANES 2003minus2004
The dietary interview component of NHANES is called What We Eat in America and is conducted by the US Department of Agriculture (USDA) and the US Department of Health and Human Services (DHHS) DHHSrsquo NCHS is responsible for the sample design and data collection and USDArsquos Food Surveys Research Group is responsible for the dietary data collection methodology maintenance of the databases used to code and process the data and data review and processing Beginning in 2003 2 non-consecutive days of 24-hour intake data were collected The first day was collected in-person and the second day was collected by telephone 3 to 10 days later These data were collected using USDArsquos dietary data collection instrument the Automated Multiple Pass Method This method provides an efficient and accurate means of collecting intakes for large-scale national surveys It is fully computerized and uses a five-step interview Details can be found at USDArsquos Agriculture Research Service (httpwwwarsusdagovbabhnrcfsrg)
For NHANES 2003minus2004 there were 12761 persons selected of these 9643 were considered respondents to the mobile examination center (MEC) examination and data collection However only 9034 of the MEC respondents provided complete dietary intakes for Day 1 Furthermore of those providing the Day 1 data only
8354 provided complete dietary intakes for Day 2 For NHANES 2005minus2006 there were 12862 persons selected of these 9950 were considered respondents to the MEC examination and data collection However only 9349 of the MEC respondents provided complete dietary intakes for Day 1 Furthermore of those providing the Day 1 data only 8429 provided complete dietary intakes for Day 2
The 2003minus2006 NHANES surveys are stratified multistage probability samples of the civilian non-institutionalized US population The sampling frame was organized using 2000 US population census estimates NHANES oversamples low income persons adolescents 12 to 19 years persons 60 years and older African Americans and Mexican Americans Several sets of sampling weights are available for use with the intake data By using appropriate weights data for all 4 years of the surveys can be combined Additional information on NHANES can be obtained at httpwwwcdcgovnchsnhaneshtm
In 2010 US EPA OPP used NHANES 2003minus2006 data to update the Food Commodity Intake Database (FCID) that was developed in earlier analyses of data from the USDArsquos Continuing Survey of Food Intake by Individuals (CSFII) (US EPA 2000 USDA 2000) (see Section 12324) NHANES data on the foods people reported eating were converted to the quantities of agricultural commodities eaten Agricultural commodity is a term used by US EPA to mean plant (or animal) parts consumed by humans as food when such items are raw or unprocessed they are referred to as raw agricultural commodities For example an apple pie may contain the commodities apples flour fat sugar and spices FCID contains approximately 558 unique commodity names and 8-digit codes The FCID commodity names and codes were selected and defined by US EPA and were based on the US EPA Food Commodity Vocabulary (httpwwwepagovpesticidesfoodfeed)
Intake rates were generated for a variety of food itemsgroups based on the agricultural commodities included in the FCID These intake rates represent intake of all forms of the product (eg both home produced and commercially produced) for individuals who provided data for two days of the survey Note that if the person reported consuming food for only one day their two-day average would be half the amount reported for the one day of consumption Individuals who did not provide information on body weight or for whom identifying information was unavailable were excluded from the analysis Two-day average intake rates were calculated for all individuals in the database for each of the food
Page Exposure Factors Handbook 12-4 September 2011
Exposure Factors Handbook
Chapter 12mdashIntake of Grain Products itemsgroups These average daily intake rates were divided by each individuals reported body weight to generate intake rates in units of grams per kilogram of body weight per day (gkg-day) The data were weighted according to the 4-year 2-day sample weights provided in NHANES 2003minus2006 to adjust the data for the sample population to reflect the national population
Summary statistics were generated on a consumer-only and on a per capita basis Summary statistics including number of observations percentage of the population consuming the grains being analyzed mean intake rate and standard error of the mean intake rate were calculated for total grains and selected individual grains Percentiles of the intake rate distribution (ie 1st 5th 10th 25th 50th 75th 90th 95th 99th and the maximum value) were also provided for total grains Data were provided for the following age groups birth to 1 year 1 to 2 years 3 to 5 years 6 to 12 years 13 to 19 years 20 to 49 years and ge50 years Data on females 13 to 49 years were also provided Because these data were developed for use in US EPArsquos pesticide registration program the childhood age groups used are slightly different than those recommended in US EPArsquos Guidance on Selecting Age Groups for Monitoring and Assessing Childhood Exposures to Environmental Contaminants (US EPA 2005)
Table 12-3 presents per capita intake data for total grains in gkg-day Table 12-4 provides consumer-only intake data for total grains in gkg-day Table 12-5 provides per capita intake data for individual grains in gkg-day and Table 12-6 provides consumer-only intake data for individual grains in gkg-day In general these data represent intake of the edible portions of ie uncooked foods
The results are presented in units of gkg-day Thus use of these data in calculating potential dose does not require the body-weight factor to be included in the denominator of the average daily dose (ADD) equation It should be noted that converting these intake rates into units of gday by multiplying by a single average body weight is inappropriate because individual intake rates were indexed to the reported body weights of the survey respondents Also it should be noted that the distribution of average daily intake rates generated using short-term data (eg 2-day) does not necessarily reflect the long-term distribution of average daily intake rates The distributions generated from short-term and long-term data will differ to the extent that each individualrsquos intake varies from day to day the distributions will be similar to the extent that individualsrsquo intakes are constant from day to day Day-to-day variation in intake among individuals will
be high for grains that are not typically eaten every day For these grains the intake distribution generated from short-term data will not be a good reflection of the long-term distribution On the other hand for broad categories of foods (eg total grains) that are eaten on a daily basis throughout the year the short-term distribution may be a reasonable approximation of the true long-term distribution although it will show somewhat more variability In this chapter distributions are provided for broad categories of grains (eg total grains) Because of the increased variability of the short-term distribution the short-term upper percentiles shown here may overestimate the corresponding percentiles of the long-term distribution For individual foods only the mean standard error and percent consuming are provided An advantage of using the US EPArsquos analysis of NHANES data is that it provides distributions of intake rates for various age groups of children and adults normalized by body weight The data set was designed to be representative of the US population and includes 4 years of intake data combined Another advantage is the currency of the data the NHANES data are from 2003minus2006 However short-term dietary data may not accurately reflect long-term eating patterns and may under-represent infrequent consumers of a given food This is particularly true for the tails (extremes) of the distribution of food intake Because these are 2-day averages consumption estimates at the upper end of the intake distribution may be underestimated if these consumption values are used to assess acute (ie short-term) exposures Also the analysis was conducted using slightly different childhood age groups than those recommended in US EPArsquos Guidance on Selecting Age Groups for Monitoring and Assessing Childhood Exposures to Environmental Contaminants (US EPA 2005) However given the similarities in the age groups used the data should provide suitable intake estimates for the age groups of interest
1232 Relevant Grain Intake Studies 12321 USDA (1996a b 1993 1980)mdashFood and
Nutrient Intakes of Individuals in 1 Day in the United States
USDA calculated mean per capita intake rates for total and individual grain products using Nationwide Food Consumption Survey (NFCS) data from 1977minus1978 and 1987minus1988 (USDA 1993 1980) and CSFII data from 1994 and 1995 (USDA 1996a b) The mean per capita intake rates for grain products are presented in Table 12-7 and Table 12-8 for the two NFCS survey years respectively Table 12-9
Exposure Factors Handbook Page September 2011 12-5
Exposure Factors Handbook
Chapter 12mdashIntake of Grain Products presents similar data from the 1994 and 1995 CSFII for grain products
The advantages of using these data are that they provide mean intake estimates for various grain products The consumption estimates are based on short-term (ie 1-day) dietary data which may not reflect long-term consumption These data are based on older surveys and may not be entirely representative of current eating patterns
12322 USDA (1999b)mdashFood Consumption Prices and Expenditures 1970minus1997
The USDAs Economic Research Service calculates the amount of food available for human consumption in the United States annually Supply and utilization balance sheets are generated These are based on the flow of food items from production to end uses Total available supply is estimated as the sum of production (ie some products are measured at the farm level or during processing) starting inventories and imports (USDA 1999b) The availability of food for human use commonly termed as food disappearance is determined by subtracting exported foods products used in industries farm inputs (seed and feed) and end-of-the-year inventories from the total available supply (USDA 1999b) USDA (1999b) calculates the per capita food consumption by dividing the total food disappearance by the total US population
USDA (1999b) estimated per capita consumption data for grain products from 1970minus1997 In this section the 1997 values which are the most recent final data are presented Table 12-10 presents per capita consumption in 1997 for grains
An advantage of this study is that it provides per capita consumption rates for grains that are representative of long-term intake because disappearance data are generated annually Daily per capita intake rates are generated by dividing annual consumption by 365 daysyear One of the limitations of this study is that disappearance data do not account for losses from the food supply from waste spoilage or foods fed to pets Thus intake rates based on these data may overestimate daily consumption because they are based on the total quantity of marketable commodity utilized Therefore these data may be useful for estimating bounding exposure estimates It should also be noted that per capita estimates based on food disappearance are not a direct measure of actual consumption or quantity ingested instead the data are used as indicators of changes in usage over time (USDA 1999b) These data are based on older surveys and may not be entirely representative of current consumption patterns
12323 USDA (1999a)mdashFood and Nutrient Intakes by Children 1994minus1996 1998 Table Set 17
USDA (1999a) calculated national probability estimates of food and nutrient intake by children based on 4 years of the CSFII (1994minus1996 and 1998) for children age 9 years and under and on CSFII 1994minus1996 only for individuals age 10 years and over The CSFII was a series of surveys designed to measure the kinds and amounts of foods eaten by Americans Intake data based on 24-hour dietary recall were collected through in-person interviews on 2 non-consecutive days Section 12324 provides additional information on these surveys
USDA used sample weights to adjust for non-response to match the sample to the US population in terms of demographic characteristics and to equalize intakes over the four quarters of the year and the 7 days of the week A total of 503 breast-fed children were excluded from the estimates but both consumers and non-consumers were included in the analysis
USDA (1999a) provided data on the mean per capita quantities (grams) of various food productsgroups consumed per individual for 1 day and the percent of individuals consuming those foods in 1 day of the survey Table 12-11 and Table 12-12 present data on the mean quantities (grams) of grain products consumed per individual for 1 day and the percentage of survey individuals consuming grain products that survey day Data on mean intakes or mean percentages are based on respondentsrsquo Day-1 intakes
The advantage of the USDA (1999a) study is that it uses the 1994minus1996 1998 CSFII data set which includes 4 years of intake data combined and includes the supplemental data on children These data are expected to be generally representative of the US population and they include data on a wide variety of grain products The data set is one of a series of USDA data sets that are publicly available One limitation of this data set is that it is based on 1-day and short-term dietary data may not accurately reflect long-term eating patterns Other limitations of this study are that it only provides mean values of food intake rates consumption is not normalized by body weight and presentation of results is not consistent with US EPArsquos recommended age groups These data are based on older surveys and may not be entirely representative of current eating patterns
Page Exposure Factors Handbook 12-6 September 2011
Exposure Factors Handbook
Chapter 12mdashIntake of Grain Products 12324 US EPA Analysis of Continuing Survey
of Food Intake by Individuals (CSFII) 1994minus1996 1998
US EPAOPP in cooperation with USDArsquos Agricultural Research Service used data from the 1994minus1996 1998 CSFII to develop the FCID (US EPA 2000 USDA 2000) as described in Section 12311 The CSFII 1994minus1996 was conducted between January 1994 and January 1997 with a target population of non-institutionalized individuals in all 50 states and Washington DC In each of the three survey years data were collected for a nationally representative sample of individuals of all ages The CSFII 1998 was conducted between December 1997 and December 1998 and surveyed children 9 years of age and younger It used the same sample design as the CSFII 1994minus1996 and was intended to be merged with CSFII 1994minus1996 to increase the sample size for children The merged surveys are designated as CSFII 1994minus1996 1998 (USDA 2000) Additional information on the CSFII can be obtained at httpwwwarsusdagov Servicesdocshtmdocid=14531
The CSFII 1994minus1996 1998 collected dietary intake data through in-person interviews on two non-consecutive days The data were based on 24-hour recall A total of 21662 individuals provided data for the first day of those individuals 20607 provided data for a second day The 2-day response rate for the 1994minus1996 CSFII was approximately 76 The 2-day response rate for CSFII 1998 was 82 The CSFII 1994minus1996 1998 surveys were based on a complex multistage area probability sample design The sampling frame was organized using 1990 US population census estimates and the stratification plan took into account geographic location degree of urbanization and socioeconomic characteristics Several sets of sampling weights are available for use with the intake data By using appropriate weights data for all 4 years of the surveys can be combined USDA recommends that all four years be combined in order to provide an adequate sample size for children
The grain itemsgroups selected for the US EPA analysis included total grains and individual grain products such as cereal and rice US EPA (2003) presents the food codes and definitions used to determine the various grain products used in the analysis CSFII data on the foods people reported eating were converted to the quantities of agricultural commodities eaten Intake rates for these food itemsgroups and summary statistics were generated on both a per capita and a consumer-only basis using the same general methodology as in the US EPA
analysis of 2003minus2006 NHANES data as described in Section 12311 Because these data were developed for use in US EPArsquos pesticide registration program the childhood age groups used are slightly different than those recommended in US EPArsquos Guidance on Selecting Age Groups for Monitoring and Assessing Childhood Exposures to Environmental Contaminants (US EPA 2005)
Table 12-13 presents per capita intake data for total grains in gkg-day Table 12-14 provides consumer-only intake data for total grains in gkg-day Table 12-15 provides per capita intake data for individual grain products and Table 12-16 provides consumer-only intake data for individual grain products In general these data represent intake of the edible portions of unprepared (ie uncooked) foods Table 12-17 through Table 12-24 present per capita intake data for individual grain products The data come from CSFII 1994minus1996 only The results are presented in units of gkg-day These data represent as-consumed intake rates
The results are presented in units of gkg-day Thus use of these data in calculating potential dose does not require the body-weight factor to be included in the denominator of the ADD equation The cautions concerning converting these intake rates into units of gday by multiplying by a single average body weight and the discussion of the use of short term data in the NHANES description in Section 12311 apply to the CSFII estimates as well
A strength of US EPArsquos analysis is that it provides distributions of intake rates for various age groups of individuals normalized by body weight The analysis uses the 1994minus1996 1998 CSFII data set which was designed to be representative of the US population Also the data set includes 4 years of intake data combined and is based on a 2-day survey period However as discussed above short-term dietary data may not accurately reflect long-term eating patterns and may under-represent infrequent consumers of a given food This is particularly true for the tails (extremes) of the distribution of food intake Also the analysis was conducted using slightly different childhood age groups than those recommended in US EPArsquos Guidance on Selecting Age Groups for Monitoring and Assessing Childhood Exposures to Environmental Contaminants (US EPA 2005) However given the similarities in the childhood age groups used the data should provide suitable intake estimates for the age groups of interest While the CSFII data are older than the NHANES data they provide relevant information on consumption by season region of the United States
Exposure Factors Handbook Page September 2011 12-7
Exposure Factors Handbook
Chapter 12mdashIntake of Grain Products and urbanization breakdowns that are not available in the publically released NHANES data
12325 Smiciklas-Wright et al (2002)mdashFoods Commonly Eaten in the United States Quantities Consumed per Eating Occasion and in a Day 1994minus1996
Using data gathered in the 1994minus1996 USDA CSFII Smiciklas-Wright et al (2002) calculated distributions for the quantities of grain products consumed per eating occasion by members of the US population (ie serving sizes) The estimates of serving size are based on data obtained from 14262 respondents ages two and above who provided two days of dietary intake information Only dietary intake data from users of the specified food were used in the analysis (ie consumer-only data) Table 12-25 presents as-consumed the quantity of grain products consumed per eating occasion and the percentage of individuals using these foods in a 2-day period for a selected variety of grain products Table 12-26 presents the same data by sex and age
These data are presented on an as-consumed basis (grams) and represent the quantity of grain products consumed per eating occasion These estimates may be useful for assessing acute exposures to contaminants in specific foods or other assessments where the amount consumed per eating occasion is necessary Only the mean and standard deviation serving size data and percent of the population consuming the food during the 2-day survey period are presented in this handbook Percentiles of serving sizes of the foods consumed by these age groups of the US population can be found in Smiciklas-Wright et al (2002)
The advantages of using these data are that they were derived from the USDA CSFII and are representative of the US population The analysis conducted by Smiciklas-Wright et al (2002) accounted for individual foods consumed as ingredients of mixed foods Mixed foods were disaggregated via recipe files so that the individual ingredients could be grouped together with similar foods that were reported separately Thus weights of foods consumed as ingredients were combined with weights of foods reported separately to provide a more thorough representation of consumption However it should be noted that since the recipes for the mixed foods consumed were not provided by the respondents standard recipes were used As a result the estimates of quantity consumed for some food types are based on assumptions about the types and quantities of ingredients consumed as part of mixed
foods This study used data from the 1994 to 1996 CSFII data from the 1998 childrenrsquos supplement were not included
12326 Vitolins et al (2002)mdashQuality of Diets Consumed by Older Rural Adults
Vitolins et al (2002) conducted a survey to evaluate the dietary intake by food groups of older (gt70 years) rural adults The sample consisted of 130 community dwelling residents from two rural counties in North Carolina Data on dietary intake over the preceding year were obtained in face-to-face interviews conducted in participantsrsquo homes or in a few cases a senior center The food frequency questionnaire used in the survey was a modified version of the National Cancer Institute Health Habits and History Questionnaire this modified version included an expanded food list containing a greater number of ethnic foods than the original food frequency form Demographic and personal data collected included sex ethnicity age education denture use marital status chronic disease and weight
Food items reported in the survey were grouped into food groups similar to the USDA Food Guide Pyramid and the National Cancer Institutersquos 5 A Day for Better Health program These groups are (1) fruits and vegetables (2) bread cereal rice and pasta (3) milk yogurt and cheese (4) meat fish poultry beans and eggs and (5) fats oils sweets and snacks Medians ranges frequencies and percentages were used to summarize intake of each food group broken down by demographic and health characteristics In addition multiple regression models were used to determine which demographic and health factors were jointly predictive of intake of each of the five food groups
Thirty-four percent of the survey participants were African American 36 were European American and 30 were Native American Sixty-two percent were female 62 were not married at the time of the interview and 65 had some high school education or were high school graduates Almost all of the participants (95) had one or more chronic diseases Sixty percent of the respondents were between 70 and 79 years of age the median age was 78 years old Table 12-27 presents the median servings of bread cereal rice and pasta broken down by demographic and health characteristic Only sex was statistically predictive of bread cereal rice and pasta intake (p lt 001) with males consuming approximately an extra serving per day compared to women Also the multiple regression model indicated that sex was predictive of
Page Exposure Factors Handbook 12-8 September 2011
Exposure Factors Handbook
Chapter 12mdashIntake of Grain Products breads cereal rice and pasta intake after controlling for other demographic variables
One limitation of the study as noted by the study authors is that the study did not collect information on the length of time the participants had been practicing the dietary behaviors reported in the survey The questionnaire asked participants to report the frequency of food consumption during the past year The study authors noted that currently there are no dietary assessment tools that allow the collection of comprehensive dietary data over years of food consumption Another limitation of the study is that the small sample size used makes associations by sex and ethnicity difficult
12327 Fox et al (2004)mdashFeeding Infants and Toddlers Study What Foods Are Infants and Toddlers Eating
Fox et al (2004) used data from the Feeding Infants and Toddlers study (FITS) to assess food consumption patterns in infants and toddlers The FITS was sponsored by Gerber Products Company and was conducted to obtain current information on food and nutrient intakes of children ages 4 to 24 months old in the 50 states and the District of Columbia The FITS is described in detail in Devaney et al (2004) FITS was based on a random sample of 3022 infants and toddlers for which dietary intake data were collected by telephone from their parents or caregivers between March and July 2002 An initial recruitment and household interview was conducted followed by an interview to obtain information on intake based on 24-hour recall The interview also addressed growth development and feeding patterns A second dietary recall interview was conducted for a subset of 703 randomly selected respondents The study over-sampled children in the 4 to 6 and 9 to 11 months age groups sample weights were adjusted for non-response over sampling and under coverage of some subgroups The response rate for the FITS was 73 for the recruitment interview Of the recruited households there was a response rate of 94 for the dietary recall interviews (Devaney et al 2004) Table 12-28 shows the characteristics of the FITS population
Fox et al (2004) analyzed the first set of 24-hour recall data collected from all study participants For this analysis children were grouped into six age categories 4 to 6 months 7 to 8 months 9 to 11 months 12 to 14 months 15 to 18 months and 19 to 24 months Table 12-29 provides the percentage of infants and toddlers consuming different types of grains or grain products at least once a day The percentages of children eating any type of grain or
grain product ranged from 658 for 4 to 6 monthshyolds to 992 for 19- to 24-month-olds
The advantages of this study is that it represents the US population and the sample size was large One limitation of the analysis done by Fox et al (2004) is that only frequency data were provided no information on actual intake rates was included In addition Devaney et al (2004) noted several limitations associated with the FITS data For the FITS a commercial list of infants and toddlers was used to obtain the sample used in the study Since many of the households could not be located and did not have children in the target population a lower response rate than would have occurred in a true national sample was obtained (Devaney et al 2004) In addition the sample was likely from a higher socioeconomic status when compared with all US infants in this age group (4 to 24 months old) and the use of a telephone survey may have omitted lower-income households without telephones (Devaney et al 2004)
12328 Ponza et al (2004)mdashNutrient Food Intakes and Food Choices of Infants and Toddlers Participating in WIC
Ponza et al (2004) conducted a study using selected data from the FITS to assess feeding patterns food choices and nutrient intake of infants and toddlers participating in the Special Supplemental Nutrition Program for Women Infants and Children (WIC) Ponza et al (2004) evaluated FITS data for the following age groups 4 to 6 months (N = 862) 7 to 11 months (N = 1159) and 12 to 24 months (N = 996) Table 12-30 shows the total sample size described by WIC participants and non-participants
The foods consumed were analyzed by tabulating the percentage of infants who consumed specific foodsfood groups per day (Ponza et al 2004) Weighted data were used in all of the analyses used in the study (Ponza et al 2004) Table 12-30 presents the demographic data for WIC participants and non-participants Table 12-31 provides information on the food choices for the infants and toddlers studied In general there was little difference in grain product choices among WIC participants and non-participants except for the 7 to 11 months age category (see Table 12-31) Non-participants ages 7 to 11 months were more likely to eat non-infant cereals than WIC participants
An advantage of this study is that it had a relatively large sample size and was representative of the US general population of infants and children A limitation of the study is that intake values for foods
Exposure Factors Handbook Page September 2011 12-9
Exposure Factors Handbook
Chapter 12mdashIntake of Grain Products were not provided Other limitations are those associated with the FITS data as described previously in Section 12327
12329 Fox et al (2006)mdashAverage Portion of Foods Commonly Eaten by Infants and Toddlers in the United States
Fox et al (2006) estimated average portion sizes consumed per eating occasion by children 4 to 24 months of age who participated in the FITS The FITS is a cross-sectional study designed to collect and analyze data on feeding practices food consumption and usual nutrient intake of US infants and toddlers and is described in Section 12327 of this chapter It included a stratified random sample of 3022 children between 4 and 24 months of age
Using the 24-hour recall data Fox et al (2006) derived average portion sizes for six major food groups including breads and grains Average portion sizes for select individual foods within these major groups were also estimated For this analysis children were grouped into six age categories 4 to 5 months 6 to 8 months 9 to 11 months 12 to 14 months 15 to 18 months and 19 to 24 months Table 12-32 and Table 12-33 present the average portion sizes for grain products for infants and toddlers respectively
123210 Mennella et al (2006)mdashFeeding Infants and Toddlers Study The Types of Foods Fed to Hispanic Infants and Toddlers
Mennella et al (2006) investigated the types of food and beverages consumed by Hispanic infants and toddlers in comparison to the non-Hispanic infants and toddlers in the United States The FITS 2002 data for children between 4 and 24 months of age were used for the study The data represent a random sample of 371 Hispanic and 2367 non-Hispanic infants and toddlers (Mennella et al 2006) Mennella et al (2006) grouped the infants as follows 4 to 5 months (N = 84 Hispanic 538 non-Hispanic) 6 to 11 months (N = 163 Hispanic 1228 non-Hispanic) and 12 to 24 months (N = 124 Hispanic 871 non-Hispanic) of age
Table 12-34 provides the percentage of Hispanic and non-Hispanic infants and toddlers consuming grain products In most instances the percentages consuming the different types are similar However 6 to 11 month old Hispanic children were more likely to eat rice and pasta than non-Hispanic children in this age groups
The advantage of the study is that it provides information on f ood preferences for Hispanic and non-Hispanic infants and toddlers A limitation is that the study did not provide food intake data but provided frequency of use data instead Other limitations are those noted previously in Section 12327 for the FITS data
124 CONVERSION BETWEEN WET- AND
DRY-WEIGHT INTAKE RATES The intake data presented in this chapter are
reported in units of wet weight (ie as-consumed or uncooked weight of grain products consumed per day or per eating occasion) However data on the concentration of contaminants in grain products may be reported in units of either wet or dry weight (eg mg contaminant per gram dry w eight of grain products) It is essential that exposure assessors be aware of this difference so that they may ensure consistency between the units used for intake rates and those used for concentration data (ie if the contaminant concentration is measured in dry weight of grain products then the dry-weight units should be used for their intake values)
If necessary wet-weight (eg as-consumed) intake rates may be converted to dry-weight intake rates using the moisture content percentages presented in Table 12-35 and the following equation
IR = IR 100 minusW dw ww (Eqn 12-1) 100
where
IRdw = dry-weight intake rate IRww = wet-weight intake rate and W = percent water content
Alternatively dry-weight residue levels in grain
products may be converted to wet-weight residue levels for use with wet-weight (eg as-consumed) intake rates as follows
C = C 100 minus W ww dw (Eqn 12-2) 100
where
Cww = wet concentration rate Cdw = dry-weight concentration and W = percent water content
Page Exposure Factors Handbook 12-10 September 2011
Exposure Factors Handbook
Chapter 12mdashIntake of Grain Products
Exposure Factors Handbook Page September 2011 12-11
The moisture data presented in Table 12-35 are for selected grain products taken from USDA (2007)
125 REFERENCES FOR CHAPTER 12 Devaney B Kalb L Briefel R Zavitsky-Novak T
Clusen N Ziegler P (2004) Feeding infants and toddlers study overview of the study design J Am Diet Assoc 104 s8-13 httpdxdoiorg101016jjada200310023
Fox MK Pac S Devaney B Jankowski L (2004) Feeding infants and toddlers study What foods are infants and toddlers eating J Am Diet Assoc 104 s22-s30 httpdxdoiorg101016jjada200310026
Fox MK Reidy K Karwe V Ziegler P (2006) Average portions of foods commonly eaten by infants and toddlers in the United States J Am Diet Assoc 106 S66-S76 httpdxdoiorg101016jjada200509042
Mennella JA Ziegler P Briefel R Novak T (2006) Feeding Infants and Toddlers Study the types of foods fed to Hispanic infants and toddlers J Am Diet Assoc 106 S96shy106 httpdxdoiorg101016jjada200509038
NCHS (National Center for Health Statistics) (1993) Joint policy on variance estimation and statistical reporting standards on NHANES III and CSFII reports HNISNCHS Analytic Working Group recommendations Riverdale MD Human Nutrition Information Service (HNIS)Analytic Working Group Agricultural Research Service Survey SystemsFood Consumption Laboratory
Ponza M Devaney B Ziegler P Reidy K Squatrito C (2004) Nutrient intakes and food choices of infants and toddlers participating in WIC J Am Diet Assoc 104 s71-s79 httpdxdoiorg101016jjada200310018
Smiciklas-Wright H Mitchell DC Mickle SJ Cook AJ Goldman JD (2002) Foods commonly eaten in the United States Quantities consumed per eating occasion and in a day 1994minus96 [pre-publication version] (NFS Report No 96-5) Beltsville MD US Department of Agriculture httpwwwarsusdagovsp2userfilesplace1 2355000pdfportionpdf
US EPA (US Environmental Protection Agency) (2000) Food commodity intake database [Database]
US EPA (US Environmental Protection Agency) (2003) CSFII analysis of food intake distributions (EPA600R-03029) Washington DC httpcfpubepagovnceacfmrecordisplayc fmdeid=56610
US EPA (US Environmental Protection Agency) (2005) Guidance on selecting age groups for monitoring and assessing childhood exposures to environmental contaminants (final) (EPA630P-03003F) Washington DC US Environmental Protection Agency Risk Assessment Forum httpwwwepagovrafpublicationsguidanc e-on-selecting-age-groupshtm
USDA (US Department of Agriculture) (1980) Food and nutrient intakes of individuals in 1 day in the United States Spring 1977 Nationwide Food Consumption Survey 1977ndash78 Preliminary report no 2 Washington DC httpwwwarsusdagovSP2UserFilesPlace 12355000pdf7778nfcs7778_prelim_2pdf
USDA (US Department of Agriculture) (1993) Food and nutrient intakes by i ndividuals in the United States 1 day 1987ndash88 Nationwide Food Consumption Survey 1987-88 Report no 87-I-1 (87-I-1) Washington DC httpwwwarsusdagovSP2UserFilesPlace 12355000pdf8788nfcs8788_rep_87-ishy1pdf
USDA (US Department of Agriculture) (1996a) Data tables Results from USDAs 1994 continuing survey of food intakes by individuals and 1994 diet and health knowledge survey Riverdale MD
USDA (US Department of Agriculture) (1996b) Data tables results from USDArsquos 1995 Continuing survey of food intakes by individuals and 1995 diet and health knowledge survey Riverdale MD
USDA (US Department of Agriculture) (1999a) Food and nutrient intakes by children 1994shy96 1998 table set 17 Beltsville MD httpwwwarsusdagovSP2UserFilesPlace 12355000pdfscs_allpdf
USDA (US Department of Agriculture) (1999b) Food consumption prices and expenditures (1970minus1997) Statistical Bulletin No 965 Washington DC Economic Research Service
USDA (US Department of Agriculture) (2000) 1994-1996 1998 continuing survey of food
Exposure Factors Handbook
Chapter 12mdashIntake of Grain Products intakes by individuals (CSFII) Beltsville MD Agricultural Research Service Beltsville Human Nutrition Research Center
USDA (US Department of Agriculture) (2007) USDA nutrient database for standard reference release 20 Riverdale MD httpwwwarsusdagovmainsite_mainhtm modecode=12-35-45-00
Vitolins MZ Quandt SA Bell RA Arcury TA Case LD (2002) Quality of diets consumed by older rural adults J Rural Health 18 49shy56
Page Exposure Factors Handbook 12-12 September 2011
Exposure F
actors Handbook
Chapter 12mdash
Intake of Grain Products
Table 12-3 Per Capita Intake of Total Grains Based 2003ndash2006 NHANES (gkg-day edible portion uncooked weight)
Population Group
Consuming Percentiles
N Mean SE 1st 5th 10th 25th 50th 75th 90th 95th 99th Max Whole Population 16783 100 26 004 02 06 08 13 20 32 51 67 99 348 Age Group
Birth to 1 year 865 76 31 020 00 00 00 01 23 50 75 95 125 349 1 to 2 years 1052 100 64 017 15 23 30 42 58 84 105 124 159 211 3 to 5 years 978 100 62 013 20 24 33 44 59 76 96 111 132 156 6 to 12 years 2256 100 44 009 06 14 18 28 41 55 74 82 111 145 13 to 19 years 3450 100 24 005 04 07 10 15 21 32 42 50 75 143 20 to 49 years 4289 100 22 004 03 06 08 12 19 28 39 46 71 150 Females 13 to 49 years 4103 100 19 004 02 05 08 11 17 25 34 39 55 98 50 years and older 3893 100 17 003 03 05 07 10 15 21 29 35 52 94
Race Mexican American 4450 99 30 005 01 08 10 16 24 39 58 72 106 178 Non-Hispanic Black 4265 100 24 004 02 05 07 11 18 29 50 68 102 211 Non-Hispanic White 6757 100 25 005 03 06 08 13 19 31 49 65 96 348 Other Hispanic 562 99 27 013 02 07 10 15 21 33 53 70 98 153 Other RacemdashIncluding Multiple Races 749 100 30 011 03 06 09 15 25 39 60 75 111 175
N = Sample size SE = Standard error Max = Maximum value Estimates are less statistically reliable based on guidance published in the Joint Policy on Variance Estimation and Statistical Reporting Standards on
NHANES III and CSFII Reports NHISNCHS Analytical Working Group Recommendations (NCHS 1993)
Source Based on US EPA analysis of 2003ndash2006 NHANES
Exposure F
actors Handbook
Page Septem
ber 2011 12-13
Exposure F
actors Handbook
Chapter 12mdash
Intake of Grain Products
Table 12-4 Consumer-Only Intake of Total Grains Based 2003ndash2006 NHANES (gkg-day edible portion uncooked weight)
Population Group N Mean SE Percentiles
1st 5th 10th 25th 50th 75th 90th 95th 99th Max
Whole Population 16556 26 004 03 06 08 13 20 32 51 67 99 Age Group
Birth to 1 year 644 41 018 01 04 08 18 35 59 81 103 139 1 to 2 years 1050 64 016 16 24 30 42 58 84 105 124 159 3 to 5 years 977 62 013 20 24 33 44 59 76 96 111 132 6 to 12 years 2256 44 009 06 14 18 28 41 55 74 82 111 13 to 19 years 3450 24 005 04 07 10 15 21 32 42 50 75 20 to 49 years 4288 22 004 03 06 08 12 19 28 39 46 71 Females 13 to 49 years 4102 19 003 02 05 08 11 17 25 34 39 55 50 years and older 3891 17 003 03 05 07 10 15 21 29 35 52
Race Mexican American 4341 30 005 04 08 11 16 24 39 59 72 106 Non-Hispanic Black 4236 24 004 02 05 07 11 18 29 50 69 103 Non-Hispanic White 6694 25 005 03 06 08 13 20 31 49 65 96 Other Hispanic 548 28 014 04 07 10 15 21 34 54 71 98 Other RacemdashIncluding Multiple Races 737 31 011 03 07 09 15 25 39 60 75 111
349
349 211 156 145 143 150 98 94
178 211 349 153 175
N = Sample size SE = Standard error Max = Maximum value Estimates are less statistically reliable based on guidance published in the Joint Policy on Variance Estimation and Statistical Reporting
Standards on NHANES III and CSFII Reports NHISNCHS Analytical Working Group Recommendations (NCHS 1993)
Source Based on US EPA analysis of 2003ndash2006 NHANES
Page E
xposure Factors H
andbook 12-14
September 2011
Table 12-5 Per Capita Intake of Individual Grain Products Based 2003ndash2006 NHANES (gkg-day edible portion uncooked weight)
Population Group N
Consuming Mean SE
Consuming Mean SE
Cereal Rice Whole Population
Age Group Birth to 1 year 1 to 2 years 3 to 5 years 6 to 12 years 13 to 19 years 20 to 49 years Females 13 to 49 years 50 years and older Race Mexican American Non-Hispanic Black Non-Hispanic White Other Hispanic Other RacemdashIncluding Multiple Races
16783
865 1052
978 2256 3450 4289 4103 3893
4450 4265 6757
562
749
100
81 100 100 100 100 100 100 100
100 100 100
99
100
37
51 87 86 63 39 32 29 22
43 36 36 39
41
004
030 018 017 010 008 004 004 004
007 006 005 020
012
88 69 87 91 89 85 89 86 89
87 86 88 92
90
02
11 06 05 03 02 03 02 01
03 03 02 06
08
001
008 006 006 003 001 001 001 001
002 002 001 005
008 N
SE
Source
= Sample size = Standard error
Based on US EPA analysis of 2003ndash2006 NHANES
Exposure Factors Handbook
Chapter 12mdashIntake of Grain Products
Exposure Factors Handbook Page September 2011 12-15
Table 12-6 Consumer-Only Intake of Individual Grain Products Based 2003ndash2006 NHANES (gkg-day edible portion uncooked weight)
Population Group N Mean SE N Mean SE
Cereal Rice Whole Population
Age Group Birth to 1 year 1 to 2 years 3 to 5 years 6 to 12 years 13 to 19 years 20 to 49 years Females 13 to 49 years 50 years and older Race Mexican American Non-Hispanic Black Non-Hispanic White Other Hispanic Other RacemdashIncluding Multiple Races
16613
696 1051 978 2256 3450 4289 4103 3893
4372 4244 6707 550 740
37
63 87 86 63 39 32 29 22
43 36 36 39 41
004
031 018 017 010 008 004 004 004
007 006 005 020 013
14447
552 928 875 2000 2898 3812 3511 3382
3757 3645 5887 491 667
03
15 07 05 03 02 03 02 02
03 03 02 06 08
001
010 007 006 003 002 002 002 001
002 002 001 005 008
N SE
Source
= Sample size = Standard error
Based on US EPA analysis of 2003ndash2006 NHANES
Exposure Factors Handbook
Chapter 12mdashIntake of Grain Products
Page Exposure Factors Handbook 12-16 September 2011
Exposure Factors Handbook
Chapter 12mdashIntake of Grain Products
Table 12-7 Mean Grain Intake per Individual in a Day by Sex and Age (gday as-consumed)a for 1977minus1978 Group Age (years) Total Grains Breads Rolls
Biscuits Other Baked
Goods Cereals Pasta Mixtures Mainly Grainb
Males and Females lt1 1 to 2 3 to 5 6 to 8
42 158 181 206
4 27 46 53
5 24 37 56
30 44 54 60
3 63 45 38
Males 9 to 11 12 to 14 15 to 18 19 to 22 23 to 34 35 to 50 51 to 64 65 to 74 ge75
238 288 303 253 256 234 229 235 196
67 76 91 84 82 82 78 71 70
56 80 77 53 60 58 57 60 50
51 57 53 64 40 44 48 69 58
64 74 82 52 74 50 46 35 19
Females 9 to 11 12 to 14 15 to 18 19 to 22 23 to 34 35 to 50 51 to 64 65 to 74 ge75
214 235 196 161 163 161 155 175 178
58 57 57 44 49 49 52 57 54
59 61 43 36 38 37 40 42 44
44 45 41 33 32 32 36 47 58
53 72 55 48 44 43 27 29 22
Males and FemalesmdashAll Ages 204 62 49 44 49 a Based on USDA Nationwide Food Consumption Survey 1977ndash1978 data for 1 day b Includes mixtures containing grain as the main ingredient
Source USDA (1980)
Exposure Factors Handbook Page September 2011 12-17
Exposure Factors Handbook
Chapter 12mdashIntake of Grain Products
Page Exposure Factors Handbook 12-18 September 2011
Table 12-8 Mean Grain Intakes per Individual in a Day by Sex and Age (gday as-consumed)a for 1987minus1988
Group Age (years) Total Grains Yeast Breads and
Rolls
Quick Breads Pancakes
French Toast
Cakes Cookies Pastries
Pies
Crackers Popcorn
Pretzels Corn Chips
Cereals and Pastas
Mixtures Mostly Grainb
Males and Females le5 167 30 8 22 4 52 51
Males 6 to 11 268 51 16 37 8 74 83
12 to 19 304 65 28 45 10 72 82 ge20 272 65 20 37 8 58 83
Females 6 to 11 231 43 19 30 6 66 68
12 to 19 239 45 13 29 7 52 91 ge20 208 45 14 28 6 53 62
All Individuals 237 52 16 32 7 57 72 a Based on USDA Nationwide Food Consumption Survey 1987ndash1988 data for 1 day b Includes mixtures containing grain as the main ingredient
Source USDA (1993)
Table 12-9 Mean Grain Intakes per Individual in a Day by Sex and Age (gday as-consumed)a for 1994minus1995
Group Age (years)
Total Grains Yeast Breads and Rolls
Quick Breads Pancakes
French Toast
Cakes Cookies
Pastries Pies
Crackers Popcorn
Pretzels Corn Chips
Cereals and Pastas
Mixtures Mostly Grainb
1994 1995 1994 1995 1994 1995 1994 1995 1994 1995 1994 1995 1994 1995 Males and Females le5 213 210 26 28 11 11 22 23 8 7 58 57 89 84
Males 6 to 11 12 to 19 ge20
285 417 357
341 364 365
51 53 64
45 54 61
15 30 22
21 21 24
42 54 43
46 43 46
12 17 13
18 22 15
66 82 86
97 84 91
101 180 128
115 138 128
Females 6 to 11 12 to 19 ge20
260 317 254
286 296 257
43 40 44
46 37 45
16 16 16
21 14 15
37 39 33
51 35 34
11 17 9
14 16 10
57 63 59
54 52 69
94 142 92
100 143 83
All Individuals 300 303 50 49 18 19 38 39 12 13 70 76 112 107 a Based on USDA CSFII 1994 and 1995 data for 1 day b Includes mixtures containing grain as the main ingredient
Source USDA (1996a b)
Exposure Factors Handbook
Chapter 12mdashIntake of Grain Products
Table 12-10 Per Capita Consumption of Flour and Cereal Products in 1997
Food Item Per Capita Consumption
(gday)a
Total Wheat Flourb
Rye Flour Ricec
Total Corn Productsd
Oat Productse
Barley Productsf
Total Flour and Cereal Productsg
186 07 24 29 8
09 249
a Original data were presented in lbsyear data were converted to gday by multiplying by a factor of 454 glb and dividing by 365 dayyear Consumption of most items at the processing level Excludes quantities used in alcoholic beverages and fuel
b Includes white whole wheat and durum flour c Milled basis d Includes corn flour and meal hominy and grits and corn starch e Includes rolled oats ready-to-eat oat cereals oat flour and oat bran f Includes barley flour pearl barley and malt and malt extract used in food processing g Excludes wheat not ground into flour
Source USDA (1999b)
Exposure Factors Handbook Page September 2011 12-19
Table 12-11 Mean Quantities of Grain Products Consumed by Children Under 20 Years of Age by Sex and Age per Capita (gday as-consumed)a
Yeast Cereals and Pasta Cakes Crackers Quick Breads Mixtures Age Group Sample Breads Cookies Popcorn Totalb Ready-to- Pancakes Mainly (years) Size and Total Rice Pasta Pastries Pretzels Eat Cereals French Toast Grainc Rolls Pies Corn Chips
Males and Females lt1 1126 56 2 29 1 2 1d 1 3 1 20 1 1016 192 16 57 11 9 9 9 16 7 87 2 1102 219 26 62 16 15 12 12 22 9 87 1 to 2 2118 206 21 59 13 12 11 11 19 8 87 3 1831 242 30 64 19 13 12 16 23 11 98 4 1859 264 36 67 22 15 11 17 30 13 102 5 884 284 41 76 24 17 11 15 33 13 107 3 to 5 4574 264 36 69 22 15 11 16 29 12 102 le5 7818 219 27 61 16 13 10 12 22 9 87
Males 6 to 9 787 310 45 77 28 18 15 23 39 16 109 6 to 11 1031 318 46 80 31 16 18 23 40 15 115 12 to 19 737 406 54 82 29 27 17 26 49 19 175
Females 6 to 9 704 284 43 61 21 12 15 18 42 13 107 6 to 11 969 280 43 62 20 14 15 19 42 14 101 12 to 19 732 306 40 67 17 19 22 15 37 15 132
Males and Females le9 9309 250 34 64 20 14 12 16 30 12 96 le19 11287 298 40 69 22 17 15 18 36 14 120 a Based on data from 1994ndash1996 1998 CSFII b Includes yeast breads rolls cereals pastas quick breads pancakes French toast cakes cookies pastries pies crackers popcorn pretzels corn
chips and mixtures having a grain product as a main ingredient Excludes grain products that were ingredients in food mixtures coded as a single item and tabulated under another food group for example noodles in tuna-noodle casserole are tabulated under Meat Poultry and Fish
c Includes mixtures having a grain product as a main ingredient such as burritos tacos pizza egg rolls quiche spaghetti with sauce rice and pasta mixtures frozen meals in which the main course is a grain mixture noodle and rice soups and baby-food macaroni and spaghetti mixtures
d Estimate is not statistically reliable due to small sample size reporting intake Note Consumption amounts shown are representative of the first day of each participantrsquos survey response
Source USDA (1999a)
Exposure F
actors Handbook
Chapter 12mdash
Intake of Grain Products
Page E
xposure Factors H
andbook 12-20
September 2011
Exposure F
actors Handbook
Chapter 12mdash
Intake of Grain Products
Table 12-12 Percentage of Individuals Under 20 Years of Age Consuming Grain Products by Sex and Age ()a
Age Group (years) Sample Size Totalb
Yeast Breads
and Rolls
Cereals and Pasta Quick Breads
Pancakes French Toast
Cakes Cookies Pastries
Pies
Crackers Popcorn Pretzels
Corn Chips
Mixtures Mainly GraincTotal
Ready-to-Eat
Cereals Rice Pasta
Males and Females lt1 1126 706 109 628 91 34 21 44 165 103 150 1 1016 982d 484 706 453 113 94 230 470 390 478 2 1102 990d 587 711 519 144 94 275 466 379 453 1 to 2 2118 987 537 709 487 129 94 253 468 384 465 3 1831 994d 641 697 533 111 86 288 461 385 490 4 1859 995d 670 691 548 114 71 286 523 394 462 5 884 999d 692 704 549 114 68 252 524 321 474 3 to 5 4574 996d 668 697 543 113 75 275 503 367 475 le5 7818 958 555 693 469 109 75 240 450 341 433
Males 6 to 9 787 989d 698 626 508 105 74 281 525 360 445 6 to 11 1031 990d 691 640 524 97 81 271 523 338 453 12 to 19 737 982d 627 446 332 100 59 244 413 272 462
Females 6 to 9 704 997d 715 612 476 90 79 263 571 383 480 6 to 11 969 993d 710 593 456 94 71 271 550 371 457 12 to 19 732 976d 609 459 303 86 93 198 406 309 461
Males and Females le9 9309 972 616 664 479 105 76 253 489 353 444 le19 11287 976 624 576 417 99 76 242 461 325 451 a Based on data from 1994ndash1996 1998 CSFII b Includes yeast breads rolls cereals pastas quick breads pancakes French toast cakes cookies pastries pies crackers popcorn
pretzels corn chips and mixtures having a grain product as a main ingredient Excludes grain products that were ingredients in food mixtures coded as a single item and tabulated under another food group for example noodles in tuna-noodle casserole are tabulated under Meat Poultry and Fish
c Includes mixtures having a grain product as a main ingredient such as burritos tacos pizza egg rolls quiche spaghetti with sauce rice and pasta mixtures frozen meals in which the main course is a grain mixture noodle and rice soups and baby-food macaroni and spaghetti mixtures
d Estimate is not statistically reliable due to small sample size reporting intake Note Percentages shown are representative of the first day of each participantrsquos survey response
Source USDA (1999a)
Exposure F
actors Handbook
Page Septem
ber 2011 12-21
Page E
xposure Factors H
andbook 12-22
September 2011
Exposure F
actors Handbook
Chapter 12mdash
Intake of Grain Products
Table 12-13 Per Capita Intake of Total Grains Based on 1994ndash1996 1998 CSFII (gkg-day edible portion uncooked weight) Population Group N Percent
Consuming Mean SE Percentiles 1st 5th 10th 25th 50th 75th 90th 95th 99th Max
Whole Population Age group Birth to 1 year 1 to 2 years 3 to 5 years 6 to 12 years 13 to 19 years 20 to 49 years ge50 years Season Fall Spring Summer Winter Race Asian Pacific Islander Black American Indian Alaskan Native OtherNA White Region Midwest Northeast South West Urbanization Central City Suburban Non-metropolitan
20607
1486 2096 4391 2089 1222 4677 4646
4687 5308 5890 4722
557 2740
177 1638 15495
4822 3692 7208 4885
6164 9598 4845
995
705 998 1000 1000 1000
999 1000
995 996 995 995
985 994 997 988 996
997 996 995 994
995 995 996
27
25 64 63 43 25 22 17
26 27 26 27
36 26 29 31 26
27 28 25 28
27 27 24
00
01 01 01 01 01 00 00
00 00 00 00
02 01 02 01 00
00 00 00 01
00 00 01
02
00 11 18 09 04 03 03
02 02 03 02
00 01 03 00 03
03 03 02 02
01 03 03
06
00 21 26 17 08 06 06
06 06 07 06
11 05 05 07 07
07 07 06 07
06 07 06
09
00 28 32 20 11 08 07
09 08 09 09
15 07 08 09 09
09 10 08 09
09 09 08
13
00 42 43 28 15 13 11
13 13 13 14
23 11 13 15 13
14 14 12 14
13 14 12
21
16 59 59 40 23 19 15
21 21 21 21
32 19 22 24 20
21 22 19 22
21 21 19
33
38 79 78 54 31 28 21
33 34 33 33
47 33 42 41 32
34 35 30 35
35 34 29
52
62 104 99 70 44 39 28
50 55 51 52
62 54 63 61 50
53 53 50 54
54 53 48
68
86 121
115 82 51 47 35
66 70 68 68
73 73 75 77 66
70 68 66 70
70 69 63
103
127 168 156
111 79 71 49
100 105 105 101
112 115
120 117
98
104 110
97 103
107 100 104
316
263 316 270 172 124 161
112
263 294 282 316
246 294 168 270 316
238 316 282 208
294 316 238
N SE
Source
= Sample size = Standard error
US EPA analysis of 1994ndash1996 1998 CSFII
Exposure F
actors Handbook
Page Septem
ber 2011 12-23
Exposure F
actors Handbook
Chapter 12mdash
Intake of Grain Products
Table 12-14 Consumer-Only Intake of Total Grains Based on 1994ndash1996 1998 CSFII (gkg-day edible portion uncooked weight) Population Group N Mean SE Percentiles
1st 5th 10th 25th 50th 75th 90th 95th 99th Max Whole Population Age Group Birth to 1 year 1 to 2 years 3 to 5 years 6 to 12 years 13 to 19 years 20 to 49 years ge50 years Season Fall Spring Summer Winter Race Asian Pacific Islander Black American Indian Alaskan Native OtherNA White Region Midwest Northeast South West Urbanization Central City Suburban Non-metropolitan
20157
1048 2092 4389 2089 1222 4673 4644
4587 5190 5751 4629
527 2675
175 1570 15210
4743 3628 7053 4733
6023 9378 4756
27
36 64 63 43 25 22 17
26 27 27 27
37 26 30 32 26
27 28 25 28
28 27 24
00
01 01 01 01 01 00 00
00 00 00 00
02 01 02 01 00
00 00 00 01
00 00 01
03
01 12 18 09 04 03 03
03 03 04 03
08 02 03 05 04
04 04 03 04
03 04 03
07
03 21 26 17 08 06 06
07 07 07 07
12 05 05 07 07
07 08 06 07
07 07 06
09
06 28 32 20 11 08 07
09 09 09 09
16 07 08 10 09
09 10 08 09
09 09 08
13
14 42 43 28 15 13 11
13 13 14 14
23 11 13 15 13
14 14 12 14
13 14 12
21
28 59 59 40 23 19 15
21 21 21 21
32 19 22 24 20
21 22 19 22
21 21 19
33
48 79 78 54 31 28 21
33 34 33 33
47 33 42 41 32
34 35 30 35
35 34 29
52
74 104 99 70 44 39 28
50 55 52 52
62 54 63 62 51
53 53 50 54
54 53 48
68
92 121
115 82 51 47 35
66 70 68 68
73 73 75 77 66
70 68 66 70
70 69 64
103
134 168 156
111 79 71 49
100 106 105 101
112 115
120 117
98
104 110
98 103
107 100 104
316
263 316 270 172 124 161
112
263 294 282 316
246 294 168 270 316
238 316 282 208
294 316 238
N SE
Source
= Sample size = Standard error
US EPA analysis of 1994ndash1996 1998 CSFII
Table 12-15 Per Capita Intake of Individual Grain Products Based on 1994ndash1996 1998 CSFII (gkg-day edible portion uncooked weight)
Cereal Rice Population Group
N Percent Consuming Mean SE
Percent Consuming Mean SE
Whole Population Age Group
Birth to 1 year 1 to 2 years 3 to 5 years 6 to 12 years
13 to 19 years 20 to 49 years ge50 years Season Fall Spring Summer Winter Race Asian Pacific Islander Black American Indian Alaskan Native OtherNA White Region Midwest Northeast South West Urbanization Central City Suburban
Non-metropolitan
20607
1486 2096 4391 2089 1222 4677 4646
4687 5308 5890 4722
557 2740
177 1638 15495
4822 3692 7208 4885
6164 9598 4845
996
746 998 1000 1000 1000
999 1000
996 996 995 996
985 995 997 989 997
997 997 996 994
996 995 997
37
40 84 87 62 41 31 22
37 38 38 37
44 38 42 43 37
39 37 36 38
38 38 35
003
014 008 007 006 006 004 002
006 007 006 005
020 012 015 012 004
009 006 004 009
006 005 006
865
602 864 879 880 858 883 845
851 871 869 871
966 863 926 859 862
882 872 850 867
872 866 856
03
07 06 05 04 03 03 02
03 03 03 03
17 03 03 06 02
02 03 02 04
04 03 02
001
004 003 003 002 002 001 001
002 002 002 002
019 002 010 008 001
002 003 001 003
002 002 001
N SE
Source
= Sample size = Standard error
US EPA analysis of 1994ndash1996 1998 CSFII
Exposure Factors Handbook
Chapter 12mdashIntake of Grain Products
Page Exposure Factors Handbook 12-24 September 2011
Exposure Factors Handbook
Chapter 12mdashIntake of Grain Products
Table 12-16 Consumer-Only Intake of Individual Grain Products Based on 1994ndash1996 1998 CSFII (gkg-day edible portion uncooked weight )
Population Group N Cereal
Mean SE N Rice
Mean SE Whole Population 20227 38 003 17481 03 001 Age Group
Birth to 1 year 1116 54 016 900 12 007 1 to 2 years 2092 84 008 1819 07 004 3 to 5 years 4389 87 007 3869 06 003 6 to 12 years 2089 62 006 1847 04 002 13 to 19 years 1222 41 006 1038 03 003 20 to 49 years 4674 31 004 4102 03 001 ge50 years 4645 22 002 3906 02 001
Season Fall 4598 37 006 3957 03 002 Spring 5213 38 007 4530 03 002 Summer 5768 38 006 4989 03 002 Winter 4648 37 006 4005 03 002
Race Asian Pacific Islander 529 45 020 513 18 019 Black 2683 38 012 2346 04 002 American Indian Alaskan Native 175 43 015 151 03 010 OtherNA 1579 44 013 1375 07 008 White 15261 37 004 13096 02 001
Region Midwest 4759 39 009 4186 02 002 Northeast 3639 37 006 3152 04 004 South 7081 36 004 6029 03 001 West 4748 39 009 4114 05 003
Urbanization Central City 6039 38 006 5303 05 003 Suburban 9410 38 005 8105 03 002 Non-metropolitan 4778 36 006 4073 02 002
N = Sample size SE = Standard error
Source US EPA analysis of 1994ndash1996 1998 CSFII
Exposure Factors Handbook Page September 2011 12-25
Table 12-17 Per Capita Intake of Breads a Based on 1994ndash1996 1998 CSFII (gkg-day as-consumed)
Population Group Percent Consuming Mean
Percentile SE 1st 5th 10th 25th 50th 75th 90th 95th 99th Max
Whole Population Age Group lt5 months 6 to 12 months lt1 year 1 to 2 years 3 to 5 years 6 to 11 years 12 to 19 years 20 to 39 years 40 to 69 years ge70 years Season Fall Spring Summer Winter Race Asian Black American IndianAlaska Native OtherNA White Region Midwest Northeast South West Urbanization Central City Suburban Non-metropolitan
872
09 302 146 772 865 871 862 881 900 916
874 871 873 869
691 831 822 804 890
891 883 875 837
856 877 885
11
00 05 03 20 23 17 11 09 09 09
11 11 11 11
08 11 14 12 11
12 11 11 11
11 11 11
001
008 016 011 006 005 004 003 002 001 002
002 002 002 002
006 003 018 004 001
002 002 002 002
002 001 002
00
00 00 00 00 00 00 00 00 00 00
00 00 00 00
00 00 00 00 00
00 00 00 00
00 00 00
00
00 00 00 00 00 00 00 00 00 00
00 00 00 00
00 00 00 00 00
00 00 00 00
00 00 00
00
00 00 00 00 00 00 00 00 00 02
00 00 00 00
00 00 00 00 00
00 00 00 00
00 00 00
04
00 00 00 04 09 07 04 04 04 04
04 04 04 04
00 03 03 03 04
04 04 04 03
04 04 04
09
00 00 00 14 20 14 09 08 08 08
09 09 09 08
04 07 09 09 09
09 09 09 08
08 09 09
15
00 05 00 29 33 24 15 13 13 13
15 15 15 14
12 14 17 16 15
15 15 15 14
14 15 15
23
00 18 08 44 47 35 23 20 19 19
24 23 24 23
19 23 36 27 23
25 23 23 24
23 24 23
31
00 30 17 60 58 43 28 25 23 23
31 31 31 31
29 33 41 34 30
33 29 31 32
31 31 31
51
00 48 46 85 87 67 40 39 35 29
49 51 52 51
45 63 62 56 49
57 45 49 51
51 50 50
200
18 73 73 200 132
113 75 62 84 43
146 116
171 200
146 116
200 75 171
120 98 171 200
132 146 200
a SE
Source
Includes breads rolls muffins bagels biscuits cornbread and tortillas = Standard error
US EPA analysis of the 1994ndash1996 CSFII
Exposure F
actors Handbook
Chapter 12mdash
Intake of Grain Products
Page E
xposure Factors H
andbook 12-26
September 2011
Table 12-18 Per Capita Intake of Sweets a Based on 1994ndash1996 1998 CSFII (gkg-day as-consumed)
Population Group Percent Consuming
Percentile Mean SE 1st 5th 10th 25th 50th 75th 90th 95th 99th Max
Whole Population Age Group lt5 months 6 to 12 months lt1 year 1 to 2 years 3 to 5 years 6 to 11 years 12 to 19 years 20 to 39 years 40 to 69 years ge70 years Season Fall Spring Summer Winter Race Asian Black American IndianAlaska Native OtherNA White Region Midwest Northeast South West Urbanization Central City Suburban Non-metropolitan
526
25 230 121 532 621 642 543 472 529 586
537 522 500 545
402 414 353 350 563
601 554 491 477
512 546 505
06
00 03 02 12 13 12 06 04 05 05
06 06 05 06
04 05 04 04 06
07 06 06 05
06 06 06
001
004 014 010 007 006 006 003 002 002 003
003 002 002 003
008 004 011 005 001
003 003 002 002
002 002 003
00
00 00 00 00 00 00 00 00 00 00
00 00 00 00
00 00 00 00 00
00 00 00 00
00 00 00
00
00 00 00 00 00 00 00 00 00 00
00 00 00 00
00 00 00 00 00
00 00 00 00
00 00 00
00
00 00 00 00 00 00 00 00 00 00
00 00 00 00
00 00 00 00 00
00 00 00 00
00 00 00
00
00 00 00 00 00 00 00 00 00 00
00 00 00 00
00 00 00 00 00
00 00 00 00
00 00 00
01
00 00 00 03 08 06 02 00 01 02
02 01 00 02
00 00 00 00 02
03 02 00 00
01 02 01
08
00 00 00 17 19 17 10 06 07 08
09 08 07 09
06 06 03 05 09
10 09 08 07
08 09 08
18
00 11 04 35 36 32 18 14 13 16
18 18 16 19
14 15 17 13 18
20 17 17 16
16 18 18
25
00 20 10 48 46 39 24 19 19 21
25 26 23 26
20 23 21 19 25
29 25 23 23
23 26 25
46
04 36 36 72 88 67 37 32 32 36
47 47 41 48
31 47 28 41 47
53 48 44 38
46 45 51
220
06 64 64 193 220 209 107
111 73 57
209 220 182 123
157 193
29 70 220
220 127 209 157
209 127 220
a SE
Source
Includes breakfast foods made with grains such as pancakes waffles and French toast = Standard error
US EPA analysis of the 1994ndash1996 CSFII
Exposure F
actors Handbook
Chapter 12mdash
Intake of Grain Products
Exposure F
actors Handbook
Page Septem
ber 2011 12-27
Table 12-19 Per Capita Intake of Snacks Containing Grains a Based on 1994ndash1996 1998 CSFII (gkg-day as-consumed)
Population Group Percent Consuming
Percentile Mean SE 1st 5th 10th 25th 50th 75th 90th 95th 99th Max
Whole Population Age Group lt5 months 6 to 12 months lt1 year 1 to 2 years 3 to 5 years 6 to 11 years 12 to 19 years 20 to 39 years 40 to 69 years ge70 years Season Fall Spring Summer Winter Race Asian Black American IndianAlaska Native OtherNA White Region Midwest Northeast South West Urbanization Central City Suburban Non-metropolitan
431
10 290 141 581 567 513 450 411 411 377
423 436 406 458
241 295 383 284 471
492 419 411 407
401 446 441
02
00 03 01 07 07 05 03 02 01 01
02 03 02 03
01 02 02 02 03
03 02 02 02
02 03 02
001
011 008 006 004 004 003 002 001 001 001
001 001 001 002
004 002 008 003 001
001 002 001 002
001 001 001
00
00 00 00 00 00 00 00 00 00 00
00 00 00 00
00 00 00 00 00
00 00 00 00
00 00 00
00
00 00 00 00 00 00 00 00 00 00
00 00 00 00
00 00 00 00 00
00 00 00 00
00 00 00
00
00 00 00 00 00 00 00 00 00 00
00 00 00 00
00 00 00 00 00
00 00 00 00
00 00 00
00
00 00 00 00 00 00 00 00 00 00
00 00 00 00
00 00 00 00 00
00 00 00 00
00 00 00
00
00 00 00 04 03 01 00 00 00 00
00 00 00 00
00 00 00 00 00
00 00 00 00
00 00 00
03
00 02 00 11 09 06 04 02 02 01
03 03 02 03
00 01 02 01 03
03 02 02 02
02 03 03
07
00 09 06 20 18 13 09 06 05 03
07 08 07 08
04 05 06 05 08
08 07 07 07
07 07 07
12
00 22 09 28 32 19 14 09 07 05
10 13 10 13
10 09 11 08 12
12 12 11 12
11 12 11
26
01 25 22 50 59 46 24 18 14 08
23 29 23 29
23 21 32 24 27
27 27 24 26
26 27 23
91
37 28 37 89 91 73 51 55 56 18
80 89 71 91
44 74 49 87 91
89 91 80 87
78 91 81
a SE
Source
Includes grain snacks such as crackers salty snacks popcorn and pretzels = Standard error
US EPA analysis of the 1994ndash1996 CSFII
Exposure F
actors Handbook
Chapter 12mdash
Intake of Grain Products
Page E
xposure Factors H
andbook 12-28
September 2011
Table 12-20 Per Capita Intake of Breakfast Foods a Based on 1994ndash1996 1998 CSFII (gkg-day as-consumed)
Population Group Percent Consuming
Percentile Mean SE 1st 5th 10th 25th 50th 75th 90th 95th 99th
Max
Whole Population Age Group lt5 months 6 to 12 months lt1 year 1 to 2 years 3 to 5 years 6 to 11 years 12 to 19 years 20 to 39 years 40 to 69 years ge70 years Season Fall Spring Summer Winter Race Asian Black American IndianAlaska Native OtherNA White Region Midwest Northeast South West Urbanization Central City Suburban Non-metropolitan
118
00 42 20 204 208 237 130
89 95 104
116 116
128 113
59 127
88 102 120
121 127 107 124
120 122 107
01
00 01 01 04 04 04 01 01 01 01
01 01 01 01
01 01 01 01 01
01 01 01 02
01 01 01
001
000 024 016 007 006 005 003 002 001 002
002 002 002 002
007 003 008 005 001
002 003 002 002
002 002 002
00
00 00 00 00 00 00 00 00 00 00
00 00 00 00
00 00 00 00 00
00 00 00 00
00 00 00
00
00 00 00 00 00 00 00 00 00 00
00 00 00 00
00 00 00 00 00
00 00 00 00
00 00 00
00
00 00 00 00 00 00 00 00 00 00
00 00 00 00
00 00 00 00 00
00 00 00 00
00 00 00
00
00 00 00 00 00 00 00 00 00 00
00 00 00 00
00 00 00 00 00
00 00 00 00
00 00 00
00
00 00 00 00 00 00 00 00 00 00
00 00 00 00
00 00 00 00 00
00 00 00 00
00 00 00
00
00 00 00 00 00 00 00 00 00 00
00 00 00 00
00 00 00 00 00
00 00 00 00
00 00 00
04
00 00 00 19 16 15 05 00 00 01
04 04 05 03
00 04 00 00 04
04 05 02 05
04 05 03
10
00 00 00 27 25 22 09 06 06 07
10 10 10 09
06 12 03 09 10
11 12 08 10
10 10 09
24
00 41 27 48 45 34 23 15 14 12
23 23 24 26
20 21 12 26 24
26 23 22 26
25 24 22
136
00 41 41 136
80 65 39 30 38 35
136
64 60 80
28 67 12 80 136
67 80 78 136
136
78 64
a SE
Source
Includes breakfast food made with grains such as pancakes waffles and French toast = Standard error
US EPA analysis of the 1994ndash1996 CSFII
Exposure F
actors Handbook
Chapter 12mdash
Intake of Grain Products
Exposure F
actors Handbook
Page Septem
ber 2011 12-29
Table 12-21 Per Capita Intake of Pasta Based on 1994ndash1996 1998 CSFII (gkg-day as-consumed) Population Group
Percent
Consuming Percentile
Mean SE 1st 5th 10th 25th 50th 75th 90th 95th 99th Max Whole Population
Age Group lt5 months 6 to 12 months lt1 year 1 to 2 years 3 to 5 years 6 to 11 years 12 to 19 years 20 to 39 years 40 to 69 years ge70 years Season Fall Spring Summer Winter Race Asian Black American IndianAlaska Native OtherNA White Region Midwest Northeast South West Urbanization Central City Suburban Non-metropolitan
130
00 75 35 160 128 134
117 139 137 90
136 132 126 126
194 70 18 96 141
121 201 95 132
134 140 103
03
00 01 01 08 06 05 03 03 02 02
03 03 03 03
05 02 01 02 03
03 05 02 03
03 03 02
002
000 022 015 015 013 012 009 004 003 006
005 005 005 006
017 010 023 009 003
005 005 005 005
005 003 005
00
00 00 00 00 00 00 00 00 00 00
00 00 00 00
00 00 00 00 00
00 00 00 00
00 00 00
00
00 00 00 00 00 00 00 00 00 00
00 00 00 00
00 00 00 00 00
00 00 00 00
00 00 00
00
00 00 00 00 00 00 00 00 00 00
00 00 00 00
00 00 00 00 00
00 00 00 00
00 00 00
00
00 00 00 00 00 00 00 00 00 00
00 00 00 00
00 00 00 00 00
00 00 00 00
00 00 00
00
00 00 00 00 00 00 00 00 00 00
00 00 00 00
00 00 00 00 00
00 00 00 00
00 00 00
00
00 00 00 00 00 00 00 00 00 00
00 00 00 00
00 00 00 00 00
00 00 00 00
00 00 00
10
00 00 00 34 21 20 08 11 10 00
12 11 09 08
20 00 00 00 11
08 19 00 09
12 12 01
22
00 10 00 62 44 38 21 22 19 13
24 23 21 21
33 17 00 20 23
21 28 18 22
25 22 15
51
00 33 23 106
84 75 42 41 36 29
47 58 52 51
66 36 24 35 53
52 59 44 57
53 53 42
291
00 67 67 167 143
119 291
112 118
77
167 147 154 291
112 291
36 154 167
167 154 291 141
291 167 141
SE
Source
= Standard error
US EPA analysis of the 1994ndash1996 CSFII
Exposure F
actors Handbook
Chapter 12mdash
Intake of Grain Products
Page E
xposure Factors H
andbook 12-30
September 2011
Table 12-22 Per Capita Intake of Cooked Cereals Based on 1994ndash1996 1998 CSFII (gkg-day as-consumed)
Population Group Percent Consuming
Percentile Mean SE 1st 5th 10th 25th 50th 75th 90th 95th 99th Max
Whole Population Age Group lt5 months 6 to 12 months lt1 year 1 to 2 years 3 to 5 years 6 to 11 years 12 to 19 years 20 to 39 years 40 to 69 years ge70 years Season Fall Spring Summer Winter Race Asian Black American IndianAlaska Native OtherNA White Region Midwest Northeast South West Urbanization Central City Suburban Non-metropolitan
104
09 166
83 184 160
87 56 62
116 245
120
91 93
111
44 201
76 76 93
96 90 124
94
116 99 97
04
01 19 09 16 13 05 02 01 03 06
04 03 03 04
02 07 03 04 03
03 03 04 04
04 03 03
004
054 118 082 029 028 017 009 005 003 007
008 006 008 008
020 010 032 030 004
007 010 006 009
008 005 007
00
00 00 00 00 00 00 00 00 00 00
00 00 00 00
00 00 00 00 00
00 00 00 00
00 00 00
00
00 00 00 00 00 00 00 00 00 00
00 00 00 00
00 00 00 00 00
00 00 00 00
00 00 00
00
00 00 00 00 00 00 00 00 00 00
00 00 00 00
00 00 00 00 00
00 00 00 00
00 00 00
00
00 00 00 00 00 00 00 00 00 00
00 00 00 00
00 00 00 00 00
00 00 00 00
00 00 00
00
00 00 00 00 00 00 00 00 00 00
00 00 00 00
00 00 00 00 00
00 00 00 00
00 00 00
00
00 00 00 00 00 00 00 00 00 00
00 00 00 00
00 00 00 00 00
00 00 00 00
00 00 00
06
00 94 00 69 53 00 00 00 09 22
11 00 00 09
00 22 00 00 00
00 00 11 00
09 00 00
23
00 161
57 107
79 40 10 11 19 34
26 20 21 25
00 44 21 20 20
21 22 26 23
26 21 23
72
00 228 228 206 161
94 43 33 44 56
81 64 69 74
53 109
58 106
61
57 59 79 80
81 69 57
725
56 228 228 339 725 241 106
92 87 106
459 209 725 445
161 339 123 725 459
459 725 317 395
725 459 269
SE
Source
= Standard error
US EPA analysis of the 1994ndash1996 CSFII
Exposure F
actors Handbook
Chapter 12mdash
Intake of Grain Products
Exposure F
actors Handbook
Page Septem
ber 2011 12-31
Table 12-23 Per Capita Intake of Ready-to-Eat Cereals a Based on 1994ndash1996 1998 CSFII (gkg-day as-consumed)
Population Group Percent Consuming
Percentile Mean SE 1st 5th 10th 25th 50th 75th 90th 95th 99th Max
Whole Population Age
lt5 months 6 to 12 months lt1 year 1 to 2 years 3 to 5 years 6 to 11 years 12 to 19 years 20 to 39 years 40 to 69 years ge70 years Season Fall Spring Summer Winter Race Asian Black American IndianAlaska Native OtherNA White Region Midwest Northeast South West Urbanization Central City Suburban Non-metropolitan
397
00 199
93 649 698 640 457 305 318 479
391 401 396 399
254 340 331 333 417
422 423 374 384
400 412 358
03
00 01 01 10 11 08 04 02 02 02
03 03 03 03
02 03 03 03 03
04 04 03 03
03 04 03
001
000 007 005 004 004 003 002 001 001 001
002 002 002 002
005 002 009 004 001
002 002 001 002
001 001 001
00
00 00 00 00 00 00 00 00 00 00
00 00 00 00
00 00 00 00 00
00 00 00 00
00 00 00
00
00 00 00 00 00 00 00 00 00 00
00 00 00 00
00 00 00 00 00
00 00 00 00
00 00 00
00
00 00 00 00 00 00 00 00 00 00
00 00 00 00
00 00 00 00 00
00 00 00 00
00 00 00
00
00 00 00 00 00 00 00 00 00 00
00 00 00 00
00 00 00 00 00
00 00 00 00
00 00 00
00
00 00 00 07 09 06 00 00 00 00
00 00 00 00
00 00 00 00 00
00 00 00 00
00 00 00
04
00 00 00 15 17 12 06 03 02 04
04 04 04 05
01 04 04 03 05
05 05 04 04
05 05 04
10
00 03 00 25 26 20 11 07 06 07
11 10 11 10
08 10 08 11 11
11 11 10 11
11 11 08
15
00 10 03 33 33 25 15 10 09 09
16 15 16 14
12 15 14 17 15
16 16 13 16
15 16 12
29
00 18 17 49 48 40 22 17 14 15
29 29 30 27
27 32 26 30 28
29 29 28 31
28 31 26
101
00 26 26 88 101
80 64 53 52 27
88 77 78 101
49 101
44 66 88
80 80 101
88
101 80 88
a SE
Source
Includes dry ready-to-eat corn rice wheat and bran cereals in the form of flakes puffs etc = Standard error
US EPA analysis of the 1994ndash1996 CSFII
Exposure F
actors Handbook
Chapter 12mdash
Intake of Grain Products
Page E
xposure Factors H
andbook 12-32
September 2011
Table 12-24 Per Capita Intake of Baby Cereals Based on 1994ndash1996 1998 CSFII (gkg-day as-consumed)
Population Group Percent Consuming
Percentile Mean SE 1st 5th 10th 25th 50th 75th 90th 95th 99th Max
Whole Population Age
lt5 months 6 to 12 months lt1 year 1 to 2 years 3 to 5 years 6 to 11 years 12 to 19 years 20 to 39 years 40 to 69 years ge70 years Season Fall Spring Summer Winter Race Asian Black American IndianAlaska Native OtherNA White Region Midwest Northeast South West Urbanization Central City Suburban Non-metropolitan
10
408 678 534
62 03 01 00 00 01 00
09 12 08 11
07 10 06 17 10
11 12 09 09
11 11 08
00
08 25 16 02 00 00 00 00 00 00
00 00 00 00
00 00 00 01 00
00 00 00 00
00 00 00
003
024 045 027 010 006 000 000 000 000 000
007 005 006 006
004 012 004 020 003
008 004 005 006
006 004 006
00
00 00 00 00 00 00 00 00 00 00
00 00 00 00
00 00 00 00 00
00 00 00 00
00 00 00
00
00 00 00 00 00 00 00 00 00 00
00 00 00 00
00 00 00 00 00
00 00 00 00
00 00 00
00
00 00 00 00 00 00 00 00 00 00
00 00 00 00
00 00 00 00 00
00 00 00 00
00 00 00
00
00 00 00 00 00 00 00 00 00 00
00 00 00 00
00 00 00 00 00
00 00 00 00
00 00 00
00
00 08 02 00 00 00 00 00 00 00
00 00 00 00
00 00 00 00 00
00 00 00 00
00 00 00
00
10 28 17 00 00 00 00 00 00 00
00 00 00 00
00 00 00 00 00
00 00 00 00
00 00 00
00
24 69 41 00 00 00 00 00 00 00
00 00 00 00
00 00 00 00 00
00 00 00 00
00 00 00
00
31 113
73 08 00 00 00 00 00 00
00 00 00 00
00 00 00 00 00
00 00 00 00
00 00 00
01
88 211 197
58 00 00 00 00 00 00
00 06 00 03
00 00 00 12 00
03 05 00 00
03 01 00
376
266 376 376 125
38 01 00 00 03 00
211 266 260 376
21 376
09 266 260
211 125 376 266
376 211 260
SE
Source
= Standard error
US EPA analysis of the 1994ndash1996 CSFII
Exposure F
actors Handbook
Chapter 12mdash
Intake of Grain Products
Exposure F
actors Handbook
Page Septem
ber 2011 12-33
Table 12-25 Quantity (as-consumed) of Grain Products Consumed per Eating Occasion and the Percentage of Individuals Using These Foods in 2 Days
Indiv Using Quantity Consumed per Consumers Only Food at Least Eating Occasion Quantity Consumed per Eating Occasion at Specified Percentiles
Food Category Once in 2 days (grams) (grams) Average SE 5th 10th 25th 50th 75th 90th 95th
White bread 596 50 1 21 24 33 46 52 78 104 Whole grain and wheat bread 281 50 1 24 25 37 50 56 72 92 Rolls 480 58 1 27 33 43 48 70 89 110 Biscuits 109 61 1 19 19 35 57 76 104 139 Tortillas 155 60 1 14 21 32 48 79 107 135 Quick breads and muffins 125 82 2 21 28 52 60 94 142 187 Doughnuts and sweet rolls 124 77 1 26 36 47 65 93 133 164 Crackers 174 26 1 6 9 12 18 30 47 62 Cookies 307 40 1 9 12 20 31 50 75 96 Cake 162 92 3 22 28 41 77 116 181 217 Pie 85 150 3 52 72 102 143 168 246 300 Pancakes and waffles 103 85 3 21 35 42 75 109 158 205 Cooked cereal 103 248 6 81 117 157 233 291 455 484 Oatmeal 61 264 6 116 117 176 232 333 454 473 Ready-to-eat cereal 406 54 1 18 24 30 46 67 93 113 Corn flakes 81 46 1 17 22 25 37 56 75 100 Toasted oat rings 68 42 1 14 16 27 38 54 65 83 Rice 280 150 3 27 40 76 131 192 312 334 Pasta 360 162 3 26 43 73 133 210 318 420 Macaroni and cheese 85 244 9 53 81 121 191 324 477 556 Spaghetti with tomato sauce 80 436 15 122 124 246 371 494 740 983 Pizza 199 169 5 36 52 78 140 214 338 422 SE = Standard error
Source Smiciklas-Wright et al (2002) (based on 1994ndash1996 CSFII data)
Exposure F
actors Handbook
Chapter 12mdash
Intake of Grain Products
Page E
xposure Factors H
andbook 12-34
September 2011
Table 12-26 Quantity (as-consumed) of Grain Products Consumed per Eating Occasion and Percentage of Individuals Using These Foods in 2 Days by Sex and Age
Food Category
Quantity Consumed per Eating Occasion (grams) 2 to 5 years 6 to 11 years 12 to 19 years
Males and Females (N = 2109)
Males and Females Males (N = 1432) (N = 696)
Females (N = 702)
PC Mean SE PC Mean SE PC Mean SE PC Mean SE White bread
Whole grain and wheat bread Rolls Biscuits
Tortillas Quick breads and muffins
Doughnuts and sweet rolls Crackers
Cookies Cake
Pie Pancakes and waffles Cooked cereal
Oatmeal Ready-to-eat cereal Corn flakes Toasted oat rings Rice
Pasta Macaroni and cheese Spaghetti with tomato sauce
Pizza Corn chips
Popcorn
669 243 400
83 146
96 113
254 510 146
29 191 168 104 729
112 206 296 494 178 168 237 196
116
34 37 39 38 32 55 59 17 28 70 76 49
211 221
33 33 30 84 90 159 242
86 29 20
a
1 1 2 2 4 2 1 1 3 8 1
10 9 1 2 1 3 3 8 11 3 2 1
671 205 535
97 164
96 134 172 467 197
56 215
90 57 673 131 125 246 414 132
115 328 256 127
42 44 48 48 47 67 69 26 37 79
116 77 245 256
47 42 45 124 130 217 322 108
33 31
1 1 1 3 2 5 2 2 2 4 8 3
14 19
1 2 2 6 5
13 18
6 2 2
613 145 619 122 229
110 173 106 290 151
66 135
52 24 456 104
73 242 334
75 101 396 269
78
56 60 69 72 76 125 102
39 53 99 188
96 310b
348b
72 62 62 203 203 408 583 205
58 54
1 2 2 4 5
12 12
5 3 9
15 6
29b
45b
3 4 5
10 9
46 46 13
5 5
579 176 488 103 201
110 138 142 318 155
48 82 60 23 463
87 81 288 378 107
85 305 251 105
47 53 51 55 56 79 78 26 42 85
138b
74 256b
321b
52 49 42 157 155 260 479 143
44 37
1 2 1 4 3
10 5 3 2 8
12b
5 31b
40b
2 4 3
10 9
30 51
8 3 4
Exposure F
actors Handbook
Chapter 12mdash
Intake of Grain Products
Exposure F
actors Handbook
Page Septem
ber 2011 12-35
Exposure F
actors Handbook
Chapter 12mdash
Intake of Grain Products
Page E
xposure Factors H
andbook 12-36
September 2011
Table 12-26 Quantity (as-consumed) of Grain Products Consumed per Eating Occasion and Percentage of Individuals Using These Foods in 2 Days by Sex and Age (continued)
Food Category
Quantity Consumed per Eating Occasion (g) 20 to lt40 years 40 to lt60 years gt60 years
Males Females (N = 1543) (N = 1449)
Males Females (N = 1663) (N = 1694)
Males Females (N = 1545) (N = 1429)
PC Mean SE PC Mean SE PC Mean SE PC Mean SE PC Mean SE PC Mean SE White bread
Whole grain and wheat bread Rolls Biscuits
Tortillas Quick breads and muffins
Doughnuts and sweet rolls Crackers
Cookies Cake
Pie Pancakes and waffles Cooked cereal
Oatmeal Ready-to-eat cereal Corn flakes Toasted oat rings Rice
Pasta Macaroni and cheese
Spaghetti with tomato sauce Pizza
Corn chips Popcorn
630 253 620
115 206
80 133
119 208 135
58 80 52 27 269
65 42 308 371
78 86 237 162
81
63 63 73 73 79 93 94 36 56
113 161 126 313 360a
77 73 62 199 214 301 630 253
61 63
2 1 4 3 4 7 5 3 4 6 7
15 30 42a
3 6 4 9 8
19 48 12
5 6
549 252 464
94 201
113 112
156 265 149
72 74 73 37 347
53 54 321 371
78 78 202 179
97
47 48 53 55 53 79 68 28 39 94 150
80 219 258
55 43 42 139 155 235 385 150
35 35
1 1 1 2 2 5 2 2 2 7 9 6 11
17 1 2 2 6 6
19 22
6 2 2
597 328 479 134 134 157 134 166 276 165
118 75 97 60 298
59 48 294 343
61 55 130 128
96
59 57 65 80 67 93 88 30 47 108 162
117 300 332
68 49 46 167 208 302 543 220
47 50
2 1 1 3 3 7 4 1 2 6 6 8
16 16
2 3 2 5 7
31 59 13
4 4
553 323 434
112 127 149
110 175 290 168
99 80 103
62 297
52 41 288 347
60 54 145 120 109
46 46 52 56 52 72 72 24 36 83 151
74 243 242
51 40 35 130 140 210 386 147
33 39
1 2 1 2 2 4 4 1 1 4 8 5 11
10 1 3 2 4 5
12 18
8 2 3
593 398 378 130
42 174
114 256 297 192 164 108 209 136 446 124
43 231 279
71 50 53 48 61
51 48 54 58 47 86 65 23 40 85 154
99 255 257
53 37 36 147 167 230 450 187
30 52
1 1 1 3 4 5 2 1 2 4 7 5 8
10 1 2 3 6 7
13 22 18
3 4
548 431 306
98 54 183 104 259 322 183 133
82 202 129 440 104
49 214 279
65 45 47 53 76
41 41 43 48 41 72 56 17 30 87 137
68 216 224
41 30 27
118 132 215 379 109
21 34
1 1 1 3 2 4 2 1 1 7 5 4 8
10 1 1 2 5 5
18 33
8 2 3
a Indicates a SE value that is greater than 0 but less than 05 b Indicates a statistic that is potentially unreliable because of small sample size or large coefficient of variation N = Sample size
PC = Percent consuming at least once in 2 days SE = Standard error of the mean
Source Smiciklas-Wright et al (2002) (based on 1994ndash1996 CSFII data)
Exposure Factors Handbook
Chapter 12mdashIntake of Grain Products
Table 12-27 Consumption of Major Food Groups by Older Adults Median Daily Servings (and ranges) by Demographic and Health Characteristics
Subject Characteristic N Bread Cereal Rice and Pasta (servingsday) Sex a
Females 80 27 (09ndash65) Males 50 36 (14ndash73)
Ethnicity African American 44 33 (14ndash64) European American 47 32 (09ndash68) Native American 39 29 (11ndash73)
Age 70 to 74 years 42 33 (11ndash63) 75 to 79 years 36 30 (09ndash68) 80 to 84 years 36 32 (15ndash64) gt85 years 16 36 (16ndash73)
Marital Status Married 49 33 (11ndash58) Not Married 81 30 (09ndash73)
Education 8th grade or less 37 31 (11ndash73) 9th to 12th grades 47 33 (11ndash68) gtHigh School 46 32 (09ndash65)
Dentures Yes 83 33 (11ndash64) No 47 31 (09ndash73)
Chronic Diseases 0 7 41 (22ndash64) 1 31 33 (09ndash73) 2 56 31 (11ndash58) 3 26 37 (11ndash58) gt4 10 29 (14ndash53)
Weightb
le130 pounds 18 31 (11ndash54) 131 to 150 pounds 32 33 (09ndash52) 151 to 170 pounds 27 31 (14ndash73) 171 to 190 pounds 22 36 (14ndash62) ge191 pounds 29 30 (11ndash68)
a p lt 005 b 2 missing values N = Number of subjects
Source Vitolins et al (2002)
Exposure Factors Handbook Page September 2011 12-37
Exposure Factors Handbook
Chapter 12mdashIntake of Grain Products
Table 12-28 Characteristics of the Feeding Infant and Toddlers Study (FITS) Sample Population Sample Size Percentage of Sample
Sex Males Females
1549 1473
513 487
Age of Child 4 to 6 months 7 to 8 months 9 to 11 months 12 to 14 months 15 to 18 months 19 to 24 months
862 483 679 374 308 316
285 160 225 124 102 104
Childrsquos Ethnicity Hispanic or Latino Non-Hispanic or Latino Missing
367 2641
14
121 874 05
Childrsquos Race White Black Other
2417 225 380
800 74 126
Urbanicity Urban Suburban Rural Missing
1389 1014 577 42
460 336 191 13
Household Income Under $10000 $10000 to $14999 $15000 to $24999 $25000 to $34999 $35000 to $49999 $50000 to $74999 $75000 to $99999 $100000 and Over Missing
48 48
221 359 723 588 311 272 452
16 16 73 119 239 195 103 90 149
Receives WIC Yes No Missing
821 2196
5
272 726 02
Sample Size (Unweighted) 3022 1000 WIC = Special Supplemental Nutrition Program for Women Infants and Children
Source Devaney et al (2004)
Page Exposure Factors Handbook 12-38 September 2011
Table 12-29 Percentage of Infants and Toddlers Consuming Different Types of Grain Products Percentage of Infants and Toddlers Consuming at Least Once in a Day
Food GroupFood 4 to 6 7 to 8 9 to 11 12 to 14 15 to 18 19 to 24 Months Months Months Months Months Months
Any Grain or Grain Product 658 915 975 978 986 992 Infant Cereals 648 812 638 239 92 31 Non-infant Cerealsa 06 183 443 589 605 519
Not Pre-sweetened 05 170 370 445 406 319 Pre-sweetenedb 00 18 90 177 264 227
Breads and Rollsc 06 99 245 473 527 531 Crackers Pretzels Rice Cakes 30 162 334 452 464 447 Cereal or Granola Bars 00 11 34 98 100 97 Pancakes Waffles French Toast 01 08 75 151 161 154 Rice and Pastad 23 45 182 262 390 359 Other 02 01 27 28 25 45 Grains in Mixed Dishes 04 53 241 483 520 551 Sandwiches 00 11 86 215 258 258 Burrito Taco Enchilada Nachos 00 00 10 45 28 21 Macaroni and Cheese 02 16 49 146 150 150 Pizza 01 07 22 68 90 94 Pot PieHot Pocket 00 09 05 20 10 18 Spaghetti Ravioli Lasagna 01 18 99 153 121 88 a Includes both ready-to-eat and cooked cereals b Defined as cereals with more than 211 grams sugar per 100 grams c Does not include bread in sandwiches Sandwiches are included in mixed dishes d Does not include rice or pasta in mixed dishes
Source Fox et al (2004)
Exposure Factors Handbook
Chapter 12mdashIntake of Grain Products
Exposure Factors Handbook Page September 2011 12-39
Table 12-30
a Characteristics of Women Infants and Children (WIC) Participants and Non-Participants (percentages)
Infants 4 to 6 month Infants 7 to 11 month Toddlers 12 to 24 month WIC
Participant Non-Participant WIC
Participant Non-Participant WIC
Participant Non-Participant Sex Males 55 Females 45
Childrsquos Ethnicity Hispanic or Latino 20 Non-Hispanic or Latino 80
Childrsquos Race White 69 Black 15 Other 22
Child in Daycare Yes 39 No 61 Age of Mother 14 to 19 years 18 20 to 24 years 33 25 to 29 years 29 30 to 34 years 9 gt35 years 9 Missing 2
Motherrsquos Education 11th Grade or Less 23 Completed High School 35 Some Postsecondary 33 Completed College 7 Missing 2
Parentrsquos Marital Status Married 49 Not Married 50 Missing 1
Mother or Female Guardian Works Yes 46 No 53 Missing 1
54 46
b
11 89
b 84
4 11
38 62
b 1
13 29 33 23
2 b 2
19 26 53
1 b
93 7 1
51 48
1
55 45
24 76
63 17 20
34 66
13 38 23 15
11 1 15 42 32
9 2 57 42
1 45 54
1
51 49
b 8
92 b
86 5 9 b
46 54
b 1 11
30 36 21
1 b 2
20 27 51
0 b
93 7 0 b
60 40
0
57 43
22 78
67 13 20
43 57
9
33 29 18
11 0
17 42 31
9 1
58 41
1
55 45
0
52 48
b 10 89
b 84
5 11
c
53 47
b 1
14 26 34 26
1 b 3
19 28 48
2 b
88 11 1
c
61 38
1
Exposure Factors Handbook
Chapter 12mdashIntake of Grain Products
Page Exposure Factors Handbook 12-40 September 2011
c
Table 12-30 Characteristics of Women Infants and Children (WIC) Participants and Non-Participantsa
(percentages) (continued) Infants 4 to 6 months Infants 7 to 11 months Toddlers 12 to 24 months
WIC WIC WIC Participant Non-Participant Participant Non-Participant Participant Non-Participant
Urbanicity c c c
Urban 34 55 37 50 35 48 Suburban 36 31 31 34 35 35 Rural 28 13 30 15 28 16 Missing 2 1 2 1 2 2
Sample Size (Unweighted) 265 597 351 808 205 791 a χ2 tests were conducted to test for statistical significance in the differences between WIC participants and nonshy
participants within each age group for each variable The results of χ2 tests are listed next to the variable under the column labeled non-participants for each of the three age groups
b = p lt 005 non-participants significantly different from WIC participants on the variable = p lt 001 non-participants significantly different from WIC participants on the variable
WIC = Special Supplemental Nutrition Program for Women Infants and Children
Source Ponza et al (2004)
Table 12-31 Food Choices for Infants and Toddlers by Women Infants and Children (WIC) Participation Status
Infants 4 to 6 months Infants 7 to 11 months Toddlers 12 to 24 months WIC Non- WIC Non- WIC Non-
Participant Participant Participant Participant Participant Participant 697 Infant Cereals 697 625 747 135 92
Non-infant Cereals Total 09 05 217 385a 581 560
Not Pre-sweetened 05 05 187 329a 437 363 Pre-sweetened 00 00 40 69 177 241
Grains in Combination Foods 09 01 188 147 503 529 Sample Size (unweighted) 265 597 351 808 205 791 a = p lt 001 non-participants significantly different from WIC participants WIC = Special Supplemental Nutrition Program for Women Infants and Children
Source Ponza et al (2004)
Exposure Factors Handbook
Chapter 12mdashIntake of Grain Products
Exposure Factors Handbook Page September 2011 12-41
Table 12-32 Average Portion Sizes per Eating Occasion of Grain Products Commonly Consumed by Infants From the 2002 Feeding Infants and Toddlers Study
4 to 5 months 6 to 8 months 9 to 11 months Reference Food Group (N = 624) (N = 708) (N = 687) Unit Mean plusmn SE Infant cereal dry tablespoon 31 plusmn 014 45 plusmn 014 52 plusmn 018 Infant cereal jarred tablespoon - 56 plusmn 026 74 plusmn 034 Ready-to-eat cereal tablespoon - 23 plusmn 034 34 plusmn 021 Crackers ounce - 02 plusmn 002 03 plusmn 001 Crackers saltine - 22 plusmn 014 27 plusmn 012 Bread slice - 05 plusmn 010 08 plusmn 006 - = Cell size was too small to generate a reliable estimate N = Number of respondents SE = Standard error of the mean
Source Fox et al (2006)
Exposure Factors Handbook
Chapter 12mdashIntake of Grain Products
Table 12-33 Average Portion Sizes per Eating Occasion of Grain Products Commonly Consumed by Toddlers From the 2002 Feeding Infants and Toddlers Study
Food Group Reference Unit 12 to 14 months
(N = 371) 15 to 18 months
(N = 312) 19 to 24 months (N = 320)
Mean plusmn SE Bread slice 08 plusmn 004 09 plusmn 005 09 plusmn 005 Rolls ounce 09 plusmn 011 10 plusmn 010 09 plusmn 015 Ready-to-eat cereal cup 03 plusmn 002 05 plusmn 003 06 plusmn 004 Hot cereal prepared cup 06 plusmn 005 06 plusmn 005 07 plusmn 005 Crackers ounce 03 plusmn 002 04 plusmn 002 04 plusmn 002 Crackers saltine 33 plusmn 022 35 plusmn 022 37 plusmn 022 Pasta cup 04 plusmn 004 04 plusmn 004 05 plusmn 005 Rice cup 03 plusmn 004 04 plusmn 005 04 plusmn 005 Pancakes and waffles 1 (4-inch diameter) 10 plusmn 008 14 plusmn 021 14 plusmn 017 N = Number of respondents SE = Standard error of the mean
Source Fox et al (2006)
Page Exposure Factors Handbook 12-42 September 2011
c
Table 12-34 Percentage of Hispanic and Non-Hispanic Infants and Toddlers Consuming Different Types of Grain Products on a Given Day Age 4 to 5 months Age 6 to 11 months Age 12 to 24 months
Hispanic Non-Hispanic Hispanic Non-Hispanic Hispanic Non-Hispanic (N = 84) (N = 538) (N = 163) (N = 1228) (N = 124) (N = 871)
Any Grain or Grain Product Infant Cereal Non-infant Cereal Breadsb
Tortillas Crackers Pretzels Rice Cakes Pancakes Waffles French Toast Rice and Pastad
Rice Grains in Mixed Dishes
Sandwiches Burrito Taco Enchilada Nachos
565 552
-14c
14c
13c
------
569 565
----------
950 741 185a
182 40c
278 14c
201a
159e
159 40c
13c
935 736 292 151
-225 43
103 47
130 46 -
971 159 453 440 67a c
356 130 443
269a c
388a
242 21c
989 93
578 529 06c
469 160 329 130 544 249 30
Macaroni and Cheese - - 30c 31 101 155
Pizza - - - 14 10c e 97
Spaghetti Ravioli Lasagna - - 83c 46 93c 121 a = Significantly different from non-Hispanic at p lt 005 b Does not include bread in sandwiches Sandwiches are included in mixed dishes Includes tortillas also shown
separately = Statistic is potentially unreliable because of a high coefficient of variation
d Does not include rice or pasta in mixed dishes Includes rice (eg white brown wild and Spanish rice without meat) and pasta (eg spaghetti macaroni and egg noodles) Rice is also shown separately
e = Significantly different from non-Hispanic at p lt 001 - = Less than 1 of the group consumed this food on a given day N = Sample size
Source Mennella et al (2006)
Exposure Factors Handbook
Chapter 12mdashIntake of Grain Products
Exposure Factors Handbook Page September 2011 12-43
Exposure Factors Handbook
Chapter 12mdashIntake of Grain Products
Table 12-35 Mean Moisture Content of Selected Grain Products Expressed as Percentages of Edible Portions (grams per 100 grams of edible portion)
Food Moisture Content Comments Raw Cooked Barley―pearled 1009 6880 Corn―grain―endosperm 1037 -Corn―grain―bran 471 - crude Millet 867 7141 Oats 822 -Rice―white―long-grained 1162 6844 Rye 1095 -Rye―flour―medium 985 -Sorghum 920 -Wheat―hard white 957 -Wheat―germ 1112 - crude Wheat―bran 989 - crude Wheat―flour―whole grain 1027 -- Indicates that the grain product was not assessed for water content under these conditions
Source USDA (2007)
Page Exposure Factors Handbook 12-44 September 2011
- TABLE OF CONTENTS
- LIST OF TABLES
- 12 INTAKE OF GRAIN PRODUCTS
-
- 121 INTRODUCTION
- 122 RECOMMENDATIONS
- 123 INTAKE STUDIES
-
- 1231 Key Grain Intake Study
-
- 12311 US EPA Analysis of Consumption Data From 2003minus2006 National Health and Nutrition Examination Survey (NHANES)
-
- 1232 Relevant Grain Intake Studies
-
- 12321 USDA (1996a b 1993 1980)mdashFood and Nutrient Intakes of Individuals in 1 Day in the United States
- 12322 USDA (1999b)mdashFood Consumption Prices and Expenditures 1970minus1997
- 12323 USDA (1999a)mdashFood and Nutrient Intakes by Children 1994minus1996 1998 Table Set 17
- 12324 US EPA Analysis of Continuing Survey of Food Intake by Individuals (CSFII) 1994minus1996 1998
- 12325 Smiciklas-Wright et al (2002)mdashFoods Commonly Eaten in the United States Quantities Consumed per Eating Occasion and in a Day 1994minus1996
- 12326 Vitolins et al (2002)mdashQuality of Diets Consumed by Older Rural Adults
- 12327 Fox et al (2004)mdashFeeding Infants and Toddlers Study What Foods Are Infants and Toddlers Eating
- 12328 Ponza et al (2004)mdashNutrient Food Intakes and Food Choices of Infants and Toddlers Participating in WIC
- 12329 Fox et al (2006)mdashAverage Portion of Foods Commonly Eaten by Infants and Toddlers in the United States
- 123210 Mennella et al (2006)mdashFeeding Infants and Toddlers Study The Types of Foods Fed to Hispanic Infants and Toddlers
-
- 124 CONVERSION BETWEEN WET- AND DRY-WEIGHT INTAKE RATES
- 125 REFERENCES FOR CHAPTER 12
-

Exposure Factors Handbook
Chapter 12mdashIntake of Grain Products
This page intentionally left blank
Page Exposure Factors Handbook 12-iv September 2011
Exposure Factors Handbook
Chapter 12mdashIntake of Grain Products 12 INTAKE OF GRAIN PRODUCTS 121 INTRODUCTION
The American food supply is generally considered to be one of the safest in the world Nevertheless grain products may become contaminated with toxic chemicals by several different pathways Ambient air pollutants may be deposited on or absorbed by the plants or dissolved in rainfall or irrigation waters that contact the plants Pollutants may also be absorbed through plant roots from contaminated soil and ground water The addition of pesticides soil additives and fertilizers may also result in contamination of grain products To assess exposure through this pathway information on ingestion rates of grain products is needed
A variety of terms may be used to define intake of grain products (eg consumer-only intake per capita intake total grain intake as-consumed intake uncooked edible intake dry-weight intake) As described in Chapter 9 (Intake of Fruits and Vegetables) consumer-only intake is defined as the quantity of grain products consumed by individuals during the survey period These data are generated by averaging intake across only the individuals in the survey who consumed these food items Per capita intake rates are generated by averaging consumer-only intakes over the entire population (including those that reported no intake) In general per capita intake rates are appropriate for use in exposure assessments for which average dose estimates for individuals are of interest because they represent both individuals who ate the foods during the survey period and those who may eat the food items at some time but did not consume them during the survey period Per capita intake therefore represents an average across the entire population of interest but does so at the expense of underestimating consumption for the subset of the population that consumed the food in question Total grain intake refers to the sum of all grain products consumed in a day
Intake rates may be expressed on the basis of the as-consumed weight (eg cooked or prepared) or on the uncooked or unprepared weight As-consumed intake rates are based on the weight of the food in the form that it is consumed and should be used in assessments where the basis for the contaminant concentrations in foods is also indexed to the as-consumed weight Some of the food ingestion values provided in this chapter are expressed as as-consumed intake rates because this is the fashion in which data were reported by survey respondents Others are provided as uncooked weights based on analyses of survey data that account for weight
changes that occur during cooking This is of importance because concentration data to be used in the dose equation are often measured in uncooked food samples It should be recognized that cooking can either increase or decrease food weight Similarly cooking can increase the mass of contaminant in food (due to formation reactions or absorption from cooking oils or water) or decrease the mass of contaminant in food (due to vaporization fat loss or leaching) The combined effects of changes in weight and changes in contaminant mass can result in either an increase or decrease in contaminant concentration in cooked food Therefore if the as-consumed ingestion rate and the uncooked concentration are used in the dose equation dose may be under-estimated or over-estimated It is important for the assessor to be aware of these issues and choose intake rate data that best match the concentration data that are being used For more information on cooking losses and conversions necessary to account for such losses refer to Chapter 13 of this handbook
Sometimes contaminant concentrations in food are reported on a dry-weight basis When these data are used in an exposure assessment it is recommended that dry-weight intake rates also be used Dry-weight food concentrations and intake rates are based on the weight of the food consumed after the moisture content has been removed For information on converting the intake rates presented in this chapter to dry-weight intake rates refer to Section 124
The purpose of this chapter is to provide intake data for grain products for the general population The recommendations for ingestion rates of grain products are provided in the next section along with a summary of the confidence ratings for these recommendations The recommended values are based on the key study identified by US Environmental Protection Agency (EPA) for this factor Following the recommendations the key study on ingestion of grain products is summarized Relevant data on ingestion of grain products are also provided These data are presented to provide the reader with added perspective on the current state-ofshyknowledge pertaining to ingestion of grain products among children
122 RECOMMENDATIONS Table 12-1 presents a summary of the
recommended values for per capita and consumer-only intake of grain products Table 12-2 provides confidence ratings for the grain intake recommendations for the general population
Exposure Factors Handbook Page September 2011 12-1
Exposure Factors Handbook
Chapter 12mdashIntake of Grain Products The US EPA analysis of data from the
2003minus2006 National Health and Nutrition Examination Survey (NHANES) was used in selecting recommended intake rates The US EPA analysis was conducted using childhood age groups that differed slightly from US EPArsquos Guidance on Selecting Age Groups for Monitoring and Assessing Childhood Exposures to Environmental Contaminants (US EPA 2005) However for the purposes of the recommendations presented here data were placed in the standardized age categories closest to those used in the analysis
The NHANES data on which the recommendations are based are short-term survey data and may not necessarily reflect the long-term
distribution of average daily intake rates However because broad categories of food (ie total grains) are eaten on a daily basis throughout the year with minimal seasonality the short-term distribution may be a reasonable approximation of the long-term distribution although it will display somewhat increased variability This implies that the upper percentiles shown here will tend to overestimate the corresponding percentiles of the true long-term distribution In general the recommended values based on US EPArsquos analysis of NHANES data represent the uncooked weight of the edible portion of grain products
Table 12-1 Recommended Values for Intake of Grains Edible Portion Uncookeda
Age Group (years) Per Capita Consumers Only
Multiple Percentiles Source Mean 95th Percentile Mean 95th Percentile
gkg-day gkg-day gkg-day gkg-day Total Grains
Birth to 1 31 95b 41 103b
See Table 12-3 and Table 12-4
US EPA Analysis of
NHANES 2003ndash 2006
1 to lt2 64 124b 64 124b
2 to lt3 64 124b 64 124b
3 to lt6 62 111 62 111 6 to lt11 44 82 44 82 11 to lt16 24 50 24 50 16 to lt21 24 50 24 50 20 to lt50 22 46 22 46 gt50 17 35 17 35
Individual Grain ProductsmdashSee Table 12-5 and Table 12-6 a Analysis was conducted using slightly different childhood age groups than those recommended in Guidance on
Selecting Age Groups for Monitoring and Assessing Childhood Exposures to Environmental Contaminants (US EPA 2005) Data were placed in the standardized age categories closest to those used in the analysis
b Estimates are less statistically reliable based on guidance published in the Joint Policy on Variance Estimation and Statistical Reporting Standards on NHANES III and CSFII Reports NHISNCHS Analytical Working Group Recommendations (NCHS 1993)
Page Exposure Factors Handbook 12-2 September 2011
Exposure Factors Handbook
Chapter 12mdashIntake of Grain Products
Table 12-2 Confidence in Recommendations for Intake of Grain Products General Assessment Factors Rationale Rating Soundness
Adequacy of Approach
Minimal (or defined) Bias
The survey methodology and data analysis were adequate The survey sampled more than 16000 individuals An analysis of primary data was conducted
No physical measurements were taken The method relied on recent recall of grain products eaten
High
Applicability and Utility Exposure Factor of Interest
Representativeness
Currency
Data Collection Period
The key study was directly relevant to grain intake
The data were demographically representative of the US population (based on stratified random sample)
Data were collected between 2003 and 2006
Data were collected for two non-consecutive days
High
Clarity and Completeness Accessibility
Reproducibility
Quality Assurance
The NHANES data are publicly available
The methodology used was clearly described enough information was included to reproduce the results
NHANES follows strict QAQC procedures The US EPA analysis has only been reviewed internally but the methodology has been used in an analysis of previous data
High
Variability and Uncertainty Variability in Population
Minimal Uncertainty
Full distributions were provided for total grains Means were provided for individual grain products
Data collection was based on recall for a two-day period the accuracy of using these data to estimate long-term intake (especially at the upper percentiles) is uncertain However use of short-term data to estimate chronic ingestion can be assumed for broad categories of foods such as total grains Uncertainty is greater for individual grain products
Medium to high for averages low for long-term upper percentiles low for
individual foods
Evaluation and Review Peer Review
Number and Agreement of Studies
The NCHS NHANES survey received a high level of peer review The US EPA analysis of these data has not been peer reviewed outside the Agency but the methodology has been used in an analysis of previous data
There was one key study
Medium
Overall Rating Medium to High confidence in the averages Low confidence in the long-
term upper percentiles
Exposure Factors Handbook Page September 2011 12-3
Exposure Factors Handbook
Chapter 12mdashIntake of Grain Products 123 INTAKE STUDIES 1231 Key Grain Intake Study 12311 US EPA Analysis of Consumption Data
From 2003minus2006 National Health and Nutrition Examination Survey (NHANES)
The key source of recent information on consumption rates of grain products is the US Centers for Disease Control and Preventionrsquos National Center for Health Statisticsrsquo (NCHS) NHANES Data from NHANES 2003minus2006 have been used by the US EPA Office of Pesticide Programs (OPP) to generate per capita and consumer-only intake rates for both individual grain products and total grain products
NHANES is designed to assess the health and nutritional status of adults and children in the United States In 1999 the survey became a continuous program that interviews a nationally representative sample of approximately 7000 persons each year and examines a nationally representative sample of about 5000 persons each year located in counties across the country 15 of which are visited each year Data are released on a 2-year basis thus for example the 2003 data are combined with the 2004 data to produce NHANES 2003minus2004
The dietary interview component of NHANES is called What We Eat in America and is conducted by the US Department of Agriculture (USDA) and the US Department of Health and Human Services (DHHS) DHHSrsquo NCHS is responsible for the sample design and data collection and USDArsquos Food Surveys Research Group is responsible for the dietary data collection methodology maintenance of the databases used to code and process the data and data review and processing Beginning in 2003 2 non-consecutive days of 24-hour intake data were collected The first day was collected in-person and the second day was collected by telephone 3 to 10 days later These data were collected using USDArsquos dietary data collection instrument the Automated Multiple Pass Method This method provides an efficient and accurate means of collecting intakes for large-scale national surveys It is fully computerized and uses a five-step interview Details can be found at USDArsquos Agriculture Research Service (httpwwwarsusdagovbabhnrcfsrg)
For NHANES 2003minus2004 there were 12761 persons selected of these 9643 were considered respondents to the mobile examination center (MEC) examination and data collection However only 9034 of the MEC respondents provided complete dietary intakes for Day 1 Furthermore of those providing the Day 1 data only
8354 provided complete dietary intakes for Day 2 For NHANES 2005minus2006 there were 12862 persons selected of these 9950 were considered respondents to the MEC examination and data collection However only 9349 of the MEC respondents provided complete dietary intakes for Day 1 Furthermore of those providing the Day 1 data only 8429 provided complete dietary intakes for Day 2
The 2003minus2006 NHANES surveys are stratified multistage probability samples of the civilian non-institutionalized US population The sampling frame was organized using 2000 US population census estimates NHANES oversamples low income persons adolescents 12 to 19 years persons 60 years and older African Americans and Mexican Americans Several sets of sampling weights are available for use with the intake data By using appropriate weights data for all 4 years of the surveys can be combined Additional information on NHANES can be obtained at httpwwwcdcgovnchsnhaneshtm
In 2010 US EPA OPP used NHANES 2003minus2006 data to update the Food Commodity Intake Database (FCID) that was developed in earlier analyses of data from the USDArsquos Continuing Survey of Food Intake by Individuals (CSFII) (US EPA 2000 USDA 2000) (see Section 12324) NHANES data on the foods people reported eating were converted to the quantities of agricultural commodities eaten Agricultural commodity is a term used by US EPA to mean plant (or animal) parts consumed by humans as food when such items are raw or unprocessed they are referred to as raw agricultural commodities For example an apple pie may contain the commodities apples flour fat sugar and spices FCID contains approximately 558 unique commodity names and 8-digit codes The FCID commodity names and codes were selected and defined by US EPA and were based on the US EPA Food Commodity Vocabulary (httpwwwepagovpesticidesfoodfeed)
Intake rates were generated for a variety of food itemsgroups based on the agricultural commodities included in the FCID These intake rates represent intake of all forms of the product (eg both home produced and commercially produced) for individuals who provided data for two days of the survey Note that if the person reported consuming food for only one day their two-day average would be half the amount reported for the one day of consumption Individuals who did not provide information on body weight or for whom identifying information was unavailable were excluded from the analysis Two-day average intake rates were calculated for all individuals in the database for each of the food
Page Exposure Factors Handbook 12-4 September 2011
Exposure Factors Handbook
Chapter 12mdashIntake of Grain Products itemsgroups These average daily intake rates were divided by each individuals reported body weight to generate intake rates in units of grams per kilogram of body weight per day (gkg-day) The data were weighted according to the 4-year 2-day sample weights provided in NHANES 2003minus2006 to adjust the data for the sample population to reflect the national population
Summary statistics were generated on a consumer-only and on a per capita basis Summary statistics including number of observations percentage of the population consuming the grains being analyzed mean intake rate and standard error of the mean intake rate were calculated for total grains and selected individual grains Percentiles of the intake rate distribution (ie 1st 5th 10th 25th 50th 75th 90th 95th 99th and the maximum value) were also provided for total grains Data were provided for the following age groups birth to 1 year 1 to 2 years 3 to 5 years 6 to 12 years 13 to 19 years 20 to 49 years and ge50 years Data on females 13 to 49 years were also provided Because these data were developed for use in US EPArsquos pesticide registration program the childhood age groups used are slightly different than those recommended in US EPArsquos Guidance on Selecting Age Groups for Monitoring and Assessing Childhood Exposures to Environmental Contaminants (US EPA 2005)
Table 12-3 presents per capita intake data for total grains in gkg-day Table 12-4 provides consumer-only intake data for total grains in gkg-day Table 12-5 provides per capita intake data for individual grains in gkg-day and Table 12-6 provides consumer-only intake data for individual grains in gkg-day In general these data represent intake of the edible portions of ie uncooked foods
The results are presented in units of gkg-day Thus use of these data in calculating potential dose does not require the body-weight factor to be included in the denominator of the average daily dose (ADD) equation It should be noted that converting these intake rates into units of gday by multiplying by a single average body weight is inappropriate because individual intake rates were indexed to the reported body weights of the survey respondents Also it should be noted that the distribution of average daily intake rates generated using short-term data (eg 2-day) does not necessarily reflect the long-term distribution of average daily intake rates The distributions generated from short-term and long-term data will differ to the extent that each individualrsquos intake varies from day to day the distributions will be similar to the extent that individualsrsquo intakes are constant from day to day Day-to-day variation in intake among individuals will
be high for grains that are not typically eaten every day For these grains the intake distribution generated from short-term data will not be a good reflection of the long-term distribution On the other hand for broad categories of foods (eg total grains) that are eaten on a daily basis throughout the year the short-term distribution may be a reasonable approximation of the true long-term distribution although it will show somewhat more variability In this chapter distributions are provided for broad categories of grains (eg total grains) Because of the increased variability of the short-term distribution the short-term upper percentiles shown here may overestimate the corresponding percentiles of the long-term distribution For individual foods only the mean standard error and percent consuming are provided An advantage of using the US EPArsquos analysis of NHANES data is that it provides distributions of intake rates for various age groups of children and adults normalized by body weight The data set was designed to be representative of the US population and includes 4 years of intake data combined Another advantage is the currency of the data the NHANES data are from 2003minus2006 However short-term dietary data may not accurately reflect long-term eating patterns and may under-represent infrequent consumers of a given food This is particularly true for the tails (extremes) of the distribution of food intake Because these are 2-day averages consumption estimates at the upper end of the intake distribution may be underestimated if these consumption values are used to assess acute (ie short-term) exposures Also the analysis was conducted using slightly different childhood age groups than those recommended in US EPArsquos Guidance on Selecting Age Groups for Monitoring and Assessing Childhood Exposures to Environmental Contaminants (US EPA 2005) However given the similarities in the age groups used the data should provide suitable intake estimates for the age groups of interest
1232 Relevant Grain Intake Studies 12321 USDA (1996a b 1993 1980)mdashFood and
Nutrient Intakes of Individuals in 1 Day in the United States
USDA calculated mean per capita intake rates for total and individual grain products using Nationwide Food Consumption Survey (NFCS) data from 1977minus1978 and 1987minus1988 (USDA 1993 1980) and CSFII data from 1994 and 1995 (USDA 1996a b) The mean per capita intake rates for grain products are presented in Table 12-7 and Table 12-8 for the two NFCS survey years respectively Table 12-9
Exposure Factors Handbook Page September 2011 12-5
Exposure Factors Handbook
Chapter 12mdashIntake of Grain Products presents similar data from the 1994 and 1995 CSFII for grain products
The advantages of using these data are that they provide mean intake estimates for various grain products The consumption estimates are based on short-term (ie 1-day) dietary data which may not reflect long-term consumption These data are based on older surveys and may not be entirely representative of current eating patterns
12322 USDA (1999b)mdashFood Consumption Prices and Expenditures 1970minus1997
The USDAs Economic Research Service calculates the amount of food available for human consumption in the United States annually Supply and utilization balance sheets are generated These are based on the flow of food items from production to end uses Total available supply is estimated as the sum of production (ie some products are measured at the farm level or during processing) starting inventories and imports (USDA 1999b) The availability of food for human use commonly termed as food disappearance is determined by subtracting exported foods products used in industries farm inputs (seed and feed) and end-of-the-year inventories from the total available supply (USDA 1999b) USDA (1999b) calculates the per capita food consumption by dividing the total food disappearance by the total US population
USDA (1999b) estimated per capita consumption data for grain products from 1970minus1997 In this section the 1997 values which are the most recent final data are presented Table 12-10 presents per capita consumption in 1997 for grains
An advantage of this study is that it provides per capita consumption rates for grains that are representative of long-term intake because disappearance data are generated annually Daily per capita intake rates are generated by dividing annual consumption by 365 daysyear One of the limitations of this study is that disappearance data do not account for losses from the food supply from waste spoilage or foods fed to pets Thus intake rates based on these data may overestimate daily consumption because they are based on the total quantity of marketable commodity utilized Therefore these data may be useful for estimating bounding exposure estimates It should also be noted that per capita estimates based on food disappearance are not a direct measure of actual consumption or quantity ingested instead the data are used as indicators of changes in usage over time (USDA 1999b) These data are based on older surveys and may not be entirely representative of current consumption patterns
12323 USDA (1999a)mdashFood and Nutrient Intakes by Children 1994minus1996 1998 Table Set 17
USDA (1999a) calculated national probability estimates of food and nutrient intake by children based on 4 years of the CSFII (1994minus1996 and 1998) for children age 9 years and under and on CSFII 1994minus1996 only for individuals age 10 years and over The CSFII was a series of surveys designed to measure the kinds and amounts of foods eaten by Americans Intake data based on 24-hour dietary recall were collected through in-person interviews on 2 non-consecutive days Section 12324 provides additional information on these surveys
USDA used sample weights to adjust for non-response to match the sample to the US population in terms of demographic characteristics and to equalize intakes over the four quarters of the year and the 7 days of the week A total of 503 breast-fed children were excluded from the estimates but both consumers and non-consumers were included in the analysis
USDA (1999a) provided data on the mean per capita quantities (grams) of various food productsgroups consumed per individual for 1 day and the percent of individuals consuming those foods in 1 day of the survey Table 12-11 and Table 12-12 present data on the mean quantities (grams) of grain products consumed per individual for 1 day and the percentage of survey individuals consuming grain products that survey day Data on mean intakes or mean percentages are based on respondentsrsquo Day-1 intakes
The advantage of the USDA (1999a) study is that it uses the 1994minus1996 1998 CSFII data set which includes 4 years of intake data combined and includes the supplemental data on children These data are expected to be generally representative of the US population and they include data on a wide variety of grain products The data set is one of a series of USDA data sets that are publicly available One limitation of this data set is that it is based on 1-day and short-term dietary data may not accurately reflect long-term eating patterns Other limitations of this study are that it only provides mean values of food intake rates consumption is not normalized by body weight and presentation of results is not consistent with US EPArsquos recommended age groups These data are based on older surveys and may not be entirely representative of current eating patterns
Page Exposure Factors Handbook 12-6 September 2011
Exposure Factors Handbook
Chapter 12mdashIntake of Grain Products 12324 US EPA Analysis of Continuing Survey
of Food Intake by Individuals (CSFII) 1994minus1996 1998
US EPAOPP in cooperation with USDArsquos Agricultural Research Service used data from the 1994minus1996 1998 CSFII to develop the FCID (US EPA 2000 USDA 2000) as described in Section 12311 The CSFII 1994minus1996 was conducted between January 1994 and January 1997 with a target population of non-institutionalized individuals in all 50 states and Washington DC In each of the three survey years data were collected for a nationally representative sample of individuals of all ages The CSFII 1998 was conducted between December 1997 and December 1998 and surveyed children 9 years of age and younger It used the same sample design as the CSFII 1994minus1996 and was intended to be merged with CSFII 1994minus1996 to increase the sample size for children The merged surveys are designated as CSFII 1994minus1996 1998 (USDA 2000) Additional information on the CSFII can be obtained at httpwwwarsusdagov Servicesdocshtmdocid=14531
The CSFII 1994minus1996 1998 collected dietary intake data through in-person interviews on two non-consecutive days The data were based on 24-hour recall A total of 21662 individuals provided data for the first day of those individuals 20607 provided data for a second day The 2-day response rate for the 1994minus1996 CSFII was approximately 76 The 2-day response rate for CSFII 1998 was 82 The CSFII 1994minus1996 1998 surveys were based on a complex multistage area probability sample design The sampling frame was organized using 1990 US population census estimates and the stratification plan took into account geographic location degree of urbanization and socioeconomic characteristics Several sets of sampling weights are available for use with the intake data By using appropriate weights data for all 4 years of the surveys can be combined USDA recommends that all four years be combined in order to provide an adequate sample size for children
The grain itemsgroups selected for the US EPA analysis included total grains and individual grain products such as cereal and rice US EPA (2003) presents the food codes and definitions used to determine the various grain products used in the analysis CSFII data on the foods people reported eating were converted to the quantities of agricultural commodities eaten Intake rates for these food itemsgroups and summary statistics were generated on both a per capita and a consumer-only basis using the same general methodology as in the US EPA
analysis of 2003minus2006 NHANES data as described in Section 12311 Because these data were developed for use in US EPArsquos pesticide registration program the childhood age groups used are slightly different than those recommended in US EPArsquos Guidance on Selecting Age Groups for Monitoring and Assessing Childhood Exposures to Environmental Contaminants (US EPA 2005)
Table 12-13 presents per capita intake data for total grains in gkg-day Table 12-14 provides consumer-only intake data for total grains in gkg-day Table 12-15 provides per capita intake data for individual grain products and Table 12-16 provides consumer-only intake data for individual grain products In general these data represent intake of the edible portions of unprepared (ie uncooked) foods Table 12-17 through Table 12-24 present per capita intake data for individual grain products The data come from CSFII 1994minus1996 only The results are presented in units of gkg-day These data represent as-consumed intake rates
The results are presented in units of gkg-day Thus use of these data in calculating potential dose does not require the body-weight factor to be included in the denominator of the ADD equation The cautions concerning converting these intake rates into units of gday by multiplying by a single average body weight and the discussion of the use of short term data in the NHANES description in Section 12311 apply to the CSFII estimates as well
A strength of US EPArsquos analysis is that it provides distributions of intake rates for various age groups of individuals normalized by body weight The analysis uses the 1994minus1996 1998 CSFII data set which was designed to be representative of the US population Also the data set includes 4 years of intake data combined and is based on a 2-day survey period However as discussed above short-term dietary data may not accurately reflect long-term eating patterns and may under-represent infrequent consumers of a given food This is particularly true for the tails (extremes) of the distribution of food intake Also the analysis was conducted using slightly different childhood age groups than those recommended in US EPArsquos Guidance on Selecting Age Groups for Monitoring and Assessing Childhood Exposures to Environmental Contaminants (US EPA 2005) However given the similarities in the childhood age groups used the data should provide suitable intake estimates for the age groups of interest While the CSFII data are older than the NHANES data they provide relevant information on consumption by season region of the United States
Exposure Factors Handbook Page September 2011 12-7
Exposure Factors Handbook
Chapter 12mdashIntake of Grain Products and urbanization breakdowns that are not available in the publically released NHANES data
12325 Smiciklas-Wright et al (2002)mdashFoods Commonly Eaten in the United States Quantities Consumed per Eating Occasion and in a Day 1994minus1996
Using data gathered in the 1994minus1996 USDA CSFII Smiciklas-Wright et al (2002) calculated distributions for the quantities of grain products consumed per eating occasion by members of the US population (ie serving sizes) The estimates of serving size are based on data obtained from 14262 respondents ages two and above who provided two days of dietary intake information Only dietary intake data from users of the specified food were used in the analysis (ie consumer-only data) Table 12-25 presents as-consumed the quantity of grain products consumed per eating occasion and the percentage of individuals using these foods in a 2-day period for a selected variety of grain products Table 12-26 presents the same data by sex and age
These data are presented on an as-consumed basis (grams) and represent the quantity of grain products consumed per eating occasion These estimates may be useful for assessing acute exposures to contaminants in specific foods or other assessments where the amount consumed per eating occasion is necessary Only the mean and standard deviation serving size data and percent of the population consuming the food during the 2-day survey period are presented in this handbook Percentiles of serving sizes of the foods consumed by these age groups of the US population can be found in Smiciklas-Wright et al (2002)
The advantages of using these data are that they were derived from the USDA CSFII and are representative of the US population The analysis conducted by Smiciklas-Wright et al (2002) accounted for individual foods consumed as ingredients of mixed foods Mixed foods were disaggregated via recipe files so that the individual ingredients could be grouped together with similar foods that were reported separately Thus weights of foods consumed as ingredients were combined with weights of foods reported separately to provide a more thorough representation of consumption However it should be noted that since the recipes for the mixed foods consumed were not provided by the respondents standard recipes were used As a result the estimates of quantity consumed for some food types are based on assumptions about the types and quantities of ingredients consumed as part of mixed
foods This study used data from the 1994 to 1996 CSFII data from the 1998 childrenrsquos supplement were not included
12326 Vitolins et al (2002)mdashQuality of Diets Consumed by Older Rural Adults
Vitolins et al (2002) conducted a survey to evaluate the dietary intake by food groups of older (gt70 years) rural adults The sample consisted of 130 community dwelling residents from two rural counties in North Carolina Data on dietary intake over the preceding year were obtained in face-to-face interviews conducted in participantsrsquo homes or in a few cases a senior center The food frequency questionnaire used in the survey was a modified version of the National Cancer Institute Health Habits and History Questionnaire this modified version included an expanded food list containing a greater number of ethnic foods than the original food frequency form Demographic and personal data collected included sex ethnicity age education denture use marital status chronic disease and weight
Food items reported in the survey were grouped into food groups similar to the USDA Food Guide Pyramid and the National Cancer Institutersquos 5 A Day for Better Health program These groups are (1) fruits and vegetables (2) bread cereal rice and pasta (3) milk yogurt and cheese (4) meat fish poultry beans and eggs and (5) fats oils sweets and snacks Medians ranges frequencies and percentages were used to summarize intake of each food group broken down by demographic and health characteristics In addition multiple regression models were used to determine which demographic and health factors were jointly predictive of intake of each of the five food groups
Thirty-four percent of the survey participants were African American 36 were European American and 30 were Native American Sixty-two percent were female 62 were not married at the time of the interview and 65 had some high school education or were high school graduates Almost all of the participants (95) had one or more chronic diseases Sixty percent of the respondents were between 70 and 79 years of age the median age was 78 years old Table 12-27 presents the median servings of bread cereal rice and pasta broken down by demographic and health characteristic Only sex was statistically predictive of bread cereal rice and pasta intake (p lt 001) with males consuming approximately an extra serving per day compared to women Also the multiple regression model indicated that sex was predictive of
Page Exposure Factors Handbook 12-8 September 2011
Exposure Factors Handbook
Chapter 12mdashIntake of Grain Products breads cereal rice and pasta intake after controlling for other demographic variables
One limitation of the study as noted by the study authors is that the study did not collect information on the length of time the participants had been practicing the dietary behaviors reported in the survey The questionnaire asked participants to report the frequency of food consumption during the past year The study authors noted that currently there are no dietary assessment tools that allow the collection of comprehensive dietary data over years of food consumption Another limitation of the study is that the small sample size used makes associations by sex and ethnicity difficult
12327 Fox et al (2004)mdashFeeding Infants and Toddlers Study What Foods Are Infants and Toddlers Eating
Fox et al (2004) used data from the Feeding Infants and Toddlers study (FITS) to assess food consumption patterns in infants and toddlers The FITS was sponsored by Gerber Products Company and was conducted to obtain current information on food and nutrient intakes of children ages 4 to 24 months old in the 50 states and the District of Columbia The FITS is described in detail in Devaney et al (2004) FITS was based on a random sample of 3022 infants and toddlers for which dietary intake data were collected by telephone from their parents or caregivers between March and July 2002 An initial recruitment and household interview was conducted followed by an interview to obtain information on intake based on 24-hour recall The interview also addressed growth development and feeding patterns A second dietary recall interview was conducted for a subset of 703 randomly selected respondents The study over-sampled children in the 4 to 6 and 9 to 11 months age groups sample weights were adjusted for non-response over sampling and under coverage of some subgroups The response rate for the FITS was 73 for the recruitment interview Of the recruited households there was a response rate of 94 for the dietary recall interviews (Devaney et al 2004) Table 12-28 shows the characteristics of the FITS population
Fox et al (2004) analyzed the first set of 24-hour recall data collected from all study participants For this analysis children were grouped into six age categories 4 to 6 months 7 to 8 months 9 to 11 months 12 to 14 months 15 to 18 months and 19 to 24 months Table 12-29 provides the percentage of infants and toddlers consuming different types of grains or grain products at least once a day The percentages of children eating any type of grain or
grain product ranged from 658 for 4 to 6 monthshyolds to 992 for 19- to 24-month-olds
The advantages of this study is that it represents the US population and the sample size was large One limitation of the analysis done by Fox et al (2004) is that only frequency data were provided no information on actual intake rates was included In addition Devaney et al (2004) noted several limitations associated with the FITS data For the FITS a commercial list of infants and toddlers was used to obtain the sample used in the study Since many of the households could not be located and did not have children in the target population a lower response rate than would have occurred in a true national sample was obtained (Devaney et al 2004) In addition the sample was likely from a higher socioeconomic status when compared with all US infants in this age group (4 to 24 months old) and the use of a telephone survey may have omitted lower-income households without telephones (Devaney et al 2004)
12328 Ponza et al (2004)mdashNutrient Food Intakes and Food Choices of Infants and Toddlers Participating in WIC
Ponza et al (2004) conducted a study using selected data from the FITS to assess feeding patterns food choices and nutrient intake of infants and toddlers participating in the Special Supplemental Nutrition Program for Women Infants and Children (WIC) Ponza et al (2004) evaluated FITS data for the following age groups 4 to 6 months (N = 862) 7 to 11 months (N = 1159) and 12 to 24 months (N = 996) Table 12-30 shows the total sample size described by WIC participants and non-participants
The foods consumed were analyzed by tabulating the percentage of infants who consumed specific foodsfood groups per day (Ponza et al 2004) Weighted data were used in all of the analyses used in the study (Ponza et al 2004) Table 12-30 presents the demographic data for WIC participants and non-participants Table 12-31 provides information on the food choices for the infants and toddlers studied In general there was little difference in grain product choices among WIC participants and non-participants except for the 7 to 11 months age category (see Table 12-31) Non-participants ages 7 to 11 months were more likely to eat non-infant cereals than WIC participants
An advantage of this study is that it had a relatively large sample size and was representative of the US general population of infants and children A limitation of the study is that intake values for foods
Exposure Factors Handbook Page September 2011 12-9
Exposure Factors Handbook
Chapter 12mdashIntake of Grain Products were not provided Other limitations are those associated with the FITS data as described previously in Section 12327
12329 Fox et al (2006)mdashAverage Portion of Foods Commonly Eaten by Infants and Toddlers in the United States
Fox et al (2006) estimated average portion sizes consumed per eating occasion by children 4 to 24 months of age who participated in the FITS The FITS is a cross-sectional study designed to collect and analyze data on feeding practices food consumption and usual nutrient intake of US infants and toddlers and is described in Section 12327 of this chapter It included a stratified random sample of 3022 children between 4 and 24 months of age
Using the 24-hour recall data Fox et al (2006) derived average portion sizes for six major food groups including breads and grains Average portion sizes for select individual foods within these major groups were also estimated For this analysis children were grouped into six age categories 4 to 5 months 6 to 8 months 9 to 11 months 12 to 14 months 15 to 18 months and 19 to 24 months Table 12-32 and Table 12-33 present the average portion sizes for grain products for infants and toddlers respectively
123210 Mennella et al (2006)mdashFeeding Infants and Toddlers Study The Types of Foods Fed to Hispanic Infants and Toddlers
Mennella et al (2006) investigated the types of food and beverages consumed by Hispanic infants and toddlers in comparison to the non-Hispanic infants and toddlers in the United States The FITS 2002 data for children between 4 and 24 months of age were used for the study The data represent a random sample of 371 Hispanic and 2367 non-Hispanic infants and toddlers (Mennella et al 2006) Mennella et al (2006) grouped the infants as follows 4 to 5 months (N = 84 Hispanic 538 non-Hispanic) 6 to 11 months (N = 163 Hispanic 1228 non-Hispanic) and 12 to 24 months (N = 124 Hispanic 871 non-Hispanic) of age
Table 12-34 provides the percentage of Hispanic and non-Hispanic infants and toddlers consuming grain products In most instances the percentages consuming the different types are similar However 6 to 11 month old Hispanic children were more likely to eat rice and pasta than non-Hispanic children in this age groups
The advantage of the study is that it provides information on f ood preferences for Hispanic and non-Hispanic infants and toddlers A limitation is that the study did not provide food intake data but provided frequency of use data instead Other limitations are those noted previously in Section 12327 for the FITS data
124 CONVERSION BETWEEN WET- AND
DRY-WEIGHT INTAKE RATES The intake data presented in this chapter are
reported in units of wet weight (ie as-consumed or uncooked weight of grain products consumed per day or per eating occasion) However data on the concentration of contaminants in grain products may be reported in units of either wet or dry weight (eg mg contaminant per gram dry w eight of grain products) It is essential that exposure assessors be aware of this difference so that they may ensure consistency between the units used for intake rates and those used for concentration data (ie if the contaminant concentration is measured in dry weight of grain products then the dry-weight units should be used for their intake values)
If necessary wet-weight (eg as-consumed) intake rates may be converted to dry-weight intake rates using the moisture content percentages presented in Table 12-35 and the following equation
IR = IR 100 minusW dw ww (Eqn 12-1) 100
where
IRdw = dry-weight intake rate IRww = wet-weight intake rate and W = percent water content
Alternatively dry-weight residue levels in grain
products may be converted to wet-weight residue levels for use with wet-weight (eg as-consumed) intake rates as follows
C = C 100 minus W ww dw (Eqn 12-2) 100
where
Cww = wet concentration rate Cdw = dry-weight concentration and W = percent water content
Page Exposure Factors Handbook 12-10 September 2011
Exposure Factors Handbook
Chapter 12mdashIntake of Grain Products
Exposure Factors Handbook Page September 2011 12-11
The moisture data presented in Table 12-35 are for selected grain products taken from USDA (2007)
125 REFERENCES FOR CHAPTER 12 Devaney B Kalb L Briefel R Zavitsky-Novak T
Clusen N Ziegler P (2004) Feeding infants and toddlers study overview of the study design J Am Diet Assoc 104 s8-13 httpdxdoiorg101016jjada200310023
Fox MK Pac S Devaney B Jankowski L (2004) Feeding infants and toddlers study What foods are infants and toddlers eating J Am Diet Assoc 104 s22-s30 httpdxdoiorg101016jjada200310026
Fox MK Reidy K Karwe V Ziegler P (2006) Average portions of foods commonly eaten by infants and toddlers in the United States J Am Diet Assoc 106 S66-S76 httpdxdoiorg101016jjada200509042
Mennella JA Ziegler P Briefel R Novak T (2006) Feeding Infants and Toddlers Study the types of foods fed to Hispanic infants and toddlers J Am Diet Assoc 106 S96shy106 httpdxdoiorg101016jjada200509038
NCHS (National Center for Health Statistics) (1993) Joint policy on variance estimation and statistical reporting standards on NHANES III and CSFII reports HNISNCHS Analytic Working Group recommendations Riverdale MD Human Nutrition Information Service (HNIS)Analytic Working Group Agricultural Research Service Survey SystemsFood Consumption Laboratory
Ponza M Devaney B Ziegler P Reidy K Squatrito C (2004) Nutrient intakes and food choices of infants and toddlers participating in WIC J Am Diet Assoc 104 s71-s79 httpdxdoiorg101016jjada200310018
Smiciklas-Wright H Mitchell DC Mickle SJ Cook AJ Goldman JD (2002) Foods commonly eaten in the United States Quantities consumed per eating occasion and in a day 1994minus96 [pre-publication version] (NFS Report No 96-5) Beltsville MD US Department of Agriculture httpwwwarsusdagovsp2userfilesplace1 2355000pdfportionpdf
US EPA (US Environmental Protection Agency) (2000) Food commodity intake database [Database]
US EPA (US Environmental Protection Agency) (2003) CSFII analysis of food intake distributions (EPA600R-03029) Washington DC httpcfpubepagovnceacfmrecordisplayc fmdeid=56610
US EPA (US Environmental Protection Agency) (2005) Guidance on selecting age groups for monitoring and assessing childhood exposures to environmental contaminants (final) (EPA630P-03003F) Washington DC US Environmental Protection Agency Risk Assessment Forum httpwwwepagovrafpublicationsguidanc e-on-selecting-age-groupshtm
USDA (US Department of Agriculture) (1980) Food and nutrient intakes of individuals in 1 day in the United States Spring 1977 Nationwide Food Consumption Survey 1977ndash78 Preliminary report no 2 Washington DC httpwwwarsusdagovSP2UserFilesPlace 12355000pdf7778nfcs7778_prelim_2pdf
USDA (US Department of Agriculture) (1993) Food and nutrient intakes by i ndividuals in the United States 1 day 1987ndash88 Nationwide Food Consumption Survey 1987-88 Report no 87-I-1 (87-I-1) Washington DC httpwwwarsusdagovSP2UserFilesPlace 12355000pdf8788nfcs8788_rep_87-ishy1pdf
USDA (US Department of Agriculture) (1996a) Data tables Results from USDAs 1994 continuing survey of food intakes by individuals and 1994 diet and health knowledge survey Riverdale MD
USDA (US Department of Agriculture) (1996b) Data tables results from USDArsquos 1995 Continuing survey of food intakes by individuals and 1995 diet and health knowledge survey Riverdale MD
USDA (US Department of Agriculture) (1999a) Food and nutrient intakes by children 1994shy96 1998 table set 17 Beltsville MD httpwwwarsusdagovSP2UserFilesPlace 12355000pdfscs_allpdf
USDA (US Department of Agriculture) (1999b) Food consumption prices and expenditures (1970minus1997) Statistical Bulletin No 965 Washington DC Economic Research Service
USDA (US Department of Agriculture) (2000) 1994-1996 1998 continuing survey of food
Exposure Factors Handbook
Chapter 12mdashIntake of Grain Products intakes by individuals (CSFII) Beltsville MD Agricultural Research Service Beltsville Human Nutrition Research Center
USDA (US Department of Agriculture) (2007) USDA nutrient database for standard reference release 20 Riverdale MD httpwwwarsusdagovmainsite_mainhtm modecode=12-35-45-00
Vitolins MZ Quandt SA Bell RA Arcury TA Case LD (2002) Quality of diets consumed by older rural adults J Rural Health 18 49shy56
Page Exposure Factors Handbook 12-12 September 2011
Exposure F
actors Handbook
Chapter 12mdash
Intake of Grain Products
Table 12-3 Per Capita Intake of Total Grains Based 2003ndash2006 NHANES (gkg-day edible portion uncooked weight)
Population Group
Consuming Percentiles
N Mean SE 1st 5th 10th 25th 50th 75th 90th 95th 99th Max Whole Population 16783 100 26 004 02 06 08 13 20 32 51 67 99 348 Age Group
Birth to 1 year 865 76 31 020 00 00 00 01 23 50 75 95 125 349 1 to 2 years 1052 100 64 017 15 23 30 42 58 84 105 124 159 211 3 to 5 years 978 100 62 013 20 24 33 44 59 76 96 111 132 156 6 to 12 years 2256 100 44 009 06 14 18 28 41 55 74 82 111 145 13 to 19 years 3450 100 24 005 04 07 10 15 21 32 42 50 75 143 20 to 49 years 4289 100 22 004 03 06 08 12 19 28 39 46 71 150 Females 13 to 49 years 4103 100 19 004 02 05 08 11 17 25 34 39 55 98 50 years and older 3893 100 17 003 03 05 07 10 15 21 29 35 52 94
Race Mexican American 4450 99 30 005 01 08 10 16 24 39 58 72 106 178 Non-Hispanic Black 4265 100 24 004 02 05 07 11 18 29 50 68 102 211 Non-Hispanic White 6757 100 25 005 03 06 08 13 19 31 49 65 96 348 Other Hispanic 562 99 27 013 02 07 10 15 21 33 53 70 98 153 Other RacemdashIncluding Multiple Races 749 100 30 011 03 06 09 15 25 39 60 75 111 175
N = Sample size SE = Standard error Max = Maximum value Estimates are less statistically reliable based on guidance published in the Joint Policy on Variance Estimation and Statistical Reporting Standards on
NHANES III and CSFII Reports NHISNCHS Analytical Working Group Recommendations (NCHS 1993)
Source Based on US EPA analysis of 2003ndash2006 NHANES
Exposure F
actors Handbook
Page Septem
ber 2011 12-13
Exposure F
actors Handbook
Chapter 12mdash
Intake of Grain Products
Table 12-4 Consumer-Only Intake of Total Grains Based 2003ndash2006 NHANES (gkg-day edible portion uncooked weight)
Population Group N Mean SE Percentiles
1st 5th 10th 25th 50th 75th 90th 95th 99th Max
Whole Population 16556 26 004 03 06 08 13 20 32 51 67 99 Age Group
Birth to 1 year 644 41 018 01 04 08 18 35 59 81 103 139 1 to 2 years 1050 64 016 16 24 30 42 58 84 105 124 159 3 to 5 years 977 62 013 20 24 33 44 59 76 96 111 132 6 to 12 years 2256 44 009 06 14 18 28 41 55 74 82 111 13 to 19 years 3450 24 005 04 07 10 15 21 32 42 50 75 20 to 49 years 4288 22 004 03 06 08 12 19 28 39 46 71 Females 13 to 49 years 4102 19 003 02 05 08 11 17 25 34 39 55 50 years and older 3891 17 003 03 05 07 10 15 21 29 35 52
Race Mexican American 4341 30 005 04 08 11 16 24 39 59 72 106 Non-Hispanic Black 4236 24 004 02 05 07 11 18 29 50 69 103 Non-Hispanic White 6694 25 005 03 06 08 13 20 31 49 65 96 Other Hispanic 548 28 014 04 07 10 15 21 34 54 71 98 Other RacemdashIncluding Multiple Races 737 31 011 03 07 09 15 25 39 60 75 111
349
349 211 156 145 143 150 98 94
178 211 349 153 175
N = Sample size SE = Standard error Max = Maximum value Estimates are less statistically reliable based on guidance published in the Joint Policy on Variance Estimation and Statistical Reporting
Standards on NHANES III and CSFII Reports NHISNCHS Analytical Working Group Recommendations (NCHS 1993)
Source Based on US EPA analysis of 2003ndash2006 NHANES
Page E
xposure Factors H
andbook 12-14
September 2011
Table 12-5 Per Capita Intake of Individual Grain Products Based 2003ndash2006 NHANES (gkg-day edible portion uncooked weight)
Population Group N
Consuming Mean SE
Consuming Mean SE
Cereal Rice Whole Population
Age Group Birth to 1 year 1 to 2 years 3 to 5 years 6 to 12 years 13 to 19 years 20 to 49 years Females 13 to 49 years 50 years and older Race Mexican American Non-Hispanic Black Non-Hispanic White Other Hispanic Other RacemdashIncluding Multiple Races
16783
865 1052
978 2256 3450 4289 4103 3893
4450 4265 6757
562
749
100
81 100 100 100 100 100 100 100
100 100 100
99
100
37
51 87 86 63 39 32 29 22
43 36 36 39
41
004
030 018 017 010 008 004 004 004
007 006 005 020
012
88 69 87 91 89 85 89 86 89
87 86 88 92
90
02
11 06 05 03 02 03 02 01
03 03 02 06
08
001
008 006 006 003 001 001 001 001
002 002 001 005
008 N
SE
Source
= Sample size = Standard error
Based on US EPA analysis of 2003ndash2006 NHANES
Exposure Factors Handbook
Chapter 12mdashIntake of Grain Products
Exposure Factors Handbook Page September 2011 12-15
Table 12-6 Consumer-Only Intake of Individual Grain Products Based 2003ndash2006 NHANES (gkg-day edible portion uncooked weight)
Population Group N Mean SE N Mean SE
Cereal Rice Whole Population
Age Group Birth to 1 year 1 to 2 years 3 to 5 years 6 to 12 years 13 to 19 years 20 to 49 years Females 13 to 49 years 50 years and older Race Mexican American Non-Hispanic Black Non-Hispanic White Other Hispanic Other RacemdashIncluding Multiple Races
16613
696 1051 978 2256 3450 4289 4103 3893
4372 4244 6707 550 740
37
63 87 86 63 39 32 29 22
43 36 36 39 41
004
031 018 017 010 008 004 004 004
007 006 005 020 013
14447
552 928 875 2000 2898 3812 3511 3382
3757 3645 5887 491 667
03
15 07 05 03 02 03 02 02
03 03 02 06 08
001
010 007 006 003 002 002 002 001
002 002 001 005 008
N SE
Source
= Sample size = Standard error
Based on US EPA analysis of 2003ndash2006 NHANES
Exposure Factors Handbook
Chapter 12mdashIntake of Grain Products
Page Exposure Factors Handbook 12-16 September 2011
Exposure Factors Handbook
Chapter 12mdashIntake of Grain Products
Table 12-7 Mean Grain Intake per Individual in a Day by Sex and Age (gday as-consumed)a for 1977minus1978 Group Age (years) Total Grains Breads Rolls
Biscuits Other Baked
Goods Cereals Pasta Mixtures Mainly Grainb
Males and Females lt1 1 to 2 3 to 5 6 to 8
42 158 181 206
4 27 46 53
5 24 37 56
30 44 54 60
3 63 45 38
Males 9 to 11 12 to 14 15 to 18 19 to 22 23 to 34 35 to 50 51 to 64 65 to 74 ge75
238 288 303 253 256 234 229 235 196
67 76 91 84 82 82 78 71 70
56 80 77 53 60 58 57 60 50
51 57 53 64 40 44 48 69 58
64 74 82 52 74 50 46 35 19
Females 9 to 11 12 to 14 15 to 18 19 to 22 23 to 34 35 to 50 51 to 64 65 to 74 ge75
214 235 196 161 163 161 155 175 178
58 57 57 44 49 49 52 57 54
59 61 43 36 38 37 40 42 44
44 45 41 33 32 32 36 47 58
53 72 55 48 44 43 27 29 22
Males and FemalesmdashAll Ages 204 62 49 44 49 a Based on USDA Nationwide Food Consumption Survey 1977ndash1978 data for 1 day b Includes mixtures containing grain as the main ingredient
Source USDA (1980)
Exposure Factors Handbook Page September 2011 12-17
Exposure Factors Handbook
Chapter 12mdashIntake of Grain Products
Page Exposure Factors Handbook 12-18 September 2011
Table 12-8 Mean Grain Intakes per Individual in a Day by Sex and Age (gday as-consumed)a for 1987minus1988
Group Age (years) Total Grains Yeast Breads and
Rolls
Quick Breads Pancakes
French Toast
Cakes Cookies Pastries
Pies
Crackers Popcorn
Pretzels Corn Chips
Cereals and Pastas
Mixtures Mostly Grainb
Males and Females le5 167 30 8 22 4 52 51
Males 6 to 11 268 51 16 37 8 74 83
12 to 19 304 65 28 45 10 72 82 ge20 272 65 20 37 8 58 83
Females 6 to 11 231 43 19 30 6 66 68
12 to 19 239 45 13 29 7 52 91 ge20 208 45 14 28 6 53 62
All Individuals 237 52 16 32 7 57 72 a Based on USDA Nationwide Food Consumption Survey 1987ndash1988 data for 1 day b Includes mixtures containing grain as the main ingredient
Source USDA (1993)
Table 12-9 Mean Grain Intakes per Individual in a Day by Sex and Age (gday as-consumed)a for 1994minus1995
Group Age (years)
Total Grains Yeast Breads and Rolls
Quick Breads Pancakes
French Toast
Cakes Cookies
Pastries Pies
Crackers Popcorn
Pretzels Corn Chips
Cereals and Pastas
Mixtures Mostly Grainb
1994 1995 1994 1995 1994 1995 1994 1995 1994 1995 1994 1995 1994 1995 Males and Females le5 213 210 26 28 11 11 22 23 8 7 58 57 89 84
Males 6 to 11 12 to 19 ge20
285 417 357
341 364 365
51 53 64
45 54 61
15 30 22
21 21 24
42 54 43
46 43 46
12 17 13
18 22 15
66 82 86
97 84 91
101 180 128
115 138 128
Females 6 to 11 12 to 19 ge20
260 317 254
286 296 257
43 40 44
46 37 45
16 16 16
21 14 15
37 39 33
51 35 34
11 17 9
14 16 10
57 63 59
54 52 69
94 142 92
100 143 83
All Individuals 300 303 50 49 18 19 38 39 12 13 70 76 112 107 a Based on USDA CSFII 1994 and 1995 data for 1 day b Includes mixtures containing grain as the main ingredient
Source USDA (1996a b)
Exposure Factors Handbook
Chapter 12mdashIntake of Grain Products
Table 12-10 Per Capita Consumption of Flour and Cereal Products in 1997
Food Item Per Capita Consumption
(gday)a
Total Wheat Flourb
Rye Flour Ricec
Total Corn Productsd
Oat Productse
Barley Productsf
Total Flour and Cereal Productsg
186 07 24 29 8
09 249
a Original data were presented in lbsyear data were converted to gday by multiplying by a factor of 454 glb and dividing by 365 dayyear Consumption of most items at the processing level Excludes quantities used in alcoholic beverages and fuel
b Includes white whole wheat and durum flour c Milled basis d Includes corn flour and meal hominy and grits and corn starch e Includes rolled oats ready-to-eat oat cereals oat flour and oat bran f Includes barley flour pearl barley and malt and malt extract used in food processing g Excludes wheat not ground into flour
Source USDA (1999b)
Exposure Factors Handbook Page September 2011 12-19
Table 12-11 Mean Quantities of Grain Products Consumed by Children Under 20 Years of Age by Sex and Age per Capita (gday as-consumed)a
Yeast Cereals and Pasta Cakes Crackers Quick Breads Mixtures Age Group Sample Breads Cookies Popcorn Totalb Ready-to- Pancakes Mainly (years) Size and Total Rice Pasta Pastries Pretzels Eat Cereals French Toast Grainc Rolls Pies Corn Chips
Males and Females lt1 1126 56 2 29 1 2 1d 1 3 1 20 1 1016 192 16 57 11 9 9 9 16 7 87 2 1102 219 26 62 16 15 12 12 22 9 87 1 to 2 2118 206 21 59 13 12 11 11 19 8 87 3 1831 242 30 64 19 13 12 16 23 11 98 4 1859 264 36 67 22 15 11 17 30 13 102 5 884 284 41 76 24 17 11 15 33 13 107 3 to 5 4574 264 36 69 22 15 11 16 29 12 102 le5 7818 219 27 61 16 13 10 12 22 9 87
Males 6 to 9 787 310 45 77 28 18 15 23 39 16 109 6 to 11 1031 318 46 80 31 16 18 23 40 15 115 12 to 19 737 406 54 82 29 27 17 26 49 19 175
Females 6 to 9 704 284 43 61 21 12 15 18 42 13 107 6 to 11 969 280 43 62 20 14 15 19 42 14 101 12 to 19 732 306 40 67 17 19 22 15 37 15 132
Males and Females le9 9309 250 34 64 20 14 12 16 30 12 96 le19 11287 298 40 69 22 17 15 18 36 14 120 a Based on data from 1994ndash1996 1998 CSFII b Includes yeast breads rolls cereals pastas quick breads pancakes French toast cakes cookies pastries pies crackers popcorn pretzels corn
chips and mixtures having a grain product as a main ingredient Excludes grain products that were ingredients in food mixtures coded as a single item and tabulated under another food group for example noodles in tuna-noodle casserole are tabulated under Meat Poultry and Fish
c Includes mixtures having a grain product as a main ingredient such as burritos tacos pizza egg rolls quiche spaghetti with sauce rice and pasta mixtures frozen meals in which the main course is a grain mixture noodle and rice soups and baby-food macaroni and spaghetti mixtures
d Estimate is not statistically reliable due to small sample size reporting intake Note Consumption amounts shown are representative of the first day of each participantrsquos survey response
Source USDA (1999a)
Exposure F
actors Handbook
Chapter 12mdash
Intake of Grain Products
Page E
xposure Factors H
andbook 12-20
September 2011
Exposure F
actors Handbook
Chapter 12mdash
Intake of Grain Products
Table 12-12 Percentage of Individuals Under 20 Years of Age Consuming Grain Products by Sex and Age ()a
Age Group (years) Sample Size Totalb
Yeast Breads
and Rolls
Cereals and Pasta Quick Breads
Pancakes French Toast
Cakes Cookies Pastries
Pies
Crackers Popcorn Pretzels
Corn Chips
Mixtures Mainly GraincTotal
Ready-to-Eat
Cereals Rice Pasta
Males and Females lt1 1126 706 109 628 91 34 21 44 165 103 150 1 1016 982d 484 706 453 113 94 230 470 390 478 2 1102 990d 587 711 519 144 94 275 466 379 453 1 to 2 2118 987 537 709 487 129 94 253 468 384 465 3 1831 994d 641 697 533 111 86 288 461 385 490 4 1859 995d 670 691 548 114 71 286 523 394 462 5 884 999d 692 704 549 114 68 252 524 321 474 3 to 5 4574 996d 668 697 543 113 75 275 503 367 475 le5 7818 958 555 693 469 109 75 240 450 341 433
Males 6 to 9 787 989d 698 626 508 105 74 281 525 360 445 6 to 11 1031 990d 691 640 524 97 81 271 523 338 453 12 to 19 737 982d 627 446 332 100 59 244 413 272 462
Females 6 to 9 704 997d 715 612 476 90 79 263 571 383 480 6 to 11 969 993d 710 593 456 94 71 271 550 371 457 12 to 19 732 976d 609 459 303 86 93 198 406 309 461
Males and Females le9 9309 972 616 664 479 105 76 253 489 353 444 le19 11287 976 624 576 417 99 76 242 461 325 451 a Based on data from 1994ndash1996 1998 CSFII b Includes yeast breads rolls cereals pastas quick breads pancakes French toast cakes cookies pastries pies crackers popcorn
pretzels corn chips and mixtures having a grain product as a main ingredient Excludes grain products that were ingredients in food mixtures coded as a single item and tabulated under another food group for example noodles in tuna-noodle casserole are tabulated under Meat Poultry and Fish
c Includes mixtures having a grain product as a main ingredient such as burritos tacos pizza egg rolls quiche spaghetti with sauce rice and pasta mixtures frozen meals in which the main course is a grain mixture noodle and rice soups and baby-food macaroni and spaghetti mixtures
d Estimate is not statistically reliable due to small sample size reporting intake Note Percentages shown are representative of the first day of each participantrsquos survey response
Source USDA (1999a)
Exposure F
actors Handbook
Page Septem
ber 2011 12-21
Page E
xposure Factors H
andbook 12-22
September 2011
Exposure F
actors Handbook
Chapter 12mdash
Intake of Grain Products
Table 12-13 Per Capita Intake of Total Grains Based on 1994ndash1996 1998 CSFII (gkg-day edible portion uncooked weight) Population Group N Percent
Consuming Mean SE Percentiles 1st 5th 10th 25th 50th 75th 90th 95th 99th Max
Whole Population Age group Birth to 1 year 1 to 2 years 3 to 5 years 6 to 12 years 13 to 19 years 20 to 49 years ge50 years Season Fall Spring Summer Winter Race Asian Pacific Islander Black American Indian Alaskan Native OtherNA White Region Midwest Northeast South West Urbanization Central City Suburban Non-metropolitan
20607
1486 2096 4391 2089 1222 4677 4646
4687 5308 5890 4722
557 2740
177 1638 15495
4822 3692 7208 4885
6164 9598 4845
995
705 998 1000 1000 1000
999 1000
995 996 995 995
985 994 997 988 996
997 996 995 994
995 995 996
27
25 64 63 43 25 22 17
26 27 26 27
36 26 29 31 26
27 28 25 28
27 27 24
00
01 01 01 01 01 00 00
00 00 00 00
02 01 02 01 00
00 00 00 01
00 00 01
02
00 11 18 09 04 03 03
02 02 03 02
00 01 03 00 03
03 03 02 02
01 03 03
06
00 21 26 17 08 06 06
06 06 07 06
11 05 05 07 07
07 07 06 07
06 07 06
09
00 28 32 20 11 08 07
09 08 09 09
15 07 08 09 09
09 10 08 09
09 09 08
13
00 42 43 28 15 13 11
13 13 13 14
23 11 13 15 13
14 14 12 14
13 14 12
21
16 59 59 40 23 19 15
21 21 21 21
32 19 22 24 20
21 22 19 22
21 21 19
33
38 79 78 54 31 28 21
33 34 33 33
47 33 42 41 32
34 35 30 35
35 34 29
52
62 104 99 70 44 39 28
50 55 51 52
62 54 63 61 50
53 53 50 54
54 53 48
68
86 121
115 82 51 47 35
66 70 68 68
73 73 75 77 66
70 68 66 70
70 69 63
103
127 168 156
111 79 71 49
100 105 105 101
112 115
120 117
98
104 110
97 103
107 100 104
316
263 316 270 172 124 161
112
263 294 282 316
246 294 168 270 316
238 316 282 208
294 316 238
N SE
Source
= Sample size = Standard error
US EPA analysis of 1994ndash1996 1998 CSFII
Exposure F
actors Handbook
Page Septem
ber 2011 12-23
Exposure F
actors Handbook
Chapter 12mdash
Intake of Grain Products
Table 12-14 Consumer-Only Intake of Total Grains Based on 1994ndash1996 1998 CSFII (gkg-day edible portion uncooked weight) Population Group N Mean SE Percentiles
1st 5th 10th 25th 50th 75th 90th 95th 99th Max Whole Population Age Group Birth to 1 year 1 to 2 years 3 to 5 years 6 to 12 years 13 to 19 years 20 to 49 years ge50 years Season Fall Spring Summer Winter Race Asian Pacific Islander Black American Indian Alaskan Native OtherNA White Region Midwest Northeast South West Urbanization Central City Suburban Non-metropolitan
20157
1048 2092 4389 2089 1222 4673 4644
4587 5190 5751 4629
527 2675
175 1570 15210
4743 3628 7053 4733
6023 9378 4756
27
36 64 63 43 25 22 17
26 27 27 27
37 26 30 32 26
27 28 25 28
28 27 24
00
01 01 01 01 01 00 00
00 00 00 00
02 01 02 01 00
00 00 00 01
00 00 01
03
01 12 18 09 04 03 03
03 03 04 03
08 02 03 05 04
04 04 03 04
03 04 03
07
03 21 26 17 08 06 06
07 07 07 07
12 05 05 07 07
07 08 06 07
07 07 06
09
06 28 32 20 11 08 07
09 09 09 09
16 07 08 10 09
09 10 08 09
09 09 08
13
14 42 43 28 15 13 11
13 13 14 14
23 11 13 15 13
14 14 12 14
13 14 12
21
28 59 59 40 23 19 15
21 21 21 21
32 19 22 24 20
21 22 19 22
21 21 19
33
48 79 78 54 31 28 21
33 34 33 33
47 33 42 41 32
34 35 30 35
35 34 29
52
74 104 99 70 44 39 28
50 55 52 52
62 54 63 62 51
53 53 50 54
54 53 48
68
92 121
115 82 51 47 35
66 70 68 68
73 73 75 77 66
70 68 66 70
70 69 64
103
134 168 156
111 79 71 49
100 106 105 101
112 115
120 117
98
104 110
98 103
107 100 104
316
263 316 270 172 124 161
112
263 294 282 316
246 294 168 270 316
238 316 282 208
294 316 238
N SE
Source
= Sample size = Standard error
US EPA analysis of 1994ndash1996 1998 CSFII
Table 12-15 Per Capita Intake of Individual Grain Products Based on 1994ndash1996 1998 CSFII (gkg-day edible portion uncooked weight)
Cereal Rice Population Group
N Percent Consuming Mean SE
Percent Consuming Mean SE
Whole Population Age Group
Birth to 1 year 1 to 2 years 3 to 5 years 6 to 12 years
13 to 19 years 20 to 49 years ge50 years Season Fall Spring Summer Winter Race Asian Pacific Islander Black American Indian Alaskan Native OtherNA White Region Midwest Northeast South West Urbanization Central City Suburban
Non-metropolitan
20607
1486 2096 4391 2089 1222 4677 4646
4687 5308 5890 4722
557 2740
177 1638 15495
4822 3692 7208 4885
6164 9598 4845
996
746 998 1000 1000 1000
999 1000
996 996 995 996
985 995 997 989 997
997 997 996 994
996 995 997
37
40 84 87 62 41 31 22
37 38 38 37
44 38 42 43 37
39 37 36 38
38 38 35
003
014 008 007 006 006 004 002
006 007 006 005
020 012 015 012 004
009 006 004 009
006 005 006
865
602 864 879 880 858 883 845
851 871 869 871
966 863 926 859 862
882 872 850 867
872 866 856
03
07 06 05 04 03 03 02
03 03 03 03
17 03 03 06 02
02 03 02 04
04 03 02
001
004 003 003 002 002 001 001
002 002 002 002
019 002 010 008 001
002 003 001 003
002 002 001
N SE
Source
= Sample size = Standard error
US EPA analysis of 1994ndash1996 1998 CSFII
Exposure Factors Handbook
Chapter 12mdashIntake of Grain Products
Page Exposure Factors Handbook 12-24 September 2011
Exposure Factors Handbook
Chapter 12mdashIntake of Grain Products
Table 12-16 Consumer-Only Intake of Individual Grain Products Based on 1994ndash1996 1998 CSFII (gkg-day edible portion uncooked weight )
Population Group N Cereal
Mean SE N Rice
Mean SE Whole Population 20227 38 003 17481 03 001 Age Group
Birth to 1 year 1116 54 016 900 12 007 1 to 2 years 2092 84 008 1819 07 004 3 to 5 years 4389 87 007 3869 06 003 6 to 12 years 2089 62 006 1847 04 002 13 to 19 years 1222 41 006 1038 03 003 20 to 49 years 4674 31 004 4102 03 001 ge50 years 4645 22 002 3906 02 001
Season Fall 4598 37 006 3957 03 002 Spring 5213 38 007 4530 03 002 Summer 5768 38 006 4989 03 002 Winter 4648 37 006 4005 03 002
Race Asian Pacific Islander 529 45 020 513 18 019 Black 2683 38 012 2346 04 002 American Indian Alaskan Native 175 43 015 151 03 010 OtherNA 1579 44 013 1375 07 008 White 15261 37 004 13096 02 001
Region Midwest 4759 39 009 4186 02 002 Northeast 3639 37 006 3152 04 004 South 7081 36 004 6029 03 001 West 4748 39 009 4114 05 003
Urbanization Central City 6039 38 006 5303 05 003 Suburban 9410 38 005 8105 03 002 Non-metropolitan 4778 36 006 4073 02 002
N = Sample size SE = Standard error
Source US EPA analysis of 1994ndash1996 1998 CSFII
Exposure Factors Handbook Page September 2011 12-25
Table 12-17 Per Capita Intake of Breads a Based on 1994ndash1996 1998 CSFII (gkg-day as-consumed)
Population Group Percent Consuming Mean
Percentile SE 1st 5th 10th 25th 50th 75th 90th 95th 99th Max
Whole Population Age Group lt5 months 6 to 12 months lt1 year 1 to 2 years 3 to 5 years 6 to 11 years 12 to 19 years 20 to 39 years 40 to 69 years ge70 years Season Fall Spring Summer Winter Race Asian Black American IndianAlaska Native OtherNA White Region Midwest Northeast South West Urbanization Central City Suburban Non-metropolitan
872
09 302 146 772 865 871 862 881 900 916
874 871 873 869
691 831 822 804 890
891 883 875 837
856 877 885
11
00 05 03 20 23 17 11 09 09 09
11 11 11 11
08 11 14 12 11
12 11 11 11
11 11 11
001
008 016 011 006 005 004 003 002 001 002
002 002 002 002
006 003 018 004 001
002 002 002 002
002 001 002
00
00 00 00 00 00 00 00 00 00 00
00 00 00 00
00 00 00 00 00
00 00 00 00
00 00 00
00
00 00 00 00 00 00 00 00 00 00
00 00 00 00
00 00 00 00 00
00 00 00 00
00 00 00
00
00 00 00 00 00 00 00 00 00 02
00 00 00 00
00 00 00 00 00
00 00 00 00
00 00 00
04
00 00 00 04 09 07 04 04 04 04
04 04 04 04
00 03 03 03 04
04 04 04 03
04 04 04
09
00 00 00 14 20 14 09 08 08 08
09 09 09 08
04 07 09 09 09
09 09 09 08
08 09 09
15
00 05 00 29 33 24 15 13 13 13
15 15 15 14
12 14 17 16 15
15 15 15 14
14 15 15
23
00 18 08 44 47 35 23 20 19 19
24 23 24 23
19 23 36 27 23
25 23 23 24
23 24 23
31
00 30 17 60 58 43 28 25 23 23
31 31 31 31
29 33 41 34 30
33 29 31 32
31 31 31
51
00 48 46 85 87 67 40 39 35 29
49 51 52 51
45 63 62 56 49
57 45 49 51
51 50 50
200
18 73 73 200 132
113 75 62 84 43
146 116
171 200
146 116
200 75 171
120 98 171 200
132 146 200
a SE
Source
Includes breads rolls muffins bagels biscuits cornbread and tortillas = Standard error
US EPA analysis of the 1994ndash1996 CSFII
Exposure F
actors Handbook
Chapter 12mdash
Intake of Grain Products
Page E
xposure Factors H
andbook 12-26
September 2011
Table 12-18 Per Capita Intake of Sweets a Based on 1994ndash1996 1998 CSFII (gkg-day as-consumed)
Population Group Percent Consuming
Percentile Mean SE 1st 5th 10th 25th 50th 75th 90th 95th 99th Max
Whole Population Age Group lt5 months 6 to 12 months lt1 year 1 to 2 years 3 to 5 years 6 to 11 years 12 to 19 years 20 to 39 years 40 to 69 years ge70 years Season Fall Spring Summer Winter Race Asian Black American IndianAlaska Native OtherNA White Region Midwest Northeast South West Urbanization Central City Suburban Non-metropolitan
526
25 230 121 532 621 642 543 472 529 586
537 522 500 545
402 414 353 350 563
601 554 491 477
512 546 505
06
00 03 02 12 13 12 06 04 05 05
06 06 05 06
04 05 04 04 06
07 06 06 05
06 06 06
001
004 014 010 007 006 006 003 002 002 003
003 002 002 003
008 004 011 005 001
003 003 002 002
002 002 003
00
00 00 00 00 00 00 00 00 00 00
00 00 00 00
00 00 00 00 00
00 00 00 00
00 00 00
00
00 00 00 00 00 00 00 00 00 00
00 00 00 00
00 00 00 00 00
00 00 00 00
00 00 00
00
00 00 00 00 00 00 00 00 00 00
00 00 00 00
00 00 00 00 00
00 00 00 00
00 00 00
00
00 00 00 00 00 00 00 00 00 00
00 00 00 00
00 00 00 00 00
00 00 00 00
00 00 00
01
00 00 00 03 08 06 02 00 01 02
02 01 00 02
00 00 00 00 02
03 02 00 00
01 02 01
08
00 00 00 17 19 17 10 06 07 08
09 08 07 09
06 06 03 05 09
10 09 08 07
08 09 08
18
00 11 04 35 36 32 18 14 13 16
18 18 16 19
14 15 17 13 18
20 17 17 16
16 18 18
25
00 20 10 48 46 39 24 19 19 21
25 26 23 26
20 23 21 19 25
29 25 23 23
23 26 25
46
04 36 36 72 88 67 37 32 32 36
47 47 41 48
31 47 28 41 47
53 48 44 38
46 45 51
220
06 64 64 193 220 209 107
111 73 57
209 220 182 123
157 193
29 70 220
220 127 209 157
209 127 220
a SE
Source
Includes breakfast foods made with grains such as pancakes waffles and French toast = Standard error
US EPA analysis of the 1994ndash1996 CSFII
Exposure F
actors Handbook
Chapter 12mdash
Intake of Grain Products
Exposure F
actors Handbook
Page Septem
ber 2011 12-27
Table 12-19 Per Capita Intake of Snacks Containing Grains a Based on 1994ndash1996 1998 CSFII (gkg-day as-consumed)
Population Group Percent Consuming
Percentile Mean SE 1st 5th 10th 25th 50th 75th 90th 95th 99th Max
Whole Population Age Group lt5 months 6 to 12 months lt1 year 1 to 2 years 3 to 5 years 6 to 11 years 12 to 19 years 20 to 39 years 40 to 69 years ge70 years Season Fall Spring Summer Winter Race Asian Black American IndianAlaska Native OtherNA White Region Midwest Northeast South West Urbanization Central City Suburban Non-metropolitan
431
10 290 141 581 567 513 450 411 411 377
423 436 406 458
241 295 383 284 471
492 419 411 407
401 446 441
02
00 03 01 07 07 05 03 02 01 01
02 03 02 03
01 02 02 02 03
03 02 02 02
02 03 02
001
011 008 006 004 004 003 002 001 001 001
001 001 001 002
004 002 008 003 001
001 002 001 002
001 001 001
00
00 00 00 00 00 00 00 00 00 00
00 00 00 00
00 00 00 00 00
00 00 00 00
00 00 00
00
00 00 00 00 00 00 00 00 00 00
00 00 00 00
00 00 00 00 00
00 00 00 00
00 00 00
00
00 00 00 00 00 00 00 00 00 00
00 00 00 00
00 00 00 00 00
00 00 00 00
00 00 00
00
00 00 00 00 00 00 00 00 00 00
00 00 00 00
00 00 00 00 00
00 00 00 00
00 00 00
00
00 00 00 04 03 01 00 00 00 00
00 00 00 00
00 00 00 00 00
00 00 00 00
00 00 00
03
00 02 00 11 09 06 04 02 02 01
03 03 02 03
00 01 02 01 03
03 02 02 02
02 03 03
07
00 09 06 20 18 13 09 06 05 03
07 08 07 08
04 05 06 05 08
08 07 07 07
07 07 07
12
00 22 09 28 32 19 14 09 07 05
10 13 10 13
10 09 11 08 12
12 12 11 12
11 12 11
26
01 25 22 50 59 46 24 18 14 08
23 29 23 29
23 21 32 24 27
27 27 24 26
26 27 23
91
37 28 37 89 91 73 51 55 56 18
80 89 71 91
44 74 49 87 91
89 91 80 87
78 91 81
a SE
Source
Includes grain snacks such as crackers salty snacks popcorn and pretzels = Standard error
US EPA analysis of the 1994ndash1996 CSFII
Exposure F
actors Handbook
Chapter 12mdash
Intake of Grain Products
Page E
xposure Factors H
andbook 12-28
September 2011
Table 12-20 Per Capita Intake of Breakfast Foods a Based on 1994ndash1996 1998 CSFII (gkg-day as-consumed)
Population Group Percent Consuming
Percentile Mean SE 1st 5th 10th 25th 50th 75th 90th 95th 99th
Max
Whole Population Age Group lt5 months 6 to 12 months lt1 year 1 to 2 years 3 to 5 years 6 to 11 years 12 to 19 years 20 to 39 years 40 to 69 years ge70 years Season Fall Spring Summer Winter Race Asian Black American IndianAlaska Native OtherNA White Region Midwest Northeast South West Urbanization Central City Suburban Non-metropolitan
118
00 42 20 204 208 237 130
89 95 104
116 116
128 113
59 127
88 102 120
121 127 107 124
120 122 107
01
00 01 01 04 04 04 01 01 01 01
01 01 01 01
01 01 01 01 01
01 01 01 02
01 01 01
001
000 024 016 007 006 005 003 002 001 002
002 002 002 002
007 003 008 005 001
002 003 002 002
002 002 002
00
00 00 00 00 00 00 00 00 00 00
00 00 00 00
00 00 00 00 00
00 00 00 00
00 00 00
00
00 00 00 00 00 00 00 00 00 00
00 00 00 00
00 00 00 00 00
00 00 00 00
00 00 00
00
00 00 00 00 00 00 00 00 00 00
00 00 00 00
00 00 00 00 00
00 00 00 00
00 00 00
00
00 00 00 00 00 00 00 00 00 00
00 00 00 00
00 00 00 00 00
00 00 00 00
00 00 00
00
00 00 00 00 00 00 00 00 00 00
00 00 00 00
00 00 00 00 00
00 00 00 00
00 00 00
00
00 00 00 00 00 00 00 00 00 00
00 00 00 00
00 00 00 00 00
00 00 00 00
00 00 00
04
00 00 00 19 16 15 05 00 00 01
04 04 05 03
00 04 00 00 04
04 05 02 05
04 05 03
10
00 00 00 27 25 22 09 06 06 07
10 10 10 09
06 12 03 09 10
11 12 08 10
10 10 09
24
00 41 27 48 45 34 23 15 14 12
23 23 24 26
20 21 12 26 24
26 23 22 26
25 24 22
136
00 41 41 136
80 65 39 30 38 35
136
64 60 80
28 67 12 80 136
67 80 78 136
136
78 64
a SE
Source
Includes breakfast food made with grains such as pancakes waffles and French toast = Standard error
US EPA analysis of the 1994ndash1996 CSFII
Exposure F
actors Handbook
Chapter 12mdash
Intake of Grain Products
Exposure F
actors Handbook
Page Septem
ber 2011 12-29
Table 12-21 Per Capita Intake of Pasta Based on 1994ndash1996 1998 CSFII (gkg-day as-consumed) Population Group
Percent
Consuming Percentile
Mean SE 1st 5th 10th 25th 50th 75th 90th 95th 99th Max Whole Population
Age Group lt5 months 6 to 12 months lt1 year 1 to 2 years 3 to 5 years 6 to 11 years 12 to 19 years 20 to 39 years 40 to 69 years ge70 years Season Fall Spring Summer Winter Race Asian Black American IndianAlaska Native OtherNA White Region Midwest Northeast South West Urbanization Central City Suburban Non-metropolitan
130
00 75 35 160 128 134
117 139 137 90
136 132 126 126
194 70 18 96 141
121 201 95 132
134 140 103
03
00 01 01 08 06 05 03 03 02 02
03 03 03 03
05 02 01 02 03
03 05 02 03
03 03 02
002
000 022 015 015 013 012 009 004 003 006
005 005 005 006
017 010 023 009 003
005 005 005 005
005 003 005
00
00 00 00 00 00 00 00 00 00 00
00 00 00 00
00 00 00 00 00
00 00 00 00
00 00 00
00
00 00 00 00 00 00 00 00 00 00
00 00 00 00
00 00 00 00 00
00 00 00 00
00 00 00
00
00 00 00 00 00 00 00 00 00 00
00 00 00 00
00 00 00 00 00
00 00 00 00
00 00 00
00
00 00 00 00 00 00 00 00 00 00
00 00 00 00
00 00 00 00 00
00 00 00 00
00 00 00
00
00 00 00 00 00 00 00 00 00 00
00 00 00 00
00 00 00 00 00
00 00 00 00
00 00 00
00
00 00 00 00 00 00 00 00 00 00
00 00 00 00
00 00 00 00 00
00 00 00 00
00 00 00
10
00 00 00 34 21 20 08 11 10 00
12 11 09 08
20 00 00 00 11
08 19 00 09
12 12 01
22
00 10 00 62 44 38 21 22 19 13
24 23 21 21
33 17 00 20 23
21 28 18 22
25 22 15
51
00 33 23 106
84 75 42 41 36 29
47 58 52 51
66 36 24 35 53
52 59 44 57
53 53 42
291
00 67 67 167 143
119 291
112 118
77
167 147 154 291
112 291
36 154 167
167 154 291 141
291 167 141
SE
Source
= Standard error
US EPA analysis of the 1994ndash1996 CSFII
Exposure F
actors Handbook
Chapter 12mdash
Intake of Grain Products
Page E
xposure Factors H
andbook 12-30
September 2011
Table 12-22 Per Capita Intake of Cooked Cereals Based on 1994ndash1996 1998 CSFII (gkg-day as-consumed)
Population Group Percent Consuming
Percentile Mean SE 1st 5th 10th 25th 50th 75th 90th 95th 99th Max
Whole Population Age Group lt5 months 6 to 12 months lt1 year 1 to 2 years 3 to 5 years 6 to 11 years 12 to 19 years 20 to 39 years 40 to 69 years ge70 years Season Fall Spring Summer Winter Race Asian Black American IndianAlaska Native OtherNA White Region Midwest Northeast South West Urbanization Central City Suburban Non-metropolitan
104
09 166
83 184 160
87 56 62
116 245
120
91 93
111
44 201
76 76 93
96 90 124
94
116 99 97
04
01 19 09 16 13 05 02 01 03 06
04 03 03 04
02 07 03 04 03
03 03 04 04
04 03 03
004
054 118 082 029 028 017 009 005 003 007
008 006 008 008
020 010 032 030 004
007 010 006 009
008 005 007
00
00 00 00 00 00 00 00 00 00 00
00 00 00 00
00 00 00 00 00
00 00 00 00
00 00 00
00
00 00 00 00 00 00 00 00 00 00
00 00 00 00
00 00 00 00 00
00 00 00 00
00 00 00
00
00 00 00 00 00 00 00 00 00 00
00 00 00 00
00 00 00 00 00
00 00 00 00
00 00 00
00
00 00 00 00 00 00 00 00 00 00
00 00 00 00
00 00 00 00 00
00 00 00 00
00 00 00
00
00 00 00 00 00 00 00 00 00 00
00 00 00 00
00 00 00 00 00
00 00 00 00
00 00 00
00
00 00 00 00 00 00 00 00 00 00
00 00 00 00
00 00 00 00 00
00 00 00 00
00 00 00
06
00 94 00 69 53 00 00 00 09 22
11 00 00 09
00 22 00 00 00
00 00 11 00
09 00 00
23
00 161
57 107
79 40 10 11 19 34
26 20 21 25
00 44 21 20 20
21 22 26 23
26 21 23
72
00 228 228 206 161
94 43 33 44 56
81 64 69 74
53 109
58 106
61
57 59 79 80
81 69 57
725
56 228 228 339 725 241 106
92 87 106
459 209 725 445
161 339 123 725 459
459 725 317 395
725 459 269
SE
Source
= Standard error
US EPA analysis of the 1994ndash1996 CSFII
Exposure F
actors Handbook
Chapter 12mdash
Intake of Grain Products
Exposure F
actors Handbook
Page Septem
ber 2011 12-31
Table 12-23 Per Capita Intake of Ready-to-Eat Cereals a Based on 1994ndash1996 1998 CSFII (gkg-day as-consumed)
Population Group Percent Consuming
Percentile Mean SE 1st 5th 10th 25th 50th 75th 90th 95th 99th Max
Whole Population Age
lt5 months 6 to 12 months lt1 year 1 to 2 years 3 to 5 years 6 to 11 years 12 to 19 years 20 to 39 years 40 to 69 years ge70 years Season Fall Spring Summer Winter Race Asian Black American IndianAlaska Native OtherNA White Region Midwest Northeast South West Urbanization Central City Suburban Non-metropolitan
397
00 199
93 649 698 640 457 305 318 479
391 401 396 399
254 340 331 333 417
422 423 374 384
400 412 358
03
00 01 01 10 11 08 04 02 02 02
03 03 03 03
02 03 03 03 03
04 04 03 03
03 04 03
001
000 007 005 004 004 003 002 001 001 001
002 002 002 002
005 002 009 004 001
002 002 001 002
001 001 001
00
00 00 00 00 00 00 00 00 00 00
00 00 00 00
00 00 00 00 00
00 00 00 00
00 00 00
00
00 00 00 00 00 00 00 00 00 00
00 00 00 00
00 00 00 00 00
00 00 00 00
00 00 00
00
00 00 00 00 00 00 00 00 00 00
00 00 00 00
00 00 00 00 00
00 00 00 00
00 00 00
00
00 00 00 00 00 00 00 00 00 00
00 00 00 00
00 00 00 00 00
00 00 00 00
00 00 00
00
00 00 00 07 09 06 00 00 00 00
00 00 00 00
00 00 00 00 00
00 00 00 00
00 00 00
04
00 00 00 15 17 12 06 03 02 04
04 04 04 05
01 04 04 03 05
05 05 04 04
05 05 04
10
00 03 00 25 26 20 11 07 06 07
11 10 11 10
08 10 08 11 11
11 11 10 11
11 11 08
15
00 10 03 33 33 25 15 10 09 09
16 15 16 14
12 15 14 17 15
16 16 13 16
15 16 12
29
00 18 17 49 48 40 22 17 14 15
29 29 30 27
27 32 26 30 28
29 29 28 31
28 31 26
101
00 26 26 88 101
80 64 53 52 27
88 77 78 101
49 101
44 66 88
80 80 101
88
101 80 88
a SE
Source
Includes dry ready-to-eat corn rice wheat and bran cereals in the form of flakes puffs etc = Standard error
US EPA analysis of the 1994ndash1996 CSFII
Exposure F
actors Handbook
Chapter 12mdash
Intake of Grain Products
Page E
xposure Factors H
andbook 12-32
September 2011
Table 12-24 Per Capita Intake of Baby Cereals Based on 1994ndash1996 1998 CSFII (gkg-day as-consumed)
Population Group Percent Consuming
Percentile Mean SE 1st 5th 10th 25th 50th 75th 90th 95th 99th Max
Whole Population Age
lt5 months 6 to 12 months lt1 year 1 to 2 years 3 to 5 years 6 to 11 years 12 to 19 years 20 to 39 years 40 to 69 years ge70 years Season Fall Spring Summer Winter Race Asian Black American IndianAlaska Native OtherNA White Region Midwest Northeast South West Urbanization Central City Suburban Non-metropolitan
10
408 678 534
62 03 01 00 00 01 00
09 12 08 11
07 10 06 17 10
11 12 09 09
11 11 08
00
08 25 16 02 00 00 00 00 00 00
00 00 00 00
00 00 00 01 00
00 00 00 00
00 00 00
003
024 045 027 010 006 000 000 000 000 000
007 005 006 006
004 012 004 020 003
008 004 005 006
006 004 006
00
00 00 00 00 00 00 00 00 00 00
00 00 00 00
00 00 00 00 00
00 00 00 00
00 00 00
00
00 00 00 00 00 00 00 00 00 00
00 00 00 00
00 00 00 00 00
00 00 00 00
00 00 00
00
00 00 00 00 00 00 00 00 00 00
00 00 00 00
00 00 00 00 00
00 00 00 00
00 00 00
00
00 00 00 00 00 00 00 00 00 00
00 00 00 00
00 00 00 00 00
00 00 00 00
00 00 00
00
00 08 02 00 00 00 00 00 00 00
00 00 00 00
00 00 00 00 00
00 00 00 00
00 00 00
00
10 28 17 00 00 00 00 00 00 00
00 00 00 00
00 00 00 00 00
00 00 00 00
00 00 00
00
24 69 41 00 00 00 00 00 00 00
00 00 00 00
00 00 00 00 00
00 00 00 00
00 00 00
00
31 113
73 08 00 00 00 00 00 00
00 00 00 00
00 00 00 00 00
00 00 00 00
00 00 00
01
88 211 197
58 00 00 00 00 00 00
00 06 00 03
00 00 00 12 00
03 05 00 00
03 01 00
376
266 376 376 125
38 01 00 00 03 00
211 266 260 376
21 376
09 266 260
211 125 376 266
376 211 260
SE
Source
= Standard error
US EPA analysis of the 1994ndash1996 CSFII
Exposure F
actors Handbook
Chapter 12mdash
Intake of Grain Products
Exposure F
actors Handbook
Page Septem
ber 2011 12-33
Table 12-25 Quantity (as-consumed) of Grain Products Consumed per Eating Occasion and the Percentage of Individuals Using These Foods in 2 Days
Indiv Using Quantity Consumed per Consumers Only Food at Least Eating Occasion Quantity Consumed per Eating Occasion at Specified Percentiles
Food Category Once in 2 days (grams) (grams) Average SE 5th 10th 25th 50th 75th 90th 95th
White bread 596 50 1 21 24 33 46 52 78 104 Whole grain and wheat bread 281 50 1 24 25 37 50 56 72 92 Rolls 480 58 1 27 33 43 48 70 89 110 Biscuits 109 61 1 19 19 35 57 76 104 139 Tortillas 155 60 1 14 21 32 48 79 107 135 Quick breads and muffins 125 82 2 21 28 52 60 94 142 187 Doughnuts and sweet rolls 124 77 1 26 36 47 65 93 133 164 Crackers 174 26 1 6 9 12 18 30 47 62 Cookies 307 40 1 9 12 20 31 50 75 96 Cake 162 92 3 22 28 41 77 116 181 217 Pie 85 150 3 52 72 102 143 168 246 300 Pancakes and waffles 103 85 3 21 35 42 75 109 158 205 Cooked cereal 103 248 6 81 117 157 233 291 455 484 Oatmeal 61 264 6 116 117 176 232 333 454 473 Ready-to-eat cereal 406 54 1 18 24 30 46 67 93 113 Corn flakes 81 46 1 17 22 25 37 56 75 100 Toasted oat rings 68 42 1 14 16 27 38 54 65 83 Rice 280 150 3 27 40 76 131 192 312 334 Pasta 360 162 3 26 43 73 133 210 318 420 Macaroni and cheese 85 244 9 53 81 121 191 324 477 556 Spaghetti with tomato sauce 80 436 15 122 124 246 371 494 740 983 Pizza 199 169 5 36 52 78 140 214 338 422 SE = Standard error
Source Smiciklas-Wright et al (2002) (based on 1994ndash1996 CSFII data)
Exposure F
actors Handbook
Chapter 12mdash
Intake of Grain Products
Page E
xposure Factors H
andbook 12-34
September 2011
Table 12-26 Quantity (as-consumed) of Grain Products Consumed per Eating Occasion and Percentage of Individuals Using These Foods in 2 Days by Sex and Age
Food Category
Quantity Consumed per Eating Occasion (grams) 2 to 5 years 6 to 11 years 12 to 19 years
Males and Females (N = 2109)
Males and Females Males (N = 1432) (N = 696)
Females (N = 702)
PC Mean SE PC Mean SE PC Mean SE PC Mean SE White bread
Whole grain and wheat bread Rolls Biscuits
Tortillas Quick breads and muffins
Doughnuts and sweet rolls Crackers
Cookies Cake
Pie Pancakes and waffles Cooked cereal
Oatmeal Ready-to-eat cereal Corn flakes Toasted oat rings Rice
Pasta Macaroni and cheese Spaghetti with tomato sauce
Pizza Corn chips
Popcorn
669 243 400
83 146
96 113
254 510 146
29 191 168 104 729
112 206 296 494 178 168 237 196
116
34 37 39 38 32 55 59 17 28 70 76 49
211 221
33 33 30 84 90 159 242
86 29 20
a
1 1 2 2 4 2 1 1 3 8 1
10 9 1 2 1 3 3 8 11 3 2 1
671 205 535
97 164
96 134 172 467 197
56 215
90 57 673 131 125 246 414 132
115 328 256 127
42 44 48 48 47 67 69 26 37 79
116 77 245 256
47 42 45 124 130 217 322 108
33 31
1 1 1 3 2 5 2 2 2 4 8 3
14 19
1 2 2 6 5
13 18
6 2 2
613 145 619 122 229
110 173 106 290 151
66 135
52 24 456 104
73 242 334
75 101 396 269
78
56 60 69 72 76 125 102
39 53 99 188
96 310b
348b
72 62 62 203 203 408 583 205
58 54
1 2 2 4 5
12 12
5 3 9
15 6
29b
45b
3 4 5
10 9
46 46 13
5 5
579 176 488 103 201
110 138 142 318 155
48 82 60 23 463
87 81 288 378 107
85 305 251 105
47 53 51 55 56 79 78 26 42 85
138b
74 256b
321b
52 49 42 157 155 260 479 143
44 37
1 2 1 4 3
10 5 3 2 8
12b
5 31b
40b
2 4 3
10 9
30 51
8 3 4
Exposure F
actors Handbook
Chapter 12mdash
Intake of Grain Products
Exposure F
actors Handbook
Page Septem
ber 2011 12-35
Exposure F
actors Handbook
Chapter 12mdash
Intake of Grain Products
Page E
xposure Factors H
andbook 12-36
September 2011
Table 12-26 Quantity (as-consumed) of Grain Products Consumed per Eating Occasion and Percentage of Individuals Using These Foods in 2 Days by Sex and Age (continued)
Food Category
Quantity Consumed per Eating Occasion (g) 20 to lt40 years 40 to lt60 years gt60 years
Males Females (N = 1543) (N = 1449)
Males Females (N = 1663) (N = 1694)
Males Females (N = 1545) (N = 1429)
PC Mean SE PC Mean SE PC Mean SE PC Mean SE PC Mean SE PC Mean SE White bread
Whole grain and wheat bread Rolls Biscuits
Tortillas Quick breads and muffins
Doughnuts and sweet rolls Crackers
Cookies Cake
Pie Pancakes and waffles Cooked cereal
Oatmeal Ready-to-eat cereal Corn flakes Toasted oat rings Rice
Pasta Macaroni and cheese
Spaghetti with tomato sauce Pizza
Corn chips Popcorn
630 253 620
115 206
80 133
119 208 135
58 80 52 27 269
65 42 308 371
78 86 237 162
81
63 63 73 73 79 93 94 36 56
113 161 126 313 360a
77 73 62 199 214 301 630 253
61 63
2 1 4 3 4 7 5 3 4 6 7
15 30 42a
3 6 4 9 8
19 48 12
5 6
549 252 464
94 201
113 112
156 265 149
72 74 73 37 347
53 54 321 371
78 78 202 179
97
47 48 53 55 53 79 68 28 39 94 150
80 219 258
55 43 42 139 155 235 385 150
35 35
1 1 1 2 2 5 2 2 2 7 9 6 11
17 1 2 2 6 6
19 22
6 2 2
597 328 479 134 134 157 134 166 276 165
118 75 97 60 298
59 48 294 343
61 55 130 128
96
59 57 65 80 67 93 88 30 47 108 162
117 300 332
68 49 46 167 208 302 543 220
47 50
2 1 1 3 3 7 4 1 2 6 6 8
16 16
2 3 2 5 7
31 59 13
4 4
553 323 434
112 127 149
110 175 290 168
99 80 103
62 297
52 41 288 347
60 54 145 120 109
46 46 52 56 52 72 72 24 36 83 151
74 243 242
51 40 35 130 140 210 386 147
33 39
1 2 1 2 2 4 4 1 1 4 8 5 11
10 1 3 2 4 5
12 18
8 2 3
593 398 378 130
42 174
114 256 297 192 164 108 209 136 446 124
43 231 279
71 50 53 48 61
51 48 54 58 47 86 65 23 40 85 154
99 255 257
53 37 36 147 167 230 450 187
30 52
1 1 1 3 4 5 2 1 2 4 7 5 8
10 1 2 3 6 7
13 22 18
3 4
548 431 306
98 54 183 104 259 322 183 133
82 202 129 440 104
49 214 279
65 45 47 53 76
41 41 43 48 41 72 56 17 30 87 137
68 216 224
41 30 27
118 132 215 379 109
21 34
1 1 1 3 2 4 2 1 1 7 5 4 8
10 1 1 2 5 5
18 33
8 2 3
a Indicates a SE value that is greater than 0 but less than 05 b Indicates a statistic that is potentially unreliable because of small sample size or large coefficient of variation N = Sample size
PC = Percent consuming at least once in 2 days SE = Standard error of the mean
Source Smiciklas-Wright et al (2002) (based on 1994ndash1996 CSFII data)
Exposure Factors Handbook
Chapter 12mdashIntake of Grain Products
Table 12-27 Consumption of Major Food Groups by Older Adults Median Daily Servings (and ranges) by Demographic and Health Characteristics
Subject Characteristic N Bread Cereal Rice and Pasta (servingsday) Sex a
Females 80 27 (09ndash65) Males 50 36 (14ndash73)
Ethnicity African American 44 33 (14ndash64) European American 47 32 (09ndash68) Native American 39 29 (11ndash73)
Age 70 to 74 years 42 33 (11ndash63) 75 to 79 years 36 30 (09ndash68) 80 to 84 years 36 32 (15ndash64) gt85 years 16 36 (16ndash73)
Marital Status Married 49 33 (11ndash58) Not Married 81 30 (09ndash73)
Education 8th grade or less 37 31 (11ndash73) 9th to 12th grades 47 33 (11ndash68) gtHigh School 46 32 (09ndash65)
Dentures Yes 83 33 (11ndash64) No 47 31 (09ndash73)
Chronic Diseases 0 7 41 (22ndash64) 1 31 33 (09ndash73) 2 56 31 (11ndash58) 3 26 37 (11ndash58) gt4 10 29 (14ndash53)
Weightb
le130 pounds 18 31 (11ndash54) 131 to 150 pounds 32 33 (09ndash52) 151 to 170 pounds 27 31 (14ndash73) 171 to 190 pounds 22 36 (14ndash62) ge191 pounds 29 30 (11ndash68)
a p lt 005 b 2 missing values N = Number of subjects
Source Vitolins et al (2002)
Exposure Factors Handbook Page September 2011 12-37
Exposure Factors Handbook
Chapter 12mdashIntake of Grain Products
Table 12-28 Characteristics of the Feeding Infant and Toddlers Study (FITS) Sample Population Sample Size Percentage of Sample
Sex Males Females
1549 1473
513 487
Age of Child 4 to 6 months 7 to 8 months 9 to 11 months 12 to 14 months 15 to 18 months 19 to 24 months
862 483 679 374 308 316
285 160 225 124 102 104
Childrsquos Ethnicity Hispanic or Latino Non-Hispanic or Latino Missing
367 2641
14
121 874 05
Childrsquos Race White Black Other
2417 225 380
800 74 126
Urbanicity Urban Suburban Rural Missing
1389 1014 577 42
460 336 191 13
Household Income Under $10000 $10000 to $14999 $15000 to $24999 $25000 to $34999 $35000 to $49999 $50000 to $74999 $75000 to $99999 $100000 and Over Missing
48 48
221 359 723 588 311 272 452
16 16 73 119 239 195 103 90 149
Receives WIC Yes No Missing
821 2196
5
272 726 02
Sample Size (Unweighted) 3022 1000 WIC = Special Supplemental Nutrition Program for Women Infants and Children
Source Devaney et al (2004)
Page Exposure Factors Handbook 12-38 September 2011
Table 12-29 Percentage of Infants and Toddlers Consuming Different Types of Grain Products Percentage of Infants and Toddlers Consuming at Least Once in a Day
Food GroupFood 4 to 6 7 to 8 9 to 11 12 to 14 15 to 18 19 to 24 Months Months Months Months Months Months
Any Grain or Grain Product 658 915 975 978 986 992 Infant Cereals 648 812 638 239 92 31 Non-infant Cerealsa 06 183 443 589 605 519
Not Pre-sweetened 05 170 370 445 406 319 Pre-sweetenedb 00 18 90 177 264 227
Breads and Rollsc 06 99 245 473 527 531 Crackers Pretzels Rice Cakes 30 162 334 452 464 447 Cereal or Granola Bars 00 11 34 98 100 97 Pancakes Waffles French Toast 01 08 75 151 161 154 Rice and Pastad 23 45 182 262 390 359 Other 02 01 27 28 25 45 Grains in Mixed Dishes 04 53 241 483 520 551 Sandwiches 00 11 86 215 258 258 Burrito Taco Enchilada Nachos 00 00 10 45 28 21 Macaroni and Cheese 02 16 49 146 150 150 Pizza 01 07 22 68 90 94 Pot PieHot Pocket 00 09 05 20 10 18 Spaghetti Ravioli Lasagna 01 18 99 153 121 88 a Includes both ready-to-eat and cooked cereals b Defined as cereals with more than 211 grams sugar per 100 grams c Does not include bread in sandwiches Sandwiches are included in mixed dishes d Does not include rice or pasta in mixed dishes
Source Fox et al (2004)
Exposure Factors Handbook
Chapter 12mdashIntake of Grain Products
Exposure Factors Handbook Page September 2011 12-39
Table 12-30
a Characteristics of Women Infants and Children (WIC) Participants and Non-Participants (percentages)
Infants 4 to 6 month Infants 7 to 11 month Toddlers 12 to 24 month WIC
Participant Non-Participant WIC
Participant Non-Participant WIC
Participant Non-Participant Sex Males 55 Females 45
Childrsquos Ethnicity Hispanic or Latino 20 Non-Hispanic or Latino 80
Childrsquos Race White 69 Black 15 Other 22
Child in Daycare Yes 39 No 61 Age of Mother 14 to 19 years 18 20 to 24 years 33 25 to 29 years 29 30 to 34 years 9 gt35 years 9 Missing 2
Motherrsquos Education 11th Grade or Less 23 Completed High School 35 Some Postsecondary 33 Completed College 7 Missing 2
Parentrsquos Marital Status Married 49 Not Married 50 Missing 1
Mother or Female Guardian Works Yes 46 No 53 Missing 1
54 46
b
11 89
b 84
4 11
38 62
b 1
13 29 33 23
2 b 2
19 26 53
1 b
93 7 1
51 48
1
55 45
24 76
63 17 20
34 66
13 38 23 15
11 1 15 42 32
9 2 57 42
1 45 54
1
51 49
b 8
92 b
86 5 9 b
46 54
b 1 11
30 36 21
1 b 2
20 27 51
0 b
93 7 0 b
60 40
0
57 43
22 78
67 13 20
43 57
9
33 29 18
11 0
17 42 31
9 1
58 41
1
55 45
0
52 48
b 10 89
b 84
5 11
c
53 47
b 1
14 26 34 26
1 b 3
19 28 48
2 b
88 11 1
c
61 38
1
Exposure Factors Handbook
Chapter 12mdashIntake of Grain Products
Page Exposure Factors Handbook 12-40 September 2011
c
Table 12-30 Characteristics of Women Infants and Children (WIC) Participants and Non-Participantsa
(percentages) (continued) Infants 4 to 6 months Infants 7 to 11 months Toddlers 12 to 24 months
WIC WIC WIC Participant Non-Participant Participant Non-Participant Participant Non-Participant
Urbanicity c c c
Urban 34 55 37 50 35 48 Suburban 36 31 31 34 35 35 Rural 28 13 30 15 28 16 Missing 2 1 2 1 2 2
Sample Size (Unweighted) 265 597 351 808 205 791 a χ2 tests were conducted to test for statistical significance in the differences between WIC participants and nonshy
participants within each age group for each variable The results of χ2 tests are listed next to the variable under the column labeled non-participants for each of the three age groups
b = p lt 005 non-participants significantly different from WIC participants on the variable = p lt 001 non-participants significantly different from WIC participants on the variable
WIC = Special Supplemental Nutrition Program for Women Infants and Children
Source Ponza et al (2004)
Table 12-31 Food Choices for Infants and Toddlers by Women Infants and Children (WIC) Participation Status
Infants 4 to 6 months Infants 7 to 11 months Toddlers 12 to 24 months WIC Non- WIC Non- WIC Non-
Participant Participant Participant Participant Participant Participant 697 Infant Cereals 697 625 747 135 92
Non-infant Cereals Total 09 05 217 385a 581 560
Not Pre-sweetened 05 05 187 329a 437 363 Pre-sweetened 00 00 40 69 177 241
Grains in Combination Foods 09 01 188 147 503 529 Sample Size (unweighted) 265 597 351 808 205 791 a = p lt 001 non-participants significantly different from WIC participants WIC = Special Supplemental Nutrition Program for Women Infants and Children
Source Ponza et al (2004)
Exposure Factors Handbook
Chapter 12mdashIntake of Grain Products
Exposure Factors Handbook Page September 2011 12-41
Table 12-32 Average Portion Sizes per Eating Occasion of Grain Products Commonly Consumed by Infants From the 2002 Feeding Infants and Toddlers Study
4 to 5 months 6 to 8 months 9 to 11 months Reference Food Group (N = 624) (N = 708) (N = 687) Unit Mean plusmn SE Infant cereal dry tablespoon 31 plusmn 014 45 plusmn 014 52 plusmn 018 Infant cereal jarred tablespoon - 56 plusmn 026 74 plusmn 034 Ready-to-eat cereal tablespoon - 23 plusmn 034 34 plusmn 021 Crackers ounce - 02 plusmn 002 03 plusmn 001 Crackers saltine - 22 plusmn 014 27 plusmn 012 Bread slice - 05 plusmn 010 08 plusmn 006 - = Cell size was too small to generate a reliable estimate N = Number of respondents SE = Standard error of the mean
Source Fox et al (2006)
Exposure Factors Handbook
Chapter 12mdashIntake of Grain Products
Table 12-33 Average Portion Sizes per Eating Occasion of Grain Products Commonly Consumed by Toddlers From the 2002 Feeding Infants and Toddlers Study
Food Group Reference Unit 12 to 14 months
(N = 371) 15 to 18 months
(N = 312) 19 to 24 months (N = 320)
Mean plusmn SE Bread slice 08 plusmn 004 09 plusmn 005 09 plusmn 005 Rolls ounce 09 plusmn 011 10 plusmn 010 09 plusmn 015 Ready-to-eat cereal cup 03 plusmn 002 05 plusmn 003 06 plusmn 004 Hot cereal prepared cup 06 plusmn 005 06 plusmn 005 07 plusmn 005 Crackers ounce 03 plusmn 002 04 plusmn 002 04 plusmn 002 Crackers saltine 33 plusmn 022 35 plusmn 022 37 plusmn 022 Pasta cup 04 plusmn 004 04 plusmn 004 05 plusmn 005 Rice cup 03 plusmn 004 04 plusmn 005 04 plusmn 005 Pancakes and waffles 1 (4-inch diameter) 10 plusmn 008 14 plusmn 021 14 plusmn 017 N = Number of respondents SE = Standard error of the mean
Source Fox et al (2006)
Page Exposure Factors Handbook 12-42 September 2011
c
Table 12-34 Percentage of Hispanic and Non-Hispanic Infants and Toddlers Consuming Different Types of Grain Products on a Given Day Age 4 to 5 months Age 6 to 11 months Age 12 to 24 months
Hispanic Non-Hispanic Hispanic Non-Hispanic Hispanic Non-Hispanic (N = 84) (N = 538) (N = 163) (N = 1228) (N = 124) (N = 871)
Any Grain or Grain Product Infant Cereal Non-infant Cereal Breadsb
Tortillas Crackers Pretzels Rice Cakes Pancakes Waffles French Toast Rice and Pastad
Rice Grains in Mixed Dishes
Sandwiches Burrito Taco Enchilada Nachos
565 552
-14c
14c
13c
------
569 565
----------
950 741 185a
182 40c
278 14c
201a
159e
159 40c
13c
935 736 292 151
-225 43
103 47
130 46 -
971 159 453 440 67a c
356 130 443
269a c
388a
242 21c
989 93
578 529 06c
469 160 329 130 544 249 30
Macaroni and Cheese - - 30c 31 101 155
Pizza - - - 14 10c e 97
Spaghetti Ravioli Lasagna - - 83c 46 93c 121 a = Significantly different from non-Hispanic at p lt 005 b Does not include bread in sandwiches Sandwiches are included in mixed dishes Includes tortillas also shown
separately = Statistic is potentially unreliable because of a high coefficient of variation
d Does not include rice or pasta in mixed dishes Includes rice (eg white brown wild and Spanish rice without meat) and pasta (eg spaghetti macaroni and egg noodles) Rice is also shown separately
e = Significantly different from non-Hispanic at p lt 001 - = Less than 1 of the group consumed this food on a given day N = Sample size
Source Mennella et al (2006)
Exposure Factors Handbook
Chapter 12mdashIntake of Grain Products
Exposure Factors Handbook Page September 2011 12-43
Exposure Factors Handbook
Chapter 12mdashIntake of Grain Products
Table 12-35 Mean Moisture Content of Selected Grain Products Expressed as Percentages of Edible Portions (grams per 100 grams of edible portion)
Food Moisture Content Comments Raw Cooked Barley―pearled 1009 6880 Corn―grain―endosperm 1037 -Corn―grain―bran 471 - crude Millet 867 7141 Oats 822 -Rice―white―long-grained 1162 6844 Rye 1095 -Rye―flour―medium 985 -Sorghum 920 -Wheat―hard white 957 -Wheat―germ 1112 - crude Wheat―bran 989 - crude Wheat―flour―whole grain 1027 -- Indicates that the grain product was not assessed for water content under these conditions
Source USDA (2007)
Page Exposure Factors Handbook 12-44 September 2011
- TABLE OF CONTENTS
- LIST OF TABLES
- 12 INTAKE OF GRAIN PRODUCTS
-
- 121 INTRODUCTION
- 122 RECOMMENDATIONS
- 123 INTAKE STUDIES
-
- 1231 Key Grain Intake Study
-
- 12311 US EPA Analysis of Consumption Data From 2003minus2006 National Health and Nutrition Examination Survey (NHANES)
-
- 1232 Relevant Grain Intake Studies
-
- 12321 USDA (1996a b 1993 1980)mdashFood and Nutrient Intakes of Individuals in 1 Day in the United States
- 12322 USDA (1999b)mdashFood Consumption Prices and Expenditures 1970minus1997
- 12323 USDA (1999a)mdashFood and Nutrient Intakes by Children 1994minus1996 1998 Table Set 17
- 12324 US EPA Analysis of Continuing Survey of Food Intake by Individuals (CSFII) 1994minus1996 1998
- 12325 Smiciklas-Wright et al (2002)mdashFoods Commonly Eaten in the United States Quantities Consumed per Eating Occasion and in a Day 1994minus1996
- 12326 Vitolins et al (2002)mdashQuality of Diets Consumed by Older Rural Adults
- 12327 Fox et al (2004)mdashFeeding Infants and Toddlers Study What Foods Are Infants and Toddlers Eating
- 12328 Ponza et al (2004)mdashNutrient Food Intakes and Food Choices of Infants and Toddlers Participating in WIC
- 12329 Fox et al (2006)mdashAverage Portion of Foods Commonly Eaten by Infants and Toddlers in the United States
- 123210 Mennella et al (2006)mdashFeeding Infants and Toddlers Study The Types of Foods Fed to Hispanic Infants and Toddlers
-
- 124 CONVERSION BETWEEN WET- AND DRY-WEIGHT INTAKE RATES
- 125 REFERENCES FOR CHAPTER 12
-

Exposure Factors Handbook
Chapter 12mdashIntake of Grain Products The US EPA analysis of data from the
2003minus2006 National Health and Nutrition Examination Survey (NHANES) was used in selecting recommended intake rates The US EPA analysis was conducted using childhood age groups that differed slightly from US EPArsquos Guidance on Selecting Age Groups for Monitoring and Assessing Childhood Exposures to Environmental Contaminants (US EPA 2005) However for the purposes of the recommendations presented here data were placed in the standardized age categories closest to those used in the analysis
The NHANES data on which the recommendations are based are short-term survey data and may not necessarily reflect the long-term
distribution of average daily intake rates However because broad categories of food (ie total grains) are eaten on a daily basis throughout the year with minimal seasonality the short-term distribution may be a reasonable approximation of the long-term distribution although it will display somewhat increased variability This implies that the upper percentiles shown here will tend to overestimate the corresponding percentiles of the true long-term distribution In general the recommended values based on US EPArsquos analysis of NHANES data represent the uncooked weight of the edible portion of grain products
Table 12-1 Recommended Values for Intake of Grains Edible Portion Uncookeda
Age Group (years) Per Capita Consumers Only
Multiple Percentiles Source Mean 95th Percentile Mean 95th Percentile
gkg-day gkg-day gkg-day gkg-day Total Grains
Birth to 1 31 95b 41 103b
See Table 12-3 and Table 12-4
US EPA Analysis of
NHANES 2003ndash 2006
1 to lt2 64 124b 64 124b
2 to lt3 64 124b 64 124b
3 to lt6 62 111 62 111 6 to lt11 44 82 44 82 11 to lt16 24 50 24 50 16 to lt21 24 50 24 50 20 to lt50 22 46 22 46 gt50 17 35 17 35
Individual Grain ProductsmdashSee Table 12-5 and Table 12-6 a Analysis was conducted using slightly different childhood age groups than those recommended in Guidance on
Selecting Age Groups for Monitoring and Assessing Childhood Exposures to Environmental Contaminants (US EPA 2005) Data were placed in the standardized age categories closest to those used in the analysis
b Estimates are less statistically reliable based on guidance published in the Joint Policy on Variance Estimation and Statistical Reporting Standards on NHANES III and CSFII Reports NHISNCHS Analytical Working Group Recommendations (NCHS 1993)
Page Exposure Factors Handbook 12-2 September 2011
Exposure Factors Handbook
Chapter 12mdashIntake of Grain Products
Table 12-2 Confidence in Recommendations for Intake of Grain Products General Assessment Factors Rationale Rating Soundness
Adequacy of Approach
Minimal (or defined) Bias
The survey methodology and data analysis were adequate The survey sampled more than 16000 individuals An analysis of primary data was conducted
No physical measurements were taken The method relied on recent recall of grain products eaten
High
Applicability and Utility Exposure Factor of Interest
Representativeness
Currency
Data Collection Period
The key study was directly relevant to grain intake
The data were demographically representative of the US population (based on stratified random sample)
Data were collected between 2003 and 2006
Data were collected for two non-consecutive days
High
Clarity and Completeness Accessibility
Reproducibility
Quality Assurance
The NHANES data are publicly available
The methodology used was clearly described enough information was included to reproduce the results
NHANES follows strict QAQC procedures The US EPA analysis has only been reviewed internally but the methodology has been used in an analysis of previous data
High
Variability and Uncertainty Variability in Population
Minimal Uncertainty
Full distributions were provided for total grains Means were provided for individual grain products
Data collection was based on recall for a two-day period the accuracy of using these data to estimate long-term intake (especially at the upper percentiles) is uncertain However use of short-term data to estimate chronic ingestion can be assumed for broad categories of foods such as total grains Uncertainty is greater for individual grain products
Medium to high for averages low for long-term upper percentiles low for
individual foods
Evaluation and Review Peer Review
Number and Agreement of Studies
The NCHS NHANES survey received a high level of peer review The US EPA analysis of these data has not been peer reviewed outside the Agency but the methodology has been used in an analysis of previous data
There was one key study
Medium
Overall Rating Medium to High confidence in the averages Low confidence in the long-
term upper percentiles
Exposure Factors Handbook Page September 2011 12-3
Exposure Factors Handbook
Chapter 12mdashIntake of Grain Products 123 INTAKE STUDIES 1231 Key Grain Intake Study 12311 US EPA Analysis of Consumption Data
From 2003minus2006 National Health and Nutrition Examination Survey (NHANES)
The key source of recent information on consumption rates of grain products is the US Centers for Disease Control and Preventionrsquos National Center for Health Statisticsrsquo (NCHS) NHANES Data from NHANES 2003minus2006 have been used by the US EPA Office of Pesticide Programs (OPP) to generate per capita and consumer-only intake rates for both individual grain products and total grain products
NHANES is designed to assess the health and nutritional status of adults and children in the United States In 1999 the survey became a continuous program that interviews a nationally representative sample of approximately 7000 persons each year and examines a nationally representative sample of about 5000 persons each year located in counties across the country 15 of which are visited each year Data are released on a 2-year basis thus for example the 2003 data are combined with the 2004 data to produce NHANES 2003minus2004
The dietary interview component of NHANES is called What We Eat in America and is conducted by the US Department of Agriculture (USDA) and the US Department of Health and Human Services (DHHS) DHHSrsquo NCHS is responsible for the sample design and data collection and USDArsquos Food Surveys Research Group is responsible for the dietary data collection methodology maintenance of the databases used to code and process the data and data review and processing Beginning in 2003 2 non-consecutive days of 24-hour intake data were collected The first day was collected in-person and the second day was collected by telephone 3 to 10 days later These data were collected using USDArsquos dietary data collection instrument the Automated Multiple Pass Method This method provides an efficient and accurate means of collecting intakes for large-scale national surveys It is fully computerized and uses a five-step interview Details can be found at USDArsquos Agriculture Research Service (httpwwwarsusdagovbabhnrcfsrg)
For NHANES 2003minus2004 there were 12761 persons selected of these 9643 were considered respondents to the mobile examination center (MEC) examination and data collection However only 9034 of the MEC respondents provided complete dietary intakes for Day 1 Furthermore of those providing the Day 1 data only
8354 provided complete dietary intakes for Day 2 For NHANES 2005minus2006 there were 12862 persons selected of these 9950 were considered respondents to the MEC examination and data collection However only 9349 of the MEC respondents provided complete dietary intakes for Day 1 Furthermore of those providing the Day 1 data only 8429 provided complete dietary intakes for Day 2
The 2003minus2006 NHANES surveys are stratified multistage probability samples of the civilian non-institutionalized US population The sampling frame was organized using 2000 US population census estimates NHANES oversamples low income persons adolescents 12 to 19 years persons 60 years and older African Americans and Mexican Americans Several sets of sampling weights are available for use with the intake data By using appropriate weights data for all 4 years of the surveys can be combined Additional information on NHANES can be obtained at httpwwwcdcgovnchsnhaneshtm
In 2010 US EPA OPP used NHANES 2003minus2006 data to update the Food Commodity Intake Database (FCID) that was developed in earlier analyses of data from the USDArsquos Continuing Survey of Food Intake by Individuals (CSFII) (US EPA 2000 USDA 2000) (see Section 12324) NHANES data on the foods people reported eating were converted to the quantities of agricultural commodities eaten Agricultural commodity is a term used by US EPA to mean plant (or animal) parts consumed by humans as food when such items are raw or unprocessed they are referred to as raw agricultural commodities For example an apple pie may contain the commodities apples flour fat sugar and spices FCID contains approximately 558 unique commodity names and 8-digit codes The FCID commodity names and codes were selected and defined by US EPA and were based on the US EPA Food Commodity Vocabulary (httpwwwepagovpesticidesfoodfeed)
Intake rates were generated for a variety of food itemsgroups based on the agricultural commodities included in the FCID These intake rates represent intake of all forms of the product (eg both home produced and commercially produced) for individuals who provided data for two days of the survey Note that if the person reported consuming food for only one day their two-day average would be half the amount reported for the one day of consumption Individuals who did not provide information on body weight or for whom identifying information was unavailable were excluded from the analysis Two-day average intake rates were calculated for all individuals in the database for each of the food
Page Exposure Factors Handbook 12-4 September 2011
Exposure Factors Handbook
Chapter 12mdashIntake of Grain Products itemsgroups These average daily intake rates were divided by each individuals reported body weight to generate intake rates in units of grams per kilogram of body weight per day (gkg-day) The data were weighted according to the 4-year 2-day sample weights provided in NHANES 2003minus2006 to adjust the data for the sample population to reflect the national population
Summary statistics were generated on a consumer-only and on a per capita basis Summary statistics including number of observations percentage of the population consuming the grains being analyzed mean intake rate and standard error of the mean intake rate were calculated for total grains and selected individual grains Percentiles of the intake rate distribution (ie 1st 5th 10th 25th 50th 75th 90th 95th 99th and the maximum value) were also provided for total grains Data were provided for the following age groups birth to 1 year 1 to 2 years 3 to 5 years 6 to 12 years 13 to 19 years 20 to 49 years and ge50 years Data on females 13 to 49 years were also provided Because these data were developed for use in US EPArsquos pesticide registration program the childhood age groups used are slightly different than those recommended in US EPArsquos Guidance on Selecting Age Groups for Monitoring and Assessing Childhood Exposures to Environmental Contaminants (US EPA 2005)
Table 12-3 presents per capita intake data for total grains in gkg-day Table 12-4 provides consumer-only intake data for total grains in gkg-day Table 12-5 provides per capita intake data for individual grains in gkg-day and Table 12-6 provides consumer-only intake data for individual grains in gkg-day In general these data represent intake of the edible portions of ie uncooked foods
The results are presented in units of gkg-day Thus use of these data in calculating potential dose does not require the body-weight factor to be included in the denominator of the average daily dose (ADD) equation It should be noted that converting these intake rates into units of gday by multiplying by a single average body weight is inappropriate because individual intake rates were indexed to the reported body weights of the survey respondents Also it should be noted that the distribution of average daily intake rates generated using short-term data (eg 2-day) does not necessarily reflect the long-term distribution of average daily intake rates The distributions generated from short-term and long-term data will differ to the extent that each individualrsquos intake varies from day to day the distributions will be similar to the extent that individualsrsquo intakes are constant from day to day Day-to-day variation in intake among individuals will
be high for grains that are not typically eaten every day For these grains the intake distribution generated from short-term data will not be a good reflection of the long-term distribution On the other hand for broad categories of foods (eg total grains) that are eaten on a daily basis throughout the year the short-term distribution may be a reasonable approximation of the true long-term distribution although it will show somewhat more variability In this chapter distributions are provided for broad categories of grains (eg total grains) Because of the increased variability of the short-term distribution the short-term upper percentiles shown here may overestimate the corresponding percentiles of the long-term distribution For individual foods only the mean standard error and percent consuming are provided An advantage of using the US EPArsquos analysis of NHANES data is that it provides distributions of intake rates for various age groups of children and adults normalized by body weight The data set was designed to be representative of the US population and includes 4 years of intake data combined Another advantage is the currency of the data the NHANES data are from 2003minus2006 However short-term dietary data may not accurately reflect long-term eating patterns and may under-represent infrequent consumers of a given food This is particularly true for the tails (extremes) of the distribution of food intake Because these are 2-day averages consumption estimates at the upper end of the intake distribution may be underestimated if these consumption values are used to assess acute (ie short-term) exposures Also the analysis was conducted using slightly different childhood age groups than those recommended in US EPArsquos Guidance on Selecting Age Groups for Monitoring and Assessing Childhood Exposures to Environmental Contaminants (US EPA 2005) However given the similarities in the age groups used the data should provide suitable intake estimates for the age groups of interest
1232 Relevant Grain Intake Studies 12321 USDA (1996a b 1993 1980)mdashFood and
Nutrient Intakes of Individuals in 1 Day in the United States
USDA calculated mean per capita intake rates for total and individual grain products using Nationwide Food Consumption Survey (NFCS) data from 1977minus1978 and 1987minus1988 (USDA 1993 1980) and CSFII data from 1994 and 1995 (USDA 1996a b) The mean per capita intake rates for grain products are presented in Table 12-7 and Table 12-8 for the two NFCS survey years respectively Table 12-9
Exposure Factors Handbook Page September 2011 12-5
Exposure Factors Handbook
Chapter 12mdashIntake of Grain Products presents similar data from the 1994 and 1995 CSFII for grain products
The advantages of using these data are that they provide mean intake estimates for various grain products The consumption estimates are based on short-term (ie 1-day) dietary data which may not reflect long-term consumption These data are based on older surveys and may not be entirely representative of current eating patterns
12322 USDA (1999b)mdashFood Consumption Prices and Expenditures 1970minus1997
The USDAs Economic Research Service calculates the amount of food available for human consumption in the United States annually Supply and utilization balance sheets are generated These are based on the flow of food items from production to end uses Total available supply is estimated as the sum of production (ie some products are measured at the farm level or during processing) starting inventories and imports (USDA 1999b) The availability of food for human use commonly termed as food disappearance is determined by subtracting exported foods products used in industries farm inputs (seed and feed) and end-of-the-year inventories from the total available supply (USDA 1999b) USDA (1999b) calculates the per capita food consumption by dividing the total food disappearance by the total US population
USDA (1999b) estimated per capita consumption data for grain products from 1970minus1997 In this section the 1997 values which are the most recent final data are presented Table 12-10 presents per capita consumption in 1997 for grains
An advantage of this study is that it provides per capita consumption rates for grains that are representative of long-term intake because disappearance data are generated annually Daily per capita intake rates are generated by dividing annual consumption by 365 daysyear One of the limitations of this study is that disappearance data do not account for losses from the food supply from waste spoilage or foods fed to pets Thus intake rates based on these data may overestimate daily consumption because they are based on the total quantity of marketable commodity utilized Therefore these data may be useful for estimating bounding exposure estimates It should also be noted that per capita estimates based on food disappearance are not a direct measure of actual consumption or quantity ingested instead the data are used as indicators of changes in usage over time (USDA 1999b) These data are based on older surveys and may not be entirely representative of current consumption patterns
12323 USDA (1999a)mdashFood and Nutrient Intakes by Children 1994minus1996 1998 Table Set 17
USDA (1999a) calculated national probability estimates of food and nutrient intake by children based on 4 years of the CSFII (1994minus1996 and 1998) for children age 9 years and under and on CSFII 1994minus1996 only for individuals age 10 years and over The CSFII was a series of surveys designed to measure the kinds and amounts of foods eaten by Americans Intake data based on 24-hour dietary recall were collected through in-person interviews on 2 non-consecutive days Section 12324 provides additional information on these surveys
USDA used sample weights to adjust for non-response to match the sample to the US population in terms of demographic characteristics and to equalize intakes over the four quarters of the year and the 7 days of the week A total of 503 breast-fed children were excluded from the estimates but both consumers and non-consumers were included in the analysis
USDA (1999a) provided data on the mean per capita quantities (grams) of various food productsgroups consumed per individual for 1 day and the percent of individuals consuming those foods in 1 day of the survey Table 12-11 and Table 12-12 present data on the mean quantities (grams) of grain products consumed per individual for 1 day and the percentage of survey individuals consuming grain products that survey day Data on mean intakes or mean percentages are based on respondentsrsquo Day-1 intakes
The advantage of the USDA (1999a) study is that it uses the 1994minus1996 1998 CSFII data set which includes 4 years of intake data combined and includes the supplemental data on children These data are expected to be generally representative of the US population and they include data on a wide variety of grain products The data set is one of a series of USDA data sets that are publicly available One limitation of this data set is that it is based on 1-day and short-term dietary data may not accurately reflect long-term eating patterns Other limitations of this study are that it only provides mean values of food intake rates consumption is not normalized by body weight and presentation of results is not consistent with US EPArsquos recommended age groups These data are based on older surveys and may not be entirely representative of current eating patterns
Page Exposure Factors Handbook 12-6 September 2011
Exposure Factors Handbook
Chapter 12mdashIntake of Grain Products 12324 US EPA Analysis of Continuing Survey
of Food Intake by Individuals (CSFII) 1994minus1996 1998
US EPAOPP in cooperation with USDArsquos Agricultural Research Service used data from the 1994minus1996 1998 CSFII to develop the FCID (US EPA 2000 USDA 2000) as described in Section 12311 The CSFII 1994minus1996 was conducted between January 1994 and January 1997 with a target population of non-institutionalized individuals in all 50 states and Washington DC In each of the three survey years data were collected for a nationally representative sample of individuals of all ages The CSFII 1998 was conducted between December 1997 and December 1998 and surveyed children 9 years of age and younger It used the same sample design as the CSFII 1994minus1996 and was intended to be merged with CSFII 1994minus1996 to increase the sample size for children The merged surveys are designated as CSFII 1994minus1996 1998 (USDA 2000) Additional information on the CSFII can be obtained at httpwwwarsusdagov Servicesdocshtmdocid=14531
The CSFII 1994minus1996 1998 collected dietary intake data through in-person interviews on two non-consecutive days The data were based on 24-hour recall A total of 21662 individuals provided data for the first day of those individuals 20607 provided data for a second day The 2-day response rate for the 1994minus1996 CSFII was approximately 76 The 2-day response rate for CSFII 1998 was 82 The CSFII 1994minus1996 1998 surveys were based on a complex multistage area probability sample design The sampling frame was organized using 1990 US population census estimates and the stratification plan took into account geographic location degree of urbanization and socioeconomic characteristics Several sets of sampling weights are available for use with the intake data By using appropriate weights data for all 4 years of the surveys can be combined USDA recommends that all four years be combined in order to provide an adequate sample size for children
The grain itemsgroups selected for the US EPA analysis included total grains and individual grain products such as cereal and rice US EPA (2003) presents the food codes and definitions used to determine the various grain products used in the analysis CSFII data on the foods people reported eating were converted to the quantities of agricultural commodities eaten Intake rates for these food itemsgroups and summary statistics were generated on both a per capita and a consumer-only basis using the same general methodology as in the US EPA
analysis of 2003minus2006 NHANES data as described in Section 12311 Because these data were developed for use in US EPArsquos pesticide registration program the childhood age groups used are slightly different than those recommended in US EPArsquos Guidance on Selecting Age Groups for Monitoring and Assessing Childhood Exposures to Environmental Contaminants (US EPA 2005)
Table 12-13 presents per capita intake data for total grains in gkg-day Table 12-14 provides consumer-only intake data for total grains in gkg-day Table 12-15 provides per capita intake data for individual grain products and Table 12-16 provides consumer-only intake data for individual grain products In general these data represent intake of the edible portions of unprepared (ie uncooked) foods Table 12-17 through Table 12-24 present per capita intake data for individual grain products The data come from CSFII 1994minus1996 only The results are presented in units of gkg-day These data represent as-consumed intake rates
The results are presented in units of gkg-day Thus use of these data in calculating potential dose does not require the body-weight factor to be included in the denominator of the ADD equation The cautions concerning converting these intake rates into units of gday by multiplying by a single average body weight and the discussion of the use of short term data in the NHANES description in Section 12311 apply to the CSFII estimates as well
A strength of US EPArsquos analysis is that it provides distributions of intake rates for various age groups of individuals normalized by body weight The analysis uses the 1994minus1996 1998 CSFII data set which was designed to be representative of the US population Also the data set includes 4 years of intake data combined and is based on a 2-day survey period However as discussed above short-term dietary data may not accurately reflect long-term eating patterns and may under-represent infrequent consumers of a given food This is particularly true for the tails (extremes) of the distribution of food intake Also the analysis was conducted using slightly different childhood age groups than those recommended in US EPArsquos Guidance on Selecting Age Groups for Monitoring and Assessing Childhood Exposures to Environmental Contaminants (US EPA 2005) However given the similarities in the childhood age groups used the data should provide suitable intake estimates for the age groups of interest While the CSFII data are older than the NHANES data they provide relevant information on consumption by season region of the United States
Exposure Factors Handbook Page September 2011 12-7
Exposure Factors Handbook
Chapter 12mdashIntake of Grain Products and urbanization breakdowns that are not available in the publically released NHANES data
12325 Smiciklas-Wright et al (2002)mdashFoods Commonly Eaten in the United States Quantities Consumed per Eating Occasion and in a Day 1994minus1996
Using data gathered in the 1994minus1996 USDA CSFII Smiciklas-Wright et al (2002) calculated distributions for the quantities of grain products consumed per eating occasion by members of the US population (ie serving sizes) The estimates of serving size are based on data obtained from 14262 respondents ages two and above who provided two days of dietary intake information Only dietary intake data from users of the specified food were used in the analysis (ie consumer-only data) Table 12-25 presents as-consumed the quantity of grain products consumed per eating occasion and the percentage of individuals using these foods in a 2-day period for a selected variety of grain products Table 12-26 presents the same data by sex and age
These data are presented on an as-consumed basis (grams) and represent the quantity of grain products consumed per eating occasion These estimates may be useful for assessing acute exposures to contaminants in specific foods or other assessments where the amount consumed per eating occasion is necessary Only the mean and standard deviation serving size data and percent of the population consuming the food during the 2-day survey period are presented in this handbook Percentiles of serving sizes of the foods consumed by these age groups of the US population can be found in Smiciklas-Wright et al (2002)
The advantages of using these data are that they were derived from the USDA CSFII and are representative of the US population The analysis conducted by Smiciklas-Wright et al (2002) accounted for individual foods consumed as ingredients of mixed foods Mixed foods were disaggregated via recipe files so that the individual ingredients could be grouped together with similar foods that were reported separately Thus weights of foods consumed as ingredients were combined with weights of foods reported separately to provide a more thorough representation of consumption However it should be noted that since the recipes for the mixed foods consumed were not provided by the respondents standard recipes were used As a result the estimates of quantity consumed for some food types are based on assumptions about the types and quantities of ingredients consumed as part of mixed
foods This study used data from the 1994 to 1996 CSFII data from the 1998 childrenrsquos supplement were not included
12326 Vitolins et al (2002)mdashQuality of Diets Consumed by Older Rural Adults
Vitolins et al (2002) conducted a survey to evaluate the dietary intake by food groups of older (gt70 years) rural adults The sample consisted of 130 community dwelling residents from two rural counties in North Carolina Data on dietary intake over the preceding year were obtained in face-to-face interviews conducted in participantsrsquo homes or in a few cases a senior center The food frequency questionnaire used in the survey was a modified version of the National Cancer Institute Health Habits and History Questionnaire this modified version included an expanded food list containing a greater number of ethnic foods than the original food frequency form Demographic and personal data collected included sex ethnicity age education denture use marital status chronic disease and weight
Food items reported in the survey were grouped into food groups similar to the USDA Food Guide Pyramid and the National Cancer Institutersquos 5 A Day for Better Health program These groups are (1) fruits and vegetables (2) bread cereal rice and pasta (3) milk yogurt and cheese (4) meat fish poultry beans and eggs and (5) fats oils sweets and snacks Medians ranges frequencies and percentages were used to summarize intake of each food group broken down by demographic and health characteristics In addition multiple regression models were used to determine which demographic and health factors were jointly predictive of intake of each of the five food groups
Thirty-four percent of the survey participants were African American 36 were European American and 30 were Native American Sixty-two percent were female 62 were not married at the time of the interview and 65 had some high school education or were high school graduates Almost all of the participants (95) had one or more chronic diseases Sixty percent of the respondents were between 70 and 79 years of age the median age was 78 years old Table 12-27 presents the median servings of bread cereal rice and pasta broken down by demographic and health characteristic Only sex was statistically predictive of bread cereal rice and pasta intake (p lt 001) with males consuming approximately an extra serving per day compared to women Also the multiple regression model indicated that sex was predictive of
Page Exposure Factors Handbook 12-8 September 2011
Exposure Factors Handbook
Chapter 12mdashIntake of Grain Products breads cereal rice and pasta intake after controlling for other demographic variables
One limitation of the study as noted by the study authors is that the study did not collect information on the length of time the participants had been practicing the dietary behaviors reported in the survey The questionnaire asked participants to report the frequency of food consumption during the past year The study authors noted that currently there are no dietary assessment tools that allow the collection of comprehensive dietary data over years of food consumption Another limitation of the study is that the small sample size used makes associations by sex and ethnicity difficult
12327 Fox et al (2004)mdashFeeding Infants and Toddlers Study What Foods Are Infants and Toddlers Eating
Fox et al (2004) used data from the Feeding Infants and Toddlers study (FITS) to assess food consumption patterns in infants and toddlers The FITS was sponsored by Gerber Products Company and was conducted to obtain current information on food and nutrient intakes of children ages 4 to 24 months old in the 50 states and the District of Columbia The FITS is described in detail in Devaney et al (2004) FITS was based on a random sample of 3022 infants and toddlers for which dietary intake data were collected by telephone from their parents or caregivers between March and July 2002 An initial recruitment and household interview was conducted followed by an interview to obtain information on intake based on 24-hour recall The interview also addressed growth development and feeding patterns A second dietary recall interview was conducted for a subset of 703 randomly selected respondents The study over-sampled children in the 4 to 6 and 9 to 11 months age groups sample weights were adjusted for non-response over sampling and under coverage of some subgroups The response rate for the FITS was 73 for the recruitment interview Of the recruited households there was a response rate of 94 for the dietary recall interviews (Devaney et al 2004) Table 12-28 shows the characteristics of the FITS population
Fox et al (2004) analyzed the first set of 24-hour recall data collected from all study participants For this analysis children were grouped into six age categories 4 to 6 months 7 to 8 months 9 to 11 months 12 to 14 months 15 to 18 months and 19 to 24 months Table 12-29 provides the percentage of infants and toddlers consuming different types of grains or grain products at least once a day The percentages of children eating any type of grain or
grain product ranged from 658 for 4 to 6 monthshyolds to 992 for 19- to 24-month-olds
The advantages of this study is that it represents the US population and the sample size was large One limitation of the analysis done by Fox et al (2004) is that only frequency data were provided no information on actual intake rates was included In addition Devaney et al (2004) noted several limitations associated with the FITS data For the FITS a commercial list of infants and toddlers was used to obtain the sample used in the study Since many of the households could not be located and did not have children in the target population a lower response rate than would have occurred in a true national sample was obtained (Devaney et al 2004) In addition the sample was likely from a higher socioeconomic status when compared with all US infants in this age group (4 to 24 months old) and the use of a telephone survey may have omitted lower-income households without telephones (Devaney et al 2004)
12328 Ponza et al (2004)mdashNutrient Food Intakes and Food Choices of Infants and Toddlers Participating in WIC
Ponza et al (2004) conducted a study using selected data from the FITS to assess feeding patterns food choices and nutrient intake of infants and toddlers participating in the Special Supplemental Nutrition Program for Women Infants and Children (WIC) Ponza et al (2004) evaluated FITS data for the following age groups 4 to 6 months (N = 862) 7 to 11 months (N = 1159) and 12 to 24 months (N = 996) Table 12-30 shows the total sample size described by WIC participants and non-participants
The foods consumed were analyzed by tabulating the percentage of infants who consumed specific foodsfood groups per day (Ponza et al 2004) Weighted data were used in all of the analyses used in the study (Ponza et al 2004) Table 12-30 presents the demographic data for WIC participants and non-participants Table 12-31 provides information on the food choices for the infants and toddlers studied In general there was little difference in grain product choices among WIC participants and non-participants except for the 7 to 11 months age category (see Table 12-31) Non-participants ages 7 to 11 months were more likely to eat non-infant cereals than WIC participants
An advantage of this study is that it had a relatively large sample size and was representative of the US general population of infants and children A limitation of the study is that intake values for foods
Exposure Factors Handbook Page September 2011 12-9
Exposure Factors Handbook
Chapter 12mdashIntake of Grain Products were not provided Other limitations are those associated with the FITS data as described previously in Section 12327
12329 Fox et al (2006)mdashAverage Portion of Foods Commonly Eaten by Infants and Toddlers in the United States
Fox et al (2006) estimated average portion sizes consumed per eating occasion by children 4 to 24 months of age who participated in the FITS The FITS is a cross-sectional study designed to collect and analyze data on feeding practices food consumption and usual nutrient intake of US infants and toddlers and is described in Section 12327 of this chapter It included a stratified random sample of 3022 children between 4 and 24 months of age
Using the 24-hour recall data Fox et al (2006) derived average portion sizes for six major food groups including breads and grains Average portion sizes for select individual foods within these major groups were also estimated For this analysis children were grouped into six age categories 4 to 5 months 6 to 8 months 9 to 11 months 12 to 14 months 15 to 18 months and 19 to 24 months Table 12-32 and Table 12-33 present the average portion sizes for grain products for infants and toddlers respectively
123210 Mennella et al (2006)mdashFeeding Infants and Toddlers Study The Types of Foods Fed to Hispanic Infants and Toddlers
Mennella et al (2006) investigated the types of food and beverages consumed by Hispanic infants and toddlers in comparison to the non-Hispanic infants and toddlers in the United States The FITS 2002 data for children between 4 and 24 months of age were used for the study The data represent a random sample of 371 Hispanic and 2367 non-Hispanic infants and toddlers (Mennella et al 2006) Mennella et al (2006) grouped the infants as follows 4 to 5 months (N = 84 Hispanic 538 non-Hispanic) 6 to 11 months (N = 163 Hispanic 1228 non-Hispanic) and 12 to 24 months (N = 124 Hispanic 871 non-Hispanic) of age
Table 12-34 provides the percentage of Hispanic and non-Hispanic infants and toddlers consuming grain products In most instances the percentages consuming the different types are similar However 6 to 11 month old Hispanic children were more likely to eat rice and pasta than non-Hispanic children in this age groups
The advantage of the study is that it provides information on f ood preferences for Hispanic and non-Hispanic infants and toddlers A limitation is that the study did not provide food intake data but provided frequency of use data instead Other limitations are those noted previously in Section 12327 for the FITS data
124 CONVERSION BETWEEN WET- AND
DRY-WEIGHT INTAKE RATES The intake data presented in this chapter are
reported in units of wet weight (ie as-consumed or uncooked weight of grain products consumed per day or per eating occasion) However data on the concentration of contaminants in grain products may be reported in units of either wet or dry weight (eg mg contaminant per gram dry w eight of grain products) It is essential that exposure assessors be aware of this difference so that they may ensure consistency between the units used for intake rates and those used for concentration data (ie if the contaminant concentration is measured in dry weight of grain products then the dry-weight units should be used for their intake values)
If necessary wet-weight (eg as-consumed) intake rates may be converted to dry-weight intake rates using the moisture content percentages presented in Table 12-35 and the following equation
IR = IR 100 minusW dw ww (Eqn 12-1) 100
where
IRdw = dry-weight intake rate IRww = wet-weight intake rate and W = percent water content
Alternatively dry-weight residue levels in grain
products may be converted to wet-weight residue levels for use with wet-weight (eg as-consumed) intake rates as follows
C = C 100 minus W ww dw (Eqn 12-2) 100
where
Cww = wet concentration rate Cdw = dry-weight concentration and W = percent water content
Page Exposure Factors Handbook 12-10 September 2011
Exposure Factors Handbook
Chapter 12mdashIntake of Grain Products
Exposure Factors Handbook Page September 2011 12-11
The moisture data presented in Table 12-35 are for selected grain products taken from USDA (2007)
125 REFERENCES FOR CHAPTER 12 Devaney B Kalb L Briefel R Zavitsky-Novak T
Clusen N Ziegler P (2004) Feeding infants and toddlers study overview of the study design J Am Diet Assoc 104 s8-13 httpdxdoiorg101016jjada200310023
Fox MK Pac S Devaney B Jankowski L (2004) Feeding infants and toddlers study What foods are infants and toddlers eating J Am Diet Assoc 104 s22-s30 httpdxdoiorg101016jjada200310026
Fox MK Reidy K Karwe V Ziegler P (2006) Average portions of foods commonly eaten by infants and toddlers in the United States J Am Diet Assoc 106 S66-S76 httpdxdoiorg101016jjada200509042
Mennella JA Ziegler P Briefel R Novak T (2006) Feeding Infants and Toddlers Study the types of foods fed to Hispanic infants and toddlers J Am Diet Assoc 106 S96shy106 httpdxdoiorg101016jjada200509038
NCHS (National Center for Health Statistics) (1993) Joint policy on variance estimation and statistical reporting standards on NHANES III and CSFII reports HNISNCHS Analytic Working Group recommendations Riverdale MD Human Nutrition Information Service (HNIS)Analytic Working Group Agricultural Research Service Survey SystemsFood Consumption Laboratory
Ponza M Devaney B Ziegler P Reidy K Squatrito C (2004) Nutrient intakes and food choices of infants and toddlers participating in WIC J Am Diet Assoc 104 s71-s79 httpdxdoiorg101016jjada200310018
Smiciklas-Wright H Mitchell DC Mickle SJ Cook AJ Goldman JD (2002) Foods commonly eaten in the United States Quantities consumed per eating occasion and in a day 1994minus96 [pre-publication version] (NFS Report No 96-5) Beltsville MD US Department of Agriculture httpwwwarsusdagovsp2userfilesplace1 2355000pdfportionpdf
US EPA (US Environmental Protection Agency) (2000) Food commodity intake database [Database]
US EPA (US Environmental Protection Agency) (2003) CSFII analysis of food intake distributions (EPA600R-03029) Washington DC httpcfpubepagovnceacfmrecordisplayc fmdeid=56610
US EPA (US Environmental Protection Agency) (2005) Guidance on selecting age groups for monitoring and assessing childhood exposures to environmental contaminants (final) (EPA630P-03003F) Washington DC US Environmental Protection Agency Risk Assessment Forum httpwwwepagovrafpublicationsguidanc e-on-selecting-age-groupshtm
USDA (US Department of Agriculture) (1980) Food and nutrient intakes of individuals in 1 day in the United States Spring 1977 Nationwide Food Consumption Survey 1977ndash78 Preliminary report no 2 Washington DC httpwwwarsusdagovSP2UserFilesPlace 12355000pdf7778nfcs7778_prelim_2pdf
USDA (US Department of Agriculture) (1993) Food and nutrient intakes by i ndividuals in the United States 1 day 1987ndash88 Nationwide Food Consumption Survey 1987-88 Report no 87-I-1 (87-I-1) Washington DC httpwwwarsusdagovSP2UserFilesPlace 12355000pdf8788nfcs8788_rep_87-ishy1pdf
USDA (US Department of Agriculture) (1996a) Data tables Results from USDAs 1994 continuing survey of food intakes by individuals and 1994 diet and health knowledge survey Riverdale MD
USDA (US Department of Agriculture) (1996b) Data tables results from USDArsquos 1995 Continuing survey of food intakes by individuals and 1995 diet and health knowledge survey Riverdale MD
USDA (US Department of Agriculture) (1999a) Food and nutrient intakes by children 1994shy96 1998 table set 17 Beltsville MD httpwwwarsusdagovSP2UserFilesPlace 12355000pdfscs_allpdf
USDA (US Department of Agriculture) (1999b) Food consumption prices and expenditures (1970minus1997) Statistical Bulletin No 965 Washington DC Economic Research Service
USDA (US Department of Agriculture) (2000) 1994-1996 1998 continuing survey of food
Exposure Factors Handbook
Chapter 12mdashIntake of Grain Products intakes by individuals (CSFII) Beltsville MD Agricultural Research Service Beltsville Human Nutrition Research Center
USDA (US Department of Agriculture) (2007) USDA nutrient database for standard reference release 20 Riverdale MD httpwwwarsusdagovmainsite_mainhtm modecode=12-35-45-00
Vitolins MZ Quandt SA Bell RA Arcury TA Case LD (2002) Quality of diets consumed by older rural adults J Rural Health 18 49shy56
Page Exposure Factors Handbook 12-12 September 2011
Exposure F
actors Handbook
Chapter 12mdash
Intake of Grain Products
Table 12-3 Per Capita Intake of Total Grains Based 2003ndash2006 NHANES (gkg-day edible portion uncooked weight)
Population Group
Consuming Percentiles
N Mean SE 1st 5th 10th 25th 50th 75th 90th 95th 99th Max Whole Population 16783 100 26 004 02 06 08 13 20 32 51 67 99 348 Age Group
Birth to 1 year 865 76 31 020 00 00 00 01 23 50 75 95 125 349 1 to 2 years 1052 100 64 017 15 23 30 42 58 84 105 124 159 211 3 to 5 years 978 100 62 013 20 24 33 44 59 76 96 111 132 156 6 to 12 years 2256 100 44 009 06 14 18 28 41 55 74 82 111 145 13 to 19 years 3450 100 24 005 04 07 10 15 21 32 42 50 75 143 20 to 49 years 4289 100 22 004 03 06 08 12 19 28 39 46 71 150 Females 13 to 49 years 4103 100 19 004 02 05 08 11 17 25 34 39 55 98 50 years and older 3893 100 17 003 03 05 07 10 15 21 29 35 52 94
Race Mexican American 4450 99 30 005 01 08 10 16 24 39 58 72 106 178 Non-Hispanic Black 4265 100 24 004 02 05 07 11 18 29 50 68 102 211 Non-Hispanic White 6757 100 25 005 03 06 08 13 19 31 49 65 96 348 Other Hispanic 562 99 27 013 02 07 10 15 21 33 53 70 98 153 Other RacemdashIncluding Multiple Races 749 100 30 011 03 06 09 15 25 39 60 75 111 175
N = Sample size SE = Standard error Max = Maximum value Estimates are less statistically reliable based on guidance published in the Joint Policy on Variance Estimation and Statistical Reporting Standards on
NHANES III and CSFII Reports NHISNCHS Analytical Working Group Recommendations (NCHS 1993)
Source Based on US EPA analysis of 2003ndash2006 NHANES
Exposure F
actors Handbook
Page Septem
ber 2011 12-13
Exposure F
actors Handbook
Chapter 12mdash
Intake of Grain Products
Table 12-4 Consumer-Only Intake of Total Grains Based 2003ndash2006 NHANES (gkg-day edible portion uncooked weight)
Population Group N Mean SE Percentiles
1st 5th 10th 25th 50th 75th 90th 95th 99th Max
Whole Population 16556 26 004 03 06 08 13 20 32 51 67 99 Age Group
Birth to 1 year 644 41 018 01 04 08 18 35 59 81 103 139 1 to 2 years 1050 64 016 16 24 30 42 58 84 105 124 159 3 to 5 years 977 62 013 20 24 33 44 59 76 96 111 132 6 to 12 years 2256 44 009 06 14 18 28 41 55 74 82 111 13 to 19 years 3450 24 005 04 07 10 15 21 32 42 50 75 20 to 49 years 4288 22 004 03 06 08 12 19 28 39 46 71 Females 13 to 49 years 4102 19 003 02 05 08 11 17 25 34 39 55 50 years and older 3891 17 003 03 05 07 10 15 21 29 35 52
Race Mexican American 4341 30 005 04 08 11 16 24 39 59 72 106 Non-Hispanic Black 4236 24 004 02 05 07 11 18 29 50 69 103 Non-Hispanic White 6694 25 005 03 06 08 13 20 31 49 65 96 Other Hispanic 548 28 014 04 07 10 15 21 34 54 71 98 Other RacemdashIncluding Multiple Races 737 31 011 03 07 09 15 25 39 60 75 111
349
349 211 156 145 143 150 98 94
178 211 349 153 175
N = Sample size SE = Standard error Max = Maximum value Estimates are less statistically reliable based on guidance published in the Joint Policy on Variance Estimation and Statistical Reporting
Standards on NHANES III and CSFII Reports NHISNCHS Analytical Working Group Recommendations (NCHS 1993)
Source Based on US EPA analysis of 2003ndash2006 NHANES
Page E
xposure Factors H
andbook 12-14
September 2011
Table 12-5 Per Capita Intake of Individual Grain Products Based 2003ndash2006 NHANES (gkg-day edible portion uncooked weight)
Population Group N
Consuming Mean SE
Consuming Mean SE
Cereal Rice Whole Population
Age Group Birth to 1 year 1 to 2 years 3 to 5 years 6 to 12 years 13 to 19 years 20 to 49 years Females 13 to 49 years 50 years and older Race Mexican American Non-Hispanic Black Non-Hispanic White Other Hispanic Other RacemdashIncluding Multiple Races
16783
865 1052
978 2256 3450 4289 4103 3893
4450 4265 6757
562
749
100
81 100 100 100 100 100 100 100
100 100 100
99
100
37
51 87 86 63 39 32 29 22
43 36 36 39
41
004
030 018 017 010 008 004 004 004
007 006 005 020
012
88 69 87 91 89 85 89 86 89
87 86 88 92
90
02
11 06 05 03 02 03 02 01
03 03 02 06
08
001
008 006 006 003 001 001 001 001
002 002 001 005
008 N
SE
Source
= Sample size = Standard error
Based on US EPA analysis of 2003ndash2006 NHANES
Exposure Factors Handbook
Chapter 12mdashIntake of Grain Products
Exposure Factors Handbook Page September 2011 12-15
Table 12-6 Consumer-Only Intake of Individual Grain Products Based 2003ndash2006 NHANES (gkg-day edible portion uncooked weight)
Population Group N Mean SE N Mean SE
Cereal Rice Whole Population
Age Group Birth to 1 year 1 to 2 years 3 to 5 years 6 to 12 years 13 to 19 years 20 to 49 years Females 13 to 49 years 50 years and older Race Mexican American Non-Hispanic Black Non-Hispanic White Other Hispanic Other RacemdashIncluding Multiple Races
16613
696 1051 978 2256 3450 4289 4103 3893
4372 4244 6707 550 740
37
63 87 86 63 39 32 29 22
43 36 36 39 41
004
031 018 017 010 008 004 004 004
007 006 005 020 013
14447
552 928 875 2000 2898 3812 3511 3382
3757 3645 5887 491 667
03
15 07 05 03 02 03 02 02
03 03 02 06 08
001
010 007 006 003 002 002 002 001
002 002 001 005 008
N SE
Source
= Sample size = Standard error
Based on US EPA analysis of 2003ndash2006 NHANES
Exposure Factors Handbook
Chapter 12mdashIntake of Grain Products
Page Exposure Factors Handbook 12-16 September 2011
Exposure Factors Handbook
Chapter 12mdashIntake of Grain Products
Table 12-7 Mean Grain Intake per Individual in a Day by Sex and Age (gday as-consumed)a for 1977minus1978 Group Age (years) Total Grains Breads Rolls
Biscuits Other Baked
Goods Cereals Pasta Mixtures Mainly Grainb
Males and Females lt1 1 to 2 3 to 5 6 to 8
42 158 181 206
4 27 46 53
5 24 37 56
30 44 54 60
3 63 45 38
Males 9 to 11 12 to 14 15 to 18 19 to 22 23 to 34 35 to 50 51 to 64 65 to 74 ge75
238 288 303 253 256 234 229 235 196
67 76 91 84 82 82 78 71 70
56 80 77 53 60 58 57 60 50
51 57 53 64 40 44 48 69 58
64 74 82 52 74 50 46 35 19
Females 9 to 11 12 to 14 15 to 18 19 to 22 23 to 34 35 to 50 51 to 64 65 to 74 ge75
214 235 196 161 163 161 155 175 178
58 57 57 44 49 49 52 57 54
59 61 43 36 38 37 40 42 44
44 45 41 33 32 32 36 47 58
53 72 55 48 44 43 27 29 22
Males and FemalesmdashAll Ages 204 62 49 44 49 a Based on USDA Nationwide Food Consumption Survey 1977ndash1978 data for 1 day b Includes mixtures containing grain as the main ingredient
Source USDA (1980)
Exposure Factors Handbook Page September 2011 12-17
Exposure Factors Handbook
Chapter 12mdashIntake of Grain Products
Page Exposure Factors Handbook 12-18 September 2011
Table 12-8 Mean Grain Intakes per Individual in a Day by Sex and Age (gday as-consumed)a for 1987minus1988
Group Age (years) Total Grains Yeast Breads and
Rolls
Quick Breads Pancakes
French Toast
Cakes Cookies Pastries
Pies
Crackers Popcorn
Pretzels Corn Chips
Cereals and Pastas
Mixtures Mostly Grainb
Males and Females le5 167 30 8 22 4 52 51
Males 6 to 11 268 51 16 37 8 74 83
12 to 19 304 65 28 45 10 72 82 ge20 272 65 20 37 8 58 83
Females 6 to 11 231 43 19 30 6 66 68
12 to 19 239 45 13 29 7 52 91 ge20 208 45 14 28 6 53 62
All Individuals 237 52 16 32 7 57 72 a Based on USDA Nationwide Food Consumption Survey 1987ndash1988 data for 1 day b Includes mixtures containing grain as the main ingredient
Source USDA (1993)
Table 12-9 Mean Grain Intakes per Individual in a Day by Sex and Age (gday as-consumed)a for 1994minus1995
Group Age (years)
Total Grains Yeast Breads and Rolls
Quick Breads Pancakes
French Toast
Cakes Cookies
Pastries Pies
Crackers Popcorn
Pretzels Corn Chips
Cereals and Pastas
Mixtures Mostly Grainb
1994 1995 1994 1995 1994 1995 1994 1995 1994 1995 1994 1995 1994 1995 Males and Females le5 213 210 26 28 11 11 22 23 8 7 58 57 89 84
Males 6 to 11 12 to 19 ge20
285 417 357
341 364 365
51 53 64
45 54 61
15 30 22
21 21 24
42 54 43
46 43 46
12 17 13
18 22 15
66 82 86
97 84 91
101 180 128
115 138 128
Females 6 to 11 12 to 19 ge20
260 317 254
286 296 257
43 40 44
46 37 45
16 16 16
21 14 15
37 39 33
51 35 34
11 17 9
14 16 10
57 63 59
54 52 69
94 142 92
100 143 83
All Individuals 300 303 50 49 18 19 38 39 12 13 70 76 112 107 a Based on USDA CSFII 1994 and 1995 data for 1 day b Includes mixtures containing grain as the main ingredient
Source USDA (1996a b)
Exposure Factors Handbook
Chapter 12mdashIntake of Grain Products
Table 12-10 Per Capita Consumption of Flour and Cereal Products in 1997
Food Item Per Capita Consumption
(gday)a
Total Wheat Flourb
Rye Flour Ricec
Total Corn Productsd
Oat Productse
Barley Productsf
Total Flour and Cereal Productsg
186 07 24 29 8
09 249
a Original data were presented in lbsyear data were converted to gday by multiplying by a factor of 454 glb and dividing by 365 dayyear Consumption of most items at the processing level Excludes quantities used in alcoholic beverages and fuel
b Includes white whole wheat and durum flour c Milled basis d Includes corn flour and meal hominy and grits and corn starch e Includes rolled oats ready-to-eat oat cereals oat flour and oat bran f Includes barley flour pearl barley and malt and malt extract used in food processing g Excludes wheat not ground into flour
Source USDA (1999b)
Exposure Factors Handbook Page September 2011 12-19
Table 12-11 Mean Quantities of Grain Products Consumed by Children Under 20 Years of Age by Sex and Age per Capita (gday as-consumed)a
Yeast Cereals and Pasta Cakes Crackers Quick Breads Mixtures Age Group Sample Breads Cookies Popcorn Totalb Ready-to- Pancakes Mainly (years) Size and Total Rice Pasta Pastries Pretzels Eat Cereals French Toast Grainc Rolls Pies Corn Chips
Males and Females lt1 1126 56 2 29 1 2 1d 1 3 1 20 1 1016 192 16 57 11 9 9 9 16 7 87 2 1102 219 26 62 16 15 12 12 22 9 87 1 to 2 2118 206 21 59 13 12 11 11 19 8 87 3 1831 242 30 64 19 13 12 16 23 11 98 4 1859 264 36 67 22 15 11 17 30 13 102 5 884 284 41 76 24 17 11 15 33 13 107 3 to 5 4574 264 36 69 22 15 11 16 29 12 102 le5 7818 219 27 61 16 13 10 12 22 9 87
Males 6 to 9 787 310 45 77 28 18 15 23 39 16 109 6 to 11 1031 318 46 80 31 16 18 23 40 15 115 12 to 19 737 406 54 82 29 27 17 26 49 19 175
Females 6 to 9 704 284 43 61 21 12 15 18 42 13 107 6 to 11 969 280 43 62 20 14 15 19 42 14 101 12 to 19 732 306 40 67 17 19 22 15 37 15 132
Males and Females le9 9309 250 34 64 20 14 12 16 30 12 96 le19 11287 298 40 69 22 17 15 18 36 14 120 a Based on data from 1994ndash1996 1998 CSFII b Includes yeast breads rolls cereals pastas quick breads pancakes French toast cakes cookies pastries pies crackers popcorn pretzels corn
chips and mixtures having a grain product as a main ingredient Excludes grain products that were ingredients in food mixtures coded as a single item and tabulated under another food group for example noodles in tuna-noodle casserole are tabulated under Meat Poultry and Fish
c Includes mixtures having a grain product as a main ingredient such as burritos tacos pizza egg rolls quiche spaghetti with sauce rice and pasta mixtures frozen meals in which the main course is a grain mixture noodle and rice soups and baby-food macaroni and spaghetti mixtures
d Estimate is not statistically reliable due to small sample size reporting intake Note Consumption amounts shown are representative of the first day of each participantrsquos survey response
Source USDA (1999a)
Exposure F
actors Handbook
Chapter 12mdash
Intake of Grain Products
Page E
xposure Factors H
andbook 12-20
September 2011
Exposure F
actors Handbook
Chapter 12mdash
Intake of Grain Products
Table 12-12 Percentage of Individuals Under 20 Years of Age Consuming Grain Products by Sex and Age ()a
Age Group (years) Sample Size Totalb
Yeast Breads
and Rolls
Cereals and Pasta Quick Breads
Pancakes French Toast
Cakes Cookies Pastries
Pies
Crackers Popcorn Pretzels
Corn Chips
Mixtures Mainly GraincTotal
Ready-to-Eat
Cereals Rice Pasta
Males and Females lt1 1126 706 109 628 91 34 21 44 165 103 150 1 1016 982d 484 706 453 113 94 230 470 390 478 2 1102 990d 587 711 519 144 94 275 466 379 453 1 to 2 2118 987 537 709 487 129 94 253 468 384 465 3 1831 994d 641 697 533 111 86 288 461 385 490 4 1859 995d 670 691 548 114 71 286 523 394 462 5 884 999d 692 704 549 114 68 252 524 321 474 3 to 5 4574 996d 668 697 543 113 75 275 503 367 475 le5 7818 958 555 693 469 109 75 240 450 341 433
Males 6 to 9 787 989d 698 626 508 105 74 281 525 360 445 6 to 11 1031 990d 691 640 524 97 81 271 523 338 453 12 to 19 737 982d 627 446 332 100 59 244 413 272 462
Females 6 to 9 704 997d 715 612 476 90 79 263 571 383 480 6 to 11 969 993d 710 593 456 94 71 271 550 371 457 12 to 19 732 976d 609 459 303 86 93 198 406 309 461
Males and Females le9 9309 972 616 664 479 105 76 253 489 353 444 le19 11287 976 624 576 417 99 76 242 461 325 451 a Based on data from 1994ndash1996 1998 CSFII b Includes yeast breads rolls cereals pastas quick breads pancakes French toast cakes cookies pastries pies crackers popcorn
pretzels corn chips and mixtures having a grain product as a main ingredient Excludes grain products that were ingredients in food mixtures coded as a single item and tabulated under another food group for example noodles in tuna-noodle casserole are tabulated under Meat Poultry and Fish
c Includes mixtures having a grain product as a main ingredient such as burritos tacos pizza egg rolls quiche spaghetti with sauce rice and pasta mixtures frozen meals in which the main course is a grain mixture noodle and rice soups and baby-food macaroni and spaghetti mixtures
d Estimate is not statistically reliable due to small sample size reporting intake Note Percentages shown are representative of the first day of each participantrsquos survey response
Source USDA (1999a)
Exposure F
actors Handbook
Page Septem
ber 2011 12-21
Page E
xposure Factors H
andbook 12-22
September 2011
Exposure F
actors Handbook
Chapter 12mdash
Intake of Grain Products
Table 12-13 Per Capita Intake of Total Grains Based on 1994ndash1996 1998 CSFII (gkg-day edible portion uncooked weight) Population Group N Percent
Consuming Mean SE Percentiles 1st 5th 10th 25th 50th 75th 90th 95th 99th Max
Whole Population Age group Birth to 1 year 1 to 2 years 3 to 5 years 6 to 12 years 13 to 19 years 20 to 49 years ge50 years Season Fall Spring Summer Winter Race Asian Pacific Islander Black American Indian Alaskan Native OtherNA White Region Midwest Northeast South West Urbanization Central City Suburban Non-metropolitan
20607
1486 2096 4391 2089 1222 4677 4646
4687 5308 5890 4722
557 2740
177 1638 15495
4822 3692 7208 4885
6164 9598 4845
995
705 998 1000 1000 1000
999 1000
995 996 995 995
985 994 997 988 996
997 996 995 994
995 995 996
27
25 64 63 43 25 22 17
26 27 26 27
36 26 29 31 26
27 28 25 28
27 27 24
00
01 01 01 01 01 00 00
00 00 00 00
02 01 02 01 00
00 00 00 01
00 00 01
02
00 11 18 09 04 03 03
02 02 03 02
00 01 03 00 03
03 03 02 02
01 03 03
06
00 21 26 17 08 06 06
06 06 07 06
11 05 05 07 07
07 07 06 07
06 07 06
09
00 28 32 20 11 08 07
09 08 09 09
15 07 08 09 09
09 10 08 09
09 09 08
13
00 42 43 28 15 13 11
13 13 13 14
23 11 13 15 13
14 14 12 14
13 14 12
21
16 59 59 40 23 19 15
21 21 21 21
32 19 22 24 20
21 22 19 22
21 21 19
33
38 79 78 54 31 28 21
33 34 33 33
47 33 42 41 32
34 35 30 35
35 34 29
52
62 104 99 70 44 39 28
50 55 51 52
62 54 63 61 50
53 53 50 54
54 53 48
68
86 121
115 82 51 47 35
66 70 68 68
73 73 75 77 66
70 68 66 70
70 69 63
103
127 168 156
111 79 71 49
100 105 105 101
112 115
120 117
98
104 110
97 103
107 100 104
316
263 316 270 172 124 161
112
263 294 282 316
246 294 168 270 316
238 316 282 208
294 316 238
N SE
Source
= Sample size = Standard error
US EPA analysis of 1994ndash1996 1998 CSFII
Exposure F
actors Handbook
Page Septem
ber 2011 12-23
Exposure F
actors Handbook
Chapter 12mdash
Intake of Grain Products
Table 12-14 Consumer-Only Intake of Total Grains Based on 1994ndash1996 1998 CSFII (gkg-day edible portion uncooked weight) Population Group N Mean SE Percentiles
1st 5th 10th 25th 50th 75th 90th 95th 99th Max Whole Population Age Group Birth to 1 year 1 to 2 years 3 to 5 years 6 to 12 years 13 to 19 years 20 to 49 years ge50 years Season Fall Spring Summer Winter Race Asian Pacific Islander Black American Indian Alaskan Native OtherNA White Region Midwest Northeast South West Urbanization Central City Suburban Non-metropolitan
20157
1048 2092 4389 2089 1222 4673 4644
4587 5190 5751 4629
527 2675
175 1570 15210
4743 3628 7053 4733
6023 9378 4756
27
36 64 63 43 25 22 17
26 27 27 27
37 26 30 32 26
27 28 25 28
28 27 24
00
01 01 01 01 01 00 00
00 00 00 00
02 01 02 01 00
00 00 00 01
00 00 01
03
01 12 18 09 04 03 03
03 03 04 03
08 02 03 05 04
04 04 03 04
03 04 03
07
03 21 26 17 08 06 06
07 07 07 07
12 05 05 07 07
07 08 06 07
07 07 06
09
06 28 32 20 11 08 07
09 09 09 09
16 07 08 10 09
09 10 08 09
09 09 08
13
14 42 43 28 15 13 11
13 13 14 14
23 11 13 15 13
14 14 12 14
13 14 12
21
28 59 59 40 23 19 15
21 21 21 21
32 19 22 24 20
21 22 19 22
21 21 19
33
48 79 78 54 31 28 21
33 34 33 33
47 33 42 41 32
34 35 30 35
35 34 29
52
74 104 99 70 44 39 28
50 55 52 52
62 54 63 62 51
53 53 50 54
54 53 48
68
92 121
115 82 51 47 35
66 70 68 68
73 73 75 77 66
70 68 66 70
70 69 64
103
134 168 156
111 79 71 49
100 106 105 101
112 115
120 117
98
104 110
98 103
107 100 104
316
263 316 270 172 124 161
112
263 294 282 316
246 294 168 270 316
238 316 282 208
294 316 238
N SE
Source
= Sample size = Standard error
US EPA analysis of 1994ndash1996 1998 CSFII
Table 12-15 Per Capita Intake of Individual Grain Products Based on 1994ndash1996 1998 CSFII (gkg-day edible portion uncooked weight)
Cereal Rice Population Group
N Percent Consuming Mean SE
Percent Consuming Mean SE
Whole Population Age Group
Birth to 1 year 1 to 2 years 3 to 5 years 6 to 12 years
13 to 19 years 20 to 49 years ge50 years Season Fall Spring Summer Winter Race Asian Pacific Islander Black American Indian Alaskan Native OtherNA White Region Midwest Northeast South West Urbanization Central City Suburban
Non-metropolitan
20607
1486 2096 4391 2089 1222 4677 4646
4687 5308 5890 4722
557 2740
177 1638 15495
4822 3692 7208 4885
6164 9598 4845
996
746 998 1000 1000 1000
999 1000
996 996 995 996
985 995 997 989 997
997 997 996 994
996 995 997
37
40 84 87 62 41 31 22
37 38 38 37
44 38 42 43 37
39 37 36 38
38 38 35
003
014 008 007 006 006 004 002
006 007 006 005
020 012 015 012 004
009 006 004 009
006 005 006
865
602 864 879 880 858 883 845
851 871 869 871
966 863 926 859 862
882 872 850 867
872 866 856
03
07 06 05 04 03 03 02
03 03 03 03
17 03 03 06 02
02 03 02 04
04 03 02
001
004 003 003 002 002 001 001
002 002 002 002
019 002 010 008 001
002 003 001 003
002 002 001
N SE
Source
= Sample size = Standard error
US EPA analysis of 1994ndash1996 1998 CSFII
Exposure Factors Handbook
Chapter 12mdashIntake of Grain Products
Page Exposure Factors Handbook 12-24 September 2011
Exposure Factors Handbook
Chapter 12mdashIntake of Grain Products
Table 12-16 Consumer-Only Intake of Individual Grain Products Based on 1994ndash1996 1998 CSFII (gkg-day edible portion uncooked weight )
Population Group N Cereal
Mean SE N Rice
Mean SE Whole Population 20227 38 003 17481 03 001 Age Group
Birth to 1 year 1116 54 016 900 12 007 1 to 2 years 2092 84 008 1819 07 004 3 to 5 years 4389 87 007 3869 06 003 6 to 12 years 2089 62 006 1847 04 002 13 to 19 years 1222 41 006 1038 03 003 20 to 49 years 4674 31 004 4102 03 001 ge50 years 4645 22 002 3906 02 001
Season Fall 4598 37 006 3957 03 002 Spring 5213 38 007 4530 03 002 Summer 5768 38 006 4989 03 002 Winter 4648 37 006 4005 03 002
Race Asian Pacific Islander 529 45 020 513 18 019 Black 2683 38 012 2346 04 002 American Indian Alaskan Native 175 43 015 151 03 010 OtherNA 1579 44 013 1375 07 008 White 15261 37 004 13096 02 001
Region Midwest 4759 39 009 4186 02 002 Northeast 3639 37 006 3152 04 004 South 7081 36 004 6029 03 001 West 4748 39 009 4114 05 003
Urbanization Central City 6039 38 006 5303 05 003 Suburban 9410 38 005 8105 03 002 Non-metropolitan 4778 36 006 4073 02 002
N = Sample size SE = Standard error
Source US EPA analysis of 1994ndash1996 1998 CSFII
Exposure Factors Handbook Page September 2011 12-25
Table 12-17 Per Capita Intake of Breads a Based on 1994ndash1996 1998 CSFII (gkg-day as-consumed)
Population Group Percent Consuming Mean
Percentile SE 1st 5th 10th 25th 50th 75th 90th 95th 99th Max
Whole Population Age Group lt5 months 6 to 12 months lt1 year 1 to 2 years 3 to 5 years 6 to 11 years 12 to 19 years 20 to 39 years 40 to 69 years ge70 years Season Fall Spring Summer Winter Race Asian Black American IndianAlaska Native OtherNA White Region Midwest Northeast South West Urbanization Central City Suburban Non-metropolitan
872
09 302 146 772 865 871 862 881 900 916
874 871 873 869
691 831 822 804 890
891 883 875 837
856 877 885
11
00 05 03 20 23 17 11 09 09 09
11 11 11 11
08 11 14 12 11
12 11 11 11
11 11 11
001
008 016 011 006 005 004 003 002 001 002
002 002 002 002
006 003 018 004 001
002 002 002 002
002 001 002
00
00 00 00 00 00 00 00 00 00 00
00 00 00 00
00 00 00 00 00
00 00 00 00
00 00 00
00
00 00 00 00 00 00 00 00 00 00
00 00 00 00
00 00 00 00 00
00 00 00 00
00 00 00
00
00 00 00 00 00 00 00 00 00 02
00 00 00 00
00 00 00 00 00
00 00 00 00
00 00 00
04
00 00 00 04 09 07 04 04 04 04
04 04 04 04
00 03 03 03 04
04 04 04 03
04 04 04
09
00 00 00 14 20 14 09 08 08 08
09 09 09 08
04 07 09 09 09
09 09 09 08
08 09 09
15
00 05 00 29 33 24 15 13 13 13
15 15 15 14
12 14 17 16 15
15 15 15 14
14 15 15
23
00 18 08 44 47 35 23 20 19 19
24 23 24 23
19 23 36 27 23
25 23 23 24
23 24 23
31
00 30 17 60 58 43 28 25 23 23
31 31 31 31
29 33 41 34 30
33 29 31 32
31 31 31
51
00 48 46 85 87 67 40 39 35 29
49 51 52 51
45 63 62 56 49
57 45 49 51
51 50 50
200
18 73 73 200 132
113 75 62 84 43
146 116
171 200
146 116
200 75 171
120 98 171 200
132 146 200
a SE
Source
Includes breads rolls muffins bagels biscuits cornbread and tortillas = Standard error
US EPA analysis of the 1994ndash1996 CSFII
Exposure F
actors Handbook
Chapter 12mdash
Intake of Grain Products
Page E
xposure Factors H
andbook 12-26
September 2011
Table 12-18 Per Capita Intake of Sweets a Based on 1994ndash1996 1998 CSFII (gkg-day as-consumed)
Population Group Percent Consuming
Percentile Mean SE 1st 5th 10th 25th 50th 75th 90th 95th 99th Max
Whole Population Age Group lt5 months 6 to 12 months lt1 year 1 to 2 years 3 to 5 years 6 to 11 years 12 to 19 years 20 to 39 years 40 to 69 years ge70 years Season Fall Spring Summer Winter Race Asian Black American IndianAlaska Native OtherNA White Region Midwest Northeast South West Urbanization Central City Suburban Non-metropolitan
526
25 230 121 532 621 642 543 472 529 586
537 522 500 545
402 414 353 350 563
601 554 491 477
512 546 505
06
00 03 02 12 13 12 06 04 05 05
06 06 05 06
04 05 04 04 06
07 06 06 05
06 06 06
001
004 014 010 007 006 006 003 002 002 003
003 002 002 003
008 004 011 005 001
003 003 002 002
002 002 003
00
00 00 00 00 00 00 00 00 00 00
00 00 00 00
00 00 00 00 00
00 00 00 00
00 00 00
00
00 00 00 00 00 00 00 00 00 00
00 00 00 00
00 00 00 00 00
00 00 00 00
00 00 00
00
00 00 00 00 00 00 00 00 00 00
00 00 00 00
00 00 00 00 00
00 00 00 00
00 00 00
00
00 00 00 00 00 00 00 00 00 00
00 00 00 00
00 00 00 00 00
00 00 00 00
00 00 00
01
00 00 00 03 08 06 02 00 01 02
02 01 00 02
00 00 00 00 02
03 02 00 00
01 02 01
08
00 00 00 17 19 17 10 06 07 08
09 08 07 09
06 06 03 05 09
10 09 08 07
08 09 08
18
00 11 04 35 36 32 18 14 13 16
18 18 16 19
14 15 17 13 18
20 17 17 16
16 18 18
25
00 20 10 48 46 39 24 19 19 21
25 26 23 26
20 23 21 19 25
29 25 23 23
23 26 25
46
04 36 36 72 88 67 37 32 32 36
47 47 41 48
31 47 28 41 47
53 48 44 38
46 45 51
220
06 64 64 193 220 209 107
111 73 57
209 220 182 123
157 193
29 70 220
220 127 209 157
209 127 220
a SE
Source
Includes breakfast foods made with grains such as pancakes waffles and French toast = Standard error
US EPA analysis of the 1994ndash1996 CSFII
Exposure F
actors Handbook
Chapter 12mdash
Intake of Grain Products
Exposure F
actors Handbook
Page Septem
ber 2011 12-27
Table 12-19 Per Capita Intake of Snacks Containing Grains a Based on 1994ndash1996 1998 CSFII (gkg-day as-consumed)
Population Group Percent Consuming
Percentile Mean SE 1st 5th 10th 25th 50th 75th 90th 95th 99th Max
Whole Population Age Group lt5 months 6 to 12 months lt1 year 1 to 2 years 3 to 5 years 6 to 11 years 12 to 19 years 20 to 39 years 40 to 69 years ge70 years Season Fall Spring Summer Winter Race Asian Black American IndianAlaska Native OtherNA White Region Midwest Northeast South West Urbanization Central City Suburban Non-metropolitan
431
10 290 141 581 567 513 450 411 411 377
423 436 406 458
241 295 383 284 471
492 419 411 407
401 446 441
02
00 03 01 07 07 05 03 02 01 01
02 03 02 03
01 02 02 02 03
03 02 02 02
02 03 02
001
011 008 006 004 004 003 002 001 001 001
001 001 001 002
004 002 008 003 001
001 002 001 002
001 001 001
00
00 00 00 00 00 00 00 00 00 00
00 00 00 00
00 00 00 00 00
00 00 00 00
00 00 00
00
00 00 00 00 00 00 00 00 00 00
00 00 00 00
00 00 00 00 00
00 00 00 00
00 00 00
00
00 00 00 00 00 00 00 00 00 00
00 00 00 00
00 00 00 00 00
00 00 00 00
00 00 00
00
00 00 00 00 00 00 00 00 00 00
00 00 00 00
00 00 00 00 00
00 00 00 00
00 00 00
00
00 00 00 04 03 01 00 00 00 00
00 00 00 00
00 00 00 00 00
00 00 00 00
00 00 00
03
00 02 00 11 09 06 04 02 02 01
03 03 02 03
00 01 02 01 03
03 02 02 02
02 03 03
07
00 09 06 20 18 13 09 06 05 03
07 08 07 08
04 05 06 05 08
08 07 07 07
07 07 07
12
00 22 09 28 32 19 14 09 07 05
10 13 10 13
10 09 11 08 12
12 12 11 12
11 12 11
26
01 25 22 50 59 46 24 18 14 08
23 29 23 29
23 21 32 24 27
27 27 24 26
26 27 23
91
37 28 37 89 91 73 51 55 56 18
80 89 71 91
44 74 49 87 91
89 91 80 87
78 91 81
a SE
Source
Includes grain snacks such as crackers salty snacks popcorn and pretzels = Standard error
US EPA analysis of the 1994ndash1996 CSFII
Exposure F
actors Handbook
Chapter 12mdash
Intake of Grain Products
Page E
xposure Factors H
andbook 12-28
September 2011
Table 12-20 Per Capita Intake of Breakfast Foods a Based on 1994ndash1996 1998 CSFII (gkg-day as-consumed)
Population Group Percent Consuming
Percentile Mean SE 1st 5th 10th 25th 50th 75th 90th 95th 99th
Max
Whole Population Age Group lt5 months 6 to 12 months lt1 year 1 to 2 years 3 to 5 years 6 to 11 years 12 to 19 years 20 to 39 years 40 to 69 years ge70 years Season Fall Spring Summer Winter Race Asian Black American IndianAlaska Native OtherNA White Region Midwest Northeast South West Urbanization Central City Suburban Non-metropolitan
118
00 42 20 204 208 237 130
89 95 104
116 116
128 113
59 127
88 102 120
121 127 107 124
120 122 107
01
00 01 01 04 04 04 01 01 01 01
01 01 01 01
01 01 01 01 01
01 01 01 02
01 01 01
001
000 024 016 007 006 005 003 002 001 002
002 002 002 002
007 003 008 005 001
002 003 002 002
002 002 002
00
00 00 00 00 00 00 00 00 00 00
00 00 00 00
00 00 00 00 00
00 00 00 00
00 00 00
00
00 00 00 00 00 00 00 00 00 00
00 00 00 00
00 00 00 00 00
00 00 00 00
00 00 00
00
00 00 00 00 00 00 00 00 00 00
00 00 00 00
00 00 00 00 00
00 00 00 00
00 00 00
00
00 00 00 00 00 00 00 00 00 00
00 00 00 00
00 00 00 00 00
00 00 00 00
00 00 00
00
00 00 00 00 00 00 00 00 00 00
00 00 00 00
00 00 00 00 00
00 00 00 00
00 00 00
00
00 00 00 00 00 00 00 00 00 00
00 00 00 00
00 00 00 00 00
00 00 00 00
00 00 00
04
00 00 00 19 16 15 05 00 00 01
04 04 05 03
00 04 00 00 04
04 05 02 05
04 05 03
10
00 00 00 27 25 22 09 06 06 07
10 10 10 09
06 12 03 09 10
11 12 08 10
10 10 09
24
00 41 27 48 45 34 23 15 14 12
23 23 24 26
20 21 12 26 24
26 23 22 26
25 24 22
136
00 41 41 136
80 65 39 30 38 35
136
64 60 80
28 67 12 80 136
67 80 78 136
136
78 64
a SE
Source
Includes breakfast food made with grains such as pancakes waffles and French toast = Standard error
US EPA analysis of the 1994ndash1996 CSFII
Exposure F
actors Handbook
Chapter 12mdash
Intake of Grain Products
Exposure F
actors Handbook
Page Septem
ber 2011 12-29
Table 12-21 Per Capita Intake of Pasta Based on 1994ndash1996 1998 CSFII (gkg-day as-consumed) Population Group
Percent
Consuming Percentile
Mean SE 1st 5th 10th 25th 50th 75th 90th 95th 99th Max Whole Population
Age Group lt5 months 6 to 12 months lt1 year 1 to 2 years 3 to 5 years 6 to 11 years 12 to 19 years 20 to 39 years 40 to 69 years ge70 years Season Fall Spring Summer Winter Race Asian Black American IndianAlaska Native OtherNA White Region Midwest Northeast South West Urbanization Central City Suburban Non-metropolitan
130
00 75 35 160 128 134
117 139 137 90
136 132 126 126
194 70 18 96 141
121 201 95 132
134 140 103
03
00 01 01 08 06 05 03 03 02 02
03 03 03 03
05 02 01 02 03
03 05 02 03
03 03 02
002
000 022 015 015 013 012 009 004 003 006
005 005 005 006
017 010 023 009 003
005 005 005 005
005 003 005
00
00 00 00 00 00 00 00 00 00 00
00 00 00 00
00 00 00 00 00
00 00 00 00
00 00 00
00
00 00 00 00 00 00 00 00 00 00
00 00 00 00
00 00 00 00 00
00 00 00 00
00 00 00
00
00 00 00 00 00 00 00 00 00 00
00 00 00 00
00 00 00 00 00
00 00 00 00
00 00 00
00
00 00 00 00 00 00 00 00 00 00
00 00 00 00
00 00 00 00 00
00 00 00 00
00 00 00
00
00 00 00 00 00 00 00 00 00 00
00 00 00 00
00 00 00 00 00
00 00 00 00
00 00 00
00
00 00 00 00 00 00 00 00 00 00
00 00 00 00
00 00 00 00 00
00 00 00 00
00 00 00
10
00 00 00 34 21 20 08 11 10 00
12 11 09 08
20 00 00 00 11
08 19 00 09
12 12 01
22
00 10 00 62 44 38 21 22 19 13
24 23 21 21
33 17 00 20 23
21 28 18 22
25 22 15
51
00 33 23 106
84 75 42 41 36 29
47 58 52 51
66 36 24 35 53
52 59 44 57
53 53 42
291
00 67 67 167 143
119 291
112 118
77
167 147 154 291
112 291
36 154 167
167 154 291 141
291 167 141
SE
Source
= Standard error
US EPA analysis of the 1994ndash1996 CSFII
Exposure F
actors Handbook
Chapter 12mdash
Intake of Grain Products
Page E
xposure Factors H
andbook 12-30
September 2011
Table 12-22 Per Capita Intake of Cooked Cereals Based on 1994ndash1996 1998 CSFII (gkg-day as-consumed)
Population Group Percent Consuming
Percentile Mean SE 1st 5th 10th 25th 50th 75th 90th 95th 99th Max
Whole Population Age Group lt5 months 6 to 12 months lt1 year 1 to 2 years 3 to 5 years 6 to 11 years 12 to 19 years 20 to 39 years 40 to 69 years ge70 years Season Fall Spring Summer Winter Race Asian Black American IndianAlaska Native OtherNA White Region Midwest Northeast South West Urbanization Central City Suburban Non-metropolitan
104
09 166
83 184 160
87 56 62
116 245
120
91 93
111
44 201
76 76 93
96 90 124
94
116 99 97
04
01 19 09 16 13 05 02 01 03 06
04 03 03 04
02 07 03 04 03
03 03 04 04
04 03 03
004
054 118 082 029 028 017 009 005 003 007
008 006 008 008
020 010 032 030 004
007 010 006 009
008 005 007
00
00 00 00 00 00 00 00 00 00 00
00 00 00 00
00 00 00 00 00
00 00 00 00
00 00 00
00
00 00 00 00 00 00 00 00 00 00
00 00 00 00
00 00 00 00 00
00 00 00 00
00 00 00
00
00 00 00 00 00 00 00 00 00 00
00 00 00 00
00 00 00 00 00
00 00 00 00
00 00 00
00
00 00 00 00 00 00 00 00 00 00
00 00 00 00
00 00 00 00 00
00 00 00 00
00 00 00
00
00 00 00 00 00 00 00 00 00 00
00 00 00 00
00 00 00 00 00
00 00 00 00
00 00 00
00
00 00 00 00 00 00 00 00 00 00
00 00 00 00
00 00 00 00 00
00 00 00 00
00 00 00
06
00 94 00 69 53 00 00 00 09 22
11 00 00 09
00 22 00 00 00
00 00 11 00
09 00 00
23
00 161
57 107
79 40 10 11 19 34
26 20 21 25
00 44 21 20 20
21 22 26 23
26 21 23
72
00 228 228 206 161
94 43 33 44 56
81 64 69 74
53 109
58 106
61
57 59 79 80
81 69 57
725
56 228 228 339 725 241 106
92 87 106
459 209 725 445
161 339 123 725 459
459 725 317 395
725 459 269
SE
Source
= Standard error
US EPA analysis of the 1994ndash1996 CSFII
Exposure F
actors Handbook
Chapter 12mdash
Intake of Grain Products
Exposure F
actors Handbook
Page Septem
ber 2011 12-31
Table 12-23 Per Capita Intake of Ready-to-Eat Cereals a Based on 1994ndash1996 1998 CSFII (gkg-day as-consumed)
Population Group Percent Consuming
Percentile Mean SE 1st 5th 10th 25th 50th 75th 90th 95th 99th Max
Whole Population Age
lt5 months 6 to 12 months lt1 year 1 to 2 years 3 to 5 years 6 to 11 years 12 to 19 years 20 to 39 years 40 to 69 years ge70 years Season Fall Spring Summer Winter Race Asian Black American IndianAlaska Native OtherNA White Region Midwest Northeast South West Urbanization Central City Suburban Non-metropolitan
397
00 199
93 649 698 640 457 305 318 479
391 401 396 399
254 340 331 333 417
422 423 374 384
400 412 358
03
00 01 01 10 11 08 04 02 02 02
03 03 03 03
02 03 03 03 03
04 04 03 03
03 04 03
001
000 007 005 004 004 003 002 001 001 001
002 002 002 002
005 002 009 004 001
002 002 001 002
001 001 001
00
00 00 00 00 00 00 00 00 00 00
00 00 00 00
00 00 00 00 00
00 00 00 00
00 00 00
00
00 00 00 00 00 00 00 00 00 00
00 00 00 00
00 00 00 00 00
00 00 00 00
00 00 00
00
00 00 00 00 00 00 00 00 00 00
00 00 00 00
00 00 00 00 00
00 00 00 00
00 00 00
00
00 00 00 00 00 00 00 00 00 00
00 00 00 00
00 00 00 00 00
00 00 00 00
00 00 00
00
00 00 00 07 09 06 00 00 00 00
00 00 00 00
00 00 00 00 00
00 00 00 00
00 00 00
04
00 00 00 15 17 12 06 03 02 04
04 04 04 05
01 04 04 03 05
05 05 04 04
05 05 04
10
00 03 00 25 26 20 11 07 06 07
11 10 11 10
08 10 08 11 11
11 11 10 11
11 11 08
15
00 10 03 33 33 25 15 10 09 09
16 15 16 14
12 15 14 17 15
16 16 13 16
15 16 12
29
00 18 17 49 48 40 22 17 14 15
29 29 30 27
27 32 26 30 28
29 29 28 31
28 31 26
101
00 26 26 88 101
80 64 53 52 27
88 77 78 101
49 101
44 66 88
80 80 101
88
101 80 88
a SE
Source
Includes dry ready-to-eat corn rice wheat and bran cereals in the form of flakes puffs etc = Standard error
US EPA analysis of the 1994ndash1996 CSFII
Exposure F
actors Handbook
Chapter 12mdash
Intake of Grain Products
Page E
xposure Factors H
andbook 12-32
September 2011
Table 12-24 Per Capita Intake of Baby Cereals Based on 1994ndash1996 1998 CSFII (gkg-day as-consumed)
Population Group Percent Consuming
Percentile Mean SE 1st 5th 10th 25th 50th 75th 90th 95th 99th Max
Whole Population Age
lt5 months 6 to 12 months lt1 year 1 to 2 years 3 to 5 years 6 to 11 years 12 to 19 years 20 to 39 years 40 to 69 years ge70 years Season Fall Spring Summer Winter Race Asian Black American IndianAlaska Native OtherNA White Region Midwest Northeast South West Urbanization Central City Suburban Non-metropolitan
10
408 678 534
62 03 01 00 00 01 00
09 12 08 11
07 10 06 17 10
11 12 09 09
11 11 08
00
08 25 16 02 00 00 00 00 00 00
00 00 00 00
00 00 00 01 00
00 00 00 00
00 00 00
003
024 045 027 010 006 000 000 000 000 000
007 005 006 006
004 012 004 020 003
008 004 005 006
006 004 006
00
00 00 00 00 00 00 00 00 00 00
00 00 00 00
00 00 00 00 00
00 00 00 00
00 00 00
00
00 00 00 00 00 00 00 00 00 00
00 00 00 00
00 00 00 00 00
00 00 00 00
00 00 00
00
00 00 00 00 00 00 00 00 00 00
00 00 00 00
00 00 00 00 00
00 00 00 00
00 00 00
00
00 00 00 00 00 00 00 00 00 00
00 00 00 00
00 00 00 00 00
00 00 00 00
00 00 00
00
00 08 02 00 00 00 00 00 00 00
00 00 00 00
00 00 00 00 00
00 00 00 00
00 00 00
00
10 28 17 00 00 00 00 00 00 00
00 00 00 00
00 00 00 00 00
00 00 00 00
00 00 00
00
24 69 41 00 00 00 00 00 00 00
00 00 00 00
00 00 00 00 00
00 00 00 00
00 00 00
00
31 113
73 08 00 00 00 00 00 00
00 00 00 00
00 00 00 00 00
00 00 00 00
00 00 00
01
88 211 197
58 00 00 00 00 00 00
00 06 00 03
00 00 00 12 00
03 05 00 00
03 01 00
376
266 376 376 125
38 01 00 00 03 00
211 266 260 376
21 376
09 266 260
211 125 376 266
376 211 260
SE
Source
= Standard error
US EPA analysis of the 1994ndash1996 CSFII
Exposure F
actors Handbook
Chapter 12mdash
Intake of Grain Products
Exposure F
actors Handbook
Page Septem
ber 2011 12-33
Table 12-25 Quantity (as-consumed) of Grain Products Consumed per Eating Occasion and the Percentage of Individuals Using These Foods in 2 Days
Indiv Using Quantity Consumed per Consumers Only Food at Least Eating Occasion Quantity Consumed per Eating Occasion at Specified Percentiles
Food Category Once in 2 days (grams) (grams) Average SE 5th 10th 25th 50th 75th 90th 95th
White bread 596 50 1 21 24 33 46 52 78 104 Whole grain and wheat bread 281 50 1 24 25 37 50 56 72 92 Rolls 480 58 1 27 33 43 48 70 89 110 Biscuits 109 61 1 19 19 35 57 76 104 139 Tortillas 155 60 1 14 21 32 48 79 107 135 Quick breads and muffins 125 82 2 21 28 52 60 94 142 187 Doughnuts and sweet rolls 124 77 1 26 36 47 65 93 133 164 Crackers 174 26 1 6 9 12 18 30 47 62 Cookies 307 40 1 9 12 20 31 50 75 96 Cake 162 92 3 22 28 41 77 116 181 217 Pie 85 150 3 52 72 102 143 168 246 300 Pancakes and waffles 103 85 3 21 35 42 75 109 158 205 Cooked cereal 103 248 6 81 117 157 233 291 455 484 Oatmeal 61 264 6 116 117 176 232 333 454 473 Ready-to-eat cereal 406 54 1 18 24 30 46 67 93 113 Corn flakes 81 46 1 17 22 25 37 56 75 100 Toasted oat rings 68 42 1 14 16 27 38 54 65 83 Rice 280 150 3 27 40 76 131 192 312 334 Pasta 360 162 3 26 43 73 133 210 318 420 Macaroni and cheese 85 244 9 53 81 121 191 324 477 556 Spaghetti with tomato sauce 80 436 15 122 124 246 371 494 740 983 Pizza 199 169 5 36 52 78 140 214 338 422 SE = Standard error
Source Smiciklas-Wright et al (2002) (based on 1994ndash1996 CSFII data)
Exposure F
actors Handbook
Chapter 12mdash
Intake of Grain Products
Page E
xposure Factors H
andbook 12-34
September 2011
Table 12-26 Quantity (as-consumed) of Grain Products Consumed per Eating Occasion and Percentage of Individuals Using These Foods in 2 Days by Sex and Age
Food Category
Quantity Consumed per Eating Occasion (grams) 2 to 5 years 6 to 11 years 12 to 19 years
Males and Females (N = 2109)
Males and Females Males (N = 1432) (N = 696)
Females (N = 702)
PC Mean SE PC Mean SE PC Mean SE PC Mean SE White bread
Whole grain and wheat bread Rolls Biscuits
Tortillas Quick breads and muffins
Doughnuts and sweet rolls Crackers
Cookies Cake
Pie Pancakes and waffles Cooked cereal
Oatmeal Ready-to-eat cereal Corn flakes Toasted oat rings Rice
Pasta Macaroni and cheese Spaghetti with tomato sauce
Pizza Corn chips
Popcorn
669 243 400
83 146
96 113
254 510 146
29 191 168 104 729
112 206 296 494 178 168 237 196
116
34 37 39 38 32 55 59 17 28 70 76 49
211 221
33 33 30 84 90 159 242
86 29 20
a
1 1 2 2 4 2 1 1 3 8 1
10 9 1 2 1 3 3 8 11 3 2 1
671 205 535
97 164
96 134 172 467 197
56 215
90 57 673 131 125 246 414 132
115 328 256 127
42 44 48 48 47 67 69 26 37 79
116 77 245 256
47 42 45 124 130 217 322 108
33 31
1 1 1 3 2 5 2 2 2 4 8 3
14 19
1 2 2 6 5
13 18
6 2 2
613 145 619 122 229
110 173 106 290 151
66 135
52 24 456 104
73 242 334
75 101 396 269
78
56 60 69 72 76 125 102
39 53 99 188
96 310b
348b
72 62 62 203 203 408 583 205
58 54
1 2 2 4 5
12 12
5 3 9
15 6
29b
45b
3 4 5
10 9
46 46 13
5 5
579 176 488 103 201
110 138 142 318 155
48 82 60 23 463
87 81 288 378 107
85 305 251 105
47 53 51 55 56 79 78 26 42 85
138b
74 256b
321b
52 49 42 157 155 260 479 143
44 37
1 2 1 4 3
10 5 3 2 8
12b
5 31b
40b
2 4 3
10 9
30 51
8 3 4
Exposure F
actors Handbook
Chapter 12mdash
Intake of Grain Products
Exposure F
actors Handbook
Page Septem
ber 2011 12-35
Exposure F
actors Handbook
Chapter 12mdash
Intake of Grain Products
Page E
xposure Factors H
andbook 12-36
September 2011
Table 12-26 Quantity (as-consumed) of Grain Products Consumed per Eating Occasion and Percentage of Individuals Using These Foods in 2 Days by Sex and Age (continued)
Food Category
Quantity Consumed per Eating Occasion (g) 20 to lt40 years 40 to lt60 years gt60 years
Males Females (N = 1543) (N = 1449)
Males Females (N = 1663) (N = 1694)
Males Females (N = 1545) (N = 1429)
PC Mean SE PC Mean SE PC Mean SE PC Mean SE PC Mean SE PC Mean SE White bread
Whole grain and wheat bread Rolls Biscuits
Tortillas Quick breads and muffins
Doughnuts and sweet rolls Crackers
Cookies Cake
Pie Pancakes and waffles Cooked cereal
Oatmeal Ready-to-eat cereal Corn flakes Toasted oat rings Rice
Pasta Macaroni and cheese
Spaghetti with tomato sauce Pizza
Corn chips Popcorn
630 253 620
115 206
80 133
119 208 135
58 80 52 27 269
65 42 308 371
78 86 237 162
81
63 63 73 73 79 93 94 36 56
113 161 126 313 360a
77 73 62 199 214 301 630 253
61 63
2 1 4 3 4 7 5 3 4 6 7
15 30 42a
3 6 4 9 8
19 48 12
5 6
549 252 464
94 201
113 112
156 265 149
72 74 73 37 347
53 54 321 371
78 78 202 179
97
47 48 53 55 53 79 68 28 39 94 150
80 219 258
55 43 42 139 155 235 385 150
35 35
1 1 1 2 2 5 2 2 2 7 9 6 11
17 1 2 2 6 6
19 22
6 2 2
597 328 479 134 134 157 134 166 276 165
118 75 97 60 298
59 48 294 343
61 55 130 128
96
59 57 65 80 67 93 88 30 47 108 162
117 300 332
68 49 46 167 208 302 543 220
47 50
2 1 1 3 3 7 4 1 2 6 6 8
16 16
2 3 2 5 7
31 59 13
4 4
553 323 434
112 127 149
110 175 290 168
99 80 103
62 297
52 41 288 347
60 54 145 120 109
46 46 52 56 52 72 72 24 36 83 151
74 243 242
51 40 35 130 140 210 386 147
33 39
1 2 1 2 2 4 4 1 1 4 8 5 11
10 1 3 2 4 5
12 18
8 2 3
593 398 378 130
42 174
114 256 297 192 164 108 209 136 446 124
43 231 279
71 50 53 48 61
51 48 54 58 47 86 65 23 40 85 154
99 255 257
53 37 36 147 167 230 450 187
30 52
1 1 1 3 4 5 2 1 2 4 7 5 8
10 1 2 3 6 7
13 22 18
3 4
548 431 306
98 54 183 104 259 322 183 133
82 202 129 440 104
49 214 279
65 45 47 53 76
41 41 43 48 41 72 56 17 30 87 137
68 216 224
41 30 27
118 132 215 379 109
21 34
1 1 1 3 2 4 2 1 1 7 5 4 8
10 1 1 2 5 5
18 33
8 2 3
a Indicates a SE value that is greater than 0 but less than 05 b Indicates a statistic that is potentially unreliable because of small sample size or large coefficient of variation N = Sample size
PC = Percent consuming at least once in 2 days SE = Standard error of the mean
Source Smiciklas-Wright et al (2002) (based on 1994ndash1996 CSFII data)
Exposure Factors Handbook
Chapter 12mdashIntake of Grain Products
Table 12-27 Consumption of Major Food Groups by Older Adults Median Daily Servings (and ranges) by Demographic and Health Characteristics
Subject Characteristic N Bread Cereal Rice and Pasta (servingsday) Sex a
Females 80 27 (09ndash65) Males 50 36 (14ndash73)
Ethnicity African American 44 33 (14ndash64) European American 47 32 (09ndash68) Native American 39 29 (11ndash73)
Age 70 to 74 years 42 33 (11ndash63) 75 to 79 years 36 30 (09ndash68) 80 to 84 years 36 32 (15ndash64) gt85 years 16 36 (16ndash73)
Marital Status Married 49 33 (11ndash58) Not Married 81 30 (09ndash73)
Education 8th grade or less 37 31 (11ndash73) 9th to 12th grades 47 33 (11ndash68) gtHigh School 46 32 (09ndash65)
Dentures Yes 83 33 (11ndash64) No 47 31 (09ndash73)
Chronic Diseases 0 7 41 (22ndash64) 1 31 33 (09ndash73) 2 56 31 (11ndash58) 3 26 37 (11ndash58) gt4 10 29 (14ndash53)
Weightb
le130 pounds 18 31 (11ndash54) 131 to 150 pounds 32 33 (09ndash52) 151 to 170 pounds 27 31 (14ndash73) 171 to 190 pounds 22 36 (14ndash62) ge191 pounds 29 30 (11ndash68)
a p lt 005 b 2 missing values N = Number of subjects
Source Vitolins et al (2002)
Exposure Factors Handbook Page September 2011 12-37
Exposure Factors Handbook
Chapter 12mdashIntake of Grain Products
Table 12-28 Characteristics of the Feeding Infant and Toddlers Study (FITS) Sample Population Sample Size Percentage of Sample
Sex Males Females
1549 1473
513 487
Age of Child 4 to 6 months 7 to 8 months 9 to 11 months 12 to 14 months 15 to 18 months 19 to 24 months
862 483 679 374 308 316
285 160 225 124 102 104
Childrsquos Ethnicity Hispanic or Latino Non-Hispanic or Latino Missing
367 2641
14
121 874 05
Childrsquos Race White Black Other
2417 225 380
800 74 126
Urbanicity Urban Suburban Rural Missing
1389 1014 577 42
460 336 191 13
Household Income Under $10000 $10000 to $14999 $15000 to $24999 $25000 to $34999 $35000 to $49999 $50000 to $74999 $75000 to $99999 $100000 and Over Missing
48 48
221 359 723 588 311 272 452
16 16 73 119 239 195 103 90 149
Receives WIC Yes No Missing
821 2196
5
272 726 02
Sample Size (Unweighted) 3022 1000 WIC = Special Supplemental Nutrition Program for Women Infants and Children
Source Devaney et al (2004)
Page Exposure Factors Handbook 12-38 September 2011
Table 12-29 Percentage of Infants and Toddlers Consuming Different Types of Grain Products Percentage of Infants and Toddlers Consuming at Least Once in a Day
Food GroupFood 4 to 6 7 to 8 9 to 11 12 to 14 15 to 18 19 to 24 Months Months Months Months Months Months
Any Grain or Grain Product 658 915 975 978 986 992 Infant Cereals 648 812 638 239 92 31 Non-infant Cerealsa 06 183 443 589 605 519
Not Pre-sweetened 05 170 370 445 406 319 Pre-sweetenedb 00 18 90 177 264 227
Breads and Rollsc 06 99 245 473 527 531 Crackers Pretzels Rice Cakes 30 162 334 452 464 447 Cereal or Granola Bars 00 11 34 98 100 97 Pancakes Waffles French Toast 01 08 75 151 161 154 Rice and Pastad 23 45 182 262 390 359 Other 02 01 27 28 25 45 Grains in Mixed Dishes 04 53 241 483 520 551 Sandwiches 00 11 86 215 258 258 Burrito Taco Enchilada Nachos 00 00 10 45 28 21 Macaroni and Cheese 02 16 49 146 150 150 Pizza 01 07 22 68 90 94 Pot PieHot Pocket 00 09 05 20 10 18 Spaghetti Ravioli Lasagna 01 18 99 153 121 88 a Includes both ready-to-eat and cooked cereals b Defined as cereals with more than 211 grams sugar per 100 grams c Does not include bread in sandwiches Sandwiches are included in mixed dishes d Does not include rice or pasta in mixed dishes
Source Fox et al (2004)
Exposure Factors Handbook
Chapter 12mdashIntake of Grain Products
Exposure Factors Handbook Page September 2011 12-39
Table 12-30
a Characteristics of Women Infants and Children (WIC) Participants and Non-Participants (percentages)
Infants 4 to 6 month Infants 7 to 11 month Toddlers 12 to 24 month WIC
Participant Non-Participant WIC
Participant Non-Participant WIC
Participant Non-Participant Sex Males 55 Females 45
Childrsquos Ethnicity Hispanic or Latino 20 Non-Hispanic or Latino 80
Childrsquos Race White 69 Black 15 Other 22
Child in Daycare Yes 39 No 61 Age of Mother 14 to 19 years 18 20 to 24 years 33 25 to 29 years 29 30 to 34 years 9 gt35 years 9 Missing 2
Motherrsquos Education 11th Grade or Less 23 Completed High School 35 Some Postsecondary 33 Completed College 7 Missing 2
Parentrsquos Marital Status Married 49 Not Married 50 Missing 1
Mother or Female Guardian Works Yes 46 No 53 Missing 1
54 46
b
11 89
b 84
4 11
38 62
b 1
13 29 33 23
2 b 2
19 26 53
1 b
93 7 1
51 48
1
55 45
24 76
63 17 20
34 66
13 38 23 15
11 1 15 42 32
9 2 57 42
1 45 54
1
51 49
b 8
92 b
86 5 9 b
46 54
b 1 11
30 36 21
1 b 2
20 27 51
0 b
93 7 0 b
60 40
0
57 43
22 78
67 13 20
43 57
9
33 29 18
11 0
17 42 31
9 1
58 41
1
55 45
0
52 48
b 10 89
b 84
5 11
c
53 47
b 1
14 26 34 26
1 b 3
19 28 48
2 b
88 11 1
c
61 38
1
Exposure Factors Handbook
Chapter 12mdashIntake of Grain Products
Page Exposure Factors Handbook 12-40 September 2011
c
Table 12-30 Characteristics of Women Infants and Children (WIC) Participants and Non-Participantsa
(percentages) (continued) Infants 4 to 6 months Infants 7 to 11 months Toddlers 12 to 24 months
WIC WIC WIC Participant Non-Participant Participant Non-Participant Participant Non-Participant
Urbanicity c c c
Urban 34 55 37 50 35 48 Suburban 36 31 31 34 35 35 Rural 28 13 30 15 28 16 Missing 2 1 2 1 2 2
Sample Size (Unweighted) 265 597 351 808 205 791 a χ2 tests were conducted to test for statistical significance in the differences between WIC participants and nonshy
participants within each age group for each variable The results of χ2 tests are listed next to the variable under the column labeled non-participants for each of the three age groups
b = p lt 005 non-participants significantly different from WIC participants on the variable = p lt 001 non-participants significantly different from WIC participants on the variable
WIC = Special Supplemental Nutrition Program for Women Infants and Children
Source Ponza et al (2004)
Table 12-31 Food Choices for Infants and Toddlers by Women Infants and Children (WIC) Participation Status
Infants 4 to 6 months Infants 7 to 11 months Toddlers 12 to 24 months WIC Non- WIC Non- WIC Non-
Participant Participant Participant Participant Participant Participant 697 Infant Cereals 697 625 747 135 92
Non-infant Cereals Total 09 05 217 385a 581 560
Not Pre-sweetened 05 05 187 329a 437 363 Pre-sweetened 00 00 40 69 177 241
Grains in Combination Foods 09 01 188 147 503 529 Sample Size (unweighted) 265 597 351 808 205 791 a = p lt 001 non-participants significantly different from WIC participants WIC = Special Supplemental Nutrition Program for Women Infants and Children
Source Ponza et al (2004)
Exposure Factors Handbook
Chapter 12mdashIntake of Grain Products
Exposure Factors Handbook Page September 2011 12-41
Table 12-32 Average Portion Sizes per Eating Occasion of Grain Products Commonly Consumed by Infants From the 2002 Feeding Infants and Toddlers Study
4 to 5 months 6 to 8 months 9 to 11 months Reference Food Group (N = 624) (N = 708) (N = 687) Unit Mean plusmn SE Infant cereal dry tablespoon 31 plusmn 014 45 plusmn 014 52 plusmn 018 Infant cereal jarred tablespoon - 56 plusmn 026 74 plusmn 034 Ready-to-eat cereal tablespoon - 23 plusmn 034 34 plusmn 021 Crackers ounce - 02 plusmn 002 03 plusmn 001 Crackers saltine - 22 plusmn 014 27 plusmn 012 Bread slice - 05 plusmn 010 08 plusmn 006 - = Cell size was too small to generate a reliable estimate N = Number of respondents SE = Standard error of the mean
Source Fox et al (2006)
Exposure Factors Handbook
Chapter 12mdashIntake of Grain Products
Table 12-33 Average Portion Sizes per Eating Occasion of Grain Products Commonly Consumed by Toddlers From the 2002 Feeding Infants and Toddlers Study
Food Group Reference Unit 12 to 14 months
(N = 371) 15 to 18 months
(N = 312) 19 to 24 months (N = 320)
Mean plusmn SE Bread slice 08 plusmn 004 09 plusmn 005 09 plusmn 005 Rolls ounce 09 plusmn 011 10 plusmn 010 09 plusmn 015 Ready-to-eat cereal cup 03 plusmn 002 05 plusmn 003 06 plusmn 004 Hot cereal prepared cup 06 plusmn 005 06 plusmn 005 07 plusmn 005 Crackers ounce 03 plusmn 002 04 plusmn 002 04 plusmn 002 Crackers saltine 33 plusmn 022 35 plusmn 022 37 plusmn 022 Pasta cup 04 plusmn 004 04 plusmn 004 05 plusmn 005 Rice cup 03 plusmn 004 04 plusmn 005 04 plusmn 005 Pancakes and waffles 1 (4-inch diameter) 10 plusmn 008 14 plusmn 021 14 plusmn 017 N = Number of respondents SE = Standard error of the mean
Source Fox et al (2006)
Page Exposure Factors Handbook 12-42 September 2011
c
Table 12-34 Percentage of Hispanic and Non-Hispanic Infants and Toddlers Consuming Different Types of Grain Products on a Given Day Age 4 to 5 months Age 6 to 11 months Age 12 to 24 months
Hispanic Non-Hispanic Hispanic Non-Hispanic Hispanic Non-Hispanic (N = 84) (N = 538) (N = 163) (N = 1228) (N = 124) (N = 871)
Any Grain or Grain Product Infant Cereal Non-infant Cereal Breadsb
Tortillas Crackers Pretzels Rice Cakes Pancakes Waffles French Toast Rice and Pastad
Rice Grains in Mixed Dishes
Sandwiches Burrito Taco Enchilada Nachos
565 552
-14c
14c
13c
------
569 565
----------
950 741 185a
182 40c
278 14c
201a
159e
159 40c
13c
935 736 292 151
-225 43
103 47
130 46 -
971 159 453 440 67a c
356 130 443
269a c
388a
242 21c
989 93
578 529 06c
469 160 329 130 544 249 30
Macaroni and Cheese - - 30c 31 101 155
Pizza - - - 14 10c e 97
Spaghetti Ravioli Lasagna - - 83c 46 93c 121 a = Significantly different from non-Hispanic at p lt 005 b Does not include bread in sandwiches Sandwiches are included in mixed dishes Includes tortillas also shown
separately = Statistic is potentially unreliable because of a high coefficient of variation
d Does not include rice or pasta in mixed dishes Includes rice (eg white brown wild and Spanish rice without meat) and pasta (eg spaghetti macaroni and egg noodles) Rice is also shown separately
e = Significantly different from non-Hispanic at p lt 001 - = Less than 1 of the group consumed this food on a given day N = Sample size
Source Mennella et al (2006)
Exposure Factors Handbook
Chapter 12mdashIntake of Grain Products
Exposure Factors Handbook Page September 2011 12-43
Exposure Factors Handbook
Chapter 12mdashIntake of Grain Products
Table 12-35 Mean Moisture Content of Selected Grain Products Expressed as Percentages of Edible Portions (grams per 100 grams of edible portion)
Food Moisture Content Comments Raw Cooked Barley―pearled 1009 6880 Corn―grain―endosperm 1037 -Corn―grain―bran 471 - crude Millet 867 7141 Oats 822 -Rice―white―long-grained 1162 6844 Rye 1095 -Rye―flour―medium 985 -Sorghum 920 -Wheat―hard white 957 -Wheat―germ 1112 - crude Wheat―bran 989 - crude Wheat―flour―whole grain 1027 -- Indicates that the grain product was not assessed for water content under these conditions
Source USDA (2007)
Page Exposure Factors Handbook 12-44 September 2011
- TABLE OF CONTENTS
- LIST OF TABLES
- 12 INTAKE OF GRAIN PRODUCTS
-
- 121 INTRODUCTION
- 122 RECOMMENDATIONS
- 123 INTAKE STUDIES
-
- 1231 Key Grain Intake Study
-
- 12311 US EPA Analysis of Consumption Data From 2003minus2006 National Health and Nutrition Examination Survey (NHANES)
-
- 1232 Relevant Grain Intake Studies
-
- 12321 USDA (1996a b 1993 1980)mdashFood and Nutrient Intakes of Individuals in 1 Day in the United States
- 12322 USDA (1999b)mdashFood Consumption Prices and Expenditures 1970minus1997
- 12323 USDA (1999a)mdashFood and Nutrient Intakes by Children 1994minus1996 1998 Table Set 17
- 12324 US EPA Analysis of Continuing Survey of Food Intake by Individuals (CSFII) 1994minus1996 1998
- 12325 Smiciklas-Wright et al (2002)mdashFoods Commonly Eaten in the United States Quantities Consumed per Eating Occasion and in a Day 1994minus1996
- 12326 Vitolins et al (2002)mdashQuality of Diets Consumed by Older Rural Adults
- 12327 Fox et al (2004)mdashFeeding Infants and Toddlers Study What Foods Are Infants and Toddlers Eating
- 12328 Ponza et al (2004)mdashNutrient Food Intakes and Food Choices of Infants and Toddlers Participating in WIC
- 12329 Fox et al (2006)mdashAverage Portion of Foods Commonly Eaten by Infants and Toddlers in the United States
- 123210 Mennella et al (2006)mdashFeeding Infants and Toddlers Study The Types of Foods Fed to Hispanic Infants and Toddlers
-
- 124 CONVERSION BETWEEN WET- AND DRY-WEIGHT INTAKE RATES
- 125 REFERENCES FOR CHAPTER 12
-
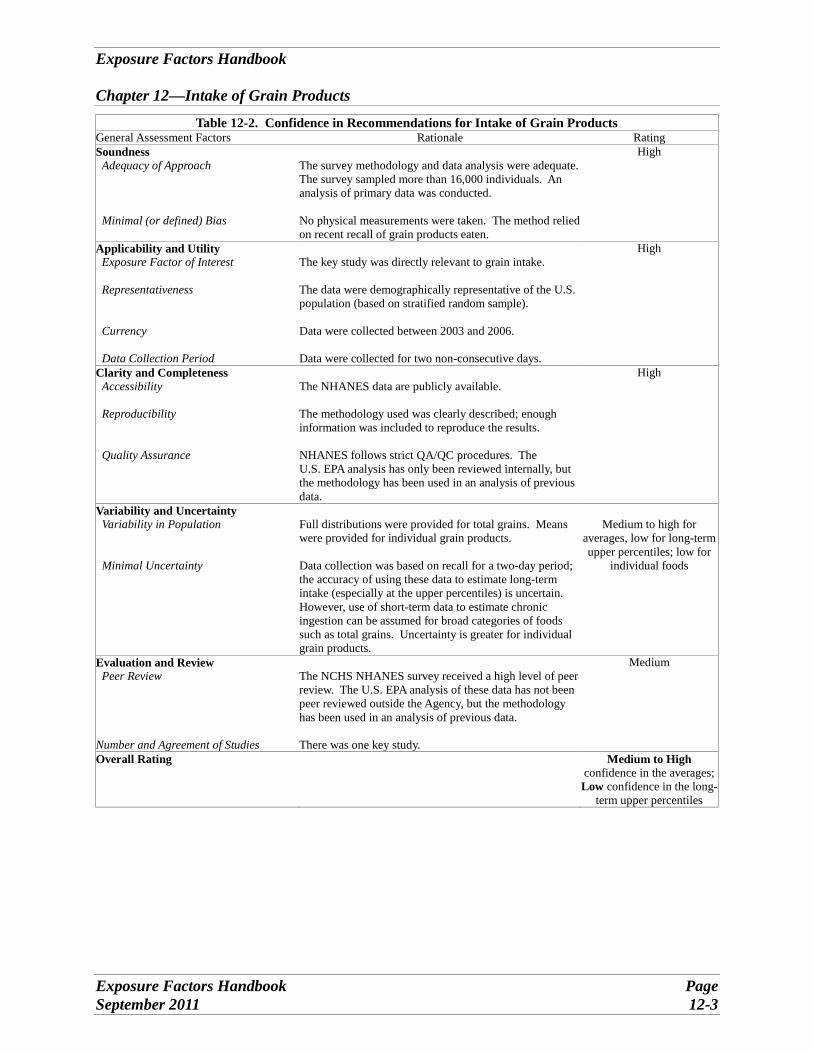
Exposure Factors Handbook
Chapter 12mdashIntake of Grain Products
Table 12-2 Confidence in Recommendations for Intake of Grain Products General Assessment Factors Rationale Rating Soundness
Adequacy of Approach
Minimal (or defined) Bias
The survey methodology and data analysis were adequate The survey sampled more than 16000 individuals An analysis of primary data was conducted
No physical measurements were taken The method relied on recent recall of grain products eaten
High
Applicability and Utility Exposure Factor of Interest
Representativeness
Currency
Data Collection Period
The key study was directly relevant to grain intake
The data were demographically representative of the US population (based on stratified random sample)
Data were collected between 2003 and 2006
Data were collected for two non-consecutive days
High
Clarity and Completeness Accessibility
Reproducibility
Quality Assurance
The NHANES data are publicly available
The methodology used was clearly described enough information was included to reproduce the results
NHANES follows strict QAQC procedures The US EPA analysis has only been reviewed internally but the methodology has been used in an analysis of previous data
High
Variability and Uncertainty Variability in Population
Minimal Uncertainty
Full distributions were provided for total grains Means were provided for individual grain products
Data collection was based on recall for a two-day period the accuracy of using these data to estimate long-term intake (especially at the upper percentiles) is uncertain However use of short-term data to estimate chronic ingestion can be assumed for broad categories of foods such as total grains Uncertainty is greater for individual grain products
Medium to high for averages low for long-term upper percentiles low for
individual foods
Evaluation and Review Peer Review
Number and Agreement of Studies
The NCHS NHANES survey received a high level of peer review The US EPA analysis of these data has not been peer reviewed outside the Agency but the methodology has been used in an analysis of previous data
There was one key study
Medium
Overall Rating Medium to High confidence in the averages Low confidence in the long-
term upper percentiles
Exposure Factors Handbook Page September 2011 12-3
Exposure Factors Handbook
Chapter 12mdashIntake of Grain Products 123 INTAKE STUDIES 1231 Key Grain Intake Study 12311 US EPA Analysis of Consumption Data
From 2003minus2006 National Health and Nutrition Examination Survey (NHANES)
The key source of recent information on consumption rates of grain products is the US Centers for Disease Control and Preventionrsquos National Center for Health Statisticsrsquo (NCHS) NHANES Data from NHANES 2003minus2006 have been used by the US EPA Office of Pesticide Programs (OPP) to generate per capita and consumer-only intake rates for both individual grain products and total grain products
NHANES is designed to assess the health and nutritional status of adults and children in the United States In 1999 the survey became a continuous program that interviews a nationally representative sample of approximately 7000 persons each year and examines a nationally representative sample of about 5000 persons each year located in counties across the country 15 of which are visited each year Data are released on a 2-year basis thus for example the 2003 data are combined with the 2004 data to produce NHANES 2003minus2004
The dietary interview component of NHANES is called What We Eat in America and is conducted by the US Department of Agriculture (USDA) and the US Department of Health and Human Services (DHHS) DHHSrsquo NCHS is responsible for the sample design and data collection and USDArsquos Food Surveys Research Group is responsible for the dietary data collection methodology maintenance of the databases used to code and process the data and data review and processing Beginning in 2003 2 non-consecutive days of 24-hour intake data were collected The first day was collected in-person and the second day was collected by telephone 3 to 10 days later These data were collected using USDArsquos dietary data collection instrument the Automated Multiple Pass Method This method provides an efficient and accurate means of collecting intakes for large-scale national surveys It is fully computerized and uses a five-step interview Details can be found at USDArsquos Agriculture Research Service (httpwwwarsusdagovbabhnrcfsrg)
For NHANES 2003minus2004 there were 12761 persons selected of these 9643 were considered respondents to the mobile examination center (MEC) examination and data collection However only 9034 of the MEC respondents provided complete dietary intakes for Day 1 Furthermore of those providing the Day 1 data only
8354 provided complete dietary intakes for Day 2 For NHANES 2005minus2006 there were 12862 persons selected of these 9950 were considered respondents to the MEC examination and data collection However only 9349 of the MEC respondents provided complete dietary intakes for Day 1 Furthermore of those providing the Day 1 data only 8429 provided complete dietary intakes for Day 2
The 2003minus2006 NHANES surveys are stratified multistage probability samples of the civilian non-institutionalized US population The sampling frame was organized using 2000 US population census estimates NHANES oversamples low income persons adolescents 12 to 19 years persons 60 years and older African Americans and Mexican Americans Several sets of sampling weights are available for use with the intake data By using appropriate weights data for all 4 years of the surveys can be combined Additional information on NHANES can be obtained at httpwwwcdcgovnchsnhaneshtm
In 2010 US EPA OPP used NHANES 2003minus2006 data to update the Food Commodity Intake Database (FCID) that was developed in earlier analyses of data from the USDArsquos Continuing Survey of Food Intake by Individuals (CSFII) (US EPA 2000 USDA 2000) (see Section 12324) NHANES data on the foods people reported eating were converted to the quantities of agricultural commodities eaten Agricultural commodity is a term used by US EPA to mean plant (or animal) parts consumed by humans as food when such items are raw or unprocessed they are referred to as raw agricultural commodities For example an apple pie may contain the commodities apples flour fat sugar and spices FCID contains approximately 558 unique commodity names and 8-digit codes The FCID commodity names and codes were selected and defined by US EPA and were based on the US EPA Food Commodity Vocabulary (httpwwwepagovpesticidesfoodfeed)
Intake rates were generated for a variety of food itemsgroups based on the agricultural commodities included in the FCID These intake rates represent intake of all forms of the product (eg both home produced and commercially produced) for individuals who provided data for two days of the survey Note that if the person reported consuming food for only one day their two-day average would be half the amount reported for the one day of consumption Individuals who did not provide information on body weight or for whom identifying information was unavailable were excluded from the analysis Two-day average intake rates were calculated for all individuals in the database for each of the food
Page Exposure Factors Handbook 12-4 September 2011
Exposure Factors Handbook
Chapter 12mdashIntake of Grain Products itemsgroups These average daily intake rates were divided by each individuals reported body weight to generate intake rates in units of grams per kilogram of body weight per day (gkg-day) The data were weighted according to the 4-year 2-day sample weights provided in NHANES 2003minus2006 to adjust the data for the sample population to reflect the national population
Summary statistics were generated on a consumer-only and on a per capita basis Summary statistics including number of observations percentage of the population consuming the grains being analyzed mean intake rate and standard error of the mean intake rate were calculated for total grains and selected individual grains Percentiles of the intake rate distribution (ie 1st 5th 10th 25th 50th 75th 90th 95th 99th and the maximum value) were also provided for total grains Data were provided for the following age groups birth to 1 year 1 to 2 years 3 to 5 years 6 to 12 years 13 to 19 years 20 to 49 years and ge50 years Data on females 13 to 49 years were also provided Because these data were developed for use in US EPArsquos pesticide registration program the childhood age groups used are slightly different than those recommended in US EPArsquos Guidance on Selecting Age Groups for Monitoring and Assessing Childhood Exposures to Environmental Contaminants (US EPA 2005)
Table 12-3 presents per capita intake data for total grains in gkg-day Table 12-4 provides consumer-only intake data for total grains in gkg-day Table 12-5 provides per capita intake data for individual grains in gkg-day and Table 12-6 provides consumer-only intake data for individual grains in gkg-day In general these data represent intake of the edible portions of ie uncooked foods
The results are presented in units of gkg-day Thus use of these data in calculating potential dose does not require the body-weight factor to be included in the denominator of the average daily dose (ADD) equation It should be noted that converting these intake rates into units of gday by multiplying by a single average body weight is inappropriate because individual intake rates were indexed to the reported body weights of the survey respondents Also it should be noted that the distribution of average daily intake rates generated using short-term data (eg 2-day) does not necessarily reflect the long-term distribution of average daily intake rates The distributions generated from short-term and long-term data will differ to the extent that each individualrsquos intake varies from day to day the distributions will be similar to the extent that individualsrsquo intakes are constant from day to day Day-to-day variation in intake among individuals will
be high for grains that are not typically eaten every day For these grains the intake distribution generated from short-term data will not be a good reflection of the long-term distribution On the other hand for broad categories of foods (eg total grains) that are eaten on a daily basis throughout the year the short-term distribution may be a reasonable approximation of the true long-term distribution although it will show somewhat more variability In this chapter distributions are provided for broad categories of grains (eg total grains) Because of the increased variability of the short-term distribution the short-term upper percentiles shown here may overestimate the corresponding percentiles of the long-term distribution For individual foods only the mean standard error and percent consuming are provided An advantage of using the US EPArsquos analysis of NHANES data is that it provides distributions of intake rates for various age groups of children and adults normalized by body weight The data set was designed to be representative of the US population and includes 4 years of intake data combined Another advantage is the currency of the data the NHANES data are from 2003minus2006 However short-term dietary data may not accurately reflect long-term eating patterns and may under-represent infrequent consumers of a given food This is particularly true for the tails (extremes) of the distribution of food intake Because these are 2-day averages consumption estimates at the upper end of the intake distribution may be underestimated if these consumption values are used to assess acute (ie short-term) exposures Also the analysis was conducted using slightly different childhood age groups than those recommended in US EPArsquos Guidance on Selecting Age Groups for Monitoring and Assessing Childhood Exposures to Environmental Contaminants (US EPA 2005) However given the similarities in the age groups used the data should provide suitable intake estimates for the age groups of interest
1232 Relevant Grain Intake Studies 12321 USDA (1996a b 1993 1980)mdashFood and
Nutrient Intakes of Individuals in 1 Day in the United States
USDA calculated mean per capita intake rates for total and individual grain products using Nationwide Food Consumption Survey (NFCS) data from 1977minus1978 and 1987minus1988 (USDA 1993 1980) and CSFII data from 1994 and 1995 (USDA 1996a b) The mean per capita intake rates for grain products are presented in Table 12-7 and Table 12-8 for the two NFCS survey years respectively Table 12-9
Exposure Factors Handbook Page September 2011 12-5
Exposure Factors Handbook
Chapter 12mdashIntake of Grain Products presents similar data from the 1994 and 1995 CSFII for grain products
The advantages of using these data are that they provide mean intake estimates for various grain products The consumption estimates are based on short-term (ie 1-day) dietary data which may not reflect long-term consumption These data are based on older surveys and may not be entirely representative of current eating patterns
12322 USDA (1999b)mdashFood Consumption Prices and Expenditures 1970minus1997
The USDAs Economic Research Service calculates the amount of food available for human consumption in the United States annually Supply and utilization balance sheets are generated These are based on the flow of food items from production to end uses Total available supply is estimated as the sum of production (ie some products are measured at the farm level or during processing) starting inventories and imports (USDA 1999b) The availability of food for human use commonly termed as food disappearance is determined by subtracting exported foods products used in industries farm inputs (seed and feed) and end-of-the-year inventories from the total available supply (USDA 1999b) USDA (1999b) calculates the per capita food consumption by dividing the total food disappearance by the total US population
USDA (1999b) estimated per capita consumption data for grain products from 1970minus1997 In this section the 1997 values which are the most recent final data are presented Table 12-10 presents per capita consumption in 1997 for grains
An advantage of this study is that it provides per capita consumption rates for grains that are representative of long-term intake because disappearance data are generated annually Daily per capita intake rates are generated by dividing annual consumption by 365 daysyear One of the limitations of this study is that disappearance data do not account for losses from the food supply from waste spoilage or foods fed to pets Thus intake rates based on these data may overestimate daily consumption because they are based on the total quantity of marketable commodity utilized Therefore these data may be useful for estimating bounding exposure estimates It should also be noted that per capita estimates based on food disappearance are not a direct measure of actual consumption or quantity ingested instead the data are used as indicators of changes in usage over time (USDA 1999b) These data are based on older surveys and may not be entirely representative of current consumption patterns
12323 USDA (1999a)mdashFood and Nutrient Intakes by Children 1994minus1996 1998 Table Set 17
USDA (1999a) calculated national probability estimates of food and nutrient intake by children based on 4 years of the CSFII (1994minus1996 and 1998) for children age 9 years and under and on CSFII 1994minus1996 only for individuals age 10 years and over The CSFII was a series of surveys designed to measure the kinds and amounts of foods eaten by Americans Intake data based on 24-hour dietary recall were collected through in-person interviews on 2 non-consecutive days Section 12324 provides additional information on these surveys
USDA used sample weights to adjust for non-response to match the sample to the US population in terms of demographic characteristics and to equalize intakes over the four quarters of the year and the 7 days of the week A total of 503 breast-fed children were excluded from the estimates but both consumers and non-consumers were included in the analysis
USDA (1999a) provided data on the mean per capita quantities (grams) of various food productsgroups consumed per individual for 1 day and the percent of individuals consuming those foods in 1 day of the survey Table 12-11 and Table 12-12 present data on the mean quantities (grams) of grain products consumed per individual for 1 day and the percentage of survey individuals consuming grain products that survey day Data on mean intakes or mean percentages are based on respondentsrsquo Day-1 intakes
The advantage of the USDA (1999a) study is that it uses the 1994minus1996 1998 CSFII data set which includes 4 years of intake data combined and includes the supplemental data on children These data are expected to be generally representative of the US population and they include data on a wide variety of grain products The data set is one of a series of USDA data sets that are publicly available One limitation of this data set is that it is based on 1-day and short-term dietary data may not accurately reflect long-term eating patterns Other limitations of this study are that it only provides mean values of food intake rates consumption is not normalized by body weight and presentation of results is not consistent with US EPArsquos recommended age groups These data are based on older surveys and may not be entirely representative of current eating patterns
Page Exposure Factors Handbook 12-6 September 2011
Exposure Factors Handbook
Chapter 12mdashIntake of Grain Products 12324 US EPA Analysis of Continuing Survey
of Food Intake by Individuals (CSFII) 1994minus1996 1998
US EPAOPP in cooperation with USDArsquos Agricultural Research Service used data from the 1994minus1996 1998 CSFII to develop the FCID (US EPA 2000 USDA 2000) as described in Section 12311 The CSFII 1994minus1996 was conducted between January 1994 and January 1997 with a target population of non-institutionalized individuals in all 50 states and Washington DC In each of the three survey years data were collected for a nationally representative sample of individuals of all ages The CSFII 1998 was conducted between December 1997 and December 1998 and surveyed children 9 years of age and younger It used the same sample design as the CSFII 1994minus1996 and was intended to be merged with CSFII 1994minus1996 to increase the sample size for children The merged surveys are designated as CSFII 1994minus1996 1998 (USDA 2000) Additional information on the CSFII can be obtained at httpwwwarsusdagov Servicesdocshtmdocid=14531
The CSFII 1994minus1996 1998 collected dietary intake data through in-person interviews on two non-consecutive days The data were based on 24-hour recall A total of 21662 individuals provided data for the first day of those individuals 20607 provided data for a second day The 2-day response rate for the 1994minus1996 CSFII was approximately 76 The 2-day response rate for CSFII 1998 was 82 The CSFII 1994minus1996 1998 surveys were based on a complex multistage area probability sample design The sampling frame was organized using 1990 US population census estimates and the stratification plan took into account geographic location degree of urbanization and socioeconomic characteristics Several sets of sampling weights are available for use with the intake data By using appropriate weights data for all 4 years of the surveys can be combined USDA recommends that all four years be combined in order to provide an adequate sample size for children
The grain itemsgroups selected for the US EPA analysis included total grains and individual grain products such as cereal and rice US EPA (2003) presents the food codes and definitions used to determine the various grain products used in the analysis CSFII data on the foods people reported eating were converted to the quantities of agricultural commodities eaten Intake rates for these food itemsgroups and summary statistics were generated on both a per capita and a consumer-only basis using the same general methodology as in the US EPA
analysis of 2003minus2006 NHANES data as described in Section 12311 Because these data were developed for use in US EPArsquos pesticide registration program the childhood age groups used are slightly different than those recommended in US EPArsquos Guidance on Selecting Age Groups for Monitoring and Assessing Childhood Exposures to Environmental Contaminants (US EPA 2005)
Table 12-13 presents per capita intake data for total grains in gkg-day Table 12-14 provides consumer-only intake data for total grains in gkg-day Table 12-15 provides per capita intake data for individual grain products and Table 12-16 provides consumer-only intake data for individual grain products In general these data represent intake of the edible portions of unprepared (ie uncooked) foods Table 12-17 through Table 12-24 present per capita intake data for individual grain products The data come from CSFII 1994minus1996 only The results are presented in units of gkg-day These data represent as-consumed intake rates
The results are presented in units of gkg-day Thus use of these data in calculating potential dose does not require the body-weight factor to be included in the denominator of the ADD equation The cautions concerning converting these intake rates into units of gday by multiplying by a single average body weight and the discussion of the use of short term data in the NHANES description in Section 12311 apply to the CSFII estimates as well
A strength of US EPArsquos analysis is that it provides distributions of intake rates for various age groups of individuals normalized by body weight The analysis uses the 1994minus1996 1998 CSFII data set which was designed to be representative of the US population Also the data set includes 4 years of intake data combined and is based on a 2-day survey period However as discussed above short-term dietary data may not accurately reflect long-term eating patterns and may under-represent infrequent consumers of a given food This is particularly true for the tails (extremes) of the distribution of food intake Also the analysis was conducted using slightly different childhood age groups than those recommended in US EPArsquos Guidance on Selecting Age Groups for Monitoring and Assessing Childhood Exposures to Environmental Contaminants (US EPA 2005) However given the similarities in the childhood age groups used the data should provide suitable intake estimates for the age groups of interest While the CSFII data are older than the NHANES data they provide relevant information on consumption by season region of the United States
Exposure Factors Handbook Page September 2011 12-7
Exposure Factors Handbook
Chapter 12mdashIntake of Grain Products and urbanization breakdowns that are not available in the publically released NHANES data
12325 Smiciklas-Wright et al (2002)mdashFoods Commonly Eaten in the United States Quantities Consumed per Eating Occasion and in a Day 1994minus1996
Using data gathered in the 1994minus1996 USDA CSFII Smiciklas-Wright et al (2002) calculated distributions for the quantities of grain products consumed per eating occasion by members of the US population (ie serving sizes) The estimates of serving size are based on data obtained from 14262 respondents ages two and above who provided two days of dietary intake information Only dietary intake data from users of the specified food were used in the analysis (ie consumer-only data) Table 12-25 presents as-consumed the quantity of grain products consumed per eating occasion and the percentage of individuals using these foods in a 2-day period for a selected variety of grain products Table 12-26 presents the same data by sex and age
These data are presented on an as-consumed basis (grams) and represent the quantity of grain products consumed per eating occasion These estimates may be useful for assessing acute exposures to contaminants in specific foods or other assessments where the amount consumed per eating occasion is necessary Only the mean and standard deviation serving size data and percent of the population consuming the food during the 2-day survey period are presented in this handbook Percentiles of serving sizes of the foods consumed by these age groups of the US population can be found in Smiciklas-Wright et al (2002)
The advantages of using these data are that they were derived from the USDA CSFII and are representative of the US population The analysis conducted by Smiciklas-Wright et al (2002) accounted for individual foods consumed as ingredients of mixed foods Mixed foods were disaggregated via recipe files so that the individual ingredients could be grouped together with similar foods that were reported separately Thus weights of foods consumed as ingredients were combined with weights of foods reported separately to provide a more thorough representation of consumption However it should be noted that since the recipes for the mixed foods consumed were not provided by the respondents standard recipes were used As a result the estimates of quantity consumed for some food types are based on assumptions about the types and quantities of ingredients consumed as part of mixed
foods This study used data from the 1994 to 1996 CSFII data from the 1998 childrenrsquos supplement were not included
12326 Vitolins et al (2002)mdashQuality of Diets Consumed by Older Rural Adults
Vitolins et al (2002) conducted a survey to evaluate the dietary intake by food groups of older (gt70 years) rural adults The sample consisted of 130 community dwelling residents from two rural counties in North Carolina Data on dietary intake over the preceding year were obtained in face-to-face interviews conducted in participantsrsquo homes or in a few cases a senior center The food frequency questionnaire used in the survey was a modified version of the National Cancer Institute Health Habits and History Questionnaire this modified version included an expanded food list containing a greater number of ethnic foods than the original food frequency form Demographic and personal data collected included sex ethnicity age education denture use marital status chronic disease and weight
Food items reported in the survey were grouped into food groups similar to the USDA Food Guide Pyramid and the National Cancer Institutersquos 5 A Day for Better Health program These groups are (1) fruits and vegetables (2) bread cereal rice and pasta (3) milk yogurt and cheese (4) meat fish poultry beans and eggs and (5) fats oils sweets and snacks Medians ranges frequencies and percentages were used to summarize intake of each food group broken down by demographic and health characteristics In addition multiple regression models were used to determine which demographic and health factors were jointly predictive of intake of each of the five food groups
Thirty-four percent of the survey participants were African American 36 were European American and 30 were Native American Sixty-two percent were female 62 were not married at the time of the interview and 65 had some high school education or were high school graduates Almost all of the participants (95) had one or more chronic diseases Sixty percent of the respondents were between 70 and 79 years of age the median age was 78 years old Table 12-27 presents the median servings of bread cereal rice and pasta broken down by demographic and health characteristic Only sex was statistically predictive of bread cereal rice and pasta intake (p lt 001) with males consuming approximately an extra serving per day compared to women Also the multiple regression model indicated that sex was predictive of
Page Exposure Factors Handbook 12-8 September 2011
Exposure Factors Handbook
Chapter 12mdashIntake of Grain Products breads cereal rice and pasta intake after controlling for other demographic variables
One limitation of the study as noted by the study authors is that the study did not collect information on the length of time the participants had been practicing the dietary behaviors reported in the survey The questionnaire asked participants to report the frequency of food consumption during the past year The study authors noted that currently there are no dietary assessment tools that allow the collection of comprehensive dietary data over years of food consumption Another limitation of the study is that the small sample size used makes associations by sex and ethnicity difficult
12327 Fox et al (2004)mdashFeeding Infants and Toddlers Study What Foods Are Infants and Toddlers Eating
Fox et al (2004) used data from the Feeding Infants and Toddlers study (FITS) to assess food consumption patterns in infants and toddlers The FITS was sponsored by Gerber Products Company and was conducted to obtain current information on food and nutrient intakes of children ages 4 to 24 months old in the 50 states and the District of Columbia The FITS is described in detail in Devaney et al (2004) FITS was based on a random sample of 3022 infants and toddlers for which dietary intake data were collected by telephone from their parents or caregivers between March and July 2002 An initial recruitment and household interview was conducted followed by an interview to obtain information on intake based on 24-hour recall The interview also addressed growth development and feeding patterns A second dietary recall interview was conducted for a subset of 703 randomly selected respondents The study over-sampled children in the 4 to 6 and 9 to 11 months age groups sample weights were adjusted for non-response over sampling and under coverage of some subgroups The response rate for the FITS was 73 for the recruitment interview Of the recruited households there was a response rate of 94 for the dietary recall interviews (Devaney et al 2004) Table 12-28 shows the characteristics of the FITS population
Fox et al (2004) analyzed the first set of 24-hour recall data collected from all study participants For this analysis children were grouped into six age categories 4 to 6 months 7 to 8 months 9 to 11 months 12 to 14 months 15 to 18 months and 19 to 24 months Table 12-29 provides the percentage of infants and toddlers consuming different types of grains or grain products at least once a day The percentages of children eating any type of grain or
grain product ranged from 658 for 4 to 6 monthshyolds to 992 for 19- to 24-month-olds
The advantages of this study is that it represents the US population and the sample size was large One limitation of the analysis done by Fox et al (2004) is that only frequency data were provided no information on actual intake rates was included In addition Devaney et al (2004) noted several limitations associated with the FITS data For the FITS a commercial list of infants and toddlers was used to obtain the sample used in the study Since many of the households could not be located and did not have children in the target population a lower response rate than would have occurred in a true national sample was obtained (Devaney et al 2004) In addition the sample was likely from a higher socioeconomic status when compared with all US infants in this age group (4 to 24 months old) and the use of a telephone survey may have omitted lower-income households without telephones (Devaney et al 2004)
12328 Ponza et al (2004)mdashNutrient Food Intakes and Food Choices of Infants and Toddlers Participating in WIC
Ponza et al (2004) conducted a study using selected data from the FITS to assess feeding patterns food choices and nutrient intake of infants and toddlers participating in the Special Supplemental Nutrition Program for Women Infants and Children (WIC) Ponza et al (2004) evaluated FITS data for the following age groups 4 to 6 months (N = 862) 7 to 11 months (N = 1159) and 12 to 24 months (N = 996) Table 12-30 shows the total sample size described by WIC participants and non-participants
The foods consumed were analyzed by tabulating the percentage of infants who consumed specific foodsfood groups per day (Ponza et al 2004) Weighted data were used in all of the analyses used in the study (Ponza et al 2004) Table 12-30 presents the demographic data for WIC participants and non-participants Table 12-31 provides information on the food choices for the infants and toddlers studied In general there was little difference in grain product choices among WIC participants and non-participants except for the 7 to 11 months age category (see Table 12-31) Non-participants ages 7 to 11 months were more likely to eat non-infant cereals than WIC participants
An advantage of this study is that it had a relatively large sample size and was representative of the US general population of infants and children A limitation of the study is that intake values for foods
Exposure Factors Handbook Page September 2011 12-9
Exposure Factors Handbook
Chapter 12mdashIntake of Grain Products were not provided Other limitations are those associated with the FITS data as described previously in Section 12327
12329 Fox et al (2006)mdashAverage Portion of Foods Commonly Eaten by Infants and Toddlers in the United States
Fox et al (2006) estimated average portion sizes consumed per eating occasion by children 4 to 24 months of age who participated in the FITS The FITS is a cross-sectional study designed to collect and analyze data on feeding practices food consumption and usual nutrient intake of US infants and toddlers and is described in Section 12327 of this chapter It included a stratified random sample of 3022 children between 4 and 24 months of age
Using the 24-hour recall data Fox et al (2006) derived average portion sizes for six major food groups including breads and grains Average portion sizes for select individual foods within these major groups were also estimated For this analysis children were grouped into six age categories 4 to 5 months 6 to 8 months 9 to 11 months 12 to 14 months 15 to 18 months and 19 to 24 months Table 12-32 and Table 12-33 present the average portion sizes for grain products for infants and toddlers respectively
123210 Mennella et al (2006)mdashFeeding Infants and Toddlers Study The Types of Foods Fed to Hispanic Infants and Toddlers
Mennella et al (2006) investigated the types of food and beverages consumed by Hispanic infants and toddlers in comparison to the non-Hispanic infants and toddlers in the United States The FITS 2002 data for children between 4 and 24 months of age were used for the study The data represent a random sample of 371 Hispanic and 2367 non-Hispanic infants and toddlers (Mennella et al 2006) Mennella et al (2006) grouped the infants as follows 4 to 5 months (N = 84 Hispanic 538 non-Hispanic) 6 to 11 months (N = 163 Hispanic 1228 non-Hispanic) and 12 to 24 months (N = 124 Hispanic 871 non-Hispanic) of age
Table 12-34 provides the percentage of Hispanic and non-Hispanic infants and toddlers consuming grain products In most instances the percentages consuming the different types are similar However 6 to 11 month old Hispanic children were more likely to eat rice and pasta than non-Hispanic children in this age groups
The advantage of the study is that it provides information on f ood preferences for Hispanic and non-Hispanic infants and toddlers A limitation is that the study did not provide food intake data but provided frequency of use data instead Other limitations are those noted previously in Section 12327 for the FITS data
124 CONVERSION BETWEEN WET- AND
DRY-WEIGHT INTAKE RATES The intake data presented in this chapter are
reported in units of wet weight (ie as-consumed or uncooked weight of grain products consumed per day or per eating occasion) However data on the concentration of contaminants in grain products may be reported in units of either wet or dry weight (eg mg contaminant per gram dry w eight of grain products) It is essential that exposure assessors be aware of this difference so that they may ensure consistency between the units used for intake rates and those used for concentration data (ie if the contaminant concentration is measured in dry weight of grain products then the dry-weight units should be used for their intake values)
If necessary wet-weight (eg as-consumed) intake rates may be converted to dry-weight intake rates using the moisture content percentages presented in Table 12-35 and the following equation
IR = IR 100 minusW dw ww (Eqn 12-1) 100
where
IRdw = dry-weight intake rate IRww = wet-weight intake rate and W = percent water content
Alternatively dry-weight residue levels in grain
products may be converted to wet-weight residue levels for use with wet-weight (eg as-consumed) intake rates as follows
C = C 100 minus W ww dw (Eqn 12-2) 100
where
Cww = wet concentration rate Cdw = dry-weight concentration and W = percent water content
Page Exposure Factors Handbook 12-10 September 2011
Exposure Factors Handbook
Chapter 12mdashIntake of Grain Products
Exposure Factors Handbook Page September 2011 12-11
The moisture data presented in Table 12-35 are for selected grain products taken from USDA (2007)
125 REFERENCES FOR CHAPTER 12 Devaney B Kalb L Briefel R Zavitsky-Novak T
Clusen N Ziegler P (2004) Feeding infants and toddlers study overview of the study design J Am Diet Assoc 104 s8-13 httpdxdoiorg101016jjada200310023
Fox MK Pac S Devaney B Jankowski L (2004) Feeding infants and toddlers study What foods are infants and toddlers eating J Am Diet Assoc 104 s22-s30 httpdxdoiorg101016jjada200310026
Fox MK Reidy K Karwe V Ziegler P (2006) Average portions of foods commonly eaten by infants and toddlers in the United States J Am Diet Assoc 106 S66-S76 httpdxdoiorg101016jjada200509042
Mennella JA Ziegler P Briefel R Novak T (2006) Feeding Infants and Toddlers Study the types of foods fed to Hispanic infants and toddlers J Am Diet Assoc 106 S96shy106 httpdxdoiorg101016jjada200509038
NCHS (National Center for Health Statistics) (1993) Joint policy on variance estimation and statistical reporting standards on NHANES III and CSFII reports HNISNCHS Analytic Working Group recommendations Riverdale MD Human Nutrition Information Service (HNIS)Analytic Working Group Agricultural Research Service Survey SystemsFood Consumption Laboratory
Ponza M Devaney B Ziegler P Reidy K Squatrito C (2004) Nutrient intakes and food choices of infants and toddlers participating in WIC J Am Diet Assoc 104 s71-s79 httpdxdoiorg101016jjada200310018
Smiciklas-Wright H Mitchell DC Mickle SJ Cook AJ Goldman JD (2002) Foods commonly eaten in the United States Quantities consumed per eating occasion and in a day 1994minus96 [pre-publication version] (NFS Report No 96-5) Beltsville MD US Department of Agriculture httpwwwarsusdagovsp2userfilesplace1 2355000pdfportionpdf
US EPA (US Environmental Protection Agency) (2000) Food commodity intake database [Database]
US EPA (US Environmental Protection Agency) (2003) CSFII analysis of food intake distributions (EPA600R-03029) Washington DC httpcfpubepagovnceacfmrecordisplayc fmdeid=56610
US EPA (US Environmental Protection Agency) (2005) Guidance on selecting age groups for monitoring and assessing childhood exposures to environmental contaminants (final) (EPA630P-03003F) Washington DC US Environmental Protection Agency Risk Assessment Forum httpwwwepagovrafpublicationsguidanc e-on-selecting-age-groupshtm
USDA (US Department of Agriculture) (1980) Food and nutrient intakes of individuals in 1 day in the United States Spring 1977 Nationwide Food Consumption Survey 1977ndash78 Preliminary report no 2 Washington DC httpwwwarsusdagovSP2UserFilesPlace 12355000pdf7778nfcs7778_prelim_2pdf
USDA (US Department of Agriculture) (1993) Food and nutrient intakes by i ndividuals in the United States 1 day 1987ndash88 Nationwide Food Consumption Survey 1987-88 Report no 87-I-1 (87-I-1) Washington DC httpwwwarsusdagovSP2UserFilesPlace 12355000pdf8788nfcs8788_rep_87-ishy1pdf
USDA (US Department of Agriculture) (1996a) Data tables Results from USDAs 1994 continuing survey of food intakes by individuals and 1994 diet and health knowledge survey Riverdale MD
USDA (US Department of Agriculture) (1996b) Data tables results from USDArsquos 1995 Continuing survey of food intakes by individuals and 1995 diet and health knowledge survey Riverdale MD
USDA (US Department of Agriculture) (1999a) Food and nutrient intakes by children 1994shy96 1998 table set 17 Beltsville MD httpwwwarsusdagovSP2UserFilesPlace 12355000pdfscs_allpdf
USDA (US Department of Agriculture) (1999b) Food consumption prices and expenditures (1970minus1997) Statistical Bulletin No 965 Washington DC Economic Research Service
USDA (US Department of Agriculture) (2000) 1994-1996 1998 continuing survey of food
Exposure Factors Handbook
Chapter 12mdashIntake of Grain Products intakes by individuals (CSFII) Beltsville MD Agricultural Research Service Beltsville Human Nutrition Research Center
USDA (US Department of Agriculture) (2007) USDA nutrient database for standard reference release 20 Riverdale MD httpwwwarsusdagovmainsite_mainhtm modecode=12-35-45-00
Vitolins MZ Quandt SA Bell RA Arcury TA Case LD (2002) Quality of diets consumed by older rural adults J Rural Health 18 49shy56
Page Exposure Factors Handbook 12-12 September 2011
Exposure F
actors Handbook
Chapter 12mdash
Intake of Grain Products
Table 12-3 Per Capita Intake of Total Grains Based 2003ndash2006 NHANES (gkg-day edible portion uncooked weight)
Population Group
Consuming Percentiles
N Mean SE 1st 5th 10th 25th 50th 75th 90th 95th 99th Max Whole Population 16783 100 26 004 02 06 08 13 20 32 51 67 99 348 Age Group
Birth to 1 year 865 76 31 020 00 00 00 01 23 50 75 95 125 349 1 to 2 years 1052 100 64 017 15 23 30 42 58 84 105 124 159 211 3 to 5 years 978 100 62 013 20 24 33 44 59 76 96 111 132 156 6 to 12 years 2256 100 44 009 06 14 18 28 41 55 74 82 111 145 13 to 19 years 3450 100 24 005 04 07 10 15 21 32 42 50 75 143 20 to 49 years 4289 100 22 004 03 06 08 12 19 28 39 46 71 150 Females 13 to 49 years 4103 100 19 004 02 05 08 11 17 25 34 39 55 98 50 years and older 3893 100 17 003 03 05 07 10 15 21 29 35 52 94
Race Mexican American 4450 99 30 005 01 08 10 16 24 39 58 72 106 178 Non-Hispanic Black 4265 100 24 004 02 05 07 11 18 29 50 68 102 211 Non-Hispanic White 6757 100 25 005 03 06 08 13 19 31 49 65 96 348 Other Hispanic 562 99 27 013 02 07 10 15 21 33 53 70 98 153 Other RacemdashIncluding Multiple Races 749 100 30 011 03 06 09 15 25 39 60 75 111 175
N = Sample size SE = Standard error Max = Maximum value Estimates are less statistically reliable based on guidance published in the Joint Policy on Variance Estimation and Statistical Reporting Standards on
NHANES III and CSFII Reports NHISNCHS Analytical Working Group Recommendations (NCHS 1993)
Source Based on US EPA analysis of 2003ndash2006 NHANES
Exposure F
actors Handbook
Page Septem
ber 2011 12-13
Exposure F
actors Handbook
Chapter 12mdash
Intake of Grain Products
Table 12-4 Consumer-Only Intake of Total Grains Based 2003ndash2006 NHANES (gkg-day edible portion uncooked weight)
Population Group N Mean SE Percentiles
1st 5th 10th 25th 50th 75th 90th 95th 99th Max
Whole Population 16556 26 004 03 06 08 13 20 32 51 67 99 Age Group
Birth to 1 year 644 41 018 01 04 08 18 35 59 81 103 139 1 to 2 years 1050 64 016 16 24 30 42 58 84 105 124 159 3 to 5 years 977 62 013 20 24 33 44 59 76 96 111 132 6 to 12 years 2256 44 009 06 14 18 28 41 55 74 82 111 13 to 19 years 3450 24 005 04 07 10 15 21 32 42 50 75 20 to 49 years 4288 22 004 03 06 08 12 19 28 39 46 71 Females 13 to 49 years 4102 19 003 02 05 08 11 17 25 34 39 55 50 years and older 3891 17 003 03 05 07 10 15 21 29 35 52
Race Mexican American 4341 30 005 04 08 11 16 24 39 59 72 106 Non-Hispanic Black 4236 24 004 02 05 07 11 18 29 50 69 103 Non-Hispanic White 6694 25 005 03 06 08 13 20 31 49 65 96 Other Hispanic 548 28 014 04 07 10 15 21 34 54 71 98 Other RacemdashIncluding Multiple Races 737 31 011 03 07 09 15 25 39 60 75 111
349
349 211 156 145 143 150 98 94
178 211 349 153 175
N = Sample size SE = Standard error Max = Maximum value Estimates are less statistically reliable based on guidance published in the Joint Policy on Variance Estimation and Statistical Reporting
Standards on NHANES III and CSFII Reports NHISNCHS Analytical Working Group Recommendations (NCHS 1993)
Source Based on US EPA analysis of 2003ndash2006 NHANES
Page E
xposure Factors H
andbook 12-14
September 2011
Table 12-5 Per Capita Intake of Individual Grain Products Based 2003ndash2006 NHANES (gkg-day edible portion uncooked weight)
Population Group N
Consuming Mean SE
Consuming Mean SE
Cereal Rice Whole Population
Age Group Birth to 1 year 1 to 2 years 3 to 5 years 6 to 12 years 13 to 19 years 20 to 49 years Females 13 to 49 years 50 years and older Race Mexican American Non-Hispanic Black Non-Hispanic White Other Hispanic Other RacemdashIncluding Multiple Races
16783
865 1052
978 2256 3450 4289 4103 3893
4450 4265 6757
562
749
100
81 100 100 100 100 100 100 100
100 100 100
99
100
37
51 87 86 63 39 32 29 22
43 36 36 39
41
004
030 018 017 010 008 004 004 004
007 006 005 020
012
88 69 87 91 89 85 89 86 89
87 86 88 92
90
02
11 06 05 03 02 03 02 01
03 03 02 06
08
001
008 006 006 003 001 001 001 001
002 002 001 005
008 N
SE
Source
= Sample size = Standard error
Based on US EPA analysis of 2003ndash2006 NHANES
Exposure Factors Handbook
Chapter 12mdashIntake of Grain Products
Exposure Factors Handbook Page September 2011 12-15
Table 12-6 Consumer-Only Intake of Individual Grain Products Based 2003ndash2006 NHANES (gkg-day edible portion uncooked weight)
Population Group N Mean SE N Mean SE
Cereal Rice Whole Population
Age Group Birth to 1 year 1 to 2 years 3 to 5 years 6 to 12 years 13 to 19 years 20 to 49 years Females 13 to 49 years 50 years and older Race Mexican American Non-Hispanic Black Non-Hispanic White Other Hispanic Other RacemdashIncluding Multiple Races
16613
696 1051 978 2256 3450 4289 4103 3893
4372 4244 6707 550 740
37
63 87 86 63 39 32 29 22
43 36 36 39 41
004
031 018 017 010 008 004 004 004
007 006 005 020 013
14447
552 928 875 2000 2898 3812 3511 3382
3757 3645 5887 491 667
03
15 07 05 03 02 03 02 02
03 03 02 06 08
001
010 007 006 003 002 002 002 001
002 002 001 005 008
N SE
Source
= Sample size = Standard error
Based on US EPA analysis of 2003ndash2006 NHANES
Exposure Factors Handbook
Chapter 12mdashIntake of Grain Products
Page Exposure Factors Handbook 12-16 September 2011
Exposure Factors Handbook
Chapter 12mdashIntake of Grain Products
Table 12-7 Mean Grain Intake per Individual in a Day by Sex and Age (gday as-consumed)a for 1977minus1978 Group Age (years) Total Grains Breads Rolls
Biscuits Other Baked
Goods Cereals Pasta Mixtures Mainly Grainb
Males and Females lt1 1 to 2 3 to 5 6 to 8
42 158 181 206
4 27 46 53
5 24 37 56
30 44 54 60
3 63 45 38
Males 9 to 11 12 to 14 15 to 18 19 to 22 23 to 34 35 to 50 51 to 64 65 to 74 ge75
238 288 303 253 256 234 229 235 196
67 76 91 84 82 82 78 71 70
56 80 77 53 60 58 57 60 50
51 57 53 64 40 44 48 69 58
64 74 82 52 74 50 46 35 19
Females 9 to 11 12 to 14 15 to 18 19 to 22 23 to 34 35 to 50 51 to 64 65 to 74 ge75
214 235 196 161 163 161 155 175 178
58 57 57 44 49 49 52 57 54
59 61 43 36 38 37 40 42 44
44 45 41 33 32 32 36 47 58
53 72 55 48 44 43 27 29 22
Males and FemalesmdashAll Ages 204 62 49 44 49 a Based on USDA Nationwide Food Consumption Survey 1977ndash1978 data for 1 day b Includes mixtures containing grain as the main ingredient
Source USDA (1980)
Exposure Factors Handbook Page September 2011 12-17
Exposure Factors Handbook
Chapter 12mdashIntake of Grain Products
Page Exposure Factors Handbook 12-18 September 2011
Table 12-8 Mean Grain Intakes per Individual in a Day by Sex and Age (gday as-consumed)a for 1987minus1988
Group Age (years) Total Grains Yeast Breads and
Rolls
Quick Breads Pancakes
French Toast
Cakes Cookies Pastries
Pies
Crackers Popcorn
Pretzels Corn Chips
Cereals and Pastas
Mixtures Mostly Grainb
Males and Females le5 167 30 8 22 4 52 51
Males 6 to 11 268 51 16 37 8 74 83
12 to 19 304 65 28 45 10 72 82 ge20 272 65 20 37 8 58 83
Females 6 to 11 231 43 19 30 6 66 68
12 to 19 239 45 13 29 7 52 91 ge20 208 45 14 28 6 53 62
All Individuals 237 52 16 32 7 57 72 a Based on USDA Nationwide Food Consumption Survey 1987ndash1988 data for 1 day b Includes mixtures containing grain as the main ingredient
Source USDA (1993)
Table 12-9 Mean Grain Intakes per Individual in a Day by Sex and Age (gday as-consumed)a for 1994minus1995
Group Age (years)
Total Grains Yeast Breads and Rolls
Quick Breads Pancakes
French Toast
Cakes Cookies
Pastries Pies
Crackers Popcorn
Pretzels Corn Chips
Cereals and Pastas
Mixtures Mostly Grainb
1994 1995 1994 1995 1994 1995 1994 1995 1994 1995 1994 1995 1994 1995 Males and Females le5 213 210 26 28 11 11 22 23 8 7 58 57 89 84
Males 6 to 11 12 to 19 ge20
285 417 357
341 364 365
51 53 64
45 54 61
15 30 22
21 21 24
42 54 43
46 43 46
12 17 13
18 22 15
66 82 86
97 84 91
101 180 128
115 138 128
Females 6 to 11 12 to 19 ge20
260 317 254
286 296 257
43 40 44
46 37 45
16 16 16
21 14 15
37 39 33
51 35 34
11 17 9
14 16 10
57 63 59
54 52 69
94 142 92
100 143 83
All Individuals 300 303 50 49 18 19 38 39 12 13 70 76 112 107 a Based on USDA CSFII 1994 and 1995 data for 1 day b Includes mixtures containing grain as the main ingredient
Source USDA (1996a b)
Exposure Factors Handbook
Chapter 12mdashIntake of Grain Products
Table 12-10 Per Capita Consumption of Flour and Cereal Products in 1997
Food Item Per Capita Consumption
(gday)a
Total Wheat Flourb
Rye Flour Ricec
Total Corn Productsd
Oat Productse
Barley Productsf
Total Flour and Cereal Productsg
186 07 24 29 8
09 249
a Original data were presented in lbsyear data were converted to gday by multiplying by a factor of 454 glb and dividing by 365 dayyear Consumption of most items at the processing level Excludes quantities used in alcoholic beverages and fuel
b Includes white whole wheat and durum flour c Milled basis d Includes corn flour and meal hominy and grits and corn starch e Includes rolled oats ready-to-eat oat cereals oat flour and oat bran f Includes barley flour pearl barley and malt and malt extract used in food processing g Excludes wheat not ground into flour
Source USDA (1999b)
Exposure Factors Handbook Page September 2011 12-19
Table 12-11 Mean Quantities of Grain Products Consumed by Children Under 20 Years of Age by Sex and Age per Capita (gday as-consumed)a
Yeast Cereals and Pasta Cakes Crackers Quick Breads Mixtures Age Group Sample Breads Cookies Popcorn Totalb Ready-to- Pancakes Mainly (years) Size and Total Rice Pasta Pastries Pretzels Eat Cereals French Toast Grainc Rolls Pies Corn Chips
Males and Females lt1 1126 56 2 29 1 2 1d 1 3 1 20 1 1016 192 16 57 11 9 9 9 16 7 87 2 1102 219 26 62 16 15 12 12 22 9 87 1 to 2 2118 206 21 59 13 12 11 11 19 8 87 3 1831 242 30 64 19 13 12 16 23 11 98 4 1859 264 36 67 22 15 11 17 30 13 102 5 884 284 41 76 24 17 11 15 33 13 107 3 to 5 4574 264 36 69 22 15 11 16 29 12 102 le5 7818 219 27 61 16 13 10 12 22 9 87
Males 6 to 9 787 310 45 77 28 18 15 23 39 16 109 6 to 11 1031 318 46 80 31 16 18 23 40 15 115 12 to 19 737 406 54 82 29 27 17 26 49 19 175
Females 6 to 9 704 284 43 61 21 12 15 18 42 13 107 6 to 11 969 280 43 62 20 14 15 19 42 14 101 12 to 19 732 306 40 67 17 19 22 15 37 15 132
Males and Females le9 9309 250 34 64 20 14 12 16 30 12 96 le19 11287 298 40 69 22 17 15 18 36 14 120 a Based on data from 1994ndash1996 1998 CSFII b Includes yeast breads rolls cereals pastas quick breads pancakes French toast cakes cookies pastries pies crackers popcorn pretzels corn
chips and mixtures having a grain product as a main ingredient Excludes grain products that were ingredients in food mixtures coded as a single item and tabulated under another food group for example noodles in tuna-noodle casserole are tabulated under Meat Poultry and Fish
c Includes mixtures having a grain product as a main ingredient such as burritos tacos pizza egg rolls quiche spaghetti with sauce rice and pasta mixtures frozen meals in which the main course is a grain mixture noodle and rice soups and baby-food macaroni and spaghetti mixtures
d Estimate is not statistically reliable due to small sample size reporting intake Note Consumption amounts shown are representative of the first day of each participantrsquos survey response
Source USDA (1999a)
Exposure F
actors Handbook
Chapter 12mdash
Intake of Grain Products
Page E
xposure Factors H
andbook 12-20
September 2011
Exposure F
actors Handbook
Chapter 12mdash
Intake of Grain Products
Table 12-12 Percentage of Individuals Under 20 Years of Age Consuming Grain Products by Sex and Age ()a
Age Group (years) Sample Size Totalb
Yeast Breads
and Rolls
Cereals and Pasta Quick Breads
Pancakes French Toast
Cakes Cookies Pastries
Pies
Crackers Popcorn Pretzels
Corn Chips
Mixtures Mainly GraincTotal
Ready-to-Eat
Cereals Rice Pasta
Males and Females lt1 1126 706 109 628 91 34 21 44 165 103 150 1 1016 982d 484 706 453 113 94 230 470 390 478 2 1102 990d 587 711 519 144 94 275 466 379 453 1 to 2 2118 987 537 709 487 129 94 253 468 384 465 3 1831 994d 641 697 533 111 86 288 461 385 490 4 1859 995d 670 691 548 114 71 286 523 394 462 5 884 999d 692 704 549 114 68 252 524 321 474 3 to 5 4574 996d 668 697 543 113 75 275 503 367 475 le5 7818 958 555 693 469 109 75 240 450 341 433
Males 6 to 9 787 989d 698 626 508 105 74 281 525 360 445 6 to 11 1031 990d 691 640 524 97 81 271 523 338 453 12 to 19 737 982d 627 446 332 100 59 244 413 272 462
Females 6 to 9 704 997d 715 612 476 90 79 263 571 383 480 6 to 11 969 993d 710 593 456 94 71 271 550 371 457 12 to 19 732 976d 609 459 303 86 93 198 406 309 461
Males and Females le9 9309 972 616 664 479 105 76 253 489 353 444 le19 11287 976 624 576 417 99 76 242 461 325 451 a Based on data from 1994ndash1996 1998 CSFII b Includes yeast breads rolls cereals pastas quick breads pancakes French toast cakes cookies pastries pies crackers popcorn
pretzels corn chips and mixtures having a grain product as a main ingredient Excludes grain products that were ingredients in food mixtures coded as a single item and tabulated under another food group for example noodles in tuna-noodle casserole are tabulated under Meat Poultry and Fish
c Includes mixtures having a grain product as a main ingredient such as burritos tacos pizza egg rolls quiche spaghetti with sauce rice and pasta mixtures frozen meals in which the main course is a grain mixture noodle and rice soups and baby-food macaroni and spaghetti mixtures
d Estimate is not statistically reliable due to small sample size reporting intake Note Percentages shown are representative of the first day of each participantrsquos survey response
Source USDA (1999a)
Exposure F
actors Handbook
Page Septem
ber 2011 12-21
Page E
xposure Factors H
andbook 12-22
September 2011
Exposure F
actors Handbook
Chapter 12mdash
Intake of Grain Products
Table 12-13 Per Capita Intake of Total Grains Based on 1994ndash1996 1998 CSFII (gkg-day edible portion uncooked weight) Population Group N Percent
Consuming Mean SE Percentiles 1st 5th 10th 25th 50th 75th 90th 95th 99th Max
Whole Population Age group Birth to 1 year 1 to 2 years 3 to 5 years 6 to 12 years 13 to 19 years 20 to 49 years ge50 years Season Fall Spring Summer Winter Race Asian Pacific Islander Black American Indian Alaskan Native OtherNA White Region Midwest Northeast South West Urbanization Central City Suburban Non-metropolitan
20607
1486 2096 4391 2089 1222 4677 4646
4687 5308 5890 4722
557 2740
177 1638 15495
4822 3692 7208 4885
6164 9598 4845
995
705 998 1000 1000 1000
999 1000
995 996 995 995
985 994 997 988 996
997 996 995 994
995 995 996
27
25 64 63 43 25 22 17
26 27 26 27
36 26 29 31 26
27 28 25 28
27 27 24
00
01 01 01 01 01 00 00
00 00 00 00
02 01 02 01 00
00 00 00 01
00 00 01
02
00 11 18 09 04 03 03
02 02 03 02
00 01 03 00 03
03 03 02 02
01 03 03
06
00 21 26 17 08 06 06
06 06 07 06
11 05 05 07 07
07 07 06 07
06 07 06
09
00 28 32 20 11 08 07
09 08 09 09
15 07 08 09 09
09 10 08 09
09 09 08
13
00 42 43 28 15 13 11
13 13 13 14
23 11 13 15 13
14 14 12 14
13 14 12
21
16 59 59 40 23 19 15
21 21 21 21
32 19 22 24 20
21 22 19 22
21 21 19
33
38 79 78 54 31 28 21
33 34 33 33
47 33 42 41 32
34 35 30 35
35 34 29
52
62 104 99 70 44 39 28
50 55 51 52
62 54 63 61 50
53 53 50 54
54 53 48
68
86 121
115 82 51 47 35
66 70 68 68
73 73 75 77 66
70 68 66 70
70 69 63
103
127 168 156
111 79 71 49
100 105 105 101
112 115
120 117
98
104 110
97 103
107 100 104
316
263 316 270 172 124 161
112
263 294 282 316
246 294 168 270 316
238 316 282 208
294 316 238
N SE
Source
= Sample size = Standard error
US EPA analysis of 1994ndash1996 1998 CSFII
Exposure F
actors Handbook
Page Septem
ber 2011 12-23
Exposure F
actors Handbook
Chapter 12mdash
Intake of Grain Products
Table 12-14 Consumer-Only Intake of Total Grains Based on 1994ndash1996 1998 CSFII (gkg-day edible portion uncooked weight) Population Group N Mean SE Percentiles
1st 5th 10th 25th 50th 75th 90th 95th 99th Max Whole Population Age Group Birth to 1 year 1 to 2 years 3 to 5 years 6 to 12 years 13 to 19 years 20 to 49 years ge50 years Season Fall Spring Summer Winter Race Asian Pacific Islander Black American Indian Alaskan Native OtherNA White Region Midwest Northeast South West Urbanization Central City Suburban Non-metropolitan
20157
1048 2092 4389 2089 1222 4673 4644
4587 5190 5751 4629
527 2675
175 1570 15210
4743 3628 7053 4733
6023 9378 4756
27
36 64 63 43 25 22 17
26 27 27 27
37 26 30 32 26
27 28 25 28
28 27 24
00
01 01 01 01 01 00 00
00 00 00 00
02 01 02 01 00
00 00 00 01
00 00 01
03
01 12 18 09 04 03 03
03 03 04 03
08 02 03 05 04
04 04 03 04
03 04 03
07
03 21 26 17 08 06 06
07 07 07 07
12 05 05 07 07
07 08 06 07
07 07 06
09
06 28 32 20 11 08 07
09 09 09 09
16 07 08 10 09
09 10 08 09
09 09 08
13
14 42 43 28 15 13 11
13 13 14 14
23 11 13 15 13
14 14 12 14
13 14 12
21
28 59 59 40 23 19 15
21 21 21 21
32 19 22 24 20
21 22 19 22
21 21 19
33
48 79 78 54 31 28 21
33 34 33 33
47 33 42 41 32
34 35 30 35
35 34 29
52
74 104 99 70 44 39 28
50 55 52 52
62 54 63 62 51
53 53 50 54
54 53 48
68
92 121
115 82 51 47 35
66 70 68 68
73 73 75 77 66
70 68 66 70
70 69 64
103
134 168 156
111 79 71 49
100 106 105 101
112 115
120 117
98
104 110
98 103
107 100 104
316
263 316 270 172 124 161
112
263 294 282 316
246 294 168 270 316
238 316 282 208
294 316 238
N SE
Source
= Sample size = Standard error
US EPA analysis of 1994ndash1996 1998 CSFII
Table 12-15 Per Capita Intake of Individual Grain Products Based on 1994ndash1996 1998 CSFII (gkg-day edible portion uncooked weight)
Cereal Rice Population Group
N Percent Consuming Mean SE
Percent Consuming Mean SE
Whole Population Age Group
Birth to 1 year 1 to 2 years 3 to 5 years 6 to 12 years
13 to 19 years 20 to 49 years ge50 years Season Fall Spring Summer Winter Race Asian Pacific Islander Black American Indian Alaskan Native OtherNA White Region Midwest Northeast South West Urbanization Central City Suburban
Non-metropolitan
20607
1486 2096 4391 2089 1222 4677 4646
4687 5308 5890 4722
557 2740
177 1638 15495
4822 3692 7208 4885
6164 9598 4845
996
746 998 1000 1000 1000
999 1000
996 996 995 996
985 995 997 989 997
997 997 996 994
996 995 997
37
40 84 87 62 41 31 22
37 38 38 37
44 38 42 43 37
39 37 36 38
38 38 35
003
014 008 007 006 006 004 002
006 007 006 005
020 012 015 012 004
009 006 004 009
006 005 006
865
602 864 879 880 858 883 845
851 871 869 871
966 863 926 859 862
882 872 850 867
872 866 856
03
07 06 05 04 03 03 02
03 03 03 03
17 03 03 06 02
02 03 02 04
04 03 02
001
004 003 003 002 002 001 001
002 002 002 002
019 002 010 008 001
002 003 001 003
002 002 001
N SE
Source
= Sample size = Standard error
US EPA analysis of 1994ndash1996 1998 CSFII
Exposure Factors Handbook
Chapter 12mdashIntake of Grain Products
Page Exposure Factors Handbook 12-24 September 2011
Exposure Factors Handbook
Chapter 12mdashIntake of Grain Products
Table 12-16 Consumer-Only Intake of Individual Grain Products Based on 1994ndash1996 1998 CSFII (gkg-day edible portion uncooked weight )
Population Group N Cereal
Mean SE N Rice
Mean SE Whole Population 20227 38 003 17481 03 001 Age Group
Birth to 1 year 1116 54 016 900 12 007 1 to 2 years 2092 84 008 1819 07 004 3 to 5 years 4389 87 007 3869 06 003 6 to 12 years 2089 62 006 1847 04 002 13 to 19 years 1222 41 006 1038 03 003 20 to 49 years 4674 31 004 4102 03 001 ge50 years 4645 22 002 3906 02 001
Season Fall 4598 37 006 3957 03 002 Spring 5213 38 007 4530 03 002 Summer 5768 38 006 4989 03 002 Winter 4648 37 006 4005 03 002
Race Asian Pacific Islander 529 45 020 513 18 019 Black 2683 38 012 2346 04 002 American Indian Alaskan Native 175 43 015 151 03 010 OtherNA 1579 44 013 1375 07 008 White 15261 37 004 13096 02 001
Region Midwest 4759 39 009 4186 02 002 Northeast 3639 37 006 3152 04 004 South 7081 36 004 6029 03 001 West 4748 39 009 4114 05 003
Urbanization Central City 6039 38 006 5303 05 003 Suburban 9410 38 005 8105 03 002 Non-metropolitan 4778 36 006 4073 02 002
N = Sample size SE = Standard error
Source US EPA analysis of 1994ndash1996 1998 CSFII
Exposure Factors Handbook Page September 2011 12-25
Table 12-17 Per Capita Intake of Breads a Based on 1994ndash1996 1998 CSFII (gkg-day as-consumed)
Population Group Percent Consuming Mean
Percentile SE 1st 5th 10th 25th 50th 75th 90th 95th 99th Max
Whole Population Age Group lt5 months 6 to 12 months lt1 year 1 to 2 years 3 to 5 years 6 to 11 years 12 to 19 years 20 to 39 years 40 to 69 years ge70 years Season Fall Spring Summer Winter Race Asian Black American IndianAlaska Native OtherNA White Region Midwest Northeast South West Urbanization Central City Suburban Non-metropolitan
872
09 302 146 772 865 871 862 881 900 916
874 871 873 869
691 831 822 804 890
891 883 875 837
856 877 885
11
00 05 03 20 23 17 11 09 09 09
11 11 11 11
08 11 14 12 11
12 11 11 11
11 11 11
001
008 016 011 006 005 004 003 002 001 002
002 002 002 002
006 003 018 004 001
002 002 002 002
002 001 002
00
00 00 00 00 00 00 00 00 00 00
00 00 00 00
00 00 00 00 00
00 00 00 00
00 00 00
00
00 00 00 00 00 00 00 00 00 00
00 00 00 00
00 00 00 00 00
00 00 00 00
00 00 00
00
00 00 00 00 00 00 00 00 00 02
00 00 00 00
00 00 00 00 00
00 00 00 00
00 00 00
04
00 00 00 04 09 07 04 04 04 04
04 04 04 04
00 03 03 03 04
04 04 04 03
04 04 04
09
00 00 00 14 20 14 09 08 08 08
09 09 09 08
04 07 09 09 09
09 09 09 08
08 09 09
15
00 05 00 29 33 24 15 13 13 13
15 15 15 14
12 14 17 16 15
15 15 15 14
14 15 15
23
00 18 08 44 47 35 23 20 19 19
24 23 24 23
19 23 36 27 23
25 23 23 24
23 24 23
31
00 30 17 60 58 43 28 25 23 23
31 31 31 31
29 33 41 34 30
33 29 31 32
31 31 31
51
00 48 46 85 87 67 40 39 35 29
49 51 52 51
45 63 62 56 49
57 45 49 51
51 50 50
200
18 73 73 200 132
113 75 62 84 43
146 116
171 200
146 116
200 75 171
120 98 171 200
132 146 200
a SE
Source
Includes breads rolls muffins bagels biscuits cornbread and tortillas = Standard error
US EPA analysis of the 1994ndash1996 CSFII
Exposure F
actors Handbook
Chapter 12mdash
Intake of Grain Products
Page E
xposure Factors H
andbook 12-26
September 2011
Table 12-18 Per Capita Intake of Sweets a Based on 1994ndash1996 1998 CSFII (gkg-day as-consumed)
Population Group Percent Consuming
Percentile Mean SE 1st 5th 10th 25th 50th 75th 90th 95th 99th Max
Whole Population Age Group lt5 months 6 to 12 months lt1 year 1 to 2 years 3 to 5 years 6 to 11 years 12 to 19 years 20 to 39 years 40 to 69 years ge70 years Season Fall Spring Summer Winter Race Asian Black American IndianAlaska Native OtherNA White Region Midwest Northeast South West Urbanization Central City Suburban Non-metropolitan
526
25 230 121 532 621 642 543 472 529 586
537 522 500 545
402 414 353 350 563
601 554 491 477
512 546 505
06
00 03 02 12 13 12 06 04 05 05
06 06 05 06
04 05 04 04 06
07 06 06 05
06 06 06
001
004 014 010 007 006 006 003 002 002 003
003 002 002 003
008 004 011 005 001
003 003 002 002
002 002 003
00
00 00 00 00 00 00 00 00 00 00
00 00 00 00
00 00 00 00 00
00 00 00 00
00 00 00
00
00 00 00 00 00 00 00 00 00 00
00 00 00 00
00 00 00 00 00
00 00 00 00
00 00 00
00
00 00 00 00 00 00 00 00 00 00
00 00 00 00
00 00 00 00 00
00 00 00 00
00 00 00
00
00 00 00 00 00 00 00 00 00 00
00 00 00 00
00 00 00 00 00
00 00 00 00
00 00 00
01
00 00 00 03 08 06 02 00 01 02
02 01 00 02
00 00 00 00 02
03 02 00 00
01 02 01
08
00 00 00 17 19 17 10 06 07 08
09 08 07 09
06 06 03 05 09
10 09 08 07
08 09 08
18
00 11 04 35 36 32 18 14 13 16
18 18 16 19
14 15 17 13 18
20 17 17 16
16 18 18
25
00 20 10 48 46 39 24 19 19 21
25 26 23 26
20 23 21 19 25
29 25 23 23
23 26 25
46
04 36 36 72 88 67 37 32 32 36
47 47 41 48
31 47 28 41 47
53 48 44 38
46 45 51
220
06 64 64 193 220 209 107
111 73 57
209 220 182 123
157 193
29 70 220
220 127 209 157
209 127 220
a SE
Source
Includes breakfast foods made with grains such as pancakes waffles and French toast = Standard error
US EPA analysis of the 1994ndash1996 CSFII
Exposure F
actors Handbook
Chapter 12mdash
Intake of Grain Products
Exposure F
actors Handbook
Page Septem
ber 2011 12-27
Table 12-19 Per Capita Intake of Snacks Containing Grains a Based on 1994ndash1996 1998 CSFII (gkg-day as-consumed)
Population Group Percent Consuming
Percentile Mean SE 1st 5th 10th 25th 50th 75th 90th 95th 99th Max
Whole Population Age Group lt5 months 6 to 12 months lt1 year 1 to 2 years 3 to 5 years 6 to 11 years 12 to 19 years 20 to 39 years 40 to 69 years ge70 years Season Fall Spring Summer Winter Race Asian Black American IndianAlaska Native OtherNA White Region Midwest Northeast South West Urbanization Central City Suburban Non-metropolitan
431
10 290 141 581 567 513 450 411 411 377
423 436 406 458
241 295 383 284 471
492 419 411 407
401 446 441
02
00 03 01 07 07 05 03 02 01 01
02 03 02 03
01 02 02 02 03
03 02 02 02
02 03 02
001
011 008 006 004 004 003 002 001 001 001
001 001 001 002
004 002 008 003 001
001 002 001 002
001 001 001
00
00 00 00 00 00 00 00 00 00 00
00 00 00 00
00 00 00 00 00
00 00 00 00
00 00 00
00
00 00 00 00 00 00 00 00 00 00
00 00 00 00
00 00 00 00 00
00 00 00 00
00 00 00
00
00 00 00 00 00 00 00 00 00 00
00 00 00 00
00 00 00 00 00
00 00 00 00
00 00 00
00
00 00 00 00 00 00 00 00 00 00
00 00 00 00
00 00 00 00 00
00 00 00 00
00 00 00
00
00 00 00 04 03 01 00 00 00 00
00 00 00 00
00 00 00 00 00
00 00 00 00
00 00 00
03
00 02 00 11 09 06 04 02 02 01
03 03 02 03
00 01 02 01 03
03 02 02 02
02 03 03
07
00 09 06 20 18 13 09 06 05 03
07 08 07 08
04 05 06 05 08
08 07 07 07
07 07 07
12
00 22 09 28 32 19 14 09 07 05
10 13 10 13
10 09 11 08 12
12 12 11 12
11 12 11
26
01 25 22 50 59 46 24 18 14 08
23 29 23 29
23 21 32 24 27
27 27 24 26
26 27 23
91
37 28 37 89 91 73 51 55 56 18
80 89 71 91
44 74 49 87 91
89 91 80 87
78 91 81
a SE
Source
Includes grain snacks such as crackers salty snacks popcorn and pretzels = Standard error
US EPA analysis of the 1994ndash1996 CSFII
Exposure F
actors Handbook
Chapter 12mdash
Intake of Grain Products
Page E
xposure Factors H
andbook 12-28
September 2011
Table 12-20 Per Capita Intake of Breakfast Foods a Based on 1994ndash1996 1998 CSFII (gkg-day as-consumed)
Population Group Percent Consuming
Percentile Mean SE 1st 5th 10th 25th 50th 75th 90th 95th 99th
Max
Whole Population Age Group lt5 months 6 to 12 months lt1 year 1 to 2 years 3 to 5 years 6 to 11 years 12 to 19 years 20 to 39 years 40 to 69 years ge70 years Season Fall Spring Summer Winter Race Asian Black American IndianAlaska Native OtherNA White Region Midwest Northeast South West Urbanization Central City Suburban Non-metropolitan
118
00 42 20 204 208 237 130
89 95 104
116 116
128 113
59 127
88 102 120
121 127 107 124
120 122 107
01
00 01 01 04 04 04 01 01 01 01
01 01 01 01
01 01 01 01 01
01 01 01 02
01 01 01
001
000 024 016 007 006 005 003 002 001 002
002 002 002 002
007 003 008 005 001
002 003 002 002
002 002 002
00
00 00 00 00 00 00 00 00 00 00
00 00 00 00
00 00 00 00 00
00 00 00 00
00 00 00
00
00 00 00 00 00 00 00 00 00 00
00 00 00 00
00 00 00 00 00
00 00 00 00
00 00 00
00
00 00 00 00 00 00 00 00 00 00
00 00 00 00
00 00 00 00 00
00 00 00 00
00 00 00
00
00 00 00 00 00 00 00 00 00 00
00 00 00 00
00 00 00 00 00
00 00 00 00
00 00 00
00
00 00 00 00 00 00 00 00 00 00
00 00 00 00
00 00 00 00 00
00 00 00 00
00 00 00
00
00 00 00 00 00 00 00 00 00 00
00 00 00 00
00 00 00 00 00
00 00 00 00
00 00 00
04
00 00 00 19 16 15 05 00 00 01
04 04 05 03
00 04 00 00 04
04 05 02 05
04 05 03
10
00 00 00 27 25 22 09 06 06 07
10 10 10 09
06 12 03 09 10
11 12 08 10
10 10 09
24
00 41 27 48 45 34 23 15 14 12
23 23 24 26
20 21 12 26 24
26 23 22 26
25 24 22
136
00 41 41 136
80 65 39 30 38 35
136
64 60 80
28 67 12 80 136
67 80 78 136
136
78 64
a SE
Source
Includes breakfast food made with grains such as pancakes waffles and French toast = Standard error
US EPA analysis of the 1994ndash1996 CSFII
Exposure F
actors Handbook
Chapter 12mdash
Intake of Grain Products
Exposure F
actors Handbook
Page Septem
ber 2011 12-29
Table 12-21 Per Capita Intake of Pasta Based on 1994ndash1996 1998 CSFII (gkg-day as-consumed) Population Group
Percent
Consuming Percentile
Mean SE 1st 5th 10th 25th 50th 75th 90th 95th 99th Max Whole Population
Age Group lt5 months 6 to 12 months lt1 year 1 to 2 years 3 to 5 years 6 to 11 years 12 to 19 years 20 to 39 years 40 to 69 years ge70 years Season Fall Spring Summer Winter Race Asian Black American IndianAlaska Native OtherNA White Region Midwest Northeast South West Urbanization Central City Suburban Non-metropolitan
130
00 75 35 160 128 134
117 139 137 90
136 132 126 126
194 70 18 96 141
121 201 95 132
134 140 103
03
00 01 01 08 06 05 03 03 02 02
03 03 03 03
05 02 01 02 03
03 05 02 03
03 03 02
002
000 022 015 015 013 012 009 004 003 006
005 005 005 006
017 010 023 009 003
005 005 005 005
005 003 005
00
00 00 00 00 00 00 00 00 00 00
00 00 00 00
00 00 00 00 00
00 00 00 00
00 00 00
00
00 00 00 00 00 00 00 00 00 00
00 00 00 00
00 00 00 00 00
00 00 00 00
00 00 00
00
00 00 00 00 00 00 00 00 00 00
00 00 00 00
00 00 00 00 00
00 00 00 00
00 00 00
00
00 00 00 00 00 00 00 00 00 00
00 00 00 00
00 00 00 00 00
00 00 00 00
00 00 00
00
00 00 00 00 00 00 00 00 00 00
00 00 00 00
00 00 00 00 00
00 00 00 00
00 00 00
00
00 00 00 00 00 00 00 00 00 00
00 00 00 00
00 00 00 00 00
00 00 00 00
00 00 00
10
00 00 00 34 21 20 08 11 10 00
12 11 09 08
20 00 00 00 11
08 19 00 09
12 12 01
22
00 10 00 62 44 38 21 22 19 13
24 23 21 21
33 17 00 20 23
21 28 18 22
25 22 15
51
00 33 23 106
84 75 42 41 36 29
47 58 52 51
66 36 24 35 53
52 59 44 57
53 53 42
291
00 67 67 167 143
119 291
112 118
77
167 147 154 291
112 291
36 154 167
167 154 291 141
291 167 141
SE
Source
= Standard error
US EPA analysis of the 1994ndash1996 CSFII
Exposure F
actors Handbook
Chapter 12mdash
Intake of Grain Products
Page E
xposure Factors H
andbook 12-30
September 2011
Table 12-22 Per Capita Intake of Cooked Cereals Based on 1994ndash1996 1998 CSFII (gkg-day as-consumed)
Population Group Percent Consuming
Percentile Mean SE 1st 5th 10th 25th 50th 75th 90th 95th 99th Max
Whole Population Age Group lt5 months 6 to 12 months lt1 year 1 to 2 years 3 to 5 years 6 to 11 years 12 to 19 years 20 to 39 years 40 to 69 years ge70 years Season Fall Spring Summer Winter Race Asian Black American IndianAlaska Native OtherNA White Region Midwest Northeast South West Urbanization Central City Suburban Non-metropolitan
104
09 166
83 184 160
87 56 62
116 245
120
91 93
111
44 201
76 76 93
96 90 124
94
116 99 97
04
01 19 09 16 13 05 02 01 03 06
04 03 03 04
02 07 03 04 03
03 03 04 04
04 03 03
004
054 118 082 029 028 017 009 005 003 007
008 006 008 008
020 010 032 030 004
007 010 006 009
008 005 007
00
00 00 00 00 00 00 00 00 00 00
00 00 00 00
00 00 00 00 00
00 00 00 00
00 00 00
00
00 00 00 00 00 00 00 00 00 00
00 00 00 00
00 00 00 00 00
00 00 00 00
00 00 00
00
00 00 00 00 00 00 00 00 00 00
00 00 00 00
00 00 00 00 00
00 00 00 00
00 00 00
00
00 00 00 00 00 00 00 00 00 00
00 00 00 00
00 00 00 00 00
00 00 00 00
00 00 00
00
00 00 00 00 00 00 00 00 00 00
00 00 00 00
00 00 00 00 00
00 00 00 00
00 00 00
00
00 00 00 00 00 00 00 00 00 00
00 00 00 00
00 00 00 00 00
00 00 00 00
00 00 00
06
00 94 00 69 53 00 00 00 09 22
11 00 00 09
00 22 00 00 00
00 00 11 00
09 00 00
23
00 161
57 107
79 40 10 11 19 34
26 20 21 25
00 44 21 20 20
21 22 26 23
26 21 23
72
00 228 228 206 161
94 43 33 44 56
81 64 69 74
53 109
58 106
61
57 59 79 80
81 69 57
725
56 228 228 339 725 241 106
92 87 106
459 209 725 445
161 339 123 725 459
459 725 317 395
725 459 269
SE
Source
= Standard error
US EPA analysis of the 1994ndash1996 CSFII
Exposure F
actors Handbook
Chapter 12mdash
Intake of Grain Products
Exposure F
actors Handbook
Page Septem
ber 2011 12-31
Table 12-23 Per Capita Intake of Ready-to-Eat Cereals a Based on 1994ndash1996 1998 CSFII (gkg-day as-consumed)
Population Group Percent Consuming
Percentile Mean SE 1st 5th 10th 25th 50th 75th 90th 95th 99th Max
Whole Population Age
lt5 months 6 to 12 months lt1 year 1 to 2 years 3 to 5 years 6 to 11 years 12 to 19 years 20 to 39 years 40 to 69 years ge70 years Season Fall Spring Summer Winter Race Asian Black American IndianAlaska Native OtherNA White Region Midwest Northeast South West Urbanization Central City Suburban Non-metropolitan
397
00 199
93 649 698 640 457 305 318 479
391 401 396 399
254 340 331 333 417
422 423 374 384
400 412 358
03
00 01 01 10 11 08 04 02 02 02
03 03 03 03
02 03 03 03 03
04 04 03 03
03 04 03
001
000 007 005 004 004 003 002 001 001 001
002 002 002 002
005 002 009 004 001
002 002 001 002
001 001 001
00
00 00 00 00 00 00 00 00 00 00
00 00 00 00
00 00 00 00 00
00 00 00 00
00 00 00
00
00 00 00 00 00 00 00 00 00 00
00 00 00 00
00 00 00 00 00
00 00 00 00
00 00 00
00
00 00 00 00 00 00 00 00 00 00
00 00 00 00
00 00 00 00 00
00 00 00 00
00 00 00
00
00 00 00 00 00 00 00 00 00 00
00 00 00 00
00 00 00 00 00
00 00 00 00
00 00 00
00
00 00 00 07 09 06 00 00 00 00
00 00 00 00
00 00 00 00 00
00 00 00 00
00 00 00
04
00 00 00 15 17 12 06 03 02 04
04 04 04 05
01 04 04 03 05
05 05 04 04
05 05 04
10
00 03 00 25 26 20 11 07 06 07
11 10 11 10
08 10 08 11 11
11 11 10 11
11 11 08
15
00 10 03 33 33 25 15 10 09 09
16 15 16 14
12 15 14 17 15
16 16 13 16
15 16 12
29
00 18 17 49 48 40 22 17 14 15
29 29 30 27
27 32 26 30 28
29 29 28 31
28 31 26
101
00 26 26 88 101
80 64 53 52 27
88 77 78 101
49 101
44 66 88
80 80 101
88
101 80 88
a SE
Source
Includes dry ready-to-eat corn rice wheat and bran cereals in the form of flakes puffs etc = Standard error
US EPA analysis of the 1994ndash1996 CSFII
Exposure F
actors Handbook
Chapter 12mdash
Intake of Grain Products
Page E
xposure Factors H
andbook 12-32
September 2011
Table 12-24 Per Capita Intake of Baby Cereals Based on 1994ndash1996 1998 CSFII (gkg-day as-consumed)
Population Group Percent Consuming
Percentile Mean SE 1st 5th 10th 25th 50th 75th 90th 95th 99th Max
Whole Population Age
lt5 months 6 to 12 months lt1 year 1 to 2 years 3 to 5 years 6 to 11 years 12 to 19 years 20 to 39 years 40 to 69 years ge70 years Season Fall Spring Summer Winter Race Asian Black American IndianAlaska Native OtherNA White Region Midwest Northeast South West Urbanization Central City Suburban Non-metropolitan
10
408 678 534
62 03 01 00 00 01 00
09 12 08 11
07 10 06 17 10
11 12 09 09
11 11 08
00
08 25 16 02 00 00 00 00 00 00
00 00 00 00
00 00 00 01 00
00 00 00 00
00 00 00
003
024 045 027 010 006 000 000 000 000 000
007 005 006 006
004 012 004 020 003
008 004 005 006
006 004 006
00
00 00 00 00 00 00 00 00 00 00
00 00 00 00
00 00 00 00 00
00 00 00 00
00 00 00
00
00 00 00 00 00 00 00 00 00 00
00 00 00 00
00 00 00 00 00
00 00 00 00
00 00 00
00
00 00 00 00 00 00 00 00 00 00
00 00 00 00
00 00 00 00 00
00 00 00 00
00 00 00
00
00 00 00 00 00 00 00 00 00 00
00 00 00 00
00 00 00 00 00
00 00 00 00
00 00 00
00
00 08 02 00 00 00 00 00 00 00
00 00 00 00
00 00 00 00 00
00 00 00 00
00 00 00
00
10 28 17 00 00 00 00 00 00 00
00 00 00 00
00 00 00 00 00
00 00 00 00
00 00 00
00
24 69 41 00 00 00 00 00 00 00
00 00 00 00
00 00 00 00 00
00 00 00 00
00 00 00
00
31 113
73 08 00 00 00 00 00 00
00 00 00 00
00 00 00 00 00
00 00 00 00
00 00 00
01
88 211 197
58 00 00 00 00 00 00
00 06 00 03
00 00 00 12 00
03 05 00 00
03 01 00
376
266 376 376 125
38 01 00 00 03 00
211 266 260 376
21 376
09 266 260
211 125 376 266
376 211 260
SE
Source
= Standard error
US EPA analysis of the 1994ndash1996 CSFII
Exposure F
actors Handbook
Chapter 12mdash
Intake of Grain Products
Exposure F
actors Handbook
Page Septem
ber 2011 12-33
Table 12-25 Quantity (as-consumed) of Grain Products Consumed per Eating Occasion and the Percentage of Individuals Using These Foods in 2 Days
Indiv Using Quantity Consumed per Consumers Only Food at Least Eating Occasion Quantity Consumed per Eating Occasion at Specified Percentiles
Food Category Once in 2 days (grams) (grams) Average SE 5th 10th 25th 50th 75th 90th 95th
White bread 596 50 1 21 24 33 46 52 78 104 Whole grain and wheat bread 281 50 1 24 25 37 50 56 72 92 Rolls 480 58 1 27 33 43 48 70 89 110 Biscuits 109 61 1 19 19 35 57 76 104 139 Tortillas 155 60 1 14 21 32 48 79 107 135 Quick breads and muffins 125 82 2 21 28 52 60 94 142 187 Doughnuts and sweet rolls 124 77 1 26 36 47 65 93 133 164 Crackers 174 26 1 6 9 12 18 30 47 62 Cookies 307 40 1 9 12 20 31 50 75 96 Cake 162 92 3 22 28 41 77 116 181 217 Pie 85 150 3 52 72 102 143 168 246 300 Pancakes and waffles 103 85 3 21 35 42 75 109 158 205 Cooked cereal 103 248 6 81 117 157 233 291 455 484 Oatmeal 61 264 6 116 117 176 232 333 454 473 Ready-to-eat cereal 406 54 1 18 24 30 46 67 93 113 Corn flakes 81 46 1 17 22 25 37 56 75 100 Toasted oat rings 68 42 1 14 16 27 38 54 65 83 Rice 280 150 3 27 40 76 131 192 312 334 Pasta 360 162 3 26 43 73 133 210 318 420 Macaroni and cheese 85 244 9 53 81 121 191 324 477 556 Spaghetti with tomato sauce 80 436 15 122 124 246 371 494 740 983 Pizza 199 169 5 36 52 78 140 214 338 422 SE = Standard error
Source Smiciklas-Wright et al (2002) (based on 1994ndash1996 CSFII data)
Exposure F
actors Handbook
Chapter 12mdash
Intake of Grain Products
Page E
xposure Factors H
andbook 12-34
September 2011
Table 12-26 Quantity (as-consumed) of Grain Products Consumed per Eating Occasion and Percentage of Individuals Using These Foods in 2 Days by Sex and Age
Food Category
Quantity Consumed per Eating Occasion (grams) 2 to 5 years 6 to 11 years 12 to 19 years
Males and Females (N = 2109)
Males and Females Males (N = 1432) (N = 696)
Females (N = 702)
PC Mean SE PC Mean SE PC Mean SE PC Mean SE White bread
Whole grain and wheat bread Rolls Biscuits
Tortillas Quick breads and muffins
Doughnuts and sweet rolls Crackers
Cookies Cake
Pie Pancakes and waffles Cooked cereal
Oatmeal Ready-to-eat cereal Corn flakes Toasted oat rings Rice
Pasta Macaroni and cheese Spaghetti with tomato sauce
Pizza Corn chips
Popcorn
669 243 400
83 146
96 113
254 510 146
29 191 168 104 729
112 206 296 494 178 168 237 196
116
34 37 39 38 32 55 59 17 28 70 76 49
211 221
33 33 30 84 90 159 242
86 29 20
a
1 1 2 2 4 2 1 1 3 8 1
10 9 1 2 1 3 3 8 11 3 2 1
671 205 535
97 164
96 134 172 467 197
56 215
90 57 673 131 125 246 414 132
115 328 256 127
42 44 48 48 47 67 69 26 37 79
116 77 245 256
47 42 45 124 130 217 322 108
33 31
1 1 1 3 2 5 2 2 2 4 8 3
14 19
1 2 2 6 5
13 18
6 2 2
613 145 619 122 229
110 173 106 290 151
66 135
52 24 456 104
73 242 334
75 101 396 269
78
56 60 69 72 76 125 102
39 53 99 188
96 310b
348b
72 62 62 203 203 408 583 205
58 54
1 2 2 4 5
12 12
5 3 9
15 6
29b
45b
3 4 5
10 9
46 46 13
5 5
579 176 488 103 201
110 138 142 318 155
48 82 60 23 463
87 81 288 378 107
85 305 251 105
47 53 51 55 56 79 78 26 42 85
138b
74 256b
321b
52 49 42 157 155 260 479 143
44 37
1 2 1 4 3
10 5 3 2 8
12b
5 31b
40b
2 4 3
10 9
30 51
8 3 4
Exposure F
actors Handbook
Chapter 12mdash
Intake of Grain Products
Exposure F
actors Handbook
Page Septem
ber 2011 12-35
Exposure F
actors Handbook
Chapter 12mdash
Intake of Grain Products
Page E
xposure Factors H
andbook 12-36
September 2011
Table 12-26 Quantity (as-consumed) of Grain Products Consumed per Eating Occasion and Percentage of Individuals Using These Foods in 2 Days by Sex and Age (continued)
Food Category
Quantity Consumed per Eating Occasion (g) 20 to lt40 years 40 to lt60 years gt60 years
Males Females (N = 1543) (N = 1449)
Males Females (N = 1663) (N = 1694)
Males Females (N = 1545) (N = 1429)
PC Mean SE PC Mean SE PC Mean SE PC Mean SE PC Mean SE PC Mean SE White bread
Whole grain and wheat bread Rolls Biscuits
Tortillas Quick breads and muffins
Doughnuts and sweet rolls Crackers
Cookies Cake
Pie Pancakes and waffles Cooked cereal
Oatmeal Ready-to-eat cereal Corn flakes Toasted oat rings Rice
Pasta Macaroni and cheese
Spaghetti with tomato sauce Pizza
Corn chips Popcorn
630 253 620
115 206
80 133
119 208 135
58 80 52 27 269
65 42 308 371
78 86 237 162
81
63 63 73 73 79 93 94 36 56
113 161 126 313 360a
77 73 62 199 214 301 630 253
61 63
2 1 4 3 4 7 5 3 4 6 7
15 30 42a
3 6 4 9 8
19 48 12
5 6
549 252 464
94 201
113 112
156 265 149
72 74 73 37 347
53 54 321 371
78 78 202 179
97
47 48 53 55 53 79 68 28 39 94 150
80 219 258
55 43 42 139 155 235 385 150
35 35
1 1 1 2 2 5 2 2 2 7 9 6 11
17 1 2 2 6 6
19 22
6 2 2
597 328 479 134 134 157 134 166 276 165
118 75 97 60 298
59 48 294 343
61 55 130 128
96
59 57 65 80 67 93 88 30 47 108 162
117 300 332
68 49 46 167 208 302 543 220
47 50
2 1 1 3 3 7 4 1 2 6 6 8
16 16
2 3 2 5 7
31 59 13
4 4
553 323 434
112 127 149
110 175 290 168
99 80 103
62 297
52 41 288 347
60 54 145 120 109
46 46 52 56 52 72 72 24 36 83 151
74 243 242
51 40 35 130 140 210 386 147
33 39
1 2 1 2 2 4 4 1 1 4 8 5 11
10 1 3 2 4 5
12 18
8 2 3
593 398 378 130
42 174
114 256 297 192 164 108 209 136 446 124
43 231 279
71 50 53 48 61
51 48 54 58 47 86 65 23 40 85 154
99 255 257
53 37 36 147 167 230 450 187
30 52
1 1 1 3 4 5 2 1 2 4 7 5 8
10 1 2 3 6 7
13 22 18
3 4
548 431 306
98 54 183 104 259 322 183 133
82 202 129 440 104
49 214 279
65 45 47 53 76
41 41 43 48 41 72 56 17 30 87 137
68 216 224
41 30 27
118 132 215 379 109
21 34
1 1 1 3 2 4 2 1 1 7 5 4 8
10 1 1 2 5 5
18 33
8 2 3
a Indicates a SE value that is greater than 0 but less than 05 b Indicates a statistic that is potentially unreliable because of small sample size or large coefficient of variation N = Sample size
PC = Percent consuming at least once in 2 days SE = Standard error of the mean
Source Smiciklas-Wright et al (2002) (based on 1994ndash1996 CSFII data)
Exposure Factors Handbook
Chapter 12mdashIntake of Grain Products
Table 12-27 Consumption of Major Food Groups by Older Adults Median Daily Servings (and ranges) by Demographic and Health Characteristics
Subject Characteristic N Bread Cereal Rice and Pasta (servingsday) Sex a
Females 80 27 (09ndash65) Males 50 36 (14ndash73)
Ethnicity African American 44 33 (14ndash64) European American 47 32 (09ndash68) Native American 39 29 (11ndash73)
Age 70 to 74 years 42 33 (11ndash63) 75 to 79 years 36 30 (09ndash68) 80 to 84 years 36 32 (15ndash64) gt85 years 16 36 (16ndash73)
Marital Status Married 49 33 (11ndash58) Not Married 81 30 (09ndash73)
Education 8th grade or less 37 31 (11ndash73) 9th to 12th grades 47 33 (11ndash68) gtHigh School 46 32 (09ndash65)
Dentures Yes 83 33 (11ndash64) No 47 31 (09ndash73)
Chronic Diseases 0 7 41 (22ndash64) 1 31 33 (09ndash73) 2 56 31 (11ndash58) 3 26 37 (11ndash58) gt4 10 29 (14ndash53)
Weightb
le130 pounds 18 31 (11ndash54) 131 to 150 pounds 32 33 (09ndash52) 151 to 170 pounds 27 31 (14ndash73) 171 to 190 pounds 22 36 (14ndash62) ge191 pounds 29 30 (11ndash68)
a p lt 005 b 2 missing values N = Number of subjects
Source Vitolins et al (2002)
Exposure Factors Handbook Page September 2011 12-37
Exposure Factors Handbook
Chapter 12mdashIntake of Grain Products
Table 12-28 Characteristics of the Feeding Infant and Toddlers Study (FITS) Sample Population Sample Size Percentage of Sample
Sex Males Females
1549 1473
513 487
Age of Child 4 to 6 months 7 to 8 months 9 to 11 months 12 to 14 months 15 to 18 months 19 to 24 months
862 483 679 374 308 316
285 160 225 124 102 104
Childrsquos Ethnicity Hispanic or Latino Non-Hispanic or Latino Missing
367 2641
14
121 874 05
Childrsquos Race White Black Other
2417 225 380
800 74 126
Urbanicity Urban Suburban Rural Missing
1389 1014 577 42
460 336 191 13
Household Income Under $10000 $10000 to $14999 $15000 to $24999 $25000 to $34999 $35000 to $49999 $50000 to $74999 $75000 to $99999 $100000 and Over Missing
48 48
221 359 723 588 311 272 452
16 16 73 119 239 195 103 90 149
Receives WIC Yes No Missing
821 2196
5
272 726 02
Sample Size (Unweighted) 3022 1000 WIC = Special Supplemental Nutrition Program for Women Infants and Children
Source Devaney et al (2004)
Page Exposure Factors Handbook 12-38 September 2011
Table 12-29 Percentage of Infants and Toddlers Consuming Different Types of Grain Products Percentage of Infants and Toddlers Consuming at Least Once in a Day
Food GroupFood 4 to 6 7 to 8 9 to 11 12 to 14 15 to 18 19 to 24 Months Months Months Months Months Months
Any Grain or Grain Product 658 915 975 978 986 992 Infant Cereals 648 812 638 239 92 31 Non-infant Cerealsa 06 183 443 589 605 519
Not Pre-sweetened 05 170 370 445 406 319 Pre-sweetenedb 00 18 90 177 264 227
Breads and Rollsc 06 99 245 473 527 531 Crackers Pretzels Rice Cakes 30 162 334 452 464 447 Cereal or Granola Bars 00 11 34 98 100 97 Pancakes Waffles French Toast 01 08 75 151 161 154 Rice and Pastad 23 45 182 262 390 359 Other 02 01 27 28 25 45 Grains in Mixed Dishes 04 53 241 483 520 551 Sandwiches 00 11 86 215 258 258 Burrito Taco Enchilada Nachos 00 00 10 45 28 21 Macaroni and Cheese 02 16 49 146 150 150 Pizza 01 07 22 68 90 94 Pot PieHot Pocket 00 09 05 20 10 18 Spaghetti Ravioli Lasagna 01 18 99 153 121 88 a Includes both ready-to-eat and cooked cereals b Defined as cereals with more than 211 grams sugar per 100 grams c Does not include bread in sandwiches Sandwiches are included in mixed dishes d Does not include rice or pasta in mixed dishes
Source Fox et al (2004)
Exposure Factors Handbook
Chapter 12mdashIntake of Grain Products
Exposure Factors Handbook Page September 2011 12-39
Table 12-30
a Characteristics of Women Infants and Children (WIC) Participants and Non-Participants (percentages)
Infants 4 to 6 month Infants 7 to 11 month Toddlers 12 to 24 month WIC
Participant Non-Participant WIC
Participant Non-Participant WIC
Participant Non-Participant Sex Males 55 Females 45
Childrsquos Ethnicity Hispanic or Latino 20 Non-Hispanic or Latino 80
Childrsquos Race White 69 Black 15 Other 22
Child in Daycare Yes 39 No 61 Age of Mother 14 to 19 years 18 20 to 24 years 33 25 to 29 years 29 30 to 34 years 9 gt35 years 9 Missing 2
Motherrsquos Education 11th Grade or Less 23 Completed High School 35 Some Postsecondary 33 Completed College 7 Missing 2
Parentrsquos Marital Status Married 49 Not Married 50 Missing 1
Mother or Female Guardian Works Yes 46 No 53 Missing 1
54 46
b
11 89
b 84
4 11
38 62
b 1
13 29 33 23
2 b 2
19 26 53
1 b
93 7 1
51 48
1
55 45
24 76
63 17 20
34 66
13 38 23 15
11 1 15 42 32
9 2 57 42
1 45 54
1
51 49
b 8
92 b
86 5 9 b
46 54
b 1 11
30 36 21
1 b 2
20 27 51
0 b
93 7 0 b
60 40
0
57 43
22 78
67 13 20
43 57
9
33 29 18
11 0
17 42 31
9 1
58 41
1
55 45
0
52 48
b 10 89
b 84
5 11
c
53 47
b 1
14 26 34 26
1 b 3
19 28 48
2 b
88 11 1
c
61 38
1
Exposure Factors Handbook
Chapter 12mdashIntake of Grain Products
Page Exposure Factors Handbook 12-40 September 2011
c
Table 12-30 Characteristics of Women Infants and Children (WIC) Participants and Non-Participantsa
(percentages) (continued) Infants 4 to 6 months Infants 7 to 11 months Toddlers 12 to 24 months
WIC WIC WIC Participant Non-Participant Participant Non-Participant Participant Non-Participant
Urbanicity c c c
Urban 34 55 37 50 35 48 Suburban 36 31 31 34 35 35 Rural 28 13 30 15 28 16 Missing 2 1 2 1 2 2
Sample Size (Unweighted) 265 597 351 808 205 791 a χ2 tests were conducted to test for statistical significance in the differences between WIC participants and nonshy
participants within each age group for each variable The results of χ2 tests are listed next to the variable under the column labeled non-participants for each of the three age groups
b = p lt 005 non-participants significantly different from WIC participants on the variable = p lt 001 non-participants significantly different from WIC participants on the variable
WIC = Special Supplemental Nutrition Program for Women Infants and Children
Source Ponza et al (2004)
Table 12-31 Food Choices for Infants and Toddlers by Women Infants and Children (WIC) Participation Status
Infants 4 to 6 months Infants 7 to 11 months Toddlers 12 to 24 months WIC Non- WIC Non- WIC Non-
Participant Participant Participant Participant Participant Participant 697 Infant Cereals 697 625 747 135 92
Non-infant Cereals Total 09 05 217 385a 581 560
Not Pre-sweetened 05 05 187 329a 437 363 Pre-sweetened 00 00 40 69 177 241
Grains in Combination Foods 09 01 188 147 503 529 Sample Size (unweighted) 265 597 351 808 205 791 a = p lt 001 non-participants significantly different from WIC participants WIC = Special Supplemental Nutrition Program for Women Infants and Children
Source Ponza et al (2004)
Exposure Factors Handbook
Chapter 12mdashIntake of Grain Products
Exposure Factors Handbook Page September 2011 12-41
Table 12-32 Average Portion Sizes per Eating Occasion of Grain Products Commonly Consumed by Infants From the 2002 Feeding Infants and Toddlers Study
4 to 5 months 6 to 8 months 9 to 11 months Reference Food Group (N = 624) (N = 708) (N = 687) Unit Mean plusmn SE Infant cereal dry tablespoon 31 plusmn 014 45 plusmn 014 52 plusmn 018 Infant cereal jarred tablespoon - 56 plusmn 026 74 plusmn 034 Ready-to-eat cereal tablespoon - 23 plusmn 034 34 plusmn 021 Crackers ounce - 02 plusmn 002 03 plusmn 001 Crackers saltine - 22 plusmn 014 27 plusmn 012 Bread slice - 05 plusmn 010 08 plusmn 006 - = Cell size was too small to generate a reliable estimate N = Number of respondents SE = Standard error of the mean
Source Fox et al (2006)
Exposure Factors Handbook
Chapter 12mdashIntake of Grain Products
Table 12-33 Average Portion Sizes per Eating Occasion of Grain Products Commonly Consumed by Toddlers From the 2002 Feeding Infants and Toddlers Study
Food Group Reference Unit 12 to 14 months
(N = 371) 15 to 18 months
(N = 312) 19 to 24 months (N = 320)
Mean plusmn SE Bread slice 08 plusmn 004 09 plusmn 005 09 plusmn 005 Rolls ounce 09 plusmn 011 10 plusmn 010 09 plusmn 015 Ready-to-eat cereal cup 03 plusmn 002 05 plusmn 003 06 plusmn 004 Hot cereal prepared cup 06 plusmn 005 06 plusmn 005 07 plusmn 005 Crackers ounce 03 plusmn 002 04 plusmn 002 04 plusmn 002 Crackers saltine 33 plusmn 022 35 plusmn 022 37 plusmn 022 Pasta cup 04 plusmn 004 04 plusmn 004 05 plusmn 005 Rice cup 03 plusmn 004 04 plusmn 005 04 plusmn 005 Pancakes and waffles 1 (4-inch diameter) 10 plusmn 008 14 plusmn 021 14 plusmn 017 N = Number of respondents SE = Standard error of the mean
Source Fox et al (2006)
Page Exposure Factors Handbook 12-42 September 2011
c
Table 12-34 Percentage of Hispanic and Non-Hispanic Infants and Toddlers Consuming Different Types of Grain Products on a Given Day Age 4 to 5 months Age 6 to 11 months Age 12 to 24 months
Hispanic Non-Hispanic Hispanic Non-Hispanic Hispanic Non-Hispanic (N = 84) (N = 538) (N = 163) (N = 1228) (N = 124) (N = 871)
Any Grain or Grain Product Infant Cereal Non-infant Cereal Breadsb
Tortillas Crackers Pretzels Rice Cakes Pancakes Waffles French Toast Rice and Pastad
Rice Grains in Mixed Dishes
Sandwiches Burrito Taco Enchilada Nachos
565 552
-14c
14c
13c
------
569 565
----------
950 741 185a
182 40c
278 14c
201a
159e
159 40c
13c
935 736 292 151
-225 43
103 47
130 46 -
971 159 453 440 67a c
356 130 443
269a c
388a
242 21c
989 93
578 529 06c
469 160 329 130 544 249 30
Macaroni and Cheese - - 30c 31 101 155
Pizza - - - 14 10c e 97
Spaghetti Ravioli Lasagna - - 83c 46 93c 121 a = Significantly different from non-Hispanic at p lt 005 b Does not include bread in sandwiches Sandwiches are included in mixed dishes Includes tortillas also shown
separately = Statistic is potentially unreliable because of a high coefficient of variation
d Does not include rice or pasta in mixed dishes Includes rice (eg white brown wild and Spanish rice without meat) and pasta (eg spaghetti macaroni and egg noodles) Rice is also shown separately
e = Significantly different from non-Hispanic at p lt 001 - = Less than 1 of the group consumed this food on a given day N = Sample size
Source Mennella et al (2006)
Exposure Factors Handbook
Chapter 12mdashIntake of Grain Products
Exposure Factors Handbook Page September 2011 12-43
Exposure Factors Handbook
Chapter 12mdashIntake of Grain Products
Table 12-35 Mean Moisture Content of Selected Grain Products Expressed as Percentages of Edible Portions (grams per 100 grams of edible portion)
Food Moisture Content Comments Raw Cooked Barley―pearled 1009 6880 Corn―grain―endosperm 1037 -Corn―grain―bran 471 - crude Millet 867 7141 Oats 822 -Rice―white―long-grained 1162 6844 Rye 1095 -Rye―flour―medium 985 -Sorghum 920 -Wheat―hard white 957 -Wheat―germ 1112 - crude Wheat―bran 989 - crude Wheat―flour―whole grain 1027 -- Indicates that the grain product was not assessed for water content under these conditions
Source USDA (2007)
Page Exposure Factors Handbook 12-44 September 2011
- TABLE OF CONTENTS
- LIST OF TABLES
- 12 INTAKE OF GRAIN PRODUCTS
-
- 121 INTRODUCTION
- 122 RECOMMENDATIONS
- 123 INTAKE STUDIES
-
- 1231 Key Grain Intake Study
-
- 12311 US EPA Analysis of Consumption Data From 2003minus2006 National Health and Nutrition Examination Survey (NHANES)
-
- 1232 Relevant Grain Intake Studies
-
- 12321 USDA (1996a b 1993 1980)mdashFood and Nutrient Intakes of Individuals in 1 Day in the United States
- 12322 USDA (1999b)mdashFood Consumption Prices and Expenditures 1970minus1997
- 12323 USDA (1999a)mdashFood and Nutrient Intakes by Children 1994minus1996 1998 Table Set 17
- 12324 US EPA Analysis of Continuing Survey of Food Intake by Individuals (CSFII) 1994minus1996 1998
- 12325 Smiciklas-Wright et al (2002)mdashFoods Commonly Eaten in the United States Quantities Consumed per Eating Occasion and in a Day 1994minus1996
- 12326 Vitolins et al (2002)mdashQuality of Diets Consumed by Older Rural Adults
- 12327 Fox et al (2004)mdashFeeding Infants and Toddlers Study What Foods Are Infants and Toddlers Eating
- 12328 Ponza et al (2004)mdashNutrient Food Intakes and Food Choices of Infants and Toddlers Participating in WIC
- 12329 Fox et al (2006)mdashAverage Portion of Foods Commonly Eaten by Infants and Toddlers in the United States
- 123210 Mennella et al (2006)mdashFeeding Infants and Toddlers Study The Types of Foods Fed to Hispanic Infants and Toddlers
-
- 124 CONVERSION BETWEEN WET- AND DRY-WEIGHT INTAKE RATES
- 125 REFERENCES FOR CHAPTER 12
-

Exposure Factors Handbook
Chapter 12mdashIntake of Grain Products
Exposure Factors Handbook Page September 2011 12-11
The moisture data presented in Table 12-35 are for selected grain products taken from USDA (2007)
125 REFERENCES FOR CHAPTER 12 Devaney B Kalb L Briefel R Zavitsky-Novak T
Clusen N Ziegler P (2004) Feeding infants and toddlers study overview of the study design J Am Diet Assoc 104 s8-13 httpdxdoiorg101016jjada200310023
Fox MK Pac S Devaney B Jankowski L (2004) Feeding infants and toddlers study What foods are infants and toddlers eating J Am Diet Assoc 104 s22-s30 httpdxdoiorg101016jjada200310026
Fox MK Reidy K Karwe V Ziegler P (2006) Average portions of foods commonly eaten by infants and toddlers in the United States J Am Diet Assoc 106 S66-S76 httpdxdoiorg101016jjada200509042
Mennella JA Ziegler P Briefel R Novak T (2006) Feeding Infants and Toddlers Study the types of foods fed to Hispanic infants and toddlers J Am Diet Assoc 106 S96shy106 httpdxdoiorg101016jjada200509038
NCHS (National Center for Health Statistics) (1993) Joint policy on variance estimation and statistical reporting standards on NHANES III and CSFII reports HNISNCHS Analytic Working Group recommendations Riverdale MD Human Nutrition Information Service (HNIS)Analytic Working Group Agricultural Research Service Survey SystemsFood Consumption Laboratory
Ponza M Devaney B Ziegler P Reidy K Squatrito C (2004) Nutrient intakes and food choices of infants and toddlers participating in WIC J Am Diet Assoc 104 s71-s79 httpdxdoiorg101016jjada200310018
Smiciklas-Wright H Mitchell DC Mickle SJ Cook AJ Goldman JD (2002) Foods commonly eaten in the United States Quantities consumed per eating occasion and in a day 1994minus96 [pre-publication version] (NFS Report No 96-5) Beltsville MD US Department of Agriculture httpwwwarsusdagovsp2userfilesplace1 2355000pdfportionpdf
US EPA (US Environmental Protection Agency) (2000) Food commodity intake database [Database]
US EPA (US Environmental Protection Agency) (2003) CSFII analysis of food intake distributions (EPA600R-03029) Washington DC httpcfpubepagovnceacfmrecordisplayc fmdeid=56610
US EPA (US Environmental Protection Agency) (2005) Guidance on selecting age groups for monitoring and assessing childhood exposures to environmental contaminants (final) (EPA630P-03003F) Washington DC US Environmental Protection Agency Risk Assessment Forum httpwwwepagovrafpublicationsguidanc e-on-selecting-age-groupshtm
USDA (US Department of Agriculture) (1980) Food and nutrient intakes of individuals in 1 day in the United States Spring 1977 Nationwide Food Consumption Survey 1977ndash78 Preliminary report no 2 Washington DC httpwwwarsusdagovSP2UserFilesPlace 12355000pdf7778nfcs7778_prelim_2pdf
USDA (US Department of Agriculture) (1993) Food and nutrient intakes by i ndividuals in the United States 1 day 1987ndash88 Nationwide Food Consumption Survey 1987-88 Report no 87-I-1 (87-I-1) Washington DC httpwwwarsusdagovSP2UserFilesPlace 12355000pdf8788nfcs8788_rep_87-ishy1pdf
USDA (US Department of Agriculture) (1996a) Data tables Results from USDAs 1994 continuing survey of food intakes by individuals and 1994 diet and health knowledge survey Riverdale MD
USDA (US Department of Agriculture) (1996b) Data tables results from USDArsquos 1995 Continuing survey of food intakes by individuals and 1995 diet and health knowledge survey Riverdale MD
USDA (US Department of Agriculture) (1999a) Food and nutrient intakes by children 1994shy96 1998 table set 17 Beltsville MD httpwwwarsusdagovSP2UserFilesPlace 12355000pdfscs_allpdf
USDA (US Department of Agriculture) (1999b) Food consumption prices and expenditures (1970minus1997) Statistical Bulletin No 965 Washington DC Economic Research Service
USDA (US Department of Agriculture) (2000) 1994-1996 1998 continuing survey of food
Exposure Factors Handbook
Chapter 12mdashIntake of Grain Products intakes by individuals (CSFII) Beltsville MD Agricultural Research Service Beltsville Human Nutrition Research Center
USDA (US Department of Agriculture) (2007) USDA nutrient database for standard reference release 20 Riverdale MD httpwwwarsusdagovmainsite_mainhtm modecode=12-35-45-00
Vitolins MZ Quandt SA Bell RA Arcury TA Case LD (2002) Quality of diets consumed by older rural adults J Rural Health 18 49shy56
Page Exposure Factors Handbook 12-12 September 2011
Exposure F
actors Handbook
Chapter 12mdash
Intake of Grain Products
Table 12-3 Per Capita Intake of Total Grains Based 2003ndash2006 NHANES (gkg-day edible portion uncooked weight)
Population Group
Consuming Percentiles
N Mean SE 1st 5th 10th 25th 50th 75th 90th 95th 99th Max Whole Population 16783 100 26 004 02 06 08 13 20 32 51 67 99 348 Age Group
Birth to 1 year 865 76 31 020 00 00 00 01 23 50 75 95 125 349 1 to 2 years 1052 100 64 017 15 23 30 42 58 84 105 124 159 211 3 to 5 years 978 100 62 013 20 24 33 44 59 76 96 111 132 156 6 to 12 years 2256 100 44 009 06 14 18 28 41 55 74 82 111 145 13 to 19 years 3450 100 24 005 04 07 10 15 21 32 42 50 75 143 20 to 49 years 4289 100 22 004 03 06 08 12 19 28 39 46 71 150 Females 13 to 49 years 4103 100 19 004 02 05 08 11 17 25 34 39 55 98 50 years and older 3893 100 17 003 03 05 07 10 15 21 29 35 52 94
Race Mexican American 4450 99 30 005 01 08 10 16 24 39 58 72 106 178 Non-Hispanic Black 4265 100 24 004 02 05 07 11 18 29 50 68 102 211 Non-Hispanic White 6757 100 25 005 03 06 08 13 19 31 49 65 96 348 Other Hispanic 562 99 27 013 02 07 10 15 21 33 53 70 98 153 Other RacemdashIncluding Multiple Races 749 100 30 011 03 06 09 15 25 39 60 75 111 175
N = Sample size SE = Standard error Max = Maximum value Estimates are less statistically reliable based on guidance published in the Joint Policy on Variance Estimation and Statistical Reporting Standards on
NHANES III and CSFII Reports NHISNCHS Analytical Working Group Recommendations (NCHS 1993)
Source Based on US EPA analysis of 2003ndash2006 NHANES
Exposure F
actors Handbook
Page Septem
ber 2011 12-13
Exposure F
actors Handbook
Chapter 12mdash
Intake of Grain Products
Table 12-4 Consumer-Only Intake of Total Grains Based 2003ndash2006 NHANES (gkg-day edible portion uncooked weight)
Population Group N Mean SE Percentiles
1st 5th 10th 25th 50th 75th 90th 95th 99th Max
Whole Population 16556 26 004 03 06 08 13 20 32 51 67 99 Age Group
Birth to 1 year 644 41 018 01 04 08 18 35 59 81 103 139 1 to 2 years 1050 64 016 16 24 30 42 58 84 105 124 159 3 to 5 years 977 62 013 20 24 33 44 59 76 96 111 132 6 to 12 years 2256 44 009 06 14 18 28 41 55 74 82 111 13 to 19 years 3450 24 005 04 07 10 15 21 32 42 50 75 20 to 49 years 4288 22 004 03 06 08 12 19 28 39 46 71 Females 13 to 49 years 4102 19 003 02 05 08 11 17 25 34 39 55 50 years and older 3891 17 003 03 05 07 10 15 21 29 35 52
Race Mexican American 4341 30 005 04 08 11 16 24 39 59 72 106 Non-Hispanic Black 4236 24 004 02 05 07 11 18 29 50 69 103 Non-Hispanic White 6694 25 005 03 06 08 13 20 31 49 65 96 Other Hispanic 548 28 014 04 07 10 15 21 34 54 71 98 Other RacemdashIncluding Multiple Races 737 31 011 03 07 09 15 25 39 60 75 111
349
349 211 156 145 143 150 98 94
178 211 349 153 175
N = Sample size SE = Standard error Max = Maximum value Estimates are less statistically reliable based on guidance published in the Joint Policy on Variance Estimation and Statistical Reporting
Standards on NHANES III and CSFII Reports NHISNCHS Analytical Working Group Recommendations (NCHS 1993)
Source Based on US EPA analysis of 2003ndash2006 NHANES
Page E
xposure Factors H
andbook 12-14
September 2011
Table 12-5 Per Capita Intake of Individual Grain Products Based 2003ndash2006 NHANES (gkg-day edible portion uncooked weight)
Population Group N
Consuming Mean SE
Consuming Mean SE
Cereal Rice Whole Population
Age Group Birth to 1 year 1 to 2 years 3 to 5 years 6 to 12 years 13 to 19 years 20 to 49 years Females 13 to 49 years 50 years and older Race Mexican American Non-Hispanic Black Non-Hispanic White Other Hispanic Other RacemdashIncluding Multiple Races
16783
865 1052
978 2256 3450 4289 4103 3893
4450 4265 6757
562
749
100
81 100 100 100 100 100 100 100
100 100 100
99
100
37
51 87 86 63 39 32 29 22
43 36 36 39
41
004
030 018 017 010 008 004 004 004
007 006 005 020
012
88 69 87 91 89 85 89 86 89
87 86 88 92
90
02
11 06 05 03 02 03 02 01
03 03 02 06
08
001
008 006 006 003 001 001 001 001
002 002 001 005
008 N
SE
Source
= Sample size = Standard error
Based on US EPA analysis of 2003ndash2006 NHANES
Exposure Factors Handbook
Chapter 12mdashIntake of Grain Products
Exposure Factors Handbook Page September 2011 12-15
Table 12-6 Consumer-Only Intake of Individual Grain Products Based 2003ndash2006 NHANES (gkg-day edible portion uncooked weight)
Population Group N Mean SE N Mean SE
Cereal Rice Whole Population
Age Group Birth to 1 year 1 to 2 years 3 to 5 years 6 to 12 years 13 to 19 years 20 to 49 years Females 13 to 49 years 50 years and older Race Mexican American Non-Hispanic Black Non-Hispanic White Other Hispanic Other RacemdashIncluding Multiple Races
16613
696 1051 978 2256 3450 4289 4103 3893
4372 4244 6707 550 740
37
63 87 86 63 39 32 29 22
43 36 36 39 41
004
031 018 017 010 008 004 004 004
007 006 005 020 013
14447
552 928 875 2000 2898 3812 3511 3382
3757 3645 5887 491 667
03
15 07 05 03 02 03 02 02
03 03 02 06 08
001
010 007 006 003 002 002 002 001
002 002 001 005 008
N SE
Source
= Sample size = Standard error
Based on US EPA analysis of 2003ndash2006 NHANES
Exposure Factors Handbook
Chapter 12mdashIntake of Grain Products
Page Exposure Factors Handbook 12-16 September 2011
Exposure Factors Handbook
Chapter 12mdashIntake of Grain Products
Table 12-7 Mean Grain Intake per Individual in a Day by Sex and Age (gday as-consumed)a for 1977minus1978 Group Age (years) Total Grains Breads Rolls
Biscuits Other Baked
Goods Cereals Pasta Mixtures Mainly Grainb
Males and Females lt1 1 to 2 3 to 5 6 to 8
42 158 181 206
4 27 46 53
5 24 37 56
30 44 54 60
3 63 45 38
Males 9 to 11 12 to 14 15 to 18 19 to 22 23 to 34 35 to 50 51 to 64 65 to 74 ge75
238 288 303 253 256 234 229 235 196
67 76 91 84 82 82 78 71 70
56 80 77 53 60 58 57 60 50
51 57 53 64 40 44 48 69 58
64 74 82 52 74 50 46 35 19
Females 9 to 11 12 to 14 15 to 18 19 to 22 23 to 34 35 to 50 51 to 64 65 to 74 ge75
214 235 196 161 163 161 155 175 178
58 57 57 44 49 49 52 57 54
59 61 43 36 38 37 40 42 44
44 45 41 33 32 32 36 47 58
53 72 55 48 44 43 27 29 22
Males and FemalesmdashAll Ages 204 62 49 44 49 a Based on USDA Nationwide Food Consumption Survey 1977ndash1978 data for 1 day b Includes mixtures containing grain as the main ingredient
Source USDA (1980)
Exposure Factors Handbook Page September 2011 12-17
Exposure Factors Handbook
Chapter 12mdashIntake of Grain Products
Page Exposure Factors Handbook 12-18 September 2011
Table 12-8 Mean Grain Intakes per Individual in a Day by Sex and Age (gday as-consumed)a for 1987minus1988
Group Age (years) Total Grains Yeast Breads and
Rolls
Quick Breads Pancakes
French Toast
Cakes Cookies Pastries
Pies
Crackers Popcorn
Pretzels Corn Chips
Cereals and Pastas
Mixtures Mostly Grainb
Males and Females le5 167 30 8 22 4 52 51
Males 6 to 11 268 51 16 37 8 74 83
12 to 19 304 65 28 45 10 72 82 ge20 272 65 20 37 8 58 83
Females 6 to 11 231 43 19 30 6 66 68
12 to 19 239 45 13 29 7 52 91 ge20 208 45 14 28 6 53 62
All Individuals 237 52 16 32 7 57 72 a Based on USDA Nationwide Food Consumption Survey 1987ndash1988 data for 1 day b Includes mixtures containing grain as the main ingredient
Source USDA (1993)
Table 12-9 Mean Grain Intakes per Individual in a Day by Sex and Age (gday as-consumed)a for 1994minus1995
Group Age (years)
Total Grains Yeast Breads and Rolls
Quick Breads Pancakes
French Toast
Cakes Cookies
Pastries Pies
Crackers Popcorn
Pretzels Corn Chips
Cereals and Pastas
Mixtures Mostly Grainb
1994 1995 1994 1995 1994 1995 1994 1995 1994 1995 1994 1995 1994 1995 Males and Females le5 213 210 26 28 11 11 22 23 8 7 58 57 89 84
Males 6 to 11 12 to 19 ge20
285 417 357
341 364 365
51 53 64
45 54 61
15 30 22
21 21 24
42 54 43
46 43 46
12 17 13
18 22 15
66 82 86
97 84 91
101 180 128
115 138 128
Females 6 to 11 12 to 19 ge20
260 317 254
286 296 257
43 40 44
46 37 45
16 16 16
21 14 15
37 39 33
51 35 34
11 17 9
14 16 10
57 63 59
54 52 69
94 142 92
100 143 83
All Individuals 300 303 50 49 18 19 38 39 12 13 70 76 112 107 a Based on USDA CSFII 1994 and 1995 data for 1 day b Includes mixtures containing grain as the main ingredient
Source USDA (1996a b)
Exposure Factors Handbook
Chapter 12mdashIntake of Grain Products
Table 12-10 Per Capita Consumption of Flour and Cereal Products in 1997
Food Item Per Capita Consumption
(gday)a
Total Wheat Flourb
Rye Flour Ricec
Total Corn Productsd
Oat Productse
Barley Productsf
Total Flour and Cereal Productsg
186 07 24 29 8
09 249
a Original data were presented in lbsyear data were converted to gday by multiplying by a factor of 454 glb and dividing by 365 dayyear Consumption of most items at the processing level Excludes quantities used in alcoholic beverages and fuel
b Includes white whole wheat and durum flour c Milled basis d Includes corn flour and meal hominy and grits and corn starch e Includes rolled oats ready-to-eat oat cereals oat flour and oat bran f Includes barley flour pearl barley and malt and malt extract used in food processing g Excludes wheat not ground into flour
Source USDA (1999b)
Exposure Factors Handbook Page September 2011 12-19
Table 12-11 Mean Quantities of Grain Products Consumed by Children Under 20 Years of Age by Sex and Age per Capita (gday as-consumed)a
Yeast Cereals and Pasta Cakes Crackers Quick Breads Mixtures Age Group Sample Breads Cookies Popcorn Totalb Ready-to- Pancakes Mainly (years) Size and Total Rice Pasta Pastries Pretzels Eat Cereals French Toast Grainc Rolls Pies Corn Chips
Males and Females lt1 1126 56 2 29 1 2 1d 1 3 1 20 1 1016 192 16 57 11 9 9 9 16 7 87 2 1102 219 26 62 16 15 12 12 22 9 87 1 to 2 2118 206 21 59 13 12 11 11 19 8 87 3 1831 242 30 64 19 13 12 16 23 11 98 4 1859 264 36 67 22 15 11 17 30 13 102 5 884 284 41 76 24 17 11 15 33 13 107 3 to 5 4574 264 36 69 22 15 11 16 29 12 102 le5 7818 219 27 61 16 13 10 12 22 9 87
Males 6 to 9 787 310 45 77 28 18 15 23 39 16 109 6 to 11 1031 318 46 80 31 16 18 23 40 15 115 12 to 19 737 406 54 82 29 27 17 26 49 19 175
Females 6 to 9 704 284 43 61 21 12 15 18 42 13 107 6 to 11 969 280 43 62 20 14 15 19 42 14 101 12 to 19 732 306 40 67 17 19 22 15 37 15 132
Males and Females le9 9309 250 34 64 20 14 12 16 30 12 96 le19 11287 298 40 69 22 17 15 18 36 14 120 a Based on data from 1994ndash1996 1998 CSFII b Includes yeast breads rolls cereals pastas quick breads pancakes French toast cakes cookies pastries pies crackers popcorn pretzels corn
chips and mixtures having a grain product as a main ingredient Excludes grain products that were ingredients in food mixtures coded as a single item and tabulated under another food group for example noodles in tuna-noodle casserole are tabulated under Meat Poultry and Fish
c Includes mixtures having a grain product as a main ingredient such as burritos tacos pizza egg rolls quiche spaghetti with sauce rice and pasta mixtures frozen meals in which the main course is a grain mixture noodle and rice soups and baby-food macaroni and spaghetti mixtures
d Estimate is not statistically reliable due to small sample size reporting intake Note Consumption amounts shown are representative of the first day of each participantrsquos survey response
Source USDA (1999a)
Exposure F
actors Handbook
Chapter 12mdash
Intake of Grain Products
Page E
xposure Factors H
andbook 12-20
September 2011
Exposure F
actors Handbook
Chapter 12mdash
Intake of Grain Products
Table 12-12 Percentage of Individuals Under 20 Years of Age Consuming Grain Products by Sex and Age ()a
Age Group (years) Sample Size Totalb
Yeast Breads
and Rolls
Cereals and Pasta Quick Breads
Pancakes French Toast
Cakes Cookies Pastries
Pies
Crackers Popcorn Pretzels
Corn Chips
Mixtures Mainly GraincTotal
Ready-to-Eat
Cereals Rice Pasta
Males and Females lt1 1126 706 109 628 91 34 21 44 165 103 150 1 1016 982d 484 706 453 113 94 230 470 390 478 2 1102 990d 587 711 519 144 94 275 466 379 453 1 to 2 2118 987 537 709 487 129 94 253 468 384 465 3 1831 994d 641 697 533 111 86 288 461 385 490 4 1859 995d 670 691 548 114 71 286 523 394 462 5 884 999d 692 704 549 114 68 252 524 321 474 3 to 5 4574 996d 668 697 543 113 75 275 503 367 475 le5 7818 958 555 693 469 109 75 240 450 341 433
Males 6 to 9 787 989d 698 626 508 105 74 281 525 360 445 6 to 11 1031 990d 691 640 524 97 81 271 523 338 453 12 to 19 737 982d 627 446 332 100 59 244 413 272 462
Females 6 to 9 704 997d 715 612 476 90 79 263 571 383 480 6 to 11 969 993d 710 593 456 94 71 271 550 371 457 12 to 19 732 976d 609 459 303 86 93 198 406 309 461
Males and Females le9 9309 972 616 664 479 105 76 253 489 353 444 le19 11287 976 624 576 417 99 76 242 461 325 451 a Based on data from 1994ndash1996 1998 CSFII b Includes yeast breads rolls cereals pastas quick breads pancakes French toast cakes cookies pastries pies crackers popcorn
pretzels corn chips and mixtures having a grain product as a main ingredient Excludes grain products that were ingredients in food mixtures coded as a single item and tabulated under another food group for example noodles in tuna-noodle casserole are tabulated under Meat Poultry and Fish
c Includes mixtures having a grain product as a main ingredient such as burritos tacos pizza egg rolls quiche spaghetti with sauce rice and pasta mixtures frozen meals in which the main course is a grain mixture noodle and rice soups and baby-food macaroni and spaghetti mixtures
d Estimate is not statistically reliable due to small sample size reporting intake Note Percentages shown are representative of the first day of each participantrsquos survey response
Source USDA (1999a)
Exposure F
actors Handbook
Page Septem
ber 2011 12-21
Page E
xposure Factors H
andbook 12-22
September 2011
Exposure F
actors Handbook
Chapter 12mdash
Intake of Grain Products
Table 12-13 Per Capita Intake of Total Grains Based on 1994ndash1996 1998 CSFII (gkg-day edible portion uncooked weight) Population Group N Percent
Consuming Mean SE Percentiles 1st 5th 10th 25th 50th 75th 90th 95th 99th Max
Whole Population Age group Birth to 1 year 1 to 2 years 3 to 5 years 6 to 12 years 13 to 19 years 20 to 49 years ge50 years Season Fall Spring Summer Winter Race Asian Pacific Islander Black American Indian Alaskan Native OtherNA White Region Midwest Northeast South West Urbanization Central City Suburban Non-metropolitan
20607
1486 2096 4391 2089 1222 4677 4646
4687 5308 5890 4722
557 2740
177 1638 15495
4822 3692 7208 4885
6164 9598 4845
995
705 998 1000 1000 1000
999 1000
995 996 995 995
985 994 997 988 996
997 996 995 994
995 995 996
27
25 64 63 43 25 22 17
26 27 26 27
36 26 29 31 26
27 28 25 28
27 27 24
00
01 01 01 01 01 00 00
00 00 00 00
02 01 02 01 00
00 00 00 01
00 00 01
02
00 11 18 09 04 03 03
02 02 03 02
00 01 03 00 03
03 03 02 02
01 03 03
06
00 21 26 17 08 06 06
06 06 07 06
11 05 05 07 07
07 07 06 07
06 07 06
09
00 28 32 20 11 08 07
09 08 09 09
15 07 08 09 09
09 10 08 09
09 09 08
13
00 42 43 28 15 13 11
13 13 13 14
23 11 13 15 13
14 14 12 14
13 14 12
21
16 59 59 40 23 19 15
21 21 21 21
32 19 22 24 20
21 22 19 22
21 21 19
33
38 79 78 54 31 28 21
33 34 33 33
47 33 42 41 32
34 35 30 35
35 34 29
52
62 104 99 70 44 39 28
50 55 51 52
62 54 63 61 50
53 53 50 54
54 53 48
68
86 121
115 82 51 47 35
66 70 68 68
73 73 75 77 66
70 68 66 70
70 69 63
103
127 168 156
111 79 71 49
100 105 105 101
112 115
120 117
98
104 110
97 103
107 100 104
316
263 316 270 172 124 161
112
263 294 282 316
246 294 168 270 316
238 316 282 208
294 316 238
N SE
Source
= Sample size = Standard error
US EPA analysis of 1994ndash1996 1998 CSFII
Exposure F
actors Handbook
Page Septem
ber 2011 12-23
Exposure F
actors Handbook
Chapter 12mdash
Intake of Grain Products
Table 12-14 Consumer-Only Intake of Total Grains Based on 1994ndash1996 1998 CSFII (gkg-day edible portion uncooked weight) Population Group N Mean SE Percentiles
1st 5th 10th 25th 50th 75th 90th 95th 99th Max Whole Population Age Group Birth to 1 year 1 to 2 years 3 to 5 years 6 to 12 years 13 to 19 years 20 to 49 years ge50 years Season Fall Spring Summer Winter Race Asian Pacific Islander Black American Indian Alaskan Native OtherNA White Region Midwest Northeast South West Urbanization Central City Suburban Non-metropolitan
20157
1048 2092 4389 2089 1222 4673 4644
4587 5190 5751 4629
527 2675
175 1570 15210
4743 3628 7053 4733
6023 9378 4756
27
36 64 63 43 25 22 17
26 27 27 27
37 26 30 32 26
27 28 25 28
28 27 24
00
01 01 01 01 01 00 00
00 00 00 00
02 01 02 01 00
00 00 00 01
00 00 01
03
01 12 18 09 04 03 03
03 03 04 03
08 02 03 05 04
04 04 03 04
03 04 03
07
03 21 26 17 08 06 06
07 07 07 07
12 05 05 07 07
07 08 06 07
07 07 06
09
06 28 32 20 11 08 07
09 09 09 09
16 07 08 10 09
09 10 08 09
09 09 08
13
14 42 43 28 15 13 11
13 13 14 14
23 11 13 15 13
14 14 12 14
13 14 12
21
28 59 59 40 23 19 15
21 21 21 21
32 19 22 24 20
21 22 19 22
21 21 19
33
48 79 78 54 31 28 21
33 34 33 33
47 33 42 41 32
34 35 30 35
35 34 29
52
74 104 99 70 44 39 28
50 55 52 52
62 54 63 62 51
53 53 50 54
54 53 48
68
92 121
115 82 51 47 35
66 70 68 68
73 73 75 77 66
70 68 66 70
70 69 64
103
134 168 156
111 79 71 49
100 106 105 101
112 115
120 117
98
104 110
98 103
107 100 104
316
263 316 270 172 124 161
112
263 294 282 316
246 294 168 270 316
238 316 282 208
294 316 238
N SE
Source
= Sample size = Standard error
US EPA analysis of 1994ndash1996 1998 CSFII
Table 12-15 Per Capita Intake of Individual Grain Products Based on 1994ndash1996 1998 CSFII (gkg-day edible portion uncooked weight)
Cereal Rice Population Group
N Percent Consuming Mean SE
Percent Consuming Mean SE
Whole Population Age Group
Birth to 1 year 1 to 2 years 3 to 5 years 6 to 12 years
13 to 19 years 20 to 49 years ge50 years Season Fall Spring Summer Winter Race Asian Pacific Islander Black American Indian Alaskan Native OtherNA White Region Midwest Northeast South West Urbanization Central City Suburban
Non-metropolitan
20607
1486 2096 4391 2089 1222 4677 4646
4687 5308 5890 4722
557 2740
177 1638 15495
4822 3692 7208 4885
6164 9598 4845
996
746 998 1000 1000 1000
999 1000
996 996 995 996
985 995 997 989 997
997 997 996 994
996 995 997
37
40 84 87 62 41 31 22
37 38 38 37
44 38 42 43 37
39 37 36 38
38 38 35
003
014 008 007 006 006 004 002
006 007 006 005
020 012 015 012 004
009 006 004 009
006 005 006
865
602 864 879 880 858 883 845
851 871 869 871
966 863 926 859 862
882 872 850 867
872 866 856
03
07 06 05 04 03 03 02
03 03 03 03
17 03 03 06 02
02 03 02 04
04 03 02
001
004 003 003 002 002 001 001
002 002 002 002
019 002 010 008 001
002 003 001 003
002 002 001
N SE
Source
= Sample size = Standard error
US EPA analysis of 1994ndash1996 1998 CSFII
Exposure Factors Handbook
Chapter 12mdashIntake of Grain Products
Page Exposure Factors Handbook 12-24 September 2011
Exposure Factors Handbook
Chapter 12mdashIntake of Grain Products
Table 12-16 Consumer-Only Intake of Individual Grain Products Based on 1994ndash1996 1998 CSFII (gkg-day edible portion uncooked weight )
Population Group N Cereal
Mean SE N Rice
Mean SE Whole Population 20227 38 003 17481 03 001 Age Group
Birth to 1 year 1116 54 016 900 12 007 1 to 2 years 2092 84 008 1819 07 004 3 to 5 years 4389 87 007 3869 06 003 6 to 12 years 2089 62 006 1847 04 002 13 to 19 years 1222 41 006 1038 03 003 20 to 49 years 4674 31 004 4102 03 001 ge50 years 4645 22 002 3906 02 001
Season Fall 4598 37 006 3957 03 002 Spring 5213 38 007 4530 03 002 Summer 5768 38 006 4989 03 002 Winter 4648 37 006 4005 03 002
Race Asian Pacific Islander 529 45 020 513 18 019 Black 2683 38 012 2346 04 002 American Indian Alaskan Native 175 43 015 151 03 010 OtherNA 1579 44 013 1375 07 008 White 15261 37 004 13096 02 001
Region Midwest 4759 39 009 4186 02 002 Northeast 3639 37 006 3152 04 004 South 7081 36 004 6029 03 001 West 4748 39 009 4114 05 003
Urbanization Central City 6039 38 006 5303 05 003 Suburban 9410 38 005 8105 03 002 Non-metropolitan 4778 36 006 4073 02 002
N = Sample size SE = Standard error
Source US EPA analysis of 1994ndash1996 1998 CSFII
Exposure Factors Handbook Page September 2011 12-25
Table 12-17 Per Capita Intake of Breads a Based on 1994ndash1996 1998 CSFII (gkg-day as-consumed)
Population Group Percent Consuming Mean
Percentile SE 1st 5th 10th 25th 50th 75th 90th 95th 99th Max
Whole Population Age Group lt5 months 6 to 12 months lt1 year 1 to 2 years 3 to 5 years 6 to 11 years 12 to 19 years 20 to 39 years 40 to 69 years ge70 years Season Fall Spring Summer Winter Race Asian Black American IndianAlaska Native OtherNA White Region Midwest Northeast South West Urbanization Central City Suburban Non-metropolitan
872
09 302 146 772 865 871 862 881 900 916
874 871 873 869
691 831 822 804 890
891 883 875 837
856 877 885
11
00 05 03 20 23 17 11 09 09 09
11 11 11 11
08 11 14 12 11
12 11 11 11
11 11 11
001
008 016 011 006 005 004 003 002 001 002
002 002 002 002
006 003 018 004 001
002 002 002 002
002 001 002
00
00 00 00 00 00 00 00 00 00 00
00 00 00 00
00 00 00 00 00
00 00 00 00
00 00 00
00
00 00 00 00 00 00 00 00 00 00
00 00 00 00
00 00 00 00 00
00 00 00 00
00 00 00
00
00 00 00 00 00 00 00 00 00 02
00 00 00 00
00 00 00 00 00
00 00 00 00
00 00 00
04
00 00 00 04 09 07 04 04 04 04
04 04 04 04
00 03 03 03 04
04 04 04 03
04 04 04
09
00 00 00 14 20 14 09 08 08 08
09 09 09 08
04 07 09 09 09
09 09 09 08
08 09 09
15
00 05 00 29 33 24 15 13 13 13
15 15 15 14
12 14 17 16 15
15 15 15 14
14 15 15
23
00 18 08 44 47 35 23 20 19 19
24 23 24 23
19 23 36 27 23
25 23 23 24
23 24 23
31
00 30 17 60 58 43 28 25 23 23
31 31 31 31
29 33 41 34 30
33 29 31 32
31 31 31
51
00 48 46 85 87 67 40 39 35 29
49 51 52 51
45 63 62 56 49
57 45 49 51
51 50 50
200
18 73 73 200 132
113 75 62 84 43
146 116
171 200
146 116
200 75 171
120 98 171 200
132 146 200
a SE
Source
Includes breads rolls muffins bagels biscuits cornbread and tortillas = Standard error
US EPA analysis of the 1994ndash1996 CSFII
Exposure F
actors Handbook
Chapter 12mdash
Intake of Grain Products
Page E
xposure Factors H
andbook 12-26
September 2011
Table 12-18 Per Capita Intake of Sweets a Based on 1994ndash1996 1998 CSFII (gkg-day as-consumed)
Population Group Percent Consuming
Percentile Mean SE 1st 5th 10th 25th 50th 75th 90th 95th 99th Max
Whole Population Age Group lt5 months 6 to 12 months lt1 year 1 to 2 years 3 to 5 years 6 to 11 years 12 to 19 years 20 to 39 years 40 to 69 years ge70 years Season Fall Spring Summer Winter Race Asian Black American IndianAlaska Native OtherNA White Region Midwest Northeast South West Urbanization Central City Suburban Non-metropolitan
526
25 230 121 532 621 642 543 472 529 586
537 522 500 545
402 414 353 350 563
601 554 491 477
512 546 505
06
00 03 02 12 13 12 06 04 05 05
06 06 05 06
04 05 04 04 06
07 06 06 05
06 06 06
001
004 014 010 007 006 006 003 002 002 003
003 002 002 003
008 004 011 005 001
003 003 002 002
002 002 003
00
00 00 00 00 00 00 00 00 00 00
00 00 00 00
00 00 00 00 00
00 00 00 00
00 00 00
00
00 00 00 00 00 00 00 00 00 00
00 00 00 00
00 00 00 00 00
00 00 00 00
00 00 00
00
00 00 00 00 00 00 00 00 00 00
00 00 00 00
00 00 00 00 00
00 00 00 00
00 00 00
00
00 00 00 00 00 00 00 00 00 00
00 00 00 00
00 00 00 00 00
00 00 00 00
00 00 00
01
00 00 00 03 08 06 02 00 01 02
02 01 00 02
00 00 00 00 02
03 02 00 00
01 02 01
08
00 00 00 17 19 17 10 06 07 08
09 08 07 09
06 06 03 05 09
10 09 08 07
08 09 08
18
00 11 04 35 36 32 18 14 13 16
18 18 16 19
14 15 17 13 18
20 17 17 16
16 18 18
25
00 20 10 48 46 39 24 19 19 21
25 26 23 26
20 23 21 19 25
29 25 23 23
23 26 25
46
04 36 36 72 88 67 37 32 32 36
47 47 41 48
31 47 28 41 47
53 48 44 38
46 45 51
220
06 64 64 193 220 209 107
111 73 57
209 220 182 123
157 193
29 70 220
220 127 209 157
209 127 220
a SE
Source
Includes breakfast foods made with grains such as pancakes waffles and French toast = Standard error
US EPA analysis of the 1994ndash1996 CSFII
Exposure F
actors Handbook
Chapter 12mdash
Intake of Grain Products
Exposure F
actors Handbook
Page Septem
ber 2011 12-27
Table 12-19 Per Capita Intake of Snacks Containing Grains a Based on 1994ndash1996 1998 CSFII (gkg-day as-consumed)
Population Group Percent Consuming
Percentile Mean SE 1st 5th 10th 25th 50th 75th 90th 95th 99th Max
Whole Population Age Group lt5 months 6 to 12 months lt1 year 1 to 2 years 3 to 5 years 6 to 11 years 12 to 19 years 20 to 39 years 40 to 69 years ge70 years Season Fall Spring Summer Winter Race Asian Black American IndianAlaska Native OtherNA White Region Midwest Northeast South West Urbanization Central City Suburban Non-metropolitan
431
10 290 141 581 567 513 450 411 411 377
423 436 406 458
241 295 383 284 471
492 419 411 407
401 446 441
02
00 03 01 07 07 05 03 02 01 01
02 03 02 03
01 02 02 02 03
03 02 02 02
02 03 02
001
011 008 006 004 004 003 002 001 001 001
001 001 001 002
004 002 008 003 001
001 002 001 002
001 001 001
00
00 00 00 00 00 00 00 00 00 00
00 00 00 00
00 00 00 00 00
00 00 00 00
00 00 00
00
00 00 00 00 00 00 00 00 00 00
00 00 00 00
00 00 00 00 00
00 00 00 00
00 00 00
00
00 00 00 00 00 00 00 00 00 00
00 00 00 00
00 00 00 00 00
00 00 00 00
00 00 00
00
00 00 00 00 00 00 00 00 00 00
00 00 00 00
00 00 00 00 00
00 00 00 00
00 00 00
00
00 00 00 04 03 01 00 00 00 00
00 00 00 00
00 00 00 00 00
00 00 00 00
00 00 00
03
00 02 00 11 09 06 04 02 02 01
03 03 02 03
00 01 02 01 03
03 02 02 02
02 03 03
07
00 09 06 20 18 13 09 06 05 03
07 08 07 08
04 05 06 05 08
08 07 07 07
07 07 07
12
00 22 09 28 32 19 14 09 07 05
10 13 10 13
10 09 11 08 12
12 12 11 12
11 12 11
26
01 25 22 50 59 46 24 18 14 08
23 29 23 29
23 21 32 24 27
27 27 24 26
26 27 23
91
37 28 37 89 91 73 51 55 56 18
80 89 71 91
44 74 49 87 91
89 91 80 87
78 91 81
a SE
Source
Includes grain snacks such as crackers salty snacks popcorn and pretzels = Standard error
US EPA analysis of the 1994ndash1996 CSFII
Exposure F
actors Handbook
Chapter 12mdash
Intake of Grain Products
Page E
xposure Factors H
andbook 12-28
September 2011
Table 12-20 Per Capita Intake of Breakfast Foods a Based on 1994ndash1996 1998 CSFII (gkg-day as-consumed)
Population Group Percent Consuming
Percentile Mean SE 1st 5th 10th 25th 50th 75th 90th 95th 99th
Max
Whole Population Age Group lt5 months 6 to 12 months lt1 year 1 to 2 years 3 to 5 years 6 to 11 years 12 to 19 years 20 to 39 years 40 to 69 years ge70 years Season Fall Spring Summer Winter Race Asian Black American IndianAlaska Native OtherNA White Region Midwest Northeast South West Urbanization Central City Suburban Non-metropolitan
118
00 42 20 204 208 237 130
89 95 104
116 116
128 113
59 127
88 102 120
121 127 107 124
120 122 107
01
00 01 01 04 04 04 01 01 01 01
01 01 01 01
01 01 01 01 01
01 01 01 02
01 01 01
001
000 024 016 007 006 005 003 002 001 002
002 002 002 002
007 003 008 005 001
002 003 002 002
002 002 002
00
00 00 00 00 00 00 00 00 00 00
00 00 00 00
00 00 00 00 00
00 00 00 00
00 00 00
00
00 00 00 00 00 00 00 00 00 00
00 00 00 00
00 00 00 00 00
00 00 00 00
00 00 00
00
00 00 00 00 00 00 00 00 00 00
00 00 00 00
00 00 00 00 00
00 00 00 00
00 00 00
00
00 00 00 00 00 00 00 00 00 00
00 00 00 00
00 00 00 00 00
00 00 00 00
00 00 00
00
00 00 00 00 00 00 00 00 00 00
00 00 00 00
00 00 00 00 00
00 00 00 00
00 00 00
00
00 00 00 00 00 00 00 00 00 00
00 00 00 00
00 00 00 00 00
00 00 00 00
00 00 00
04
00 00 00 19 16 15 05 00 00 01
04 04 05 03
00 04 00 00 04
04 05 02 05
04 05 03
10
00 00 00 27 25 22 09 06 06 07
10 10 10 09
06 12 03 09 10
11 12 08 10
10 10 09
24
00 41 27 48 45 34 23 15 14 12
23 23 24 26
20 21 12 26 24
26 23 22 26
25 24 22
136
00 41 41 136
80 65 39 30 38 35
136
64 60 80
28 67 12 80 136
67 80 78 136
136
78 64
a SE
Source
Includes breakfast food made with grains such as pancakes waffles and French toast = Standard error
US EPA analysis of the 1994ndash1996 CSFII
Exposure F
actors Handbook
Chapter 12mdash
Intake of Grain Products
Exposure F
actors Handbook
Page Septem
ber 2011 12-29
Table 12-21 Per Capita Intake of Pasta Based on 1994ndash1996 1998 CSFII (gkg-day as-consumed) Population Group
Percent
Consuming Percentile
Mean SE 1st 5th 10th 25th 50th 75th 90th 95th 99th Max Whole Population
Age Group lt5 months 6 to 12 months lt1 year 1 to 2 years 3 to 5 years 6 to 11 years 12 to 19 years 20 to 39 years 40 to 69 years ge70 years Season Fall Spring Summer Winter Race Asian Black American IndianAlaska Native OtherNA White Region Midwest Northeast South West Urbanization Central City Suburban Non-metropolitan
130
00 75 35 160 128 134
117 139 137 90
136 132 126 126
194 70 18 96 141
121 201 95 132
134 140 103
03
00 01 01 08 06 05 03 03 02 02
03 03 03 03
05 02 01 02 03
03 05 02 03
03 03 02
002
000 022 015 015 013 012 009 004 003 006
005 005 005 006
017 010 023 009 003
005 005 005 005
005 003 005
00
00 00 00 00 00 00 00 00 00 00
00 00 00 00
00 00 00 00 00
00 00 00 00
00 00 00
00
00 00 00 00 00 00 00 00 00 00
00 00 00 00
00 00 00 00 00
00 00 00 00
00 00 00
00
00 00 00 00 00 00 00 00 00 00
00 00 00 00
00 00 00 00 00
00 00 00 00
00 00 00
00
00 00 00 00 00 00 00 00 00 00
00 00 00 00
00 00 00 00 00
00 00 00 00
00 00 00
00
00 00 00 00 00 00 00 00 00 00
00 00 00 00
00 00 00 00 00
00 00 00 00
00 00 00
00
00 00 00 00 00 00 00 00 00 00
00 00 00 00
00 00 00 00 00
00 00 00 00
00 00 00
10
00 00 00 34 21 20 08 11 10 00
12 11 09 08
20 00 00 00 11
08 19 00 09
12 12 01
22
00 10 00 62 44 38 21 22 19 13
24 23 21 21
33 17 00 20 23
21 28 18 22
25 22 15
51
00 33 23 106
84 75 42 41 36 29
47 58 52 51
66 36 24 35 53
52 59 44 57
53 53 42
291
00 67 67 167 143
119 291
112 118
77
167 147 154 291
112 291
36 154 167
167 154 291 141
291 167 141
SE
Source
= Standard error
US EPA analysis of the 1994ndash1996 CSFII
Exposure F
actors Handbook
Chapter 12mdash
Intake of Grain Products
Page E
xposure Factors H
andbook 12-30
September 2011
Table 12-22 Per Capita Intake of Cooked Cereals Based on 1994ndash1996 1998 CSFII (gkg-day as-consumed)
Population Group Percent Consuming
Percentile Mean SE 1st 5th 10th 25th 50th 75th 90th 95th 99th Max
Whole Population Age Group lt5 months 6 to 12 months lt1 year 1 to 2 years 3 to 5 years 6 to 11 years 12 to 19 years 20 to 39 years 40 to 69 years ge70 years Season Fall Spring Summer Winter Race Asian Black American IndianAlaska Native OtherNA White Region Midwest Northeast South West Urbanization Central City Suburban Non-metropolitan
104
09 166
83 184 160
87 56 62
116 245
120
91 93
111
44 201
76 76 93
96 90 124
94
116 99 97
04
01 19 09 16 13 05 02 01 03 06
04 03 03 04
02 07 03 04 03
03 03 04 04
04 03 03
004
054 118 082 029 028 017 009 005 003 007
008 006 008 008
020 010 032 030 004
007 010 006 009
008 005 007
00
00 00 00 00 00 00 00 00 00 00
00 00 00 00
00 00 00 00 00
00 00 00 00
00 00 00
00
00 00 00 00 00 00 00 00 00 00
00 00 00 00
00 00 00 00 00
00 00 00 00
00 00 00
00
00 00 00 00 00 00 00 00 00 00
00 00 00 00
00 00 00 00 00
00 00 00 00
00 00 00
00
00 00 00 00 00 00 00 00 00 00
00 00 00 00
00 00 00 00 00
00 00 00 00
00 00 00
00
00 00 00 00 00 00 00 00 00 00
00 00 00 00
00 00 00 00 00
00 00 00 00
00 00 00
00
00 00 00 00 00 00 00 00 00 00
00 00 00 00
00 00 00 00 00
00 00 00 00
00 00 00
06
00 94 00 69 53 00 00 00 09 22
11 00 00 09
00 22 00 00 00
00 00 11 00
09 00 00
23
00 161
57 107
79 40 10 11 19 34
26 20 21 25
00 44 21 20 20
21 22 26 23
26 21 23
72
00 228 228 206 161
94 43 33 44 56
81 64 69 74
53 109
58 106
61
57 59 79 80
81 69 57
725
56 228 228 339 725 241 106
92 87 106
459 209 725 445
161 339 123 725 459
459 725 317 395
725 459 269
SE
Source
= Standard error
US EPA analysis of the 1994ndash1996 CSFII
Exposure F
actors Handbook
Chapter 12mdash
Intake of Grain Products
Exposure F
actors Handbook
Page Septem
ber 2011 12-31
Table 12-23 Per Capita Intake of Ready-to-Eat Cereals a Based on 1994ndash1996 1998 CSFII (gkg-day as-consumed)
Population Group Percent Consuming
Percentile Mean SE 1st 5th 10th 25th 50th 75th 90th 95th 99th Max
Whole Population Age
lt5 months 6 to 12 months lt1 year 1 to 2 years 3 to 5 years 6 to 11 years 12 to 19 years 20 to 39 years 40 to 69 years ge70 years Season Fall Spring Summer Winter Race Asian Black American IndianAlaska Native OtherNA White Region Midwest Northeast South West Urbanization Central City Suburban Non-metropolitan
397
00 199
93 649 698 640 457 305 318 479
391 401 396 399
254 340 331 333 417
422 423 374 384
400 412 358
03
00 01 01 10 11 08 04 02 02 02
03 03 03 03
02 03 03 03 03
04 04 03 03
03 04 03
001
000 007 005 004 004 003 002 001 001 001
002 002 002 002
005 002 009 004 001
002 002 001 002
001 001 001
00
00 00 00 00 00 00 00 00 00 00
00 00 00 00
00 00 00 00 00
00 00 00 00
00 00 00
00
00 00 00 00 00 00 00 00 00 00
00 00 00 00
00 00 00 00 00
00 00 00 00
00 00 00
00
00 00 00 00 00 00 00 00 00 00
00 00 00 00
00 00 00 00 00
00 00 00 00
00 00 00
00
00 00 00 00 00 00 00 00 00 00
00 00 00 00
00 00 00 00 00
00 00 00 00
00 00 00
00
00 00 00 07 09 06 00 00 00 00
00 00 00 00
00 00 00 00 00
00 00 00 00
00 00 00
04
00 00 00 15 17 12 06 03 02 04
04 04 04 05
01 04 04 03 05
05 05 04 04
05 05 04
10
00 03 00 25 26 20 11 07 06 07
11 10 11 10
08 10 08 11 11
11 11 10 11
11 11 08
15
00 10 03 33 33 25 15 10 09 09
16 15 16 14
12 15 14 17 15
16 16 13 16
15 16 12
29
00 18 17 49 48 40 22 17 14 15
29 29 30 27
27 32 26 30 28
29 29 28 31
28 31 26
101
00 26 26 88 101
80 64 53 52 27
88 77 78 101
49 101
44 66 88
80 80 101
88
101 80 88
a SE
Source
Includes dry ready-to-eat corn rice wheat and bran cereals in the form of flakes puffs etc = Standard error
US EPA analysis of the 1994ndash1996 CSFII
Exposure F
actors Handbook
Chapter 12mdash
Intake of Grain Products
Page E
xposure Factors H
andbook 12-32
September 2011
Table 12-24 Per Capita Intake of Baby Cereals Based on 1994ndash1996 1998 CSFII (gkg-day as-consumed)
Population Group Percent Consuming
Percentile Mean SE 1st 5th 10th 25th 50th 75th 90th 95th 99th Max
Whole Population Age
lt5 months 6 to 12 months lt1 year 1 to 2 years 3 to 5 years 6 to 11 years 12 to 19 years 20 to 39 years 40 to 69 years ge70 years Season Fall Spring Summer Winter Race Asian Black American IndianAlaska Native OtherNA White Region Midwest Northeast South West Urbanization Central City Suburban Non-metropolitan
10
408 678 534
62 03 01 00 00 01 00
09 12 08 11
07 10 06 17 10
11 12 09 09
11 11 08
00
08 25 16 02 00 00 00 00 00 00
00 00 00 00
00 00 00 01 00
00 00 00 00
00 00 00
003
024 045 027 010 006 000 000 000 000 000
007 005 006 006
004 012 004 020 003
008 004 005 006
006 004 006
00
00 00 00 00 00 00 00 00 00 00
00 00 00 00
00 00 00 00 00
00 00 00 00
00 00 00
00
00 00 00 00 00 00 00 00 00 00
00 00 00 00
00 00 00 00 00
00 00 00 00
00 00 00
00
00 00 00 00 00 00 00 00 00 00
00 00 00 00
00 00 00 00 00
00 00 00 00
00 00 00
00
00 00 00 00 00 00 00 00 00 00
00 00 00 00
00 00 00 00 00
00 00 00 00
00 00 00
00
00 08 02 00 00 00 00 00 00 00
00 00 00 00
00 00 00 00 00
00 00 00 00
00 00 00
00
10 28 17 00 00 00 00 00 00 00
00 00 00 00
00 00 00 00 00
00 00 00 00
00 00 00
00
24 69 41 00 00 00 00 00 00 00
00 00 00 00
00 00 00 00 00
00 00 00 00
00 00 00
00
31 113
73 08 00 00 00 00 00 00
00 00 00 00
00 00 00 00 00
00 00 00 00
00 00 00
01
88 211 197
58 00 00 00 00 00 00
00 06 00 03
00 00 00 12 00
03 05 00 00
03 01 00
376
266 376 376 125
38 01 00 00 03 00
211 266 260 376
21 376
09 266 260
211 125 376 266
376 211 260
SE
Source
= Standard error
US EPA analysis of the 1994ndash1996 CSFII
Exposure F
actors Handbook
Chapter 12mdash
Intake of Grain Products
Exposure F
actors Handbook
Page Septem
ber 2011 12-33
Table 12-25 Quantity (as-consumed) of Grain Products Consumed per Eating Occasion and the Percentage of Individuals Using These Foods in 2 Days
Indiv Using Quantity Consumed per Consumers Only Food at Least Eating Occasion Quantity Consumed per Eating Occasion at Specified Percentiles
Food Category Once in 2 days (grams) (grams) Average SE 5th 10th 25th 50th 75th 90th 95th
White bread 596 50 1 21 24 33 46 52 78 104 Whole grain and wheat bread 281 50 1 24 25 37 50 56 72 92 Rolls 480 58 1 27 33 43 48 70 89 110 Biscuits 109 61 1 19 19 35 57 76 104 139 Tortillas 155 60 1 14 21 32 48 79 107 135 Quick breads and muffins 125 82 2 21 28 52 60 94 142 187 Doughnuts and sweet rolls 124 77 1 26 36 47 65 93 133 164 Crackers 174 26 1 6 9 12 18 30 47 62 Cookies 307 40 1 9 12 20 31 50 75 96 Cake 162 92 3 22 28 41 77 116 181 217 Pie 85 150 3 52 72 102 143 168 246 300 Pancakes and waffles 103 85 3 21 35 42 75 109 158 205 Cooked cereal 103 248 6 81 117 157 233 291 455 484 Oatmeal 61 264 6 116 117 176 232 333 454 473 Ready-to-eat cereal 406 54 1 18 24 30 46 67 93 113 Corn flakes 81 46 1 17 22 25 37 56 75 100 Toasted oat rings 68 42 1 14 16 27 38 54 65 83 Rice 280 150 3 27 40 76 131 192 312 334 Pasta 360 162 3 26 43 73 133 210 318 420 Macaroni and cheese 85 244 9 53 81 121 191 324 477 556 Spaghetti with tomato sauce 80 436 15 122 124 246 371 494 740 983 Pizza 199 169 5 36 52 78 140 214 338 422 SE = Standard error
Source Smiciklas-Wright et al (2002) (based on 1994ndash1996 CSFII data)
Exposure F
actors Handbook
Chapter 12mdash
Intake of Grain Products
Page E
xposure Factors H
andbook 12-34
September 2011
Table 12-26 Quantity (as-consumed) of Grain Products Consumed per Eating Occasion and Percentage of Individuals Using These Foods in 2 Days by Sex and Age
Food Category
Quantity Consumed per Eating Occasion (grams) 2 to 5 years 6 to 11 years 12 to 19 years
Males and Females (N = 2109)
Males and Females Males (N = 1432) (N = 696)
Females (N = 702)
PC Mean SE PC Mean SE PC Mean SE PC Mean SE White bread
Whole grain and wheat bread Rolls Biscuits
Tortillas Quick breads and muffins
Doughnuts and sweet rolls Crackers
Cookies Cake
Pie Pancakes and waffles Cooked cereal
Oatmeal Ready-to-eat cereal Corn flakes Toasted oat rings Rice
Pasta Macaroni and cheese Spaghetti with tomato sauce
Pizza Corn chips
Popcorn
669 243 400
83 146
96 113
254 510 146
29 191 168 104 729
112 206 296 494 178 168 237 196
116
34 37 39 38 32 55 59 17 28 70 76 49
211 221
33 33 30 84 90 159 242
86 29 20
a
1 1 2 2 4 2 1 1 3 8 1
10 9 1 2 1 3 3 8 11 3 2 1
671 205 535
97 164
96 134 172 467 197
56 215
90 57 673 131 125 246 414 132
115 328 256 127
42 44 48 48 47 67 69 26 37 79
116 77 245 256
47 42 45 124 130 217 322 108
33 31
1 1 1 3 2 5 2 2 2 4 8 3
14 19
1 2 2 6 5
13 18
6 2 2
613 145 619 122 229
110 173 106 290 151
66 135
52 24 456 104
73 242 334
75 101 396 269
78
56 60 69 72 76 125 102
39 53 99 188
96 310b
348b
72 62 62 203 203 408 583 205
58 54
1 2 2 4 5
12 12
5 3 9
15 6
29b
45b
3 4 5
10 9
46 46 13
5 5
579 176 488 103 201
110 138 142 318 155
48 82 60 23 463
87 81 288 378 107
85 305 251 105
47 53 51 55 56 79 78 26 42 85
138b
74 256b
321b
52 49 42 157 155 260 479 143
44 37
1 2 1 4 3
10 5 3 2 8
12b
5 31b
40b
2 4 3
10 9
30 51
8 3 4
Exposure F
actors Handbook
Chapter 12mdash
Intake of Grain Products
Exposure F
actors Handbook
Page Septem
ber 2011 12-35
Exposure F
actors Handbook
Chapter 12mdash
Intake of Grain Products
Page E
xposure Factors H
andbook 12-36
September 2011
Table 12-26 Quantity (as-consumed) of Grain Products Consumed per Eating Occasion and Percentage of Individuals Using These Foods in 2 Days by Sex and Age (continued)
Food Category
Quantity Consumed per Eating Occasion (g) 20 to lt40 years 40 to lt60 years gt60 years
Males Females (N = 1543) (N = 1449)
Males Females (N = 1663) (N = 1694)
Males Females (N = 1545) (N = 1429)
PC Mean SE PC Mean SE PC Mean SE PC Mean SE PC Mean SE PC Mean SE White bread
Whole grain and wheat bread Rolls Biscuits
Tortillas Quick breads and muffins
Doughnuts and sweet rolls Crackers
Cookies Cake
Pie Pancakes and waffles Cooked cereal
Oatmeal Ready-to-eat cereal Corn flakes Toasted oat rings Rice
Pasta Macaroni and cheese
Spaghetti with tomato sauce Pizza
Corn chips Popcorn
630 253 620
115 206
80 133
119 208 135
58 80 52 27 269
65 42 308 371
78 86 237 162
81
63 63 73 73 79 93 94 36 56
113 161 126 313 360a
77 73 62 199 214 301 630 253
61 63
2 1 4 3 4 7 5 3 4 6 7
15 30 42a
3 6 4 9 8
19 48 12
5 6
549 252 464
94 201
113 112
156 265 149
72 74 73 37 347
53 54 321 371
78 78 202 179
97
47 48 53 55 53 79 68 28 39 94 150
80 219 258
55 43 42 139 155 235 385 150
35 35
1 1 1 2 2 5 2 2 2 7 9 6 11
17 1 2 2 6 6
19 22
6 2 2
597 328 479 134 134 157 134 166 276 165
118 75 97 60 298
59 48 294 343
61 55 130 128
96
59 57 65 80 67 93 88 30 47 108 162
117 300 332
68 49 46 167 208 302 543 220
47 50
2 1 1 3 3 7 4 1 2 6 6 8
16 16
2 3 2 5 7
31 59 13
4 4
553 323 434
112 127 149
110 175 290 168
99 80 103
62 297
52 41 288 347
60 54 145 120 109
46 46 52 56 52 72 72 24 36 83 151
74 243 242
51 40 35 130 140 210 386 147
33 39
1 2 1 2 2 4 4 1 1 4 8 5 11
10 1 3 2 4 5
12 18
8 2 3
593 398 378 130
42 174
114 256 297 192 164 108 209 136 446 124
43 231 279
71 50 53 48 61
51 48 54 58 47 86 65 23 40 85 154
99 255 257
53 37 36 147 167 230 450 187
30 52
1 1 1 3 4 5 2 1 2 4 7 5 8
10 1 2 3 6 7
13 22 18
3 4
548 431 306
98 54 183 104 259 322 183 133
82 202 129 440 104
49 214 279
65 45 47 53 76
41 41 43 48 41 72 56 17 30 87 137
68 216 224
41 30 27
118 132 215 379 109
21 34
1 1 1 3 2 4 2 1 1 7 5 4 8
10 1 1 2 5 5
18 33
8 2 3
a Indicates a SE value that is greater than 0 but less than 05 b Indicates a statistic that is potentially unreliable because of small sample size or large coefficient of variation N = Sample size
PC = Percent consuming at least once in 2 days SE = Standard error of the mean
Source Smiciklas-Wright et al (2002) (based on 1994ndash1996 CSFII data)
Exposure Factors Handbook
Chapter 12mdashIntake of Grain Products
Table 12-27 Consumption of Major Food Groups by Older Adults Median Daily Servings (and ranges) by Demographic and Health Characteristics
Subject Characteristic N Bread Cereal Rice and Pasta (servingsday) Sex a
Females 80 27 (09ndash65) Males 50 36 (14ndash73)
Ethnicity African American 44 33 (14ndash64) European American 47 32 (09ndash68) Native American 39 29 (11ndash73)
Age 70 to 74 years 42 33 (11ndash63) 75 to 79 years 36 30 (09ndash68) 80 to 84 years 36 32 (15ndash64) gt85 years 16 36 (16ndash73)
Marital Status Married 49 33 (11ndash58) Not Married 81 30 (09ndash73)
Education 8th grade or less 37 31 (11ndash73) 9th to 12th grades 47 33 (11ndash68) gtHigh School 46 32 (09ndash65)
Dentures Yes 83 33 (11ndash64) No 47 31 (09ndash73)
Chronic Diseases 0 7 41 (22ndash64) 1 31 33 (09ndash73) 2 56 31 (11ndash58) 3 26 37 (11ndash58) gt4 10 29 (14ndash53)
Weightb
le130 pounds 18 31 (11ndash54) 131 to 150 pounds 32 33 (09ndash52) 151 to 170 pounds 27 31 (14ndash73) 171 to 190 pounds 22 36 (14ndash62) ge191 pounds 29 30 (11ndash68)
a p lt 005 b 2 missing values N = Number of subjects
Source Vitolins et al (2002)
Exposure Factors Handbook Page September 2011 12-37
Exposure Factors Handbook
Chapter 12mdashIntake of Grain Products
Table 12-28 Characteristics of the Feeding Infant and Toddlers Study (FITS) Sample Population Sample Size Percentage of Sample
Sex Males Females
1549 1473
513 487
Age of Child 4 to 6 months 7 to 8 months 9 to 11 months 12 to 14 months 15 to 18 months 19 to 24 months
862 483 679 374 308 316
285 160 225 124 102 104
Childrsquos Ethnicity Hispanic or Latino Non-Hispanic or Latino Missing
367 2641
14
121 874 05
Childrsquos Race White Black Other
2417 225 380
800 74 126
Urbanicity Urban Suburban Rural Missing
1389 1014 577 42
460 336 191 13
Household Income Under $10000 $10000 to $14999 $15000 to $24999 $25000 to $34999 $35000 to $49999 $50000 to $74999 $75000 to $99999 $100000 and Over Missing
48 48
221 359 723 588 311 272 452
16 16 73 119 239 195 103 90 149
Receives WIC Yes No Missing
821 2196
5
272 726 02
Sample Size (Unweighted) 3022 1000 WIC = Special Supplemental Nutrition Program for Women Infants and Children
Source Devaney et al (2004)
Page Exposure Factors Handbook 12-38 September 2011
Table 12-29 Percentage of Infants and Toddlers Consuming Different Types of Grain Products Percentage of Infants and Toddlers Consuming at Least Once in a Day
Food GroupFood 4 to 6 7 to 8 9 to 11 12 to 14 15 to 18 19 to 24 Months Months Months Months Months Months
Any Grain or Grain Product 658 915 975 978 986 992 Infant Cereals 648 812 638 239 92 31 Non-infant Cerealsa 06 183 443 589 605 519
Not Pre-sweetened 05 170 370 445 406 319 Pre-sweetenedb 00 18 90 177 264 227
Breads and Rollsc 06 99 245 473 527 531 Crackers Pretzels Rice Cakes 30 162 334 452 464 447 Cereal or Granola Bars 00 11 34 98 100 97 Pancakes Waffles French Toast 01 08 75 151 161 154 Rice and Pastad 23 45 182 262 390 359 Other 02 01 27 28 25 45 Grains in Mixed Dishes 04 53 241 483 520 551 Sandwiches 00 11 86 215 258 258 Burrito Taco Enchilada Nachos 00 00 10 45 28 21 Macaroni and Cheese 02 16 49 146 150 150 Pizza 01 07 22 68 90 94 Pot PieHot Pocket 00 09 05 20 10 18 Spaghetti Ravioli Lasagna 01 18 99 153 121 88 a Includes both ready-to-eat and cooked cereals b Defined as cereals with more than 211 grams sugar per 100 grams c Does not include bread in sandwiches Sandwiches are included in mixed dishes d Does not include rice or pasta in mixed dishes
Source Fox et al (2004)
Exposure Factors Handbook
Chapter 12mdashIntake of Grain Products
Exposure Factors Handbook Page September 2011 12-39
Table 12-30
a Characteristics of Women Infants and Children (WIC) Participants and Non-Participants (percentages)
Infants 4 to 6 month Infants 7 to 11 month Toddlers 12 to 24 month WIC
Participant Non-Participant WIC
Participant Non-Participant WIC
Participant Non-Participant Sex Males 55 Females 45
Childrsquos Ethnicity Hispanic or Latino 20 Non-Hispanic or Latino 80
Childrsquos Race White 69 Black 15 Other 22
Child in Daycare Yes 39 No 61 Age of Mother 14 to 19 years 18 20 to 24 years 33 25 to 29 years 29 30 to 34 years 9 gt35 years 9 Missing 2
Motherrsquos Education 11th Grade or Less 23 Completed High School 35 Some Postsecondary 33 Completed College 7 Missing 2
Parentrsquos Marital Status Married 49 Not Married 50 Missing 1
Mother or Female Guardian Works Yes 46 No 53 Missing 1
54 46
b
11 89
b 84
4 11
38 62
b 1
13 29 33 23
2 b 2
19 26 53
1 b
93 7 1
51 48
1
55 45
24 76
63 17 20
34 66
13 38 23 15
11 1 15 42 32
9 2 57 42
1 45 54
1
51 49
b 8
92 b
86 5 9 b
46 54
b 1 11
30 36 21
1 b 2
20 27 51
0 b
93 7 0 b
60 40
0
57 43
22 78
67 13 20
43 57
9
33 29 18
11 0
17 42 31
9 1
58 41
1
55 45
0
52 48
b 10 89
b 84
5 11
c
53 47
b 1
14 26 34 26
1 b 3
19 28 48
2 b
88 11 1
c
61 38
1
Exposure Factors Handbook
Chapter 12mdashIntake of Grain Products
Page Exposure Factors Handbook 12-40 September 2011
c
Table 12-30 Characteristics of Women Infants and Children (WIC) Participants and Non-Participantsa
(percentages) (continued) Infants 4 to 6 months Infants 7 to 11 months Toddlers 12 to 24 months
WIC WIC WIC Participant Non-Participant Participant Non-Participant Participant Non-Participant
Urbanicity c c c
Urban 34 55 37 50 35 48 Suburban 36 31 31 34 35 35 Rural 28 13 30 15 28 16 Missing 2 1 2 1 2 2
Sample Size (Unweighted) 265 597 351 808 205 791 a χ2 tests were conducted to test for statistical significance in the differences between WIC participants and nonshy
participants within each age group for each variable The results of χ2 tests are listed next to the variable under the column labeled non-participants for each of the three age groups
b = p lt 005 non-participants significantly different from WIC participants on the variable = p lt 001 non-participants significantly different from WIC participants on the variable
WIC = Special Supplemental Nutrition Program for Women Infants and Children
Source Ponza et al (2004)
Table 12-31 Food Choices for Infants and Toddlers by Women Infants and Children (WIC) Participation Status
Infants 4 to 6 months Infants 7 to 11 months Toddlers 12 to 24 months WIC Non- WIC Non- WIC Non-
Participant Participant Participant Participant Participant Participant 697 Infant Cereals 697 625 747 135 92
Non-infant Cereals Total 09 05 217 385a 581 560
Not Pre-sweetened 05 05 187 329a 437 363 Pre-sweetened 00 00 40 69 177 241
Grains in Combination Foods 09 01 188 147 503 529 Sample Size (unweighted) 265 597 351 808 205 791 a = p lt 001 non-participants significantly different from WIC participants WIC = Special Supplemental Nutrition Program for Women Infants and Children
Source Ponza et al (2004)
Exposure Factors Handbook
Chapter 12mdashIntake of Grain Products
Exposure Factors Handbook Page September 2011 12-41
Table 12-32 Average Portion Sizes per Eating Occasion of Grain Products Commonly Consumed by Infants From the 2002 Feeding Infants and Toddlers Study
4 to 5 months 6 to 8 months 9 to 11 months Reference Food Group (N = 624) (N = 708) (N = 687) Unit Mean plusmn SE Infant cereal dry tablespoon 31 plusmn 014 45 plusmn 014 52 plusmn 018 Infant cereal jarred tablespoon - 56 plusmn 026 74 plusmn 034 Ready-to-eat cereal tablespoon - 23 plusmn 034 34 plusmn 021 Crackers ounce - 02 plusmn 002 03 plusmn 001 Crackers saltine - 22 plusmn 014 27 plusmn 012 Bread slice - 05 plusmn 010 08 plusmn 006 - = Cell size was too small to generate a reliable estimate N = Number of respondents SE = Standard error of the mean
Source Fox et al (2006)
Exposure Factors Handbook
Chapter 12mdashIntake of Grain Products
Table 12-33 Average Portion Sizes per Eating Occasion of Grain Products Commonly Consumed by Toddlers From the 2002 Feeding Infants and Toddlers Study
Food Group Reference Unit 12 to 14 months
(N = 371) 15 to 18 months
(N = 312) 19 to 24 months (N = 320)
Mean plusmn SE Bread slice 08 plusmn 004 09 plusmn 005 09 plusmn 005 Rolls ounce 09 plusmn 011 10 plusmn 010 09 plusmn 015 Ready-to-eat cereal cup 03 plusmn 002 05 plusmn 003 06 plusmn 004 Hot cereal prepared cup 06 plusmn 005 06 plusmn 005 07 plusmn 005 Crackers ounce 03 plusmn 002 04 plusmn 002 04 plusmn 002 Crackers saltine 33 plusmn 022 35 plusmn 022 37 plusmn 022 Pasta cup 04 plusmn 004 04 plusmn 004 05 plusmn 005 Rice cup 03 plusmn 004 04 plusmn 005 04 plusmn 005 Pancakes and waffles 1 (4-inch diameter) 10 plusmn 008 14 plusmn 021 14 plusmn 017 N = Number of respondents SE = Standard error of the mean
Source Fox et al (2006)
Page Exposure Factors Handbook 12-42 September 2011
c
Table 12-34 Percentage of Hispanic and Non-Hispanic Infants and Toddlers Consuming Different Types of Grain Products on a Given Day Age 4 to 5 months Age 6 to 11 months Age 12 to 24 months
Hispanic Non-Hispanic Hispanic Non-Hispanic Hispanic Non-Hispanic (N = 84) (N = 538) (N = 163) (N = 1228) (N = 124) (N = 871)
Any Grain or Grain Product Infant Cereal Non-infant Cereal Breadsb
Tortillas Crackers Pretzels Rice Cakes Pancakes Waffles French Toast Rice and Pastad
Rice Grains in Mixed Dishes
Sandwiches Burrito Taco Enchilada Nachos
565 552
-14c
14c
13c
------
569 565
----------
950 741 185a
182 40c
278 14c
201a
159e
159 40c
13c
935 736 292 151
-225 43
103 47
130 46 -
971 159 453 440 67a c
356 130 443
269a c
388a
242 21c
989 93
578 529 06c
469 160 329 130 544 249 30
Macaroni and Cheese - - 30c 31 101 155
Pizza - - - 14 10c e 97
Spaghetti Ravioli Lasagna - - 83c 46 93c 121 a = Significantly different from non-Hispanic at p lt 005 b Does not include bread in sandwiches Sandwiches are included in mixed dishes Includes tortillas also shown
separately = Statistic is potentially unreliable because of a high coefficient of variation
d Does not include rice or pasta in mixed dishes Includes rice (eg white brown wild and Spanish rice without meat) and pasta (eg spaghetti macaroni and egg noodles) Rice is also shown separately
e = Significantly different from non-Hispanic at p lt 001 - = Less than 1 of the group consumed this food on a given day N = Sample size
Source Mennella et al (2006)
Exposure Factors Handbook
Chapter 12mdashIntake of Grain Products
Exposure Factors Handbook Page September 2011 12-43
Exposure Factors Handbook
Chapter 12mdashIntake of Grain Products
Table 12-35 Mean Moisture Content of Selected Grain Products Expressed as Percentages of Edible Portions (grams per 100 grams of edible portion)
Food Moisture Content Comments Raw Cooked Barley―pearled 1009 6880 Corn―grain―endosperm 1037 -Corn―grain―bran 471 - crude Millet 867 7141 Oats 822 -Rice―white―long-grained 1162 6844 Rye 1095 -Rye―flour―medium 985 -Sorghum 920 -Wheat―hard white 957 -Wheat―germ 1112 - crude Wheat―bran 989 - crude Wheat―flour―whole grain 1027 -- Indicates that the grain product was not assessed for water content under these conditions
Source USDA (2007)
Page Exposure Factors Handbook 12-44 September 2011
- TABLE OF CONTENTS
- LIST OF TABLES
- 12 INTAKE OF GRAIN PRODUCTS
-
- 121 INTRODUCTION
- 122 RECOMMENDATIONS
- 123 INTAKE STUDIES
-
- 1231 Key Grain Intake Study
-
- 12311 US EPA Analysis of Consumption Data From 2003minus2006 National Health and Nutrition Examination Survey (NHANES)
-
- 1232 Relevant Grain Intake Studies
-
- 12321 USDA (1996a b 1993 1980)mdashFood and Nutrient Intakes of Individuals in 1 Day in the United States
- 12322 USDA (1999b)mdashFood Consumption Prices and Expenditures 1970minus1997
- 12323 USDA (1999a)mdashFood and Nutrient Intakes by Children 1994minus1996 1998 Table Set 17
- 12324 US EPA Analysis of Continuing Survey of Food Intake by Individuals (CSFII) 1994minus1996 1998
- 12325 Smiciklas-Wright et al (2002)mdashFoods Commonly Eaten in the United States Quantities Consumed per Eating Occasion and in a Day 1994minus1996
- 12326 Vitolins et al (2002)mdashQuality of Diets Consumed by Older Rural Adults
- 12327 Fox et al (2004)mdashFeeding Infants and Toddlers Study What Foods Are Infants and Toddlers Eating
- 12328 Ponza et al (2004)mdashNutrient Food Intakes and Food Choices of Infants and Toddlers Participating in WIC
- 12329 Fox et al (2006)mdashAverage Portion of Foods Commonly Eaten by Infants and Toddlers in the United States
- 123210 Mennella et al (2006)mdashFeeding Infants and Toddlers Study The Types of Foods Fed to Hispanic Infants and Toddlers
-
- 124 CONVERSION BETWEEN WET- AND DRY-WEIGHT INTAKE RATES
- 125 REFERENCES FOR CHAPTER 12
-

Exposure Factors Handbook
Chapter 12mdashIntake of Grain Products intakes by individuals (CSFII) Beltsville MD Agricultural Research Service Beltsville Human Nutrition Research Center
USDA (US Department of Agriculture) (2007) USDA nutrient database for standard reference release 20 Riverdale MD httpwwwarsusdagovmainsite_mainhtm modecode=12-35-45-00
Vitolins MZ Quandt SA Bell RA Arcury TA Case LD (2002) Quality of diets consumed by older rural adults J Rural Health 18 49shy56
Page Exposure Factors Handbook 12-12 September 2011
Exposure F
actors Handbook
Chapter 12mdash
Intake of Grain Products
Table 12-3 Per Capita Intake of Total Grains Based 2003ndash2006 NHANES (gkg-day edible portion uncooked weight)
Population Group
Consuming Percentiles
N Mean SE 1st 5th 10th 25th 50th 75th 90th 95th 99th Max Whole Population 16783 100 26 004 02 06 08 13 20 32 51 67 99 348 Age Group
Birth to 1 year 865 76 31 020 00 00 00 01 23 50 75 95 125 349 1 to 2 years 1052 100 64 017 15 23 30 42 58 84 105 124 159 211 3 to 5 years 978 100 62 013 20 24 33 44 59 76 96 111 132 156 6 to 12 years 2256 100 44 009 06 14 18 28 41 55 74 82 111 145 13 to 19 years 3450 100 24 005 04 07 10 15 21 32 42 50 75 143 20 to 49 years 4289 100 22 004 03 06 08 12 19 28 39 46 71 150 Females 13 to 49 years 4103 100 19 004 02 05 08 11 17 25 34 39 55 98 50 years and older 3893 100 17 003 03 05 07 10 15 21 29 35 52 94
Race Mexican American 4450 99 30 005 01 08 10 16 24 39 58 72 106 178 Non-Hispanic Black 4265 100 24 004 02 05 07 11 18 29 50 68 102 211 Non-Hispanic White 6757 100 25 005 03 06 08 13 19 31 49 65 96 348 Other Hispanic 562 99 27 013 02 07 10 15 21 33 53 70 98 153 Other RacemdashIncluding Multiple Races 749 100 30 011 03 06 09 15 25 39 60 75 111 175
N = Sample size SE = Standard error Max = Maximum value Estimates are less statistically reliable based on guidance published in the Joint Policy on Variance Estimation and Statistical Reporting Standards on
NHANES III and CSFII Reports NHISNCHS Analytical Working Group Recommendations (NCHS 1993)
Source Based on US EPA analysis of 2003ndash2006 NHANES
Exposure F
actors Handbook
Page Septem
ber 2011 12-13
Exposure F
actors Handbook
Chapter 12mdash
Intake of Grain Products
Table 12-4 Consumer-Only Intake of Total Grains Based 2003ndash2006 NHANES (gkg-day edible portion uncooked weight)
Population Group N Mean SE Percentiles
1st 5th 10th 25th 50th 75th 90th 95th 99th Max
Whole Population 16556 26 004 03 06 08 13 20 32 51 67 99 Age Group
Birth to 1 year 644 41 018 01 04 08 18 35 59 81 103 139 1 to 2 years 1050 64 016 16 24 30 42 58 84 105 124 159 3 to 5 years 977 62 013 20 24 33 44 59 76 96 111 132 6 to 12 years 2256 44 009 06 14 18 28 41 55 74 82 111 13 to 19 years 3450 24 005 04 07 10 15 21 32 42 50 75 20 to 49 years 4288 22 004 03 06 08 12 19 28 39 46 71 Females 13 to 49 years 4102 19 003 02 05 08 11 17 25 34 39 55 50 years and older 3891 17 003 03 05 07 10 15 21 29 35 52
Race Mexican American 4341 30 005 04 08 11 16 24 39 59 72 106 Non-Hispanic Black 4236 24 004 02 05 07 11 18 29 50 69 103 Non-Hispanic White 6694 25 005 03 06 08 13 20 31 49 65 96 Other Hispanic 548 28 014 04 07 10 15 21 34 54 71 98 Other RacemdashIncluding Multiple Races 737 31 011 03 07 09 15 25 39 60 75 111
349
349 211 156 145 143 150 98 94
178 211 349 153 175
N = Sample size SE = Standard error Max = Maximum value Estimates are less statistically reliable based on guidance published in the Joint Policy on Variance Estimation and Statistical Reporting
Standards on NHANES III and CSFII Reports NHISNCHS Analytical Working Group Recommendations (NCHS 1993)
Source Based on US EPA analysis of 2003ndash2006 NHANES
Page E
xposure Factors H
andbook 12-14
September 2011
Table 12-5 Per Capita Intake of Individual Grain Products Based 2003ndash2006 NHANES (gkg-day edible portion uncooked weight)
Population Group N
Consuming Mean SE
Consuming Mean SE
Cereal Rice Whole Population
Age Group Birth to 1 year 1 to 2 years 3 to 5 years 6 to 12 years 13 to 19 years 20 to 49 years Females 13 to 49 years 50 years and older Race Mexican American Non-Hispanic Black Non-Hispanic White Other Hispanic Other RacemdashIncluding Multiple Races
16783
865 1052
978 2256 3450 4289 4103 3893
4450 4265 6757
562
749
100
81 100 100 100 100 100 100 100
100 100 100
99
100
37
51 87 86 63 39 32 29 22
43 36 36 39
41
004
030 018 017 010 008 004 004 004
007 006 005 020
012
88 69 87 91 89 85 89 86 89
87 86 88 92
90
02
11 06 05 03 02 03 02 01
03 03 02 06
08
001
008 006 006 003 001 001 001 001
002 002 001 005
008 N
SE
Source
= Sample size = Standard error
Based on US EPA analysis of 2003ndash2006 NHANES
Exposure Factors Handbook
Chapter 12mdashIntake of Grain Products
Exposure Factors Handbook Page September 2011 12-15
Table 12-6 Consumer-Only Intake of Individual Grain Products Based 2003ndash2006 NHANES (gkg-day edible portion uncooked weight)
Population Group N Mean SE N Mean SE
Cereal Rice Whole Population
Age Group Birth to 1 year 1 to 2 years 3 to 5 years 6 to 12 years 13 to 19 years 20 to 49 years Females 13 to 49 years 50 years and older Race Mexican American Non-Hispanic Black Non-Hispanic White Other Hispanic Other RacemdashIncluding Multiple Races
16613
696 1051 978 2256 3450 4289 4103 3893
4372 4244 6707 550 740
37
63 87 86 63 39 32 29 22
43 36 36 39 41
004
031 018 017 010 008 004 004 004
007 006 005 020 013
14447
552 928 875 2000 2898 3812 3511 3382
3757 3645 5887 491 667
03
15 07 05 03 02 03 02 02
03 03 02 06 08
001
010 007 006 003 002 002 002 001
002 002 001 005 008
N SE
Source
= Sample size = Standard error
Based on US EPA analysis of 2003ndash2006 NHANES
Exposure Factors Handbook
Chapter 12mdashIntake of Grain Products
Page Exposure Factors Handbook 12-16 September 2011
Exposure Factors Handbook
Chapter 12mdashIntake of Grain Products
Table 12-7 Mean Grain Intake per Individual in a Day by Sex and Age (gday as-consumed)a for 1977minus1978 Group Age (years) Total Grains Breads Rolls
Biscuits Other Baked
Goods Cereals Pasta Mixtures Mainly Grainb
Males and Females lt1 1 to 2 3 to 5 6 to 8
42 158 181 206
4 27 46 53
5 24 37 56
30 44 54 60
3 63 45 38
Males 9 to 11 12 to 14 15 to 18 19 to 22 23 to 34 35 to 50 51 to 64 65 to 74 ge75
238 288 303 253 256 234 229 235 196
67 76 91 84 82 82 78 71 70
56 80 77 53 60 58 57 60 50
51 57 53 64 40 44 48 69 58
64 74 82 52 74 50 46 35 19
Females 9 to 11 12 to 14 15 to 18 19 to 22 23 to 34 35 to 50 51 to 64 65 to 74 ge75
214 235 196 161 163 161 155 175 178
58 57 57 44 49 49 52 57 54
59 61 43 36 38 37 40 42 44
44 45 41 33 32 32 36 47 58
53 72 55 48 44 43 27 29 22
Males and FemalesmdashAll Ages 204 62 49 44 49 a Based on USDA Nationwide Food Consumption Survey 1977ndash1978 data for 1 day b Includes mixtures containing grain as the main ingredient
Source USDA (1980)
Exposure Factors Handbook Page September 2011 12-17
Exposure Factors Handbook
Chapter 12mdashIntake of Grain Products
Page Exposure Factors Handbook 12-18 September 2011
Table 12-8 Mean Grain Intakes per Individual in a Day by Sex and Age (gday as-consumed)a for 1987minus1988
Group Age (years) Total Grains Yeast Breads and
Rolls
Quick Breads Pancakes
French Toast
Cakes Cookies Pastries
Pies
Crackers Popcorn
Pretzels Corn Chips
Cereals and Pastas
Mixtures Mostly Grainb
Males and Females le5 167 30 8 22 4 52 51
Males 6 to 11 268 51 16 37 8 74 83
12 to 19 304 65 28 45 10 72 82 ge20 272 65 20 37 8 58 83
Females 6 to 11 231 43 19 30 6 66 68
12 to 19 239 45 13 29 7 52 91 ge20 208 45 14 28 6 53 62
All Individuals 237 52 16 32 7 57 72 a Based on USDA Nationwide Food Consumption Survey 1987ndash1988 data for 1 day b Includes mixtures containing grain as the main ingredient
Source USDA (1993)
Table 12-9 Mean Grain Intakes per Individual in a Day by Sex and Age (gday as-consumed)a for 1994minus1995
Group Age (years)
Total Grains Yeast Breads and Rolls
Quick Breads Pancakes
French Toast
Cakes Cookies
Pastries Pies
Crackers Popcorn
Pretzels Corn Chips
Cereals and Pastas
Mixtures Mostly Grainb
1994 1995 1994 1995 1994 1995 1994 1995 1994 1995 1994 1995 1994 1995 Males and Females le5 213 210 26 28 11 11 22 23 8 7 58 57 89 84
Males 6 to 11 12 to 19 ge20
285 417 357
341 364 365
51 53 64
45 54 61
15 30 22
21 21 24
42 54 43
46 43 46
12 17 13
18 22 15
66 82 86
97 84 91
101 180 128
115 138 128
Females 6 to 11 12 to 19 ge20
260 317 254
286 296 257
43 40 44
46 37 45
16 16 16
21 14 15
37 39 33
51 35 34
11 17 9
14 16 10
57 63 59
54 52 69
94 142 92
100 143 83
All Individuals 300 303 50 49 18 19 38 39 12 13 70 76 112 107 a Based on USDA CSFII 1994 and 1995 data for 1 day b Includes mixtures containing grain as the main ingredient
Source USDA (1996a b)
Exposure Factors Handbook
Chapter 12mdashIntake of Grain Products
Table 12-10 Per Capita Consumption of Flour and Cereal Products in 1997
Food Item Per Capita Consumption
(gday)a
Total Wheat Flourb
Rye Flour Ricec
Total Corn Productsd
Oat Productse
Barley Productsf
Total Flour and Cereal Productsg
186 07 24 29 8
09 249
a Original data were presented in lbsyear data were converted to gday by multiplying by a factor of 454 glb and dividing by 365 dayyear Consumption of most items at the processing level Excludes quantities used in alcoholic beverages and fuel
b Includes white whole wheat and durum flour c Milled basis d Includes corn flour and meal hominy and grits and corn starch e Includes rolled oats ready-to-eat oat cereals oat flour and oat bran f Includes barley flour pearl barley and malt and malt extract used in food processing g Excludes wheat not ground into flour
Source USDA (1999b)
Exposure Factors Handbook Page September 2011 12-19
Table 12-11 Mean Quantities of Grain Products Consumed by Children Under 20 Years of Age by Sex and Age per Capita (gday as-consumed)a
Yeast Cereals and Pasta Cakes Crackers Quick Breads Mixtures Age Group Sample Breads Cookies Popcorn Totalb Ready-to- Pancakes Mainly (years) Size and Total Rice Pasta Pastries Pretzels Eat Cereals French Toast Grainc Rolls Pies Corn Chips
Males and Females lt1 1126 56 2 29 1 2 1d 1 3 1 20 1 1016 192 16 57 11 9 9 9 16 7 87 2 1102 219 26 62 16 15 12 12 22 9 87 1 to 2 2118 206 21 59 13 12 11 11 19 8 87 3 1831 242 30 64 19 13 12 16 23 11 98 4 1859 264 36 67 22 15 11 17 30 13 102 5 884 284 41 76 24 17 11 15 33 13 107 3 to 5 4574 264 36 69 22 15 11 16 29 12 102 le5 7818 219 27 61 16 13 10 12 22 9 87
Males 6 to 9 787 310 45 77 28 18 15 23 39 16 109 6 to 11 1031 318 46 80 31 16 18 23 40 15 115 12 to 19 737 406 54 82 29 27 17 26 49 19 175
Females 6 to 9 704 284 43 61 21 12 15 18 42 13 107 6 to 11 969 280 43 62 20 14 15 19 42 14 101 12 to 19 732 306 40 67 17 19 22 15 37 15 132
Males and Females le9 9309 250 34 64 20 14 12 16 30 12 96 le19 11287 298 40 69 22 17 15 18 36 14 120 a Based on data from 1994ndash1996 1998 CSFII b Includes yeast breads rolls cereals pastas quick breads pancakes French toast cakes cookies pastries pies crackers popcorn pretzels corn
chips and mixtures having a grain product as a main ingredient Excludes grain products that were ingredients in food mixtures coded as a single item and tabulated under another food group for example noodles in tuna-noodle casserole are tabulated under Meat Poultry and Fish
c Includes mixtures having a grain product as a main ingredient such as burritos tacos pizza egg rolls quiche spaghetti with sauce rice and pasta mixtures frozen meals in which the main course is a grain mixture noodle and rice soups and baby-food macaroni and spaghetti mixtures
d Estimate is not statistically reliable due to small sample size reporting intake Note Consumption amounts shown are representative of the first day of each participantrsquos survey response
Source USDA (1999a)
Exposure F
actors Handbook
Chapter 12mdash
Intake of Grain Products
Page E
xposure Factors H
andbook 12-20
September 2011
Exposure F
actors Handbook
Chapter 12mdash
Intake of Grain Products
Table 12-12 Percentage of Individuals Under 20 Years of Age Consuming Grain Products by Sex and Age ()a
Age Group (years) Sample Size Totalb
Yeast Breads
and Rolls
Cereals and Pasta Quick Breads
Pancakes French Toast
Cakes Cookies Pastries
Pies
Crackers Popcorn Pretzels
Corn Chips
Mixtures Mainly GraincTotal
Ready-to-Eat
Cereals Rice Pasta
Males and Females lt1 1126 706 109 628 91 34 21 44 165 103 150 1 1016 982d 484 706 453 113 94 230 470 390 478 2 1102 990d 587 711 519 144 94 275 466 379 453 1 to 2 2118 987 537 709 487 129 94 253 468 384 465 3 1831 994d 641 697 533 111 86 288 461 385 490 4 1859 995d 670 691 548 114 71 286 523 394 462 5 884 999d 692 704 549 114 68 252 524 321 474 3 to 5 4574 996d 668 697 543 113 75 275 503 367 475 le5 7818 958 555 693 469 109 75 240 450 341 433
Males 6 to 9 787 989d 698 626 508 105 74 281 525 360 445 6 to 11 1031 990d 691 640 524 97 81 271 523 338 453 12 to 19 737 982d 627 446 332 100 59 244 413 272 462
Females 6 to 9 704 997d 715 612 476 90 79 263 571 383 480 6 to 11 969 993d 710 593 456 94 71 271 550 371 457 12 to 19 732 976d 609 459 303 86 93 198 406 309 461
Males and Females le9 9309 972 616 664 479 105 76 253 489 353 444 le19 11287 976 624 576 417 99 76 242 461 325 451 a Based on data from 1994ndash1996 1998 CSFII b Includes yeast breads rolls cereals pastas quick breads pancakes French toast cakes cookies pastries pies crackers popcorn
pretzels corn chips and mixtures having a grain product as a main ingredient Excludes grain products that were ingredients in food mixtures coded as a single item and tabulated under another food group for example noodles in tuna-noodle casserole are tabulated under Meat Poultry and Fish
c Includes mixtures having a grain product as a main ingredient such as burritos tacos pizza egg rolls quiche spaghetti with sauce rice and pasta mixtures frozen meals in which the main course is a grain mixture noodle and rice soups and baby-food macaroni and spaghetti mixtures
d Estimate is not statistically reliable due to small sample size reporting intake Note Percentages shown are representative of the first day of each participantrsquos survey response
Source USDA (1999a)
Exposure F
actors Handbook
Page Septem
ber 2011 12-21
Page E
xposure Factors H
andbook 12-22
September 2011
Exposure F
actors Handbook
Chapter 12mdash
Intake of Grain Products
Table 12-13 Per Capita Intake of Total Grains Based on 1994ndash1996 1998 CSFII (gkg-day edible portion uncooked weight) Population Group N Percent
Consuming Mean SE Percentiles 1st 5th 10th 25th 50th 75th 90th 95th 99th Max
Whole Population Age group Birth to 1 year 1 to 2 years 3 to 5 years 6 to 12 years 13 to 19 years 20 to 49 years ge50 years Season Fall Spring Summer Winter Race Asian Pacific Islander Black American Indian Alaskan Native OtherNA White Region Midwest Northeast South West Urbanization Central City Suburban Non-metropolitan
20607
1486 2096 4391 2089 1222 4677 4646
4687 5308 5890 4722
557 2740
177 1638 15495
4822 3692 7208 4885
6164 9598 4845
995
705 998 1000 1000 1000
999 1000
995 996 995 995
985 994 997 988 996
997 996 995 994
995 995 996
27
25 64 63 43 25 22 17
26 27 26 27
36 26 29 31 26
27 28 25 28
27 27 24
00
01 01 01 01 01 00 00
00 00 00 00
02 01 02 01 00
00 00 00 01
00 00 01
02
00 11 18 09 04 03 03
02 02 03 02
00 01 03 00 03
03 03 02 02
01 03 03
06
00 21 26 17 08 06 06
06 06 07 06
11 05 05 07 07
07 07 06 07
06 07 06
09
00 28 32 20 11 08 07
09 08 09 09
15 07 08 09 09
09 10 08 09
09 09 08
13
00 42 43 28 15 13 11
13 13 13 14
23 11 13 15 13
14 14 12 14
13 14 12
21
16 59 59 40 23 19 15
21 21 21 21
32 19 22 24 20
21 22 19 22
21 21 19
33
38 79 78 54 31 28 21
33 34 33 33
47 33 42 41 32
34 35 30 35
35 34 29
52
62 104 99 70 44 39 28
50 55 51 52
62 54 63 61 50
53 53 50 54
54 53 48
68
86 121
115 82 51 47 35
66 70 68 68
73 73 75 77 66
70 68 66 70
70 69 63
103
127 168 156
111 79 71 49
100 105 105 101
112 115
120 117
98
104 110
97 103
107 100 104
316
263 316 270 172 124 161
112
263 294 282 316
246 294 168 270 316
238 316 282 208
294 316 238
N SE
Source
= Sample size = Standard error
US EPA analysis of 1994ndash1996 1998 CSFII
Exposure F
actors Handbook
Page Septem
ber 2011 12-23
Exposure F
actors Handbook
Chapter 12mdash
Intake of Grain Products
Table 12-14 Consumer-Only Intake of Total Grains Based on 1994ndash1996 1998 CSFII (gkg-day edible portion uncooked weight) Population Group N Mean SE Percentiles
1st 5th 10th 25th 50th 75th 90th 95th 99th Max Whole Population Age Group Birth to 1 year 1 to 2 years 3 to 5 years 6 to 12 years 13 to 19 years 20 to 49 years ge50 years Season Fall Spring Summer Winter Race Asian Pacific Islander Black American Indian Alaskan Native OtherNA White Region Midwest Northeast South West Urbanization Central City Suburban Non-metropolitan
20157
1048 2092 4389 2089 1222 4673 4644
4587 5190 5751 4629
527 2675
175 1570 15210
4743 3628 7053 4733
6023 9378 4756
27
36 64 63 43 25 22 17
26 27 27 27
37 26 30 32 26
27 28 25 28
28 27 24
00
01 01 01 01 01 00 00
00 00 00 00
02 01 02 01 00
00 00 00 01
00 00 01
03
01 12 18 09 04 03 03
03 03 04 03
08 02 03 05 04
04 04 03 04
03 04 03
07
03 21 26 17 08 06 06
07 07 07 07
12 05 05 07 07
07 08 06 07
07 07 06
09
06 28 32 20 11 08 07
09 09 09 09
16 07 08 10 09
09 10 08 09
09 09 08
13
14 42 43 28 15 13 11
13 13 14 14
23 11 13 15 13
14 14 12 14
13 14 12
21
28 59 59 40 23 19 15
21 21 21 21
32 19 22 24 20
21 22 19 22
21 21 19
33
48 79 78 54 31 28 21
33 34 33 33
47 33 42 41 32
34 35 30 35
35 34 29
52
74 104 99 70 44 39 28
50 55 52 52
62 54 63 62 51
53 53 50 54
54 53 48
68
92 121
115 82 51 47 35
66 70 68 68
73 73 75 77 66
70 68 66 70
70 69 64
103
134 168 156
111 79 71 49
100 106 105 101
112 115
120 117
98
104 110
98 103
107 100 104
316
263 316 270 172 124 161
112
263 294 282 316
246 294 168 270 316
238 316 282 208
294 316 238
N SE
Source
= Sample size = Standard error
US EPA analysis of 1994ndash1996 1998 CSFII
Table 12-15 Per Capita Intake of Individual Grain Products Based on 1994ndash1996 1998 CSFII (gkg-day edible portion uncooked weight)
Cereal Rice Population Group
N Percent Consuming Mean SE
Percent Consuming Mean SE
Whole Population Age Group
Birth to 1 year 1 to 2 years 3 to 5 years 6 to 12 years
13 to 19 years 20 to 49 years ge50 years Season Fall Spring Summer Winter Race Asian Pacific Islander Black American Indian Alaskan Native OtherNA White Region Midwest Northeast South West Urbanization Central City Suburban
Non-metropolitan
20607
1486 2096 4391 2089 1222 4677 4646
4687 5308 5890 4722
557 2740
177 1638 15495
4822 3692 7208 4885
6164 9598 4845
996
746 998 1000 1000 1000
999 1000
996 996 995 996
985 995 997 989 997
997 997 996 994
996 995 997
37
40 84 87 62 41 31 22
37 38 38 37
44 38 42 43 37
39 37 36 38
38 38 35
003
014 008 007 006 006 004 002
006 007 006 005
020 012 015 012 004
009 006 004 009
006 005 006
865
602 864 879 880 858 883 845
851 871 869 871
966 863 926 859 862
882 872 850 867
872 866 856
03
07 06 05 04 03 03 02
03 03 03 03
17 03 03 06 02
02 03 02 04
04 03 02
001
004 003 003 002 002 001 001
002 002 002 002
019 002 010 008 001
002 003 001 003
002 002 001
N SE
Source
= Sample size = Standard error
US EPA analysis of 1994ndash1996 1998 CSFII
Exposure Factors Handbook
Chapter 12mdashIntake of Grain Products
Page Exposure Factors Handbook 12-24 September 2011
Exposure Factors Handbook
Chapter 12mdashIntake of Grain Products
Table 12-16 Consumer-Only Intake of Individual Grain Products Based on 1994ndash1996 1998 CSFII (gkg-day edible portion uncooked weight )
Population Group N Cereal
Mean SE N Rice
Mean SE Whole Population 20227 38 003 17481 03 001 Age Group
Birth to 1 year 1116 54 016 900 12 007 1 to 2 years 2092 84 008 1819 07 004 3 to 5 years 4389 87 007 3869 06 003 6 to 12 years 2089 62 006 1847 04 002 13 to 19 years 1222 41 006 1038 03 003 20 to 49 years 4674 31 004 4102 03 001 ge50 years 4645 22 002 3906 02 001
Season Fall 4598 37 006 3957 03 002 Spring 5213 38 007 4530 03 002 Summer 5768 38 006 4989 03 002 Winter 4648 37 006 4005 03 002
Race Asian Pacific Islander 529 45 020 513 18 019 Black 2683 38 012 2346 04 002 American Indian Alaskan Native 175 43 015 151 03 010 OtherNA 1579 44 013 1375 07 008 White 15261 37 004 13096 02 001
Region Midwest 4759 39 009 4186 02 002 Northeast 3639 37 006 3152 04 004 South 7081 36 004 6029 03 001 West 4748 39 009 4114 05 003
Urbanization Central City 6039 38 006 5303 05 003 Suburban 9410 38 005 8105 03 002 Non-metropolitan 4778 36 006 4073 02 002
N = Sample size SE = Standard error
Source US EPA analysis of 1994ndash1996 1998 CSFII
Exposure Factors Handbook Page September 2011 12-25
Table 12-17 Per Capita Intake of Breads a Based on 1994ndash1996 1998 CSFII (gkg-day as-consumed)
Population Group Percent Consuming Mean
Percentile SE 1st 5th 10th 25th 50th 75th 90th 95th 99th Max
Whole Population Age Group lt5 months 6 to 12 months lt1 year 1 to 2 years 3 to 5 years 6 to 11 years 12 to 19 years 20 to 39 years 40 to 69 years ge70 years Season Fall Spring Summer Winter Race Asian Black American IndianAlaska Native OtherNA White Region Midwest Northeast South West Urbanization Central City Suburban Non-metropolitan
872
09 302 146 772 865 871 862 881 900 916
874 871 873 869
691 831 822 804 890
891 883 875 837
856 877 885
11
00 05 03 20 23 17 11 09 09 09
11 11 11 11
08 11 14 12 11
12 11 11 11
11 11 11
001
008 016 011 006 005 004 003 002 001 002
002 002 002 002
006 003 018 004 001
002 002 002 002
002 001 002
00
00 00 00 00 00 00 00 00 00 00
00 00 00 00
00 00 00 00 00
00 00 00 00
00 00 00
00
00 00 00 00 00 00 00 00 00 00
00 00 00 00
00 00 00 00 00
00 00 00 00
00 00 00
00
00 00 00 00 00 00 00 00 00 02
00 00 00 00
00 00 00 00 00
00 00 00 00
00 00 00
04
00 00 00 04 09 07 04 04 04 04
04 04 04 04
00 03 03 03 04
04 04 04 03
04 04 04
09
00 00 00 14 20 14 09 08 08 08
09 09 09 08
04 07 09 09 09
09 09 09 08
08 09 09
15
00 05 00 29 33 24 15 13 13 13
15 15 15 14
12 14 17 16 15
15 15 15 14
14 15 15
23
00 18 08 44 47 35 23 20 19 19
24 23 24 23
19 23 36 27 23
25 23 23 24
23 24 23
31
00 30 17 60 58 43 28 25 23 23
31 31 31 31
29 33 41 34 30
33 29 31 32
31 31 31
51
00 48 46 85 87 67 40 39 35 29
49 51 52 51
45 63 62 56 49
57 45 49 51
51 50 50
200
18 73 73 200 132
113 75 62 84 43
146 116
171 200
146 116
200 75 171
120 98 171 200
132 146 200
a SE
Source
Includes breads rolls muffins bagels biscuits cornbread and tortillas = Standard error
US EPA analysis of the 1994ndash1996 CSFII
Exposure F
actors Handbook
Chapter 12mdash
Intake of Grain Products
Page E
xposure Factors H
andbook 12-26
September 2011
Table 12-18 Per Capita Intake of Sweets a Based on 1994ndash1996 1998 CSFII (gkg-day as-consumed)
Population Group Percent Consuming
Percentile Mean SE 1st 5th 10th 25th 50th 75th 90th 95th 99th Max
Whole Population Age Group lt5 months 6 to 12 months lt1 year 1 to 2 years 3 to 5 years 6 to 11 years 12 to 19 years 20 to 39 years 40 to 69 years ge70 years Season Fall Spring Summer Winter Race Asian Black American IndianAlaska Native OtherNA White Region Midwest Northeast South West Urbanization Central City Suburban Non-metropolitan
526
25 230 121 532 621 642 543 472 529 586
537 522 500 545
402 414 353 350 563
601 554 491 477
512 546 505
06
00 03 02 12 13 12 06 04 05 05
06 06 05 06
04 05 04 04 06
07 06 06 05
06 06 06
001
004 014 010 007 006 006 003 002 002 003
003 002 002 003
008 004 011 005 001
003 003 002 002
002 002 003
00
00 00 00 00 00 00 00 00 00 00
00 00 00 00
00 00 00 00 00
00 00 00 00
00 00 00
00
00 00 00 00 00 00 00 00 00 00
00 00 00 00
00 00 00 00 00
00 00 00 00
00 00 00
00
00 00 00 00 00 00 00 00 00 00
00 00 00 00
00 00 00 00 00
00 00 00 00
00 00 00
00
00 00 00 00 00 00 00 00 00 00
00 00 00 00
00 00 00 00 00
00 00 00 00
00 00 00
01
00 00 00 03 08 06 02 00 01 02
02 01 00 02
00 00 00 00 02
03 02 00 00
01 02 01
08
00 00 00 17 19 17 10 06 07 08
09 08 07 09
06 06 03 05 09
10 09 08 07
08 09 08
18
00 11 04 35 36 32 18 14 13 16
18 18 16 19
14 15 17 13 18
20 17 17 16
16 18 18
25
00 20 10 48 46 39 24 19 19 21
25 26 23 26
20 23 21 19 25
29 25 23 23
23 26 25
46
04 36 36 72 88 67 37 32 32 36
47 47 41 48
31 47 28 41 47
53 48 44 38
46 45 51
220
06 64 64 193 220 209 107
111 73 57
209 220 182 123
157 193
29 70 220
220 127 209 157
209 127 220
a SE
Source
Includes breakfast foods made with grains such as pancakes waffles and French toast = Standard error
US EPA analysis of the 1994ndash1996 CSFII
Exposure F
actors Handbook
Chapter 12mdash
Intake of Grain Products
Exposure F
actors Handbook
Page Septem
ber 2011 12-27
Table 12-19 Per Capita Intake of Snacks Containing Grains a Based on 1994ndash1996 1998 CSFII (gkg-day as-consumed)
Population Group Percent Consuming
Percentile Mean SE 1st 5th 10th 25th 50th 75th 90th 95th 99th Max
Whole Population Age Group lt5 months 6 to 12 months lt1 year 1 to 2 years 3 to 5 years 6 to 11 years 12 to 19 years 20 to 39 years 40 to 69 years ge70 years Season Fall Spring Summer Winter Race Asian Black American IndianAlaska Native OtherNA White Region Midwest Northeast South West Urbanization Central City Suburban Non-metropolitan
431
10 290 141 581 567 513 450 411 411 377
423 436 406 458
241 295 383 284 471
492 419 411 407
401 446 441
02
00 03 01 07 07 05 03 02 01 01
02 03 02 03
01 02 02 02 03
03 02 02 02
02 03 02
001
011 008 006 004 004 003 002 001 001 001
001 001 001 002
004 002 008 003 001
001 002 001 002
001 001 001
00
00 00 00 00 00 00 00 00 00 00
00 00 00 00
00 00 00 00 00
00 00 00 00
00 00 00
00
00 00 00 00 00 00 00 00 00 00
00 00 00 00
00 00 00 00 00
00 00 00 00
00 00 00
00
00 00 00 00 00 00 00 00 00 00
00 00 00 00
00 00 00 00 00
00 00 00 00
00 00 00
00
00 00 00 00 00 00 00 00 00 00
00 00 00 00
00 00 00 00 00
00 00 00 00
00 00 00
00
00 00 00 04 03 01 00 00 00 00
00 00 00 00
00 00 00 00 00
00 00 00 00
00 00 00
03
00 02 00 11 09 06 04 02 02 01
03 03 02 03
00 01 02 01 03
03 02 02 02
02 03 03
07
00 09 06 20 18 13 09 06 05 03
07 08 07 08
04 05 06 05 08
08 07 07 07
07 07 07
12
00 22 09 28 32 19 14 09 07 05
10 13 10 13
10 09 11 08 12
12 12 11 12
11 12 11
26
01 25 22 50 59 46 24 18 14 08
23 29 23 29
23 21 32 24 27
27 27 24 26
26 27 23
91
37 28 37 89 91 73 51 55 56 18
80 89 71 91
44 74 49 87 91
89 91 80 87
78 91 81
a SE
Source
Includes grain snacks such as crackers salty snacks popcorn and pretzels = Standard error
US EPA analysis of the 1994ndash1996 CSFII
Exposure F
actors Handbook
Chapter 12mdash
Intake of Grain Products
Page E
xposure Factors H
andbook 12-28
September 2011
Table 12-20 Per Capita Intake of Breakfast Foods a Based on 1994ndash1996 1998 CSFII (gkg-day as-consumed)
Population Group Percent Consuming
Percentile Mean SE 1st 5th 10th 25th 50th 75th 90th 95th 99th
Max
Whole Population Age Group lt5 months 6 to 12 months lt1 year 1 to 2 years 3 to 5 years 6 to 11 years 12 to 19 years 20 to 39 years 40 to 69 years ge70 years Season Fall Spring Summer Winter Race Asian Black American IndianAlaska Native OtherNA White Region Midwest Northeast South West Urbanization Central City Suburban Non-metropolitan
118
00 42 20 204 208 237 130
89 95 104
116 116
128 113
59 127
88 102 120
121 127 107 124
120 122 107
01
00 01 01 04 04 04 01 01 01 01
01 01 01 01
01 01 01 01 01
01 01 01 02
01 01 01
001
000 024 016 007 006 005 003 002 001 002
002 002 002 002
007 003 008 005 001
002 003 002 002
002 002 002
00
00 00 00 00 00 00 00 00 00 00
00 00 00 00
00 00 00 00 00
00 00 00 00
00 00 00
00
00 00 00 00 00 00 00 00 00 00
00 00 00 00
00 00 00 00 00
00 00 00 00
00 00 00
00
00 00 00 00 00 00 00 00 00 00
00 00 00 00
00 00 00 00 00
00 00 00 00
00 00 00
00
00 00 00 00 00 00 00 00 00 00
00 00 00 00
00 00 00 00 00
00 00 00 00
00 00 00
00
00 00 00 00 00 00 00 00 00 00
00 00 00 00
00 00 00 00 00
00 00 00 00
00 00 00
00
00 00 00 00 00 00 00 00 00 00
00 00 00 00
00 00 00 00 00
00 00 00 00
00 00 00
04
00 00 00 19 16 15 05 00 00 01
04 04 05 03
00 04 00 00 04
04 05 02 05
04 05 03
10
00 00 00 27 25 22 09 06 06 07
10 10 10 09
06 12 03 09 10
11 12 08 10
10 10 09
24
00 41 27 48 45 34 23 15 14 12
23 23 24 26
20 21 12 26 24
26 23 22 26
25 24 22
136
00 41 41 136
80 65 39 30 38 35
136
64 60 80
28 67 12 80 136
67 80 78 136
136
78 64
a SE
Source
Includes breakfast food made with grains such as pancakes waffles and French toast = Standard error
US EPA analysis of the 1994ndash1996 CSFII
Exposure F
actors Handbook
Chapter 12mdash
Intake of Grain Products
Exposure F
actors Handbook
Page Septem
ber 2011 12-29
Table 12-21 Per Capita Intake of Pasta Based on 1994ndash1996 1998 CSFII (gkg-day as-consumed) Population Group
Percent
Consuming Percentile
Mean SE 1st 5th 10th 25th 50th 75th 90th 95th 99th Max Whole Population
Age Group lt5 months 6 to 12 months lt1 year 1 to 2 years 3 to 5 years 6 to 11 years 12 to 19 years 20 to 39 years 40 to 69 years ge70 years Season Fall Spring Summer Winter Race Asian Black American IndianAlaska Native OtherNA White Region Midwest Northeast South West Urbanization Central City Suburban Non-metropolitan
130
00 75 35 160 128 134
117 139 137 90
136 132 126 126
194 70 18 96 141
121 201 95 132
134 140 103
03
00 01 01 08 06 05 03 03 02 02
03 03 03 03
05 02 01 02 03
03 05 02 03
03 03 02
002
000 022 015 015 013 012 009 004 003 006
005 005 005 006
017 010 023 009 003
005 005 005 005
005 003 005
00
00 00 00 00 00 00 00 00 00 00
00 00 00 00
00 00 00 00 00
00 00 00 00
00 00 00
00
00 00 00 00 00 00 00 00 00 00
00 00 00 00
00 00 00 00 00
00 00 00 00
00 00 00
00
00 00 00 00 00 00 00 00 00 00
00 00 00 00
00 00 00 00 00
00 00 00 00
00 00 00
00
00 00 00 00 00 00 00 00 00 00
00 00 00 00
00 00 00 00 00
00 00 00 00
00 00 00
00
00 00 00 00 00 00 00 00 00 00
00 00 00 00
00 00 00 00 00
00 00 00 00
00 00 00
00
00 00 00 00 00 00 00 00 00 00
00 00 00 00
00 00 00 00 00
00 00 00 00
00 00 00
10
00 00 00 34 21 20 08 11 10 00
12 11 09 08
20 00 00 00 11
08 19 00 09
12 12 01
22
00 10 00 62 44 38 21 22 19 13
24 23 21 21
33 17 00 20 23
21 28 18 22
25 22 15
51
00 33 23 106
84 75 42 41 36 29
47 58 52 51
66 36 24 35 53
52 59 44 57
53 53 42
291
00 67 67 167 143
119 291
112 118
77
167 147 154 291
112 291
36 154 167
167 154 291 141
291 167 141
SE
Source
= Standard error
US EPA analysis of the 1994ndash1996 CSFII
Exposure F
actors Handbook
Chapter 12mdash
Intake of Grain Products
Page E
xposure Factors H
andbook 12-30
September 2011
Table 12-22 Per Capita Intake of Cooked Cereals Based on 1994ndash1996 1998 CSFII (gkg-day as-consumed)
Population Group Percent Consuming
Percentile Mean SE 1st 5th 10th 25th 50th 75th 90th 95th 99th Max
Whole Population Age Group lt5 months 6 to 12 months lt1 year 1 to 2 years 3 to 5 years 6 to 11 years 12 to 19 years 20 to 39 years 40 to 69 years ge70 years Season Fall Spring Summer Winter Race Asian Black American IndianAlaska Native OtherNA White Region Midwest Northeast South West Urbanization Central City Suburban Non-metropolitan
104
09 166
83 184 160
87 56 62
116 245
120
91 93
111
44 201
76 76 93
96 90 124
94
116 99 97
04
01 19 09 16 13 05 02 01 03 06
04 03 03 04
02 07 03 04 03
03 03 04 04
04 03 03
004
054 118 082 029 028 017 009 005 003 007
008 006 008 008
020 010 032 030 004
007 010 006 009
008 005 007
00
00 00 00 00 00 00 00 00 00 00
00 00 00 00
00 00 00 00 00
00 00 00 00
00 00 00
00
00 00 00 00 00 00 00 00 00 00
00 00 00 00
00 00 00 00 00
00 00 00 00
00 00 00
00
00 00 00 00 00 00 00 00 00 00
00 00 00 00
00 00 00 00 00
00 00 00 00
00 00 00
00
00 00 00 00 00 00 00 00 00 00
00 00 00 00
00 00 00 00 00
00 00 00 00
00 00 00
00
00 00 00 00 00 00 00 00 00 00
00 00 00 00
00 00 00 00 00
00 00 00 00
00 00 00
00
00 00 00 00 00 00 00 00 00 00
00 00 00 00
00 00 00 00 00
00 00 00 00
00 00 00
06
00 94 00 69 53 00 00 00 09 22
11 00 00 09
00 22 00 00 00
00 00 11 00
09 00 00
23
00 161
57 107
79 40 10 11 19 34
26 20 21 25
00 44 21 20 20
21 22 26 23
26 21 23
72
00 228 228 206 161
94 43 33 44 56
81 64 69 74
53 109
58 106
61
57 59 79 80
81 69 57
725
56 228 228 339 725 241 106
92 87 106
459 209 725 445
161 339 123 725 459
459 725 317 395
725 459 269
SE
Source
= Standard error
US EPA analysis of the 1994ndash1996 CSFII
Exposure F
actors Handbook
Chapter 12mdash
Intake of Grain Products
Exposure F
actors Handbook
Page Septem
ber 2011 12-31
Table 12-23 Per Capita Intake of Ready-to-Eat Cereals a Based on 1994ndash1996 1998 CSFII (gkg-day as-consumed)
Population Group Percent Consuming
Percentile Mean SE 1st 5th 10th 25th 50th 75th 90th 95th 99th Max
Whole Population Age
lt5 months 6 to 12 months lt1 year 1 to 2 years 3 to 5 years 6 to 11 years 12 to 19 years 20 to 39 years 40 to 69 years ge70 years Season Fall Spring Summer Winter Race Asian Black American IndianAlaska Native OtherNA White Region Midwest Northeast South West Urbanization Central City Suburban Non-metropolitan
397
00 199
93 649 698 640 457 305 318 479
391 401 396 399
254 340 331 333 417
422 423 374 384
400 412 358
03
00 01 01 10 11 08 04 02 02 02
03 03 03 03
02 03 03 03 03
04 04 03 03
03 04 03
001
000 007 005 004 004 003 002 001 001 001
002 002 002 002
005 002 009 004 001
002 002 001 002
001 001 001
00
00 00 00 00 00 00 00 00 00 00
00 00 00 00
00 00 00 00 00
00 00 00 00
00 00 00
00
00 00 00 00 00 00 00 00 00 00
00 00 00 00
00 00 00 00 00
00 00 00 00
00 00 00
00
00 00 00 00 00 00 00 00 00 00
00 00 00 00
00 00 00 00 00
00 00 00 00
00 00 00
00
00 00 00 00 00 00 00 00 00 00
00 00 00 00
00 00 00 00 00
00 00 00 00
00 00 00
00
00 00 00 07 09 06 00 00 00 00
00 00 00 00
00 00 00 00 00
00 00 00 00
00 00 00
04
00 00 00 15 17 12 06 03 02 04
04 04 04 05
01 04 04 03 05
05 05 04 04
05 05 04
10
00 03 00 25 26 20 11 07 06 07
11 10 11 10
08 10 08 11 11
11 11 10 11
11 11 08
15
00 10 03 33 33 25 15 10 09 09
16 15 16 14
12 15 14 17 15
16 16 13 16
15 16 12
29
00 18 17 49 48 40 22 17 14 15
29 29 30 27
27 32 26 30 28
29 29 28 31
28 31 26
101
00 26 26 88 101
80 64 53 52 27
88 77 78 101
49 101
44 66 88
80 80 101
88
101 80 88
a SE
Source
Includes dry ready-to-eat corn rice wheat and bran cereals in the form of flakes puffs etc = Standard error
US EPA analysis of the 1994ndash1996 CSFII
Exposure F
actors Handbook
Chapter 12mdash
Intake of Grain Products
Page E
xposure Factors H
andbook 12-32
September 2011
Table 12-24 Per Capita Intake of Baby Cereals Based on 1994ndash1996 1998 CSFII (gkg-day as-consumed)
Population Group Percent Consuming
Percentile Mean SE 1st 5th 10th 25th 50th 75th 90th 95th 99th Max
Whole Population Age
lt5 months 6 to 12 months lt1 year 1 to 2 years 3 to 5 years 6 to 11 years 12 to 19 years 20 to 39 years 40 to 69 years ge70 years Season Fall Spring Summer Winter Race Asian Black American IndianAlaska Native OtherNA White Region Midwest Northeast South West Urbanization Central City Suburban Non-metropolitan
10
408 678 534
62 03 01 00 00 01 00
09 12 08 11
07 10 06 17 10
11 12 09 09
11 11 08
00
08 25 16 02 00 00 00 00 00 00
00 00 00 00
00 00 00 01 00
00 00 00 00
00 00 00
003
024 045 027 010 006 000 000 000 000 000
007 005 006 006
004 012 004 020 003
008 004 005 006
006 004 006
00
00 00 00 00 00 00 00 00 00 00
00 00 00 00
00 00 00 00 00
00 00 00 00
00 00 00
00
00 00 00 00 00 00 00 00 00 00
00 00 00 00
00 00 00 00 00
00 00 00 00
00 00 00
00
00 00 00 00 00 00 00 00 00 00
00 00 00 00
00 00 00 00 00
00 00 00 00
00 00 00
00
00 00 00 00 00 00 00 00 00 00
00 00 00 00
00 00 00 00 00
00 00 00 00
00 00 00
00
00 08 02 00 00 00 00 00 00 00
00 00 00 00
00 00 00 00 00
00 00 00 00
00 00 00
00
10 28 17 00 00 00 00 00 00 00
00 00 00 00
00 00 00 00 00
00 00 00 00
00 00 00
00
24 69 41 00 00 00 00 00 00 00
00 00 00 00
00 00 00 00 00
00 00 00 00
00 00 00
00
31 113
73 08 00 00 00 00 00 00
00 00 00 00
00 00 00 00 00
00 00 00 00
00 00 00
01
88 211 197
58 00 00 00 00 00 00
00 06 00 03
00 00 00 12 00
03 05 00 00
03 01 00
376
266 376 376 125
38 01 00 00 03 00
211 266 260 376
21 376
09 266 260
211 125 376 266
376 211 260
SE
Source
= Standard error
US EPA analysis of the 1994ndash1996 CSFII
Exposure F
actors Handbook
Chapter 12mdash
Intake of Grain Products
Exposure F
actors Handbook
Page Septem
ber 2011 12-33
Table 12-25 Quantity (as-consumed) of Grain Products Consumed per Eating Occasion and the Percentage of Individuals Using These Foods in 2 Days
Indiv Using Quantity Consumed per Consumers Only Food at Least Eating Occasion Quantity Consumed per Eating Occasion at Specified Percentiles
Food Category Once in 2 days (grams) (grams) Average SE 5th 10th 25th 50th 75th 90th 95th
White bread 596 50 1 21 24 33 46 52 78 104 Whole grain and wheat bread 281 50 1 24 25 37 50 56 72 92 Rolls 480 58 1 27 33 43 48 70 89 110 Biscuits 109 61 1 19 19 35 57 76 104 139 Tortillas 155 60 1 14 21 32 48 79 107 135 Quick breads and muffins 125 82 2 21 28 52 60 94 142 187 Doughnuts and sweet rolls 124 77 1 26 36 47 65 93 133 164 Crackers 174 26 1 6 9 12 18 30 47 62 Cookies 307 40 1 9 12 20 31 50 75 96 Cake 162 92 3 22 28 41 77 116 181 217 Pie 85 150 3 52 72 102 143 168 246 300 Pancakes and waffles 103 85 3 21 35 42 75 109 158 205 Cooked cereal 103 248 6 81 117 157 233 291 455 484 Oatmeal 61 264 6 116 117 176 232 333 454 473 Ready-to-eat cereal 406 54 1 18 24 30 46 67 93 113 Corn flakes 81 46 1 17 22 25 37 56 75 100 Toasted oat rings 68 42 1 14 16 27 38 54 65 83 Rice 280 150 3 27 40 76 131 192 312 334 Pasta 360 162 3 26 43 73 133 210 318 420 Macaroni and cheese 85 244 9 53 81 121 191 324 477 556 Spaghetti with tomato sauce 80 436 15 122 124 246 371 494 740 983 Pizza 199 169 5 36 52 78 140 214 338 422 SE = Standard error
Source Smiciklas-Wright et al (2002) (based on 1994ndash1996 CSFII data)
Exposure F
actors Handbook
Chapter 12mdash
Intake of Grain Products
Page E
xposure Factors H
andbook 12-34
September 2011
Table 12-26 Quantity (as-consumed) of Grain Products Consumed per Eating Occasion and Percentage of Individuals Using These Foods in 2 Days by Sex and Age
Food Category
Quantity Consumed per Eating Occasion (grams) 2 to 5 years 6 to 11 years 12 to 19 years
Males and Females (N = 2109)
Males and Females Males (N = 1432) (N = 696)
Females (N = 702)
PC Mean SE PC Mean SE PC Mean SE PC Mean SE White bread
Whole grain and wheat bread Rolls Biscuits
Tortillas Quick breads and muffins
Doughnuts and sweet rolls Crackers
Cookies Cake
Pie Pancakes and waffles Cooked cereal
Oatmeal Ready-to-eat cereal Corn flakes Toasted oat rings Rice
Pasta Macaroni and cheese Spaghetti with tomato sauce
Pizza Corn chips
Popcorn
669 243 400
83 146
96 113
254 510 146
29 191 168 104 729
112 206 296 494 178 168 237 196
116
34 37 39 38 32 55 59 17 28 70 76 49
211 221
33 33 30 84 90 159 242
86 29 20
a
1 1 2 2 4 2 1 1 3 8 1
10 9 1 2 1 3 3 8 11 3 2 1
671 205 535
97 164
96 134 172 467 197
56 215
90 57 673 131 125 246 414 132
115 328 256 127
42 44 48 48 47 67 69 26 37 79
116 77 245 256
47 42 45 124 130 217 322 108
33 31
1 1 1 3 2 5 2 2 2 4 8 3
14 19
1 2 2 6 5
13 18
6 2 2
613 145 619 122 229
110 173 106 290 151
66 135
52 24 456 104
73 242 334
75 101 396 269
78
56 60 69 72 76 125 102
39 53 99 188
96 310b
348b
72 62 62 203 203 408 583 205
58 54
1 2 2 4 5
12 12
5 3 9
15 6
29b
45b
3 4 5
10 9
46 46 13
5 5
579 176 488 103 201
110 138 142 318 155
48 82 60 23 463
87 81 288 378 107
85 305 251 105
47 53 51 55 56 79 78 26 42 85
138b
74 256b
321b
52 49 42 157 155 260 479 143
44 37
1 2 1 4 3
10 5 3 2 8
12b
5 31b
40b
2 4 3
10 9
30 51
8 3 4
Exposure F
actors Handbook
Chapter 12mdash
Intake of Grain Products
Exposure F
actors Handbook
Page Septem
ber 2011 12-35
Exposure F
actors Handbook
Chapter 12mdash
Intake of Grain Products
Page E
xposure Factors H
andbook 12-36
September 2011
Table 12-26 Quantity (as-consumed) of Grain Products Consumed per Eating Occasion and Percentage of Individuals Using These Foods in 2 Days by Sex and Age (continued)
Food Category
Quantity Consumed per Eating Occasion (g) 20 to lt40 years 40 to lt60 years gt60 years
Males Females (N = 1543) (N = 1449)
Males Females (N = 1663) (N = 1694)
Males Females (N = 1545) (N = 1429)
PC Mean SE PC Mean SE PC Mean SE PC Mean SE PC Mean SE PC Mean SE White bread
Whole grain and wheat bread Rolls Biscuits
Tortillas Quick breads and muffins
Doughnuts and sweet rolls Crackers
Cookies Cake
Pie Pancakes and waffles Cooked cereal
Oatmeal Ready-to-eat cereal Corn flakes Toasted oat rings Rice
Pasta Macaroni and cheese
Spaghetti with tomato sauce Pizza
Corn chips Popcorn
630 253 620
115 206
80 133
119 208 135
58 80 52 27 269
65 42 308 371
78 86 237 162
81
63 63 73 73 79 93 94 36 56
113 161 126 313 360a
77 73 62 199 214 301 630 253
61 63
2 1 4 3 4 7 5 3 4 6 7
15 30 42a
3 6 4 9 8
19 48 12
5 6
549 252 464
94 201
113 112
156 265 149
72 74 73 37 347
53 54 321 371
78 78 202 179
97
47 48 53 55 53 79 68 28 39 94 150
80 219 258
55 43 42 139 155 235 385 150
35 35
1 1 1 2 2 5 2 2 2 7 9 6 11
17 1 2 2 6 6
19 22
6 2 2
597 328 479 134 134 157 134 166 276 165
118 75 97 60 298
59 48 294 343
61 55 130 128
96
59 57 65 80 67 93 88 30 47 108 162
117 300 332
68 49 46 167 208 302 543 220
47 50
2 1 1 3 3 7 4 1 2 6 6 8
16 16
2 3 2 5 7
31 59 13
4 4
553 323 434
112 127 149
110 175 290 168
99 80 103
62 297
52 41 288 347
60 54 145 120 109
46 46 52 56 52 72 72 24 36 83 151
74 243 242
51 40 35 130 140 210 386 147
33 39
1 2 1 2 2 4 4 1 1 4 8 5 11
10 1 3 2 4 5
12 18
8 2 3
593 398 378 130
42 174
114 256 297 192 164 108 209 136 446 124
43 231 279
71 50 53 48 61
51 48 54 58 47 86 65 23 40 85 154
99 255 257
53 37 36 147 167 230 450 187
30 52
1 1 1 3 4 5 2 1 2 4 7 5 8
10 1 2 3 6 7
13 22 18
3 4
548 431 306
98 54 183 104 259 322 183 133
82 202 129 440 104
49 214 279
65 45 47 53 76
41 41 43 48 41 72 56 17 30 87 137
68 216 224
41 30 27
118 132 215 379 109
21 34
1 1 1 3 2 4 2 1 1 7 5 4 8
10 1 1 2 5 5
18 33
8 2 3
a Indicates a SE value that is greater than 0 but less than 05 b Indicates a statistic that is potentially unreliable because of small sample size or large coefficient of variation N = Sample size
PC = Percent consuming at least once in 2 days SE = Standard error of the mean
Source Smiciklas-Wright et al (2002) (based on 1994ndash1996 CSFII data)
Exposure Factors Handbook
Chapter 12mdashIntake of Grain Products
Table 12-27 Consumption of Major Food Groups by Older Adults Median Daily Servings (and ranges) by Demographic and Health Characteristics
Subject Characteristic N Bread Cereal Rice and Pasta (servingsday) Sex a
Females 80 27 (09ndash65) Males 50 36 (14ndash73)
Ethnicity African American 44 33 (14ndash64) European American 47 32 (09ndash68) Native American 39 29 (11ndash73)
Age 70 to 74 years 42 33 (11ndash63) 75 to 79 years 36 30 (09ndash68) 80 to 84 years 36 32 (15ndash64) gt85 years 16 36 (16ndash73)
Marital Status Married 49 33 (11ndash58) Not Married 81 30 (09ndash73)
Education 8th grade or less 37 31 (11ndash73) 9th to 12th grades 47 33 (11ndash68) gtHigh School 46 32 (09ndash65)
Dentures Yes 83 33 (11ndash64) No 47 31 (09ndash73)
Chronic Diseases 0 7 41 (22ndash64) 1 31 33 (09ndash73) 2 56 31 (11ndash58) 3 26 37 (11ndash58) gt4 10 29 (14ndash53)
Weightb
le130 pounds 18 31 (11ndash54) 131 to 150 pounds 32 33 (09ndash52) 151 to 170 pounds 27 31 (14ndash73) 171 to 190 pounds 22 36 (14ndash62) ge191 pounds 29 30 (11ndash68)
a p lt 005 b 2 missing values N = Number of subjects
Source Vitolins et al (2002)
Exposure Factors Handbook Page September 2011 12-37
Exposure Factors Handbook
Chapter 12mdashIntake of Grain Products
Table 12-28 Characteristics of the Feeding Infant and Toddlers Study (FITS) Sample Population Sample Size Percentage of Sample
Sex Males Females
1549 1473
513 487
Age of Child 4 to 6 months 7 to 8 months 9 to 11 months 12 to 14 months 15 to 18 months 19 to 24 months
862 483 679 374 308 316
285 160 225 124 102 104
Childrsquos Ethnicity Hispanic or Latino Non-Hispanic or Latino Missing
367 2641
14
121 874 05
Childrsquos Race White Black Other
2417 225 380
800 74 126
Urbanicity Urban Suburban Rural Missing
1389 1014 577 42
460 336 191 13
Household Income Under $10000 $10000 to $14999 $15000 to $24999 $25000 to $34999 $35000 to $49999 $50000 to $74999 $75000 to $99999 $100000 and Over Missing
48 48
221 359 723 588 311 272 452
16 16 73 119 239 195 103 90 149
Receives WIC Yes No Missing
821 2196
5
272 726 02
Sample Size (Unweighted) 3022 1000 WIC = Special Supplemental Nutrition Program for Women Infants and Children
Source Devaney et al (2004)
Page Exposure Factors Handbook 12-38 September 2011
Table 12-29 Percentage of Infants and Toddlers Consuming Different Types of Grain Products Percentage of Infants and Toddlers Consuming at Least Once in a Day
Food GroupFood 4 to 6 7 to 8 9 to 11 12 to 14 15 to 18 19 to 24 Months Months Months Months Months Months
Any Grain or Grain Product 658 915 975 978 986 992 Infant Cereals 648 812 638 239 92 31 Non-infant Cerealsa 06 183 443 589 605 519
Not Pre-sweetened 05 170 370 445 406 319 Pre-sweetenedb 00 18 90 177 264 227
Breads and Rollsc 06 99 245 473 527 531 Crackers Pretzels Rice Cakes 30 162 334 452 464 447 Cereal or Granola Bars 00 11 34 98 100 97 Pancakes Waffles French Toast 01 08 75 151 161 154 Rice and Pastad 23 45 182 262 390 359 Other 02 01 27 28 25 45 Grains in Mixed Dishes 04 53 241 483 520 551 Sandwiches 00 11 86 215 258 258 Burrito Taco Enchilada Nachos 00 00 10 45 28 21 Macaroni and Cheese 02 16 49 146 150 150 Pizza 01 07 22 68 90 94 Pot PieHot Pocket 00 09 05 20 10 18 Spaghetti Ravioli Lasagna 01 18 99 153 121 88 a Includes both ready-to-eat and cooked cereals b Defined as cereals with more than 211 grams sugar per 100 grams c Does not include bread in sandwiches Sandwiches are included in mixed dishes d Does not include rice or pasta in mixed dishes
Source Fox et al (2004)
Exposure Factors Handbook
Chapter 12mdashIntake of Grain Products
Exposure Factors Handbook Page September 2011 12-39
Table 12-30
a Characteristics of Women Infants and Children (WIC) Participants and Non-Participants (percentages)
Infants 4 to 6 month Infants 7 to 11 month Toddlers 12 to 24 month WIC
Participant Non-Participant WIC
Participant Non-Participant WIC
Participant Non-Participant Sex Males 55 Females 45
Childrsquos Ethnicity Hispanic or Latino 20 Non-Hispanic or Latino 80
Childrsquos Race White 69 Black 15 Other 22
Child in Daycare Yes 39 No 61 Age of Mother 14 to 19 years 18 20 to 24 years 33 25 to 29 years 29 30 to 34 years 9 gt35 years 9 Missing 2
Motherrsquos Education 11th Grade or Less 23 Completed High School 35 Some Postsecondary 33 Completed College 7 Missing 2
Parentrsquos Marital Status Married 49 Not Married 50 Missing 1
Mother or Female Guardian Works Yes 46 No 53 Missing 1
54 46
b
11 89
b 84
4 11
38 62
b 1
13 29 33 23
2 b 2
19 26 53
1 b
93 7 1
51 48
1
55 45
24 76
63 17 20
34 66
13 38 23 15
11 1 15 42 32
9 2 57 42
1 45 54
1
51 49
b 8
92 b
86 5 9 b
46 54
b 1 11
30 36 21
1 b 2
20 27 51
0 b
93 7 0 b
60 40
0
57 43
22 78
67 13 20
43 57
9
33 29 18
11 0
17 42 31
9 1
58 41
1
55 45
0
52 48
b 10 89
b 84
5 11
c
53 47
b 1
14 26 34 26
1 b 3
19 28 48
2 b
88 11 1
c
61 38
1
Exposure Factors Handbook
Chapter 12mdashIntake of Grain Products
Page Exposure Factors Handbook 12-40 September 2011
c
Table 12-30 Characteristics of Women Infants and Children (WIC) Participants and Non-Participantsa
(percentages) (continued) Infants 4 to 6 months Infants 7 to 11 months Toddlers 12 to 24 months
WIC WIC WIC Participant Non-Participant Participant Non-Participant Participant Non-Participant
Urbanicity c c c
Urban 34 55 37 50 35 48 Suburban 36 31 31 34 35 35 Rural 28 13 30 15 28 16 Missing 2 1 2 1 2 2
Sample Size (Unweighted) 265 597 351 808 205 791 a χ2 tests were conducted to test for statistical significance in the differences between WIC participants and nonshy
participants within each age group for each variable The results of χ2 tests are listed next to the variable under the column labeled non-participants for each of the three age groups
b = p lt 005 non-participants significantly different from WIC participants on the variable = p lt 001 non-participants significantly different from WIC participants on the variable
WIC = Special Supplemental Nutrition Program for Women Infants and Children
Source Ponza et al (2004)
Table 12-31 Food Choices for Infants and Toddlers by Women Infants and Children (WIC) Participation Status
Infants 4 to 6 months Infants 7 to 11 months Toddlers 12 to 24 months WIC Non- WIC Non- WIC Non-
Participant Participant Participant Participant Participant Participant 697 Infant Cereals 697 625 747 135 92
Non-infant Cereals Total 09 05 217 385a 581 560
Not Pre-sweetened 05 05 187 329a 437 363 Pre-sweetened 00 00 40 69 177 241
Grains in Combination Foods 09 01 188 147 503 529 Sample Size (unweighted) 265 597 351 808 205 791 a = p lt 001 non-participants significantly different from WIC participants WIC = Special Supplemental Nutrition Program for Women Infants and Children
Source Ponza et al (2004)
Exposure Factors Handbook
Chapter 12mdashIntake of Grain Products
Exposure Factors Handbook Page September 2011 12-41
Table 12-32 Average Portion Sizes per Eating Occasion of Grain Products Commonly Consumed by Infants From the 2002 Feeding Infants and Toddlers Study
4 to 5 months 6 to 8 months 9 to 11 months Reference Food Group (N = 624) (N = 708) (N = 687) Unit Mean plusmn SE Infant cereal dry tablespoon 31 plusmn 014 45 plusmn 014 52 plusmn 018 Infant cereal jarred tablespoon - 56 plusmn 026 74 plusmn 034 Ready-to-eat cereal tablespoon - 23 plusmn 034 34 plusmn 021 Crackers ounce - 02 plusmn 002 03 plusmn 001 Crackers saltine - 22 plusmn 014 27 plusmn 012 Bread slice - 05 plusmn 010 08 plusmn 006 - = Cell size was too small to generate a reliable estimate N = Number of respondents SE = Standard error of the mean
Source Fox et al (2006)
Exposure Factors Handbook
Chapter 12mdashIntake of Grain Products
Table 12-33 Average Portion Sizes per Eating Occasion of Grain Products Commonly Consumed by Toddlers From the 2002 Feeding Infants and Toddlers Study
Food Group Reference Unit 12 to 14 months
(N = 371) 15 to 18 months
(N = 312) 19 to 24 months (N = 320)
Mean plusmn SE Bread slice 08 plusmn 004 09 plusmn 005 09 plusmn 005 Rolls ounce 09 plusmn 011 10 plusmn 010 09 plusmn 015 Ready-to-eat cereal cup 03 plusmn 002 05 plusmn 003 06 plusmn 004 Hot cereal prepared cup 06 plusmn 005 06 plusmn 005 07 plusmn 005 Crackers ounce 03 plusmn 002 04 plusmn 002 04 plusmn 002 Crackers saltine 33 plusmn 022 35 plusmn 022 37 plusmn 022 Pasta cup 04 plusmn 004 04 plusmn 004 05 plusmn 005 Rice cup 03 plusmn 004 04 plusmn 005 04 plusmn 005 Pancakes and waffles 1 (4-inch diameter) 10 plusmn 008 14 plusmn 021 14 plusmn 017 N = Number of respondents SE = Standard error of the mean
Source Fox et al (2006)
Page Exposure Factors Handbook 12-42 September 2011
c
Table 12-34 Percentage of Hispanic and Non-Hispanic Infants and Toddlers Consuming Different Types of Grain Products on a Given Day Age 4 to 5 months Age 6 to 11 months Age 12 to 24 months
Hispanic Non-Hispanic Hispanic Non-Hispanic Hispanic Non-Hispanic (N = 84) (N = 538) (N = 163) (N = 1228) (N = 124) (N = 871)
Any Grain or Grain Product Infant Cereal Non-infant Cereal Breadsb
Tortillas Crackers Pretzels Rice Cakes Pancakes Waffles French Toast Rice and Pastad
Rice Grains in Mixed Dishes
Sandwiches Burrito Taco Enchilada Nachos
565 552
-14c
14c
13c
------
569 565
----------
950 741 185a
182 40c
278 14c
201a
159e
159 40c
13c
935 736 292 151
-225 43
103 47
130 46 -
971 159 453 440 67a c
356 130 443
269a c
388a
242 21c
989 93
578 529 06c
469 160 329 130 544 249 30
Macaroni and Cheese - - 30c 31 101 155
Pizza - - - 14 10c e 97
Spaghetti Ravioli Lasagna - - 83c 46 93c 121 a = Significantly different from non-Hispanic at p lt 005 b Does not include bread in sandwiches Sandwiches are included in mixed dishes Includes tortillas also shown
separately = Statistic is potentially unreliable because of a high coefficient of variation
d Does not include rice or pasta in mixed dishes Includes rice (eg white brown wild and Spanish rice without meat) and pasta (eg spaghetti macaroni and egg noodles) Rice is also shown separately
e = Significantly different from non-Hispanic at p lt 001 - = Less than 1 of the group consumed this food on a given day N = Sample size
Source Mennella et al (2006)
Exposure Factors Handbook
Chapter 12mdashIntake of Grain Products
Exposure Factors Handbook Page September 2011 12-43
Exposure Factors Handbook
Chapter 12mdashIntake of Grain Products
Table 12-35 Mean Moisture Content of Selected Grain Products Expressed as Percentages of Edible Portions (grams per 100 grams of edible portion)
Food Moisture Content Comments Raw Cooked Barley―pearled 1009 6880 Corn―grain―endosperm 1037 -Corn―grain―bran 471 - crude Millet 867 7141 Oats 822 -Rice―white―long-grained 1162 6844 Rye 1095 -Rye―flour―medium 985 -Sorghum 920 -Wheat―hard white 957 -Wheat―germ 1112 - crude Wheat―bran 989 - crude Wheat―flour―whole grain 1027 -- Indicates that the grain product was not assessed for water content under these conditions
Source USDA (2007)
Page Exposure Factors Handbook 12-44 September 2011
- TABLE OF CONTENTS
- LIST OF TABLES
- 12 INTAKE OF GRAIN PRODUCTS
-
- 121 INTRODUCTION
- 122 RECOMMENDATIONS
- 123 INTAKE STUDIES
-
- 1231 Key Grain Intake Study
-
- 12311 US EPA Analysis of Consumption Data From 2003minus2006 National Health and Nutrition Examination Survey (NHANES)
-
- 1232 Relevant Grain Intake Studies
-
- 12321 USDA (1996a b 1993 1980)mdashFood and Nutrient Intakes of Individuals in 1 Day in the United States
- 12322 USDA (1999b)mdashFood Consumption Prices and Expenditures 1970minus1997
- 12323 USDA (1999a)mdashFood and Nutrient Intakes by Children 1994minus1996 1998 Table Set 17
- 12324 US EPA Analysis of Continuing Survey of Food Intake by Individuals (CSFII) 1994minus1996 1998
- 12325 Smiciklas-Wright et al (2002)mdashFoods Commonly Eaten in the United States Quantities Consumed per Eating Occasion and in a Day 1994minus1996
- 12326 Vitolins et al (2002)mdashQuality of Diets Consumed by Older Rural Adults
- 12327 Fox et al (2004)mdashFeeding Infants and Toddlers Study What Foods Are Infants and Toddlers Eating
- 12328 Ponza et al (2004)mdashNutrient Food Intakes and Food Choices of Infants and Toddlers Participating in WIC
- 12329 Fox et al (2006)mdashAverage Portion of Foods Commonly Eaten by Infants and Toddlers in the United States
- 123210 Mennella et al (2006)mdashFeeding Infants and Toddlers Study The Types of Foods Fed to Hispanic Infants and Toddlers
-
- 124 CONVERSION BETWEEN WET- AND DRY-WEIGHT INTAKE RATES
- 125 REFERENCES FOR CHAPTER 12
-

Exposure F
actors Handbook
Chapter 12mdash
Intake of Grain Products
Table 12-4 Consumer-Only Intake of Total Grains Based 2003ndash2006 NHANES (gkg-day edible portion uncooked weight)
Population Group N Mean SE Percentiles
1st 5th 10th 25th 50th 75th 90th 95th 99th Max
Whole Population 16556 26 004 03 06 08 13 20 32 51 67 99 Age Group
Birth to 1 year 644 41 018 01 04 08 18 35 59 81 103 139 1 to 2 years 1050 64 016 16 24 30 42 58 84 105 124 159 3 to 5 years 977 62 013 20 24 33 44 59 76 96 111 132 6 to 12 years 2256 44 009 06 14 18 28 41 55 74 82 111 13 to 19 years 3450 24 005 04 07 10 15 21 32 42 50 75 20 to 49 years 4288 22 004 03 06 08 12 19 28 39 46 71 Females 13 to 49 years 4102 19 003 02 05 08 11 17 25 34 39 55 50 years and older 3891 17 003 03 05 07 10 15 21 29 35 52
Race Mexican American 4341 30 005 04 08 11 16 24 39 59 72 106 Non-Hispanic Black 4236 24 004 02 05 07 11 18 29 50 69 103 Non-Hispanic White 6694 25 005 03 06 08 13 20 31 49 65 96 Other Hispanic 548 28 014 04 07 10 15 21 34 54 71 98 Other RacemdashIncluding Multiple Races 737 31 011 03 07 09 15 25 39 60 75 111
349
349 211 156 145 143 150 98 94
178 211 349 153 175
N = Sample size SE = Standard error Max = Maximum value Estimates are less statistically reliable based on guidance published in the Joint Policy on Variance Estimation and Statistical Reporting
Standards on NHANES III and CSFII Reports NHISNCHS Analytical Working Group Recommendations (NCHS 1993)
Source Based on US EPA analysis of 2003ndash2006 NHANES
Page E
xposure Factors H
andbook 12-14
September 2011
Table 12-5 Per Capita Intake of Individual Grain Products Based 2003ndash2006 NHANES (gkg-day edible portion uncooked weight)
Population Group N
Consuming Mean SE
Consuming Mean SE
Cereal Rice Whole Population
Age Group Birth to 1 year 1 to 2 years 3 to 5 years 6 to 12 years 13 to 19 years 20 to 49 years Females 13 to 49 years 50 years and older Race Mexican American Non-Hispanic Black Non-Hispanic White Other Hispanic Other RacemdashIncluding Multiple Races
16783
865 1052
978 2256 3450 4289 4103 3893
4450 4265 6757
562
749
100
81 100 100 100 100 100 100 100
100 100 100
99
100
37
51 87 86 63 39 32 29 22
43 36 36 39
41
004
030 018 017 010 008 004 004 004
007 006 005 020
012
88 69 87 91 89 85 89 86 89
87 86 88 92
90
02
11 06 05 03 02 03 02 01
03 03 02 06
08
001
008 006 006 003 001 001 001 001
002 002 001 005
008 N
SE
Source
= Sample size = Standard error
Based on US EPA analysis of 2003ndash2006 NHANES
Exposure Factors Handbook
Chapter 12mdashIntake of Grain Products
Exposure Factors Handbook Page September 2011 12-15
Table 12-6 Consumer-Only Intake of Individual Grain Products Based 2003ndash2006 NHANES (gkg-day edible portion uncooked weight)
Population Group N Mean SE N Mean SE
Cereal Rice Whole Population
Age Group Birth to 1 year 1 to 2 years 3 to 5 years 6 to 12 years 13 to 19 years 20 to 49 years Females 13 to 49 years 50 years and older Race Mexican American Non-Hispanic Black Non-Hispanic White Other Hispanic Other RacemdashIncluding Multiple Races
16613
696 1051 978 2256 3450 4289 4103 3893
4372 4244 6707 550 740
37
63 87 86 63 39 32 29 22
43 36 36 39 41
004
031 018 017 010 008 004 004 004
007 006 005 020 013
14447
552 928 875 2000 2898 3812 3511 3382
3757 3645 5887 491 667
03
15 07 05 03 02 03 02 02
03 03 02 06 08
001
010 007 006 003 002 002 002 001
002 002 001 005 008
N SE
Source
= Sample size = Standard error
Based on US EPA analysis of 2003ndash2006 NHANES
Exposure Factors Handbook
Chapter 12mdashIntake of Grain Products
Page Exposure Factors Handbook 12-16 September 2011
Exposure Factors Handbook
Chapter 12mdashIntake of Grain Products
Table 12-7 Mean Grain Intake per Individual in a Day by Sex and Age (gday as-consumed)a for 1977minus1978 Group Age (years) Total Grains Breads Rolls
Biscuits Other Baked
Goods Cereals Pasta Mixtures Mainly Grainb
Males and Females lt1 1 to 2 3 to 5 6 to 8
42 158 181 206
4 27 46 53
5 24 37 56
30 44 54 60
3 63 45 38
Males 9 to 11 12 to 14 15 to 18 19 to 22 23 to 34 35 to 50 51 to 64 65 to 74 ge75
238 288 303 253 256 234 229 235 196
67 76 91 84 82 82 78 71 70
56 80 77 53 60 58 57 60 50
51 57 53 64 40 44 48 69 58
64 74 82 52 74 50 46 35 19
Females 9 to 11 12 to 14 15 to 18 19 to 22 23 to 34 35 to 50 51 to 64 65 to 74 ge75
214 235 196 161 163 161 155 175 178
58 57 57 44 49 49 52 57 54
59 61 43 36 38 37 40 42 44
44 45 41 33 32 32 36 47 58
53 72 55 48 44 43 27 29 22
Males and FemalesmdashAll Ages 204 62 49 44 49 a Based on USDA Nationwide Food Consumption Survey 1977ndash1978 data for 1 day b Includes mixtures containing grain as the main ingredient
Source USDA (1980)
Exposure Factors Handbook Page September 2011 12-17
Exposure Factors Handbook
Chapter 12mdashIntake of Grain Products
Page Exposure Factors Handbook 12-18 September 2011
Table 12-8 Mean Grain Intakes per Individual in a Day by Sex and Age (gday as-consumed)a for 1987minus1988
Group Age (years) Total Grains Yeast Breads and
Rolls
Quick Breads Pancakes
French Toast
Cakes Cookies Pastries
Pies
Crackers Popcorn
Pretzels Corn Chips
Cereals and Pastas
Mixtures Mostly Grainb
Males and Females le5 167 30 8 22 4 52 51
Males 6 to 11 268 51 16 37 8 74 83
12 to 19 304 65 28 45 10 72 82 ge20 272 65 20 37 8 58 83
Females 6 to 11 231 43 19 30 6 66 68
12 to 19 239 45 13 29 7 52 91 ge20 208 45 14 28 6 53 62
All Individuals 237 52 16 32 7 57 72 a Based on USDA Nationwide Food Consumption Survey 1987ndash1988 data for 1 day b Includes mixtures containing grain as the main ingredient
Source USDA (1993)
Table 12-9 Mean Grain Intakes per Individual in a Day by Sex and Age (gday as-consumed)a for 1994minus1995
Group Age (years)
Total Grains Yeast Breads and Rolls
Quick Breads Pancakes
French Toast
Cakes Cookies
Pastries Pies
Crackers Popcorn
Pretzels Corn Chips
Cereals and Pastas
Mixtures Mostly Grainb
1994 1995 1994 1995 1994 1995 1994 1995 1994 1995 1994 1995 1994 1995 Males and Females le5 213 210 26 28 11 11 22 23 8 7 58 57 89 84
Males 6 to 11 12 to 19 ge20
285 417 357
341 364 365
51 53 64
45 54 61
15 30 22
21 21 24
42 54 43
46 43 46
12 17 13
18 22 15
66 82 86
97 84 91
101 180 128
115 138 128
Females 6 to 11 12 to 19 ge20
260 317 254
286 296 257
43 40 44
46 37 45
16 16 16
21 14 15
37 39 33
51 35 34
11 17 9
14 16 10
57 63 59
54 52 69
94 142 92
100 143 83
All Individuals 300 303 50 49 18 19 38 39 12 13 70 76 112 107 a Based on USDA CSFII 1994 and 1995 data for 1 day b Includes mixtures containing grain as the main ingredient
Source USDA (1996a b)
Exposure Factors Handbook
Chapter 12mdashIntake of Grain Products
Table 12-10 Per Capita Consumption of Flour and Cereal Products in 1997
Food Item Per Capita Consumption
(gday)a
Total Wheat Flourb
Rye Flour Ricec
Total Corn Productsd
Oat Productse
Barley Productsf
Total Flour and Cereal Productsg
186 07 24 29 8
09 249
a Original data were presented in lbsyear data were converted to gday by multiplying by a factor of 454 glb and dividing by 365 dayyear Consumption of most items at the processing level Excludes quantities used in alcoholic beverages and fuel
b Includes white whole wheat and durum flour c Milled basis d Includes corn flour and meal hominy and grits and corn starch e Includes rolled oats ready-to-eat oat cereals oat flour and oat bran f Includes barley flour pearl barley and malt and malt extract used in food processing g Excludes wheat not ground into flour
Source USDA (1999b)
Exposure Factors Handbook Page September 2011 12-19
Table 12-11 Mean Quantities of Grain Products Consumed by Children Under 20 Years of Age by Sex and Age per Capita (gday as-consumed)a
Yeast Cereals and Pasta Cakes Crackers Quick Breads Mixtures Age Group Sample Breads Cookies Popcorn Totalb Ready-to- Pancakes Mainly (years) Size and Total Rice Pasta Pastries Pretzels Eat Cereals French Toast Grainc Rolls Pies Corn Chips
Males and Females lt1 1126 56 2 29 1 2 1d 1 3 1 20 1 1016 192 16 57 11 9 9 9 16 7 87 2 1102 219 26 62 16 15 12 12 22 9 87 1 to 2 2118 206 21 59 13 12 11 11 19 8 87 3 1831 242 30 64 19 13 12 16 23 11 98 4 1859 264 36 67 22 15 11 17 30 13 102 5 884 284 41 76 24 17 11 15 33 13 107 3 to 5 4574 264 36 69 22 15 11 16 29 12 102 le5 7818 219 27 61 16 13 10 12 22 9 87
Males 6 to 9 787 310 45 77 28 18 15 23 39 16 109 6 to 11 1031 318 46 80 31 16 18 23 40 15 115 12 to 19 737 406 54 82 29 27 17 26 49 19 175
Females 6 to 9 704 284 43 61 21 12 15 18 42 13 107 6 to 11 969 280 43 62 20 14 15 19 42 14 101 12 to 19 732 306 40 67 17 19 22 15 37 15 132
Males and Females le9 9309 250 34 64 20 14 12 16 30 12 96 le19 11287 298 40 69 22 17 15 18 36 14 120 a Based on data from 1994ndash1996 1998 CSFII b Includes yeast breads rolls cereals pastas quick breads pancakes French toast cakes cookies pastries pies crackers popcorn pretzels corn
chips and mixtures having a grain product as a main ingredient Excludes grain products that were ingredients in food mixtures coded as a single item and tabulated under another food group for example noodles in tuna-noodle casserole are tabulated under Meat Poultry and Fish
c Includes mixtures having a grain product as a main ingredient such as burritos tacos pizza egg rolls quiche spaghetti with sauce rice and pasta mixtures frozen meals in which the main course is a grain mixture noodle and rice soups and baby-food macaroni and spaghetti mixtures
d Estimate is not statistically reliable due to small sample size reporting intake Note Consumption amounts shown are representative of the first day of each participantrsquos survey response
Source USDA (1999a)
Exposure F
actors Handbook
Chapter 12mdash
Intake of Grain Products
Page E
xposure Factors H
andbook 12-20
September 2011
Exposure F
actors Handbook
Chapter 12mdash
Intake of Grain Products
Table 12-12 Percentage of Individuals Under 20 Years of Age Consuming Grain Products by Sex and Age ()a
Age Group (years) Sample Size Totalb
Yeast Breads
and Rolls
Cereals and Pasta Quick Breads
Pancakes French Toast
Cakes Cookies Pastries
Pies
Crackers Popcorn Pretzels
Corn Chips
Mixtures Mainly GraincTotal
Ready-to-Eat
Cereals Rice Pasta
Males and Females lt1 1126 706 109 628 91 34 21 44 165 103 150 1 1016 982d 484 706 453 113 94 230 470 390 478 2 1102 990d 587 711 519 144 94 275 466 379 453 1 to 2 2118 987 537 709 487 129 94 253 468 384 465 3 1831 994d 641 697 533 111 86 288 461 385 490 4 1859 995d 670 691 548 114 71 286 523 394 462 5 884 999d 692 704 549 114 68 252 524 321 474 3 to 5 4574 996d 668 697 543 113 75 275 503 367 475 le5 7818 958 555 693 469 109 75 240 450 341 433
Males 6 to 9 787 989d 698 626 508 105 74 281 525 360 445 6 to 11 1031 990d 691 640 524 97 81 271 523 338 453 12 to 19 737 982d 627 446 332 100 59 244 413 272 462
Females 6 to 9 704 997d 715 612 476 90 79 263 571 383 480 6 to 11 969 993d 710 593 456 94 71 271 550 371 457 12 to 19 732 976d 609 459 303 86 93 198 406 309 461
Males and Females le9 9309 972 616 664 479 105 76 253 489 353 444 le19 11287 976 624 576 417 99 76 242 461 325 451 a Based on data from 1994ndash1996 1998 CSFII b Includes yeast breads rolls cereals pastas quick breads pancakes French toast cakes cookies pastries pies crackers popcorn
pretzels corn chips and mixtures having a grain product as a main ingredient Excludes grain products that were ingredients in food mixtures coded as a single item and tabulated under another food group for example noodles in tuna-noodle casserole are tabulated under Meat Poultry and Fish
c Includes mixtures having a grain product as a main ingredient such as burritos tacos pizza egg rolls quiche spaghetti with sauce rice and pasta mixtures frozen meals in which the main course is a grain mixture noodle and rice soups and baby-food macaroni and spaghetti mixtures
d Estimate is not statistically reliable due to small sample size reporting intake Note Percentages shown are representative of the first day of each participantrsquos survey response
Source USDA (1999a)
Exposure F
actors Handbook
Page Septem
ber 2011 12-21
Page E
xposure Factors H
andbook 12-22
September 2011
Exposure F
actors Handbook
Chapter 12mdash
Intake of Grain Products
Table 12-13 Per Capita Intake of Total Grains Based on 1994ndash1996 1998 CSFII (gkg-day edible portion uncooked weight) Population Group N Percent
Consuming Mean SE Percentiles 1st 5th 10th 25th 50th 75th 90th 95th 99th Max
Whole Population Age group Birth to 1 year 1 to 2 years 3 to 5 years 6 to 12 years 13 to 19 years 20 to 49 years ge50 years Season Fall Spring Summer Winter Race Asian Pacific Islander Black American Indian Alaskan Native OtherNA White Region Midwest Northeast South West Urbanization Central City Suburban Non-metropolitan
20607
1486 2096 4391 2089 1222 4677 4646
4687 5308 5890 4722
557 2740
177 1638 15495
4822 3692 7208 4885
6164 9598 4845
995
705 998 1000 1000 1000
999 1000
995 996 995 995
985 994 997 988 996
997 996 995 994
995 995 996
27
25 64 63 43 25 22 17
26 27 26 27
36 26 29 31 26
27 28 25 28
27 27 24
00
01 01 01 01 01 00 00
00 00 00 00
02 01 02 01 00
00 00 00 01
00 00 01
02
00 11 18 09 04 03 03
02 02 03 02
00 01 03 00 03
03 03 02 02
01 03 03
06
00 21 26 17 08 06 06
06 06 07 06
11 05 05 07 07
07 07 06 07
06 07 06
09
00 28 32 20 11 08 07
09 08 09 09
15 07 08 09 09
09 10 08 09
09 09 08
13
00 42 43 28 15 13 11
13 13 13 14
23 11 13 15 13
14 14 12 14
13 14 12
21
16 59 59 40 23 19 15
21 21 21 21
32 19 22 24 20
21 22 19 22
21 21 19
33
38 79 78 54 31 28 21
33 34 33 33
47 33 42 41 32
34 35 30 35
35 34 29
52
62 104 99 70 44 39 28
50 55 51 52
62 54 63 61 50
53 53 50 54
54 53 48
68
86 121
115 82 51 47 35
66 70 68 68
73 73 75 77 66
70 68 66 70
70 69 63
103
127 168 156
111 79 71 49
100 105 105 101
112 115
120 117
98
104 110
97 103
107 100 104
316
263 316 270 172 124 161
112
263 294 282 316
246 294 168 270 316
238 316 282 208
294 316 238
N SE
Source
= Sample size = Standard error
US EPA analysis of 1994ndash1996 1998 CSFII
Exposure F
actors Handbook
Page Septem
ber 2011 12-23
Exposure F
actors Handbook
Chapter 12mdash
Intake of Grain Products
Table 12-14 Consumer-Only Intake of Total Grains Based on 1994ndash1996 1998 CSFII (gkg-day edible portion uncooked weight) Population Group N Mean SE Percentiles
1st 5th 10th 25th 50th 75th 90th 95th 99th Max Whole Population Age Group Birth to 1 year 1 to 2 years 3 to 5 years 6 to 12 years 13 to 19 years 20 to 49 years ge50 years Season Fall Spring Summer Winter Race Asian Pacific Islander Black American Indian Alaskan Native OtherNA White Region Midwest Northeast South West Urbanization Central City Suburban Non-metropolitan
20157
1048 2092 4389 2089 1222 4673 4644
4587 5190 5751 4629
527 2675
175 1570 15210
4743 3628 7053 4733
6023 9378 4756
27
36 64 63 43 25 22 17
26 27 27 27
37 26 30 32 26
27 28 25 28
28 27 24
00
01 01 01 01 01 00 00
00 00 00 00
02 01 02 01 00
00 00 00 01
00 00 01
03
01 12 18 09 04 03 03
03 03 04 03
08 02 03 05 04
04 04 03 04
03 04 03
07
03 21 26 17 08 06 06
07 07 07 07
12 05 05 07 07
07 08 06 07
07 07 06
09
06 28 32 20 11 08 07
09 09 09 09
16 07 08 10 09
09 10 08 09
09 09 08
13
14 42 43 28 15 13 11
13 13 14 14
23 11 13 15 13
14 14 12 14
13 14 12
21
28 59 59 40 23 19 15
21 21 21 21
32 19 22 24 20
21 22 19 22
21 21 19
33
48 79 78 54 31 28 21
33 34 33 33
47 33 42 41 32
34 35 30 35
35 34 29
52
74 104 99 70 44 39 28
50 55 52 52
62 54 63 62 51
53 53 50 54
54 53 48
68
92 121
115 82 51 47 35
66 70 68 68
73 73 75 77 66
70 68 66 70
70 69 64
103
134 168 156
111 79 71 49
100 106 105 101
112 115
120 117
98
104 110
98 103
107 100 104
316
263 316 270 172 124 161
112
263 294 282 316
246 294 168 270 316
238 316 282 208
294 316 238
N SE
Source
= Sample size = Standard error
US EPA analysis of 1994ndash1996 1998 CSFII
Table 12-15 Per Capita Intake of Individual Grain Products Based on 1994ndash1996 1998 CSFII (gkg-day edible portion uncooked weight)
Cereal Rice Population Group
N Percent Consuming Mean SE
Percent Consuming Mean SE
Whole Population Age Group
Birth to 1 year 1 to 2 years 3 to 5 years 6 to 12 years
13 to 19 years 20 to 49 years ge50 years Season Fall Spring Summer Winter Race Asian Pacific Islander Black American Indian Alaskan Native OtherNA White Region Midwest Northeast South West Urbanization Central City Suburban
Non-metropolitan
20607
1486 2096 4391 2089 1222 4677 4646
4687 5308 5890 4722
557 2740
177 1638 15495
4822 3692 7208 4885
6164 9598 4845
996
746 998 1000 1000 1000
999 1000
996 996 995 996
985 995 997 989 997
997 997 996 994
996 995 997
37
40 84 87 62 41 31 22
37 38 38 37
44 38 42 43 37
39 37 36 38
38 38 35
003
014 008 007 006 006 004 002
006 007 006 005
020 012 015 012 004
009 006 004 009
006 005 006
865
602 864 879 880 858 883 845
851 871 869 871
966 863 926 859 862
882 872 850 867
872 866 856
03
07 06 05 04 03 03 02
03 03 03 03
17 03 03 06 02
02 03 02 04
04 03 02
001
004 003 003 002 002 001 001
002 002 002 002
019 002 010 008 001
002 003 001 003
002 002 001
N SE
Source
= Sample size = Standard error
US EPA analysis of 1994ndash1996 1998 CSFII
Exposure Factors Handbook
Chapter 12mdashIntake of Grain Products
Page Exposure Factors Handbook 12-24 September 2011
Exposure Factors Handbook
Chapter 12mdashIntake of Grain Products
Table 12-16 Consumer-Only Intake of Individual Grain Products Based on 1994ndash1996 1998 CSFII (gkg-day edible portion uncooked weight )
Population Group N Cereal
Mean SE N Rice
Mean SE Whole Population 20227 38 003 17481 03 001 Age Group
Birth to 1 year 1116 54 016 900 12 007 1 to 2 years 2092 84 008 1819 07 004 3 to 5 years 4389 87 007 3869 06 003 6 to 12 years 2089 62 006 1847 04 002 13 to 19 years 1222 41 006 1038 03 003 20 to 49 years 4674 31 004 4102 03 001 ge50 years 4645 22 002 3906 02 001
Season Fall 4598 37 006 3957 03 002 Spring 5213 38 007 4530 03 002 Summer 5768 38 006 4989 03 002 Winter 4648 37 006 4005 03 002
Race Asian Pacific Islander 529 45 020 513 18 019 Black 2683 38 012 2346 04 002 American Indian Alaskan Native 175 43 015 151 03 010 OtherNA 1579 44 013 1375 07 008 White 15261 37 004 13096 02 001
Region Midwest 4759 39 009 4186 02 002 Northeast 3639 37 006 3152 04 004 South 7081 36 004 6029 03 001 West 4748 39 009 4114 05 003
Urbanization Central City 6039 38 006 5303 05 003 Suburban 9410 38 005 8105 03 002 Non-metropolitan 4778 36 006 4073 02 002
N = Sample size SE = Standard error
Source US EPA analysis of 1994ndash1996 1998 CSFII
Exposure Factors Handbook Page September 2011 12-25
Table 12-17 Per Capita Intake of Breads a Based on 1994ndash1996 1998 CSFII (gkg-day as-consumed)
Population Group Percent Consuming Mean
Percentile SE 1st 5th 10th 25th 50th 75th 90th 95th 99th Max
Whole Population Age Group lt5 months 6 to 12 months lt1 year 1 to 2 years 3 to 5 years 6 to 11 years 12 to 19 years 20 to 39 years 40 to 69 years ge70 years Season Fall Spring Summer Winter Race Asian Black American IndianAlaska Native OtherNA White Region Midwest Northeast South West Urbanization Central City Suburban Non-metropolitan
872
09 302 146 772 865 871 862 881 900 916
874 871 873 869
691 831 822 804 890
891 883 875 837
856 877 885
11
00 05 03 20 23 17 11 09 09 09
11 11 11 11
08 11 14 12 11
12 11 11 11
11 11 11
001
008 016 011 006 005 004 003 002 001 002
002 002 002 002
006 003 018 004 001
002 002 002 002
002 001 002
00
00 00 00 00 00 00 00 00 00 00
00 00 00 00
00 00 00 00 00
00 00 00 00
00 00 00
00
00 00 00 00 00 00 00 00 00 00
00 00 00 00
00 00 00 00 00
00 00 00 00
00 00 00
00
00 00 00 00 00 00 00 00 00 02
00 00 00 00
00 00 00 00 00
00 00 00 00
00 00 00
04
00 00 00 04 09 07 04 04 04 04
04 04 04 04
00 03 03 03 04
04 04 04 03
04 04 04
09
00 00 00 14 20 14 09 08 08 08
09 09 09 08
04 07 09 09 09
09 09 09 08
08 09 09
15
00 05 00 29 33 24 15 13 13 13
15 15 15 14
12 14 17 16 15
15 15 15 14
14 15 15
23
00 18 08 44 47 35 23 20 19 19
24 23 24 23
19 23 36 27 23
25 23 23 24
23 24 23
31
00 30 17 60 58 43 28 25 23 23
31 31 31 31
29 33 41 34 30
33 29 31 32
31 31 31
51
00 48 46 85 87 67 40 39 35 29
49 51 52 51
45 63 62 56 49
57 45 49 51
51 50 50
200
18 73 73 200 132
113 75 62 84 43
146 116
171 200
146 116
200 75 171
120 98 171 200
132 146 200
a SE
Source
Includes breads rolls muffins bagels biscuits cornbread and tortillas = Standard error
US EPA analysis of the 1994ndash1996 CSFII
Exposure F
actors Handbook
Chapter 12mdash
Intake of Grain Products
Page E
xposure Factors H
andbook 12-26
September 2011
Table 12-18 Per Capita Intake of Sweets a Based on 1994ndash1996 1998 CSFII (gkg-day as-consumed)
Population Group Percent Consuming
Percentile Mean SE 1st 5th 10th 25th 50th 75th 90th 95th 99th Max
Whole Population Age Group lt5 months 6 to 12 months lt1 year 1 to 2 years 3 to 5 years 6 to 11 years 12 to 19 years 20 to 39 years 40 to 69 years ge70 years Season Fall Spring Summer Winter Race Asian Black American IndianAlaska Native OtherNA White Region Midwest Northeast South West Urbanization Central City Suburban Non-metropolitan
526
25 230 121 532 621 642 543 472 529 586
537 522 500 545
402 414 353 350 563
601 554 491 477
512 546 505
06
00 03 02 12 13 12 06 04 05 05
06 06 05 06
04 05 04 04 06
07 06 06 05
06 06 06
001
004 014 010 007 006 006 003 002 002 003
003 002 002 003
008 004 011 005 001
003 003 002 002
002 002 003
00
00 00 00 00 00 00 00 00 00 00
00 00 00 00
00 00 00 00 00
00 00 00 00
00 00 00
00
00 00 00 00 00 00 00 00 00 00
00 00 00 00
00 00 00 00 00
00 00 00 00
00 00 00
00
00 00 00 00 00 00 00 00 00 00
00 00 00 00
00 00 00 00 00
00 00 00 00
00 00 00
00
00 00 00 00 00 00 00 00 00 00
00 00 00 00
00 00 00 00 00
00 00 00 00
00 00 00
01
00 00 00 03 08 06 02 00 01 02
02 01 00 02
00 00 00 00 02
03 02 00 00
01 02 01
08
00 00 00 17 19 17 10 06 07 08
09 08 07 09
06 06 03 05 09
10 09 08 07
08 09 08
18
00 11 04 35 36 32 18 14 13 16
18 18 16 19
14 15 17 13 18
20 17 17 16
16 18 18
25
00 20 10 48 46 39 24 19 19 21
25 26 23 26
20 23 21 19 25
29 25 23 23
23 26 25
46
04 36 36 72 88 67 37 32 32 36
47 47 41 48
31 47 28 41 47
53 48 44 38
46 45 51
220
06 64 64 193 220 209 107
111 73 57
209 220 182 123
157 193
29 70 220
220 127 209 157
209 127 220
a SE
Source
Includes breakfast foods made with grains such as pancakes waffles and French toast = Standard error
US EPA analysis of the 1994ndash1996 CSFII
Exposure F
actors Handbook
Chapter 12mdash
Intake of Grain Products
Exposure F
actors Handbook
Page Septem
ber 2011 12-27
Table 12-19 Per Capita Intake of Snacks Containing Grains a Based on 1994ndash1996 1998 CSFII (gkg-day as-consumed)
Population Group Percent Consuming
Percentile Mean SE 1st 5th 10th 25th 50th 75th 90th 95th 99th Max
Whole Population Age Group lt5 months 6 to 12 months lt1 year 1 to 2 years 3 to 5 years 6 to 11 years 12 to 19 years 20 to 39 years 40 to 69 years ge70 years Season Fall Spring Summer Winter Race Asian Black American IndianAlaska Native OtherNA White Region Midwest Northeast South West Urbanization Central City Suburban Non-metropolitan
431
10 290 141 581 567 513 450 411 411 377
423 436 406 458
241 295 383 284 471
492 419 411 407
401 446 441
02
00 03 01 07 07 05 03 02 01 01
02 03 02 03
01 02 02 02 03
03 02 02 02
02 03 02
001
011 008 006 004 004 003 002 001 001 001
001 001 001 002
004 002 008 003 001
001 002 001 002
001 001 001
00
00 00 00 00 00 00 00 00 00 00
00 00 00 00
00 00 00 00 00
00 00 00 00
00 00 00
00
00 00 00 00 00 00 00 00 00 00
00 00 00 00
00 00 00 00 00
00 00 00 00
00 00 00
00
00 00 00 00 00 00 00 00 00 00
00 00 00 00
00 00 00 00 00
00 00 00 00
00 00 00
00
00 00 00 00 00 00 00 00 00 00
00 00 00 00
00 00 00 00 00
00 00 00 00
00 00 00
00
00 00 00 04 03 01 00 00 00 00
00 00 00 00
00 00 00 00 00
00 00 00 00
00 00 00
03
00 02 00 11 09 06 04 02 02 01
03 03 02 03
00 01 02 01 03
03 02 02 02
02 03 03
07
00 09 06 20 18 13 09 06 05 03
07 08 07 08
04 05 06 05 08
08 07 07 07
07 07 07
12
00 22 09 28 32 19 14 09 07 05
10 13 10 13
10 09 11 08 12
12 12 11 12
11 12 11
26
01 25 22 50 59 46 24 18 14 08
23 29 23 29
23 21 32 24 27
27 27 24 26
26 27 23
91
37 28 37 89 91 73 51 55 56 18
80 89 71 91
44 74 49 87 91
89 91 80 87
78 91 81
a SE
Source
Includes grain snacks such as crackers salty snacks popcorn and pretzels = Standard error
US EPA analysis of the 1994ndash1996 CSFII
Exposure F
actors Handbook
Chapter 12mdash
Intake of Grain Products
Page E
xposure Factors H
andbook 12-28
September 2011
Table 12-20 Per Capita Intake of Breakfast Foods a Based on 1994ndash1996 1998 CSFII (gkg-day as-consumed)
Population Group Percent Consuming
Percentile Mean SE 1st 5th 10th 25th 50th 75th 90th 95th 99th
Max
Whole Population Age Group lt5 months 6 to 12 months lt1 year 1 to 2 years 3 to 5 years 6 to 11 years 12 to 19 years 20 to 39 years 40 to 69 years ge70 years Season Fall Spring Summer Winter Race Asian Black American IndianAlaska Native OtherNA White Region Midwest Northeast South West Urbanization Central City Suburban Non-metropolitan
118
00 42 20 204 208 237 130
89 95 104
116 116
128 113
59 127
88 102 120
121 127 107 124
120 122 107
01
00 01 01 04 04 04 01 01 01 01
01 01 01 01
01 01 01 01 01
01 01 01 02
01 01 01
001
000 024 016 007 006 005 003 002 001 002
002 002 002 002
007 003 008 005 001
002 003 002 002
002 002 002
00
00 00 00 00 00 00 00 00 00 00
00 00 00 00
00 00 00 00 00
00 00 00 00
00 00 00
00
00 00 00 00 00 00 00 00 00 00
00 00 00 00
00 00 00 00 00
00 00 00 00
00 00 00
00
00 00 00 00 00 00 00 00 00 00
00 00 00 00
00 00 00 00 00
00 00 00 00
00 00 00
00
00 00 00 00 00 00 00 00 00 00
00 00 00 00
00 00 00 00 00
00 00 00 00
00 00 00
00
00 00 00 00 00 00 00 00 00 00
00 00 00 00
00 00 00 00 00
00 00 00 00
00 00 00
00
00 00 00 00 00 00 00 00 00 00
00 00 00 00
00 00 00 00 00
00 00 00 00
00 00 00
04
00 00 00 19 16 15 05 00 00 01
04 04 05 03
00 04 00 00 04
04 05 02 05
04 05 03
10
00 00 00 27 25 22 09 06 06 07
10 10 10 09
06 12 03 09 10
11 12 08 10
10 10 09
24
00 41 27 48 45 34 23 15 14 12
23 23 24 26
20 21 12 26 24
26 23 22 26
25 24 22
136
00 41 41 136
80 65 39 30 38 35
136
64 60 80
28 67 12 80 136
67 80 78 136
136
78 64
a SE
Source
Includes breakfast food made with grains such as pancakes waffles and French toast = Standard error
US EPA analysis of the 1994ndash1996 CSFII
Exposure F
actors Handbook
Chapter 12mdash
Intake of Grain Products
Exposure F
actors Handbook
Page Septem
ber 2011 12-29
Table 12-21 Per Capita Intake of Pasta Based on 1994ndash1996 1998 CSFII (gkg-day as-consumed) Population Group
Percent
Consuming Percentile
Mean SE 1st 5th 10th 25th 50th 75th 90th 95th 99th Max Whole Population
Age Group lt5 months 6 to 12 months lt1 year 1 to 2 years 3 to 5 years 6 to 11 years 12 to 19 years 20 to 39 years 40 to 69 years ge70 years Season Fall Spring Summer Winter Race Asian Black American IndianAlaska Native OtherNA White Region Midwest Northeast South West Urbanization Central City Suburban Non-metropolitan
130
00 75 35 160 128 134
117 139 137 90
136 132 126 126
194 70 18 96 141
121 201 95 132
134 140 103
03
00 01 01 08 06 05 03 03 02 02
03 03 03 03
05 02 01 02 03
03 05 02 03
03 03 02
002
000 022 015 015 013 012 009 004 003 006
005 005 005 006
017 010 023 009 003
005 005 005 005
005 003 005
00
00 00 00 00 00 00 00 00 00 00
00 00 00 00
00 00 00 00 00
00 00 00 00
00 00 00
00
00 00 00 00 00 00 00 00 00 00
00 00 00 00
00 00 00 00 00
00 00 00 00
00 00 00
00
00 00 00 00 00 00 00 00 00 00
00 00 00 00
00 00 00 00 00
00 00 00 00
00 00 00
00
00 00 00 00 00 00 00 00 00 00
00 00 00 00
00 00 00 00 00
00 00 00 00
00 00 00
00
00 00 00 00 00 00 00 00 00 00
00 00 00 00
00 00 00 00 00
00 00 00 00
00 00 00
00
00 00 00 00 00 00 00 00 00 00
00 00 00 00
00 00 00 00 00
00 00 00 00
00 00 00
10
00 00 00 34 21 20 08 11 10 00
12 11 09 08
20 00 00 00 11
08 19 00 09
12 12 01
22
00 10 00 62 44 38 21 22 19 13
24 23 21 21
33 17 00 20 23
21 28 18 22
25 22 15
51
00 33 23 106
84 75 42 41 36 29
47 58 52 51
66 36 24 35 53
52 59 44 57
53 53 42
291
00 67 67 167 143
119 291
112 118
77
167 147 154 291
112 291
36 154 167
167 154 291 141
291 167 141
SE
Source
= Standard error
US EPA analysis of the 1994ndash1996 CSFII
Exposure F
actors Handbook
Chapter 12mdash
Intake of Grain Products
Page E
xposure Factors H
andbook 12-30
September 2011
Table 12-22 Per Capita Intake of Cooked Cereals Based on 1994ndash1996 1998 CSFII (gkg-day as-consumed)
Population Group Percent Consuming
Percentile Mean SE 1st 5th 10th 25th 50th 75th 90th 95th 99th Max
Whole Population Age Group lt5 months 6 to 12 months lt1 year 1 to 2 years 3 to 5 years 6 to 11 years 12 to 19 years 20 to 39 years 40 to 69 years ge70 years Season Fall Spring Summer Winter Race Asian Black American IndianAlaska Native OtherNA White Region Midwest Northeast South West Urbanization Central City Suburban Non-metropolitan
104
09 166
83 184 160
87 56 62
116 245
120
91 93
111
44 201
76 76 93
96 90 124
94
116 99 97
04
01 19 09 16 13 05 02 01 03 06
04 03 03 04
02 07 03 04 03
03 03 04 04
04 03 03
004
054 118 082 029 028 017 009 005 003 007
008 006 008 008
020 010 032 030 004
007 010 006 009
008 005 007
00
00 00 00 00 00 00 00 00 00 00
00 00 00 00
00 00 00 00 00
00 00 00 00
00 00 00
00
00 00 00 00 00 00 00 00 00 00
00 00 00 00
00 00 00 00 00
00 00 00 00
00 00 00
00
00 00 00 00 00 00 00 00 00 00
00 00 00 00
00 00 00 00 00
00 00 00 00
00 00 00
00
00 00 00 00 00 00 00 00 00 00
00 00 00 00
00 00 00 00 00
00 00 00 00
00 00 00
00
00 00 00 00 00 00 00 00 00 00
00 00 00 00
00 00 00 00 00
00 00 00 00
00 00 00
00
00 00 00 00 00 00 00 00 00 00
00 00 00 00
00 00 00 00 00
00 00 00 00
00 00 00
06
00 94 00 69 53 00 00 00 09 22
11 00 00 09
00 22 00 00 00
00 00 11 00
09 00 00
23
00 161
57 107
79 40 10 11 19 34
26 20 21 25
00 44 21 20 20
21 22 26 23
26 21 23
72
00 228 228 206 161
94 43 33 44 56
81 64 69 74
53 109
58 106
61
57 59 79 80
81 69 57
725
56 228 228 339 725 241 106
92 87 106
459 209 725 445
161 339 123 725 459
459 725 317 395
725 459 269
SE
Source
= Standard error
US EPA analysis of the 1994ndash1996 CSFII
Exposure F
actors Handbook
Chapter 12mdash
Intake of Grain Products
Exposure F
actors Handbook
Page Septem
ber 2011 12-31
Table 12-23 Per Capita Intake of Ready-to-Eat Cereals a Based on 1994ndash1996 1998 CSFII (gkg-day as-consumed)
Population Group Percent Consuming
Percentile Mean SE 1st 5th 10th 25th 50th 75th 90th 95th 99th Max
Whole Population Age
lt5 months 6 to 12 months lt1 year 1 to 2 years 3 to 5 years 6 to 11 years 12 to 19 years 20 to 39 years 40 to 69 years ge70 years Season Fall Spring Summer Winter Race Asian Black American IndianAlaska Native OtherNA White Region Midwest Northeast South West Urbanization Central City Suburban Non-metropolitan
397
00 199
93 649 698 640 457 305 318 479
391 401 396 399
254 340 331 333 417
422 423 374 384
400 412 358
03
00 01 01 10 11 08 04 02 02 02
03 03 03 03
02 03 03 03 03
04 04 03 03
03 04 03
001
000 007 005 004 004 003 002 001 001 001
002 002 002 002
005 002 009 004 001
002 002 001 002
001 001 001
00
00 00 00 00 00 00 00 00 00 00
00 00 00 00
00 00 00 00 00
00 00 00 00
00 00 00
00
00 00 00 00 00 00 00 00 00 00
00 00 00 00
00 00 00 00 00
00 00 00 00
00 00 00
00
00 00 00 00 00 00 00 00 00 00
00 00 00 00
00 00 00 00 00
00 00 00 00
00 00 00
00
00 00 00 00 00 00 00 00 00 00
00 00 00 00
00 00 00 00 00
00 00 00 00
00 00 00
00
00 00 00 07 09 06 00 00 00 00
00 00 00 00
00 00 00 00 00
00 00 00 00
00 00 00
04
00 00 00 15 17 12 06 03 02 04
04 04 04 05
01 04 04 03 05
05 05 04 04
05 05 04
10
00 03 00 25 26 20 11 07 06 07
11 10 11 10
08 10 08 11 11
11 11 10 11
11 11 08
15
00 10 03 33 33 25 15 10 09 09
16 15 16 14
12 15 14 17 15
16 16 13 16
15 16 12
29
00 18 17 49 48 40 22 17 14 15
29 29 30 27
27 32 26 30 28
29 29 28 31
28 31 26
101
00 26 26 88 101
80 64 53 52 27
88 77 78 101
49 101
44 66 88
80 80 101
88
101 80 88
a SE
Source
Includes dry ready-to-eat corn rice wheat and bran cereals in the form of flakes puffs etc = Standard error
US EPA analysis of the 1994ndash1996 CSFII
Exposure F
actors Handbook
Chapter 12mdash
Intake of Grain Products
Page E
xposure Factors H
andbook 12-32
September 2011
Table 12-24 Per Capita Intake of Baby Cereals Based on 1994ndash1996 1998 CSFII (gkg-day as-consumed)
Population Group Percent Consuming
Percentile Mean SE 1st 5th 10th 25th 50th 75th 90th 95th 99th Max
Whole Population Age
lt5 months 6 to 12 months lt1 year 1 to 2 years 3 to 5 years 6 to 11 years 12 to 19 years 20 to 39 years 40 to 69 years ge70 years Season Fall Spring Summer Winter Race Asian Black American IndianAlaska Native OtherNA White Region Midwest Northeast South West Urbanization Central City Suburban Non-metropolitan
10
408 678 534
62 03 01 00 00 01 00
09 12 08 11
07 10 06 17 10
11 12 09 09
11 11 08
00
08 25 16 02 00 00 00 00 00 00
00 00 00 00
00 00 00 01 00
00 00 00 00
00 00 00
003
024 045 027 010 006 000 000 000 000 000
007 005 006 006
004 012 004 020 003
008 004 005 006
006 004 006
00
00 00 00 00 00 00 00 00 00 00
00 00 00 00
00 00 00 00 00
00 00 00 00
00 00 00
00
00 00 00 00 00 00 00 00 00 00
00 00 00 00
00 00 00 00 00
00 00 00 00
00 00 00
00
00 00 00 00 00 00 00 00 00 00
00 00 00 00
00 00 00 00 00
00 00 00 00
00 00 00
00
00 00 00 00 00 00 00 00 00 00
00 00 00 00
00 00 00 00 00
00 00 00 00
00 00 00
00
00 08 02 00 00 00 00 00 00 00
00 00 00 00
00 00 00 00 00
00 00 00 00
00 00 00
00
10 28 17 00 00 00 00 00 00 00
00 00 00 00
00 00 00 00 00
00 00 00 00
00 00 00
00
24 69 41 00 00 00 00 00 00 00
00 00 00 00
00 00 00 00 00
00 00 00 00
00 00 00
00
31 113
73 08 00 00 00 00 00 00
00 00 00 00
00 00 00 00 00
00 00 00 00
00 00 00
01
88 211 197
58 00 00 00 00 00 00
00 06 00 03
00 00 00 12 00
03 05 00 00
03 01 00
376
266 376 376 125
38 01 00 00 03 00
211 266 260 376
21 376
09 266 260
211 125 376 266
376 211 260
SE
Source
= Standard error
US EPA analysis of the 1994ndash1996 CSFII
Exposure F
actors Handbook
Chapter 12mdash
Intake of Grain Products
Exposure F
actors Handbook
Page Septem
ber 2011 12-33
Table 12-25 Quantity (as-consumed) of Grain Products Consumed per Eating Occasion and the Percentage of Individuals Using These Foods in 2 Days
Indiv Using Quantity Consumed per Consumers Only Food at Least Eating Occasion Quantity Consumed per Eating Occasion at Specified Percentiles
Food Category Once in 2 days (grams) (grams) Average SE 5th 10th 25th 50th 75th 90th 95th
White bread 596 50 1 21 24 33 46 52 78 104 Whole grain and wheat bread 281 50 1 24 25 37 50 56 72 92 Rolls 480 58 1 27 33 43 48 70 89 110 Biscuits 109 61 1 19 19 35 57 76 104 139 Tortillas 155 60 1 14 21 32 48 79 107 135 Quick breads and muffins 125 82 2 21 28 52 60 94 142 187 Doughnuts and sweet rolls 124 77 1 26 36 47 65 93 133 164 Crackers 174 26 1 6 9 12 18 30 47 62 Cookies 307 40 1 9 12 20 31 50 75 96 Cake 162 92 3 22 28 41 77 116 181 217 Pie 85 150 3 52 72 102 143 168 246 300 Pancakes and waffles 103 85 3 21 35 42 75 109 158 205 Cooked cereal 103 248 6 81 117 157 233 291 455 484 Oatmeal 61 264 6 116 117 176 232 333 454 473 Ready-to-eat cereal 406 54 1 18 24 30 46 67 93 113 Corn flakes 81 46 1 17 22 25 37 56 75 100 Toasted oat rings 68 42 1 14 16 27 38 54 65 83 Rice 280 150 3 27 40 76 131 192 312 334 Pasta 360 162 3 26 43 73 133 210 318 420 Macaroni and cheese 85 244 9 53 81 121 191 324 477 556 Spaghetti with tomato sauce 80 436 15 122 124 246 371 494 740 983 Pizza 199 169 5 36 52 78 140 214 338 422 SE = Standard error
Source Smiciklas-Wright et al (2002) (based on 1994ndash1996 CSFII data)
Exposure F
actors Handbook
Chapter 12mdash
Intake of Grain Products
Page E
xposure Factors H
andbook 12-34
September 2011
Table 12-26 Quantity (as-consumed) of Grain Products Consumed per Eating Occasion and Percentage of Individuals Using These Foods in 2 Days by Sex and Age
Food Category
Quantity Consumed per Eating Occasion (grams) 2 to 5 years 6 to 11 years 12 to 19 years
Males and Females (N = 2109)
Males and Females Males (N = 1432) (N = 696)
Females (N = 702)
PC Mean SE PC Mean SE PC Mean SE PC Mean SE White bread
Whole grain and wheat bread Rolls Biscuits
Tortillas Quick breads and muffins
Doughnuts and sweet rolls Crackers
Cookies Cake
Pie Pancakes and waffles Cooked cereal
Oatmeal Ready-to-eat cereal Corn flakes Toasted oat rings Rice
Pasta Macaroni and cheese Spaghetti with tomato sauce
Pizza Corn chips
Popcorn
669 243 400
83 146
96 113
254 510 146
29 191 168 104 729
112 206 296 494 178 168 237 196
116
34 37 39 38 32 55 59 17 28 70 76 49
211 221
33 33 30 84 90 159 242
86 29 20
a
1 1 2 2 4 2 1 1 3 8 1
10 9 1 2 1 3 3 8 11 3 2 1
671 205 535
97 164
96 134 172 467 197
56 215
90 57 673 131 125 246 414 132
115 328 256 127
42 44 48 48 47 67 69 26 37 79
116 77 245 256
47 42 45 124 130 217 322 108
33 31
1 1 1 3 2 5 2 2 2 4 8 3
14 19
1 2 2 6 5
13 18
6 2 2
613 145 619 122 229
110 173 106 290 151
66 135
52 24 456 104
73 242 334
75 101 396 269
78
56 60 69 72 76 125 102
39 53 99 188
96 310b
348b
72 62 62 203 203 408 583 205
58 54
1 2 2 4 5
12 12
5 3 9
15 6
29b
45b
3 4 5
10 9
46 46 13
5 5
579 176 488 103 201
110 138 142 318 155
48 82 60 23 463
87 81 288 378 107
85 305 251 105
47 53 51 55 56 79 78 26 42 85
138b
74 256b
321b
52 49 42 157 155 260 479 143
44 37
1 2 1 4 3
10 5 3 2 8
12b
5 31b
40b
2 4 3
10 9
30 51
8 3 4
Exposure F
actors Handbook
Chapter 12mdash
Intake of Grain Products
Exposure F
actors Handbook
Page Septem
ber 2011 12-35
Exposure F
actors Handbook
Chapter 12mdash
Intake of Grain Products
Page E
xposure Factors H
andbook 12-36
September 2011
Table 12-26 Quantity (as-consumed) of Grain Products Consumed per Eating Occasion and Percentage of Individuals Using These Foods in 2 Days by Sex and Age (continued)
Food Category
Quantity Consumed per Eating Occasion (g) 20 to lt40 years 40 to lt60 years gt60 years
Males Females (N = 1543) (N = 1449)
Males Females (N = 1663) (N = 1694)
Males Females (N = 1545) (N = 1429)
PC Mean SE PC Mean SE PC Mean SE PC Mean SE PC Mean SE PC Mean SE White bread
Whole grain and wheat bread Rolls Biscuits
Tortillas Quick breads and muffins
Doughnuts and sweet rolls Crackers
Cookies Cake
Pie Pancakes and waffles Cooked cereal
Oatmeal Ready-to-eat cereal Corn flakes Toasted oat rings Rice
Pasta Macaroni and cheese
Spaghetti with tomato sauce Pizza
Corn chips Popcorn
630 253 620
115 206
80 133
119 208 135
58 80 52 27 269
65 42 308 371
78 86 237 162
81
63 63 73 73 79 93 94 36 56
113 161 126 313 360a
77 73 62 199 214 301 630 253
61 63
2 1 4 3 4 7 5 3 4 6 7
15 30 42a
3 6 4 9 8
19 48 12
5 6
549 252 464
94 201
113 112
156 265 149
72 74 73 37 347
53 54 321 371
78 78 202 179
97
47 48 53 55 53 79 68 28 39 94 150
80 219 258
55 43 42 139 155 235 385 150
35 35
1 1 1 2 2 5 2 2 2 7 9 6 11
17 1 2 2 6 6
19 22
6 2 2
597 328 479 134 134 157 134 166 276 165
118 75 97 60 298
59 48 294 343
61 55 130 128
96
59 57 65 80 67 93 88 30 47 108 162
117 300 332
68 49 46 167 208 302 543 220
47 50
2 1 1 3 3 7 4 1 2 6 6 8
16 16
2 3 2 5 7
31 59 13
4 4
553 323 434
112 127 149
110 175 290 168
99 80 103
62 297
52 41 288 347
60 54 145 120 109
46 46 52 56 52 72 72 24 36 83 151
74 243 242
51 40 35 130 140 210 386 147
33 39
1 2 1 2 2 4 4 1 1 4 8 5 11
10 1 3 2 4 5
12 18
8 2 3
593 398 378 130
42 174
114 256 297 192 164 108 209 136 446 124
43 231 279
71 50 53 48 61
51 48 54 58 47 86 65 23 40 85 154
99 255 257
53 37 36 147 167 230 450 187
30 52
1 1 1 3 4 5 2 1 2 4 7 5 8
10 1 2 3 6 7
13 22 18
3 4
548 431 306
98 54 183 104 259 322 183 133
82 202 129 440 104
49 214 279
65 45 47 53 76
41 41 43 48 41 72 56 17 30 87 137
68 216 224
41 30 27
118 132 215 379 109
21 34
1 1 1 3 2 4 2 1 1 7 5 4 8
10 1 1 2 5 5
18 33
8 2 3
a Indicates a SE value that is greater than 0 but less than 05 b Indicates a statistic that is potentially unreliable because of small sample size or large coefficient of variation N = Sample size
PC = Percent consuming at least once in 2 days SE = Standard error of the mean
Source Smiciklas-Wright et al (2002) (based on 1994ndash1996 CSFII data)
Exposure Factors Handbook
Chapter 12mdashIntake of Grain Products
Table 12-27 Consumption of Major Food Groups by Older Adults Median Daily Servings (and ranges) by Demographic and Health Characteristics
Subject Characteristic N Bread Cereal Rice and Pasta (servingsday) Sex a
Females 80 27 (09ndash65) Males 50 36 (14ndash73)
Ethnicity African American 44 33 (14ndash64) European American 47 32 (09ndash68) Native American 39 29 (11ndash73)
Age 70 to 74 years 42 33 (11ndash63) 75 to 79 years 36 30 (09ndash68) 80 to 84 years 36 32 (15ndash64) gt85 years 16 36 (16ndash73)
Marital Status Married 49 33 (11ndash58) Not Married 81 30 (09ndash73)
Education 8th grade or less 37 31 (11ndash73) 9th to 12th grades 47 33 (11ndash68) gtHigh School 46 32 (09ndash65)
Dentures Yes 83 33 (11ndash64) No 47 31 (09ndash73)
Chronic Diseases 0 7 41 (22ndash64) 1 31 33 (09ndash73) 2 56 31 (11ndash58) 3 26 37 (11ndash58) gt4 10 29 (14ndash53)
Weightb
le130 pounds 18 31 (11ndash54) 131 to 150 pounds 32 33 (09ndash52) 151 to 170 pounds 27 31 (14ndash73) 171 to 190 pounds 22 36 (14ndash62) ge191 pounds 29 30 (11ndash68)
a p lt 005 b 2 missing values N = Number of subjects
Source Vitolins et al (2002)
Exposure Factors Handbook Page September 2011 12-37
Exposure Factors Handbook
Chapter 12mdashIntake of Grain Products
Table 12-28 Characteristics of the Feeding Infant and Toddlers Study (FITS) Sample Population Sample Size Percentage of Sample
Sex Males Females
1549 1473
513 487
Age of Child 4 to 6 months 7 to 8 months 9 to 11 months 12 to 14 months 15 to 18 months 19 to 24 months
862 483 679 374 308 316
285 160 225 124 102 104
Childrsquos Ethnicity Hispanic or Latino Non-Hispanic or Latino Missing
367 2641
14
121 874 05
Childrsquos Race White Black Other
2417 225 380
800 74 126
Urbanicity Urban Suburban Rural Missing
1389 1014 577 42
460 336 191 13
Household Income Under $10000 $10000 to $14999 $15000 to $24999 $25000 to $34999 $35000 to $49999 $50000 to $74999 $75000 to $99999 $100000 and Over Missing
48 48
221 359 723 588 311 272 452
16 16 73 119 239 195 103 90 149
Receives WIC Yes No Missing
821 2196
5
272 726 02
Sample Size (Unweighted) 3022 1000 WIC = Special Supplemental Nutrition Program for Women Infants and Children
Source Devaney et al (2004)
Page Exposure Factors Handbook 12-38 September 2011
Table 12-29 Percentage of Infants and Toddlers Consuming Different Types of Grain Products Percentage of Infants and Toddlers Consuming at Least Once in a Day
Food GroupFood 4 to 6 7 to 8 9 to 11 12 to 14 15 to 18 19 to 24 Months Months Months Months Months Months
Any Grain or Grain Product 658 915 975 978 986 992 Infant Cereals 648 812 638 239 92 31 Non-infant Cerealsa 06 183 443 589 605 519
Not Pre-sweetened 05 170 370 445 406 319 Pre-sweetenedb 00 18 90 177 264 227
Breads and Rollsc 06 99 245 473 527 531 Crackers Pretzels Rice Cakes 30 162 334 452 464 447 Cereal or Granola Bars 00 11 34 98 100 97 Pancakes Waffles French Toast 01 08 75 151 161 154 Rice and Pastad 23 45 182 262 390 359 Other 02 01 27 28 25 45 Grains in Mixed Dishes 04 53 241 483 520 551 Sandwiches 00 11 86 215 258 258 Burrito Taco Enchilada Nachos 00 00 10 45 28 21 Macaroni and Cheese 02 16 49 146 150 150 Pizza 01 07 22 68 90 94 Pot PieHot Pocket 00 09 05 20 10 18 Spaghetti Ravioli Lasagna 01 18 99 153 121 88 a Includes both ready-to-eat and cooked cereals b Defined as cereals with more than 211 grams sugar per 100 grams c Does not include bread in sandwiches Sandwiches are included in mixed dishes d Does not include rice or pasta in mixed dishes
Source Fox et al (2004)
Exposure Factors Handbook
Chapter 12mdashIntake of Grain Products
Exposure Factors Handbook Page September 2011 12-39
Table 12-30
a Characteristics of Women Infants and Children (WIC) Participants and Non-Participants (percentages)
Infants 4 to 6 month Infants 7 to 11 month Toddlers 12 to 24 month WIC
Participant Non-Participant WIC
Participant Non-Participant WIC
Participant Non-Participant Sex Males 55 Females 45
Childrsquos Ethnicity Hispanic or Latino 20 Non-Hispanic or Latino 80
Childrsquos Race White 69 Black 15 Other 22
Child in Daycare Yes 39 No 61 Age of Mother 14 to 19 years 18 20 to 24 years 33 25 to 29 years 29 30 to 34 years 9 gt35 years 9 Missing 2
Motherrsquos Education 11th Grade or Less 23 Completed High School 35 Some Postsecondary 33 Completed College 7 Missing 2
Parentrsquos Marital Status Married 49 Not Married 50 Missing 1
Mother or Female Guardian Works Yes 46 No 53 Missing 1
54 46
b
11 89
b 84
4 11
38 62
b 1
13 29 33 23
2 b 2
19 26 53
1 b
93 7 1
51 48
1
55 45
24 76
63 17 20
34 66
13 38 23 15
11 1 15 42 32
9 2 57 42
1 45 54
1
51 49
b 8
92 b
86 5 9 b
46 54
b 1 11
30 36 21
1 b 2
20 27 51
0 b
93 7 0 b
60 40
0
57 43
22 78
67 13 20
43 57
9
33 29 18
11 0
17 42 31
9 1
58 41
1
55 45
0
52 48
b 10 89
b 84
5 11
c
53 47
b 1
14 26 34 26
1 b 3
19 28 48
2 b
88 11 1
c
61 38
1
Exposure Factors Handbook
Chapter 12mdashIntake of Grain Products
Page Exposure Factors Handbook 12-40 September 2011
c
Table 12-30 Characteristics of Women Infants and Children (WIC) Participants and Non-Participantsa
(percentages) (continued) Infants 4 to 6 months Infants 7 to 11 months Toddlers 12 to 24 months
WIC WIC WIC Participant Non-Participant Participant Non-Participant Participant Non-Participant
Urbanicity c c c
Urban 34 55 37 50 35 48 Suburban 36 31 31 34 35 35 Rural 28 13 30 15 28 16 Missing 2 1 2 1 2 2
Sample Size (Unweighted) 265 597 351 808 205 791 a χ2 tests were conducted to test for statistical significance in the differences between WIC participants and nonshy
participants within each age group for each variable The results of χ2 tests are listed next to the variable under the column labeled non-participants for each of the three age groups
b = p lt 005 non-participants significantly different from WIC participants on the variable = p lt 001 non-participants significantly different from WIC participants on the variable
WIC = Special Supplemental Nutrition Program for Women Infants and Children
Source Ponza et al (2004)
Table 12-31 Food Choices for Infants and Toddlers by Women Infants and Children (WIC) Participation Status
Infants 4 to 6 months Infants 7 to 11 months Toddlers 12 to 24 months WIC Non- WIC Non- WIC Non-
Participant Participant Participant Participant Participant Participant 697 Infant Cereals 697 625 747 135 92
Non-infant Cereals Total 09 05 217 385a 581 560
Not Pre-sweetened 05 05 187 329a 437 363 Pre-sweetened 00 00 40 69 177 241
Grains in Combination Foods 09 01 188 147 503 529 Sample Size (unweighted) 265 597 351 808 205 791 a = p lt 001 non-participants significantly different from WIC participants WIC = Special Supplemental Nutrition Program for Women Infants and Children
Source Ponza et al (2004)
Exposure Factors Handbook
Chapter 12mdashIntake of Grain Products
Exposure Factors Handbook Page September 2011 12-41
Table 12-32 Average Portion Sizes per Eating Occasion of Grain Products Commonly Consumed by Infants From the 2002 Feeding Infants and Toddlers Study
4 to 5 months 6 to 8 months 9 to 11 months Reference Food Group (N = 624) (N = 708) (N = 687) Unit Mean plusmn SE Infant cereal dry tablespoon 31 plusmn 014 45 plusmn 014 52 plusmn 018 Infant cereal jarred tablespoon - 56 plusmn 026 74 plusmn 034 Ready-to-eat cereal tablespoon - 23 plusmn 034 34 plusmn 021 Crackers ounce - 02 plusmn 002 03 plusmn 001 Crackers saltine - 22 plusmn 014 27 plusmn 012 Bread slice - 05 plusmn 010 08 plusmn 006 - = Cell size was too small to generate a reliable estimate N = Number of respondents SE = Standard error of the mean
Source Fox et al (2006)
Exposure Factors Handbook
Chapter 12mdashIntake of Grain Products
Table 12-33 Average Portion Sizes per Eating Occasion of Grain Products Commonly Consumed by Toddlers From the 2002 Feeding Infants and Toddlers Study
Food Group Reference Unit 12 to 14 months
(N = 371) 15 to 18 months
(N = 312) 19 to 24 months (N = 320)
Mean plusmn SE Bread slice 08 plusmn 004 09 plusmn 005 09 plusmn 005 Rolls ounce 09 plusmn 011 10 plusmn 010 09 plusmn 015 Ready-to-eat cereal cup 03 plusmn 002 05 plusmn 003 06 plusmn 004 Hot cereal prepared cup 06 plusmn 005 06 plusmn 005 07 plusmn 005 Crackers ounce 03 plusmn 002 04 plusmn 002 04 plusmn 002 Crackers saltine 33 plusmn 022 35 plusmn 022 37 plusmn 022 Pasta cup 04 plusmn 004 04 plusmn 004 05 plusmn 005 Rice cup 03 plusmn 004 04 plusmn 005 04 plusmn 005 Pancakes and waffles 1 (4-inch diameter) 10 plusmn 008 14 plusmn 021 14 plusmn 017 N = Number of respondents SE = Standard error of the mean
Source Fox et al (2006)
Page Exposure Factors Handbook 12-42 September 2011
c
Table 12-34 Percentage of Hispanic and Non-Hispanic Infants and Toddlers Consuming Different Types of Grain Products on a Given Day Age 4 to 5 months Age 6 to 11 months Age 12 to 24 months
Hispanic Non-Hispanic Hispanic Non-Hispanic Hispanic Non-Hispanic (N = 84) (N = 538) (N = 163) (N = 1228) (N = 124) (N = 871)
Any Grain or Grain Product Infant Cereal Non-infant Cereal Breadsb
Tortillas Crackers Pretzels Rice Cakes Pancakes Waffles French Toast Rice and Pastad
Rice Grains in Mixed Dishes
Sandwiches Burrito Taco Enchilada Nachos
565 552
-14c
14c
13c
------
569 565
----------
950 741 185a
182 40c
278 14c
201a
159e
159 40c
13c
935 736 292 151
-225 43
103 47
130 46 -
971 159 453 440 67a c
356 130 443
269a c
388a
242 21c
989 93
578 529 06c
469 160 329 130 544 249 30
Macaroni and Cheese - - 30c 31 101 155
Pizza - - - 14 10c e 97
Spaghetti Ravioli Lasagna - - 83c 46 93c 121 a = Significantly different from non-Hispanic at p lt 005 b Does not include bread in sandwiches Sandwiches are included in mixed dishes Includes tortillas also shown
separately = Statistic is potentially unreliable because of a high coefficient of variation
d Does not include rice or pasta in mixed dishes Includes rice (eg white brown wild and Spanish rice without meat) and pasta (eg spaghetti macaroni and egg noodles) Rice is also shown separately
e = Significantly different from non-Hispanic at p lt 001 - = Less than 1 of the group consumed this food on a given day N = Sample size
Source Mennella et al (2006)
Exposure Factors Handbook
Chapter 12mdashIntake of Grain Products
Exposure Factors Handbook Page September 2011 12-43
Exposure Factors Handbook
Chapter 12mdashIntake of Grain Products
Table 12-35 Mean Moisture Content of Selected Grain Products Expressed as Percentages of Edible Portions (grams per 100 grams of edible portion)
Food Moisture Content Comments Raw Cooked Barley―pearled 1009 6880 Corn―grain―endosperm 1037 -Corn―grain―bran 471 - crude Millet 867 7141 Oats 822 -Rice―white―long-grained 1162 6844 Rye 1095 -Rye―flour―medium 985 -Sorghum 920 -Wheat―hard white 957 -Wheat―germ 1112 - crude Wheat―bran 989 - crude Wheat―flour―whole grain 1027 -- Indicates that the grain product was not assessed for water content under these conditions
Source USDA (2007)
Page Exposure Factors Handbook 12-44 September 2011
- TABLE OF CONTENTS
- LIST OF TABLES
- 12 INTAKE OF GRAIN PRODUCTS
-
- 121 INTRODUCTION
- 122 RECOMMENDATIONS
- 123 INTAKE STUDIES
-
- 1231 Key Grain Intake Study
-
- 12311 US EPA Analysis of Consumption Data From 2003minus2006 National Health and Nutrition Examination Survey (NHANES)
-
- 1232 Relevant Grain Intake Studies
-
- 12321 USDA (1996a b 1993 1980)mdashFood and Nutrient Intakes of Individuals in 1 Day in the United States
- 12322 USDA (1999b)mdashFood Consumption Prices and Expenditures 1970minus1997
- 12323 USDA (1999a)mdashFood and Nutrient Intakes by Children 1994minus1996 1998 Table Set 17
- 12324 US EPA Analysis of Continuing Survey of Food Intake by Individuals (CSFII) 1994minus1996 1998
- 12325 Smiciklas-Wright et al (2002)mdashFoods Commonly Eaten in the United States Quantities Consumed per Eating Occasion and in a Day 1994minus1996
- 12326 Vitolins et al (2002)mdashQuality of Diets Consumed by Older Rural Adults
- 12327 Fox et al (2004)mdashFeeding Infants and Toddlers Study What Foods Are Infants and Toddlers Eating
- 12328 Ponza et al (2004)mdashNutrient Food Intakes and Food Choices of Infants and Toddlers Participating in WIC
- 12329 Fox et al (2006)mdashAverage Portion of Foods Commonly Eaten by Infants and Toddlers in the United States
- 123210 Mennella et al (2006)mdashFeeding Infants and Toddlers Study The Types of Foods Fed to Hispanic Infants and Toddlers
-
- 124 CONVERSION BETWEEN WET- AND DRY-WEIGHT INTAKE RATES
- 125 REFERENCES FOR CHAPTER 12
-

Exposure Factors Handbook
Chapter 12mdashIntake of Grain Products
Table 12-10 Per Capita Consumption of Flour and Cereal Products in 1997
Food Item Per Capita Consumption
(gday)a
Total Wheat Flourb
Rye Flour Ricec
Total Corn Productsd
Oat Productse
Barley Productsf
Total Flour and Cereal Productsg
186 07 24 29 8
09 249
a Original data were presented in lbsyear data were converted to gday by multiplying by a factor of 454 glb and dividing by 365 dayyear Consumption of most items at the processing level Excludes quantities used in alcoholic beverages and fuel
b Includes white whole wheat and durum flour c Milled basis d Includes corn flour and meal hominy and grits and corn starch e Includes rolled oats ready-to-eat oat cereals oat flour and oat bran f Includes barley flour pearl barley and malt and malt extract used in food processing g Excludes wheat not ground into flour
Source USDA (1999b)
Exposure Factors Handbook Page September 2011 12-19
Table 12-11 Mean Quantities of Grain Products Consumed by Children Under 20 Years of Age by Sex and Age per Capita (gday as-consumed)a
Yeast Cereals and Pasta Cakes Crackers Quick Breads Mixtures Age Group Sample Breads Cookies Popcorn Totalb Ready-to- Pancakes Mainly (years) Size and Total Rice Pasta Pastries Pretzels Eat Cereals French Toast Grainc Rolls Pies Corn Chips
Males and Females lt1 1126 56 2 29 1 2 1d 1 3 1 20 1 1016 192 16 57 11 9 9 9 16 7 87 2 1102 219 26 62 16 15 12 12 22 9 87 1 to 2 2118 206 21 59 13 12 11 11 19 8 87 3 1831 242 30 64 19 13 12 16 23 11 98 4 1859 264 36 67 22 15 11 17 30 13 102 5 884 284 41 76 24 17 11 15 33 13 107 3 to 5 4574 264 36 69 22 15 11 16 29 12 102 le5 7818 219 27 61 16 13 10 12 22 9 87
Males 6 to 9 787 310 45 77 28 18 15 23 39 16 109 6 to 11 1031 318 46 80 31 16 18 23 40 15 115 12 to 19 737 406 54 82 29 27 17 26 49 19 175
Females 6 to 9 704 284 43 61 21 12 15 18 42 13 107 6 to 11 969 280 43 62 20 14 15 19 42 14 101 12 to 19 732 306 40 67 17 19 22 15 37 15 132
Males and Females le9 9309 250 34 64 20 14 12 16 30 12 96 le19 11287 298 40 69 22 17 15 18 36 14 120 a Based on data from 1994ndash1996 1998 CSFII b Includes yeast breads rolls cereals pastas quick breads pancakes French toast cakes cookies pastries pies crackers popcorn pretzels corn
chips and mixtures having a grain product as a main ingredient Excludes grain products that were ingredients in food mixtures coded as a single item and tabulated under another food group for example noodles in tuna-noodle casserole are tabulated under Meat Poultry and Fish
c Includes mixtures having a grain product as a main ingredient such as burritos tacos pizza egg rolls quiche spaghetti with sauce rice and pasta mixtures frozen meals in which the main course is a grain mixture noodle and rice soups and baby-food macaroni and spaghetti mixtures
d Estimate is not statistically reliable due to small sample size reporting intake Note Consumption amounts shown are representative of the first day of each participantrsquos survey response
Source USDA (1999a)
Exposure F
actors Handbook
Chapter 12mdash
Intake of Grain Products
Page E
xposure Factors H
andbook 12-20
September 2011
Exposure F
actors Handbook
Chapter 12mdash
Intake of Grain Products
Table 12-12 Percentage of Individuals Under 20 Years of Age Consuming Grain Products by Sex and Age ()a
Age Group (years) Sample Size Totalb
Yeast Breads
and Rolls
Cereals and Pasta Quick Breads
Pancakes French Toast
Cakes Cookies Pastries
Pies
Crackers Popcorn Pretzels
Corn Chips
Mixtures Mainly GraincTotal
Ready-to-Eat
Cereals Rice Pasta
Males and Females lt1 1126 706 109 628 91 34 21 44 165 103 150 1 1016 982d 484 706 453 113 94 230 470 390 478 2 1102 990d 587 711 519 144 94 275 466 379 453 1 to 2 2118 987 537 709 487 129 94 253 468 384 465 3 1831 994d 641 697 533 111 86 288 461 385 490 4 1859 995d 670 691 548 114 71 286 523 394 462 5 884 999d 692 704 549 114 68 252 524 321 474 3 to 5 4574 996d 668 697 543 113 75 275 503 367 475 le5 7818 958 555 693 469 109 75 240 450 341 433
Males 6 to 9 787 989d 698 626 508 105 74 281 525 360 445 6 to 11 1031 990d 691 640 524 97 81 271 523 338 453 12 to 19 737 982d 627 446 332 100 59 244 413 272 462
Females 6 to 9 704 997d 715 612 476 90 79 263 571 383 480 6 to 11 969 993d 710 593 456 94 71 271 550 371 457 12 to 19 732 976d 609 459 303 86 93 198 406 309 461
Males and Females le9 9309 972 616 664 479 105 76 253 489 353 444 le19 11287 976 624 576 417 99 76 242 461 325 451 a Based on data from 1994ndash1996 1998 CSFII b Includes yeast breads rolls cereals pastas quick breads pancakes French toast cakes cookies pastries pies crackers popcorn
pretzels corn chips and mixtures having a grain product as a main ingredient Excludes grain products that were ingredients in food mixtures coded as a single item and tabulated under another food group for example noodles in tuna-noodle casserole are tabulated under Meat Poultry and Fish
c Includes mixtures having a grain product as a main ingredient such as burritos tacos pizza egg rolls quiche spaghetti with sauce rice and pasta mixtures frozen meals in which the main course is a grain mixture noodle and rice soups and baby-food macaroni and spaghetti mixtures
d Estimate is not statistically reliable due to small sample size reporting intake Note Percentages shown are representative of the first day of each participantrsquos survey response
Source USDA (1999a)
Exposure F
actors Handbook
Page Septem
ber 2011 12-21
Page E
xposure Factors H
andbook 12-22
September 2011
Exposure F
actors Handbook
Chapter 12mdash
Intake of Grain Products
Table 12-13 Per Capita Intake of Total Grains Based on 1994ndash1996 1998 CSFII (gkg-day edible portion uncooked weight) Population Group N Percent
Consuming Mean SE Percentiles 1st 5th 10th 25th 50th 75th 90th 95th 99th Max
Whole Population Age group Birth to 1 year 1 to 2 years 3 to 5 years 6 to 12 years 13 to 19 years 20 to 49 years ge50 years Season Fall Spring Summer Winter Race Asian Pacific Islander Black American Indian Alaskan Native OtherNA White Region Midwest Northeast South West Urbanization Central City Suburban Non-metropolitan
20607
1486 2096 4391 2089 1222 4677 4646
4687 5308 5890 4722
557 2740
177 1638 15495
4822 3692 7208 4885
6164 9598 4845
995
705 998 1000 1000 1000
999 1000
995 996 995 995
985 994 997 988 996
997 996 995 994
995 995 996
27
25 64 63 43 25 22 17
26 27 26 27
36 26 29 31 26
27 28 25 28
27 27 24
00
01 01 01 01 01 00 00
00 00 00 00
02 01 02 01 00
00 00 00 01
00 00 01
02
00 11 18 09 04 03 03
02 02 03 02
00 01 03 00 03
03 03 02 02
01 03 03
06
00 21 26 17 08 06 06
06 06 07 06
11 05 05 07 07
07 07 06 07
06 07 06
09
00 28 32 20 11 08 07
09 08 09 09
15 07 08 09 09
09 10 08 09
09 09 08
13
00 42 43 28 15 13 11
13 13 13 14
23 11 13 15 13
14 14 12 14
13 14 12
21
16 59 59 40 23 19 15
21 21 21 21
32 19 22 24 20
21 22 19 22
21 21 19
33
38 79 78 54 31 28 21
33 34 33 33
47 33 42 41 32
34 35 30 35
35 34 29
52
62 104 99 70 44 39 28
50 55 51 52
62 54 63 61 50
53 53 50 54
54 53 48
68
86 121
115 82 51 47 35
66 70 68 68
73 73 75 77 66
70 68 66 70
70 69 63
103
127 168 156
111 79 71 49
100 105 105 101
112 115
120 117
98
104 110
97 103
107 100 104
316
263 316 270 172 124 161
112
263 294 282 316
246 294 168 270 316
238 316 282 208
294 316 238
N SE
Source
= Sample size = Standard error
US EPA analysis of 1994ndash1996 1998 CSFII
Exposure F
actors Handbook
Page Septem
ber 2011 12-23
Exposure F
actors Handbook
Chapter 12mdash
Intake of Grain Products
Table 12-14 Consumer-Only Intake of Total Grains Based on 1994ndash1996 1998 CSFII (gkg-day edible portion uncooked weight) Population Group N Mean SE Percentiles
1st 5th 10th 25th 50th 75th 90th 95th 99th Max Whole Population Age Group Birth to 1 year 1 to 2 years 3 to 5 years 6 to 12 years 13 to 19 years 20 to 49 years ge50 years Season Fall Spring Summer Winter Race Asian Pacific Islander Black American Indian Alaskan Native OtherNA White Region Midwest Northeast South West Urbanization Central City Suburban Non-metropolitan
20157
1048 2092 4389 2089 1222 4673 4644
4587 5190 5751 4629
527 2675
175 1570 15210
4743 3628 7053 4733
6023 9378 4756
27
36 64 63 43 25 22 17
26 27 27 27
37 26 30 32 26
27 28 25 28
28 27 24
00
01 01 01 01 01 00 00
00 00 00 00
02 01 02 01 00
00 00 00 01
00 00 01
03
01 12 18 09 04 03 03
03 03 04 03
08 02 03 05 04
04 04 03 04
03 04 03
07
03 21 26 17 08 06 06
07 07 07 07
12 05 05 07 07
07 08 06 07
07 07 06
09
06 28 32 20 11 08 07
09 09 09 09
16 07 08 10 09
09 10 08 09
09 09 08
13
14 42 43 28 15 13 11
13 13 14 14
23 11 13 15 13
14 14 12 14
13 14 12
21
28 59 59 40 23 19 15
21 21 21 21
32 19 22 24 20
21 22 19 22
21 21 19
33
48 79 78 54 31 28 21
33 34 33 33
47 33 42 41 32
34 35 30 35
35 34 29
52
74 104 99 70 44 39 28
50 55 52 52
62 54 63 62 51
53 53 50 54
54 53 48
68
92 121
115 82 51 47 35
66 70 68 68
73 73 75 77 66
70 68 66 70
70 69 64
103
134 168 156
111 79 71 49
100 106 105 101
112 115
120 117
98
104 110
98 103
107 100 104
316
263 316 270 172 124 161
112
263 294 282 316
246 294 168 270 316
238 316 282 208
294 316 238
N SE
Source
= Sample size = Standard error
US EPA analysis of 1994ndash1996 1998 CSFII
Table 12-15 Per Capita Intake of Individual Grain Products Based on 1994ndash1996 1998 CSFII (gkg-day edible portion uncooked weight)
Cereal Rice Population Group
N Percent Consuming Mean SE
Percent Consuming Mean SE
Whole Population Age Group
Birth to 1 year 1 to 2 years 3 to 5 years 6 to 12 years
13 to 19 years 20 to 49 years ge50 years Season Fall Spring Summer Winter Race Asian Pacific Islander Black American Indian Alaskan Native OtherNA White Region Midwest Northeast South West Urbanization Central City Suburban
Non-metropolitan
20607
1486 2096 4391 2089 1222 4677 4646
4687 5308 5890 4722
557 2740
177 1638 15495
4822 3692 7208 4885
6164 9598 4845
996
746 998 1000 1000 1000
999 1000
996 996 995 996
985 995 997 989 997
997 997 996 994
996 995 997
37
40 84 87 62 41 31 22
37 38 38 37
44 38 42 43 37
39 37 36 38
38 38 35
003
014 008 007 006 006 004 002
006 007 006 005
020 012 015 012 004
009 006 004 009
006 005 006
865
602 864 879 880 858 883 845
851 871 869 871
966 863 926 859 862
882 872 850 867
872 866 856
03
07 06 05 04 03 03 02
03 03 03 03
17 03 03 06 02
02 03 02 04
04 03 02
001
004 003 003 002 002 001 001
002 002 002 002
019 002 010 008 001
002 003 001 003
002 002 001
N SE
Source
= Sample size = Standard error
US EPA analysis of 1994ndash1996 1998 CSFII
Exposure Factors Handbook
Chapter 12mdashIntake of Grain Products
Page Exposure Factors Handbook 12-24 September 2011
Exposure Factors Handbook
Chapter 12mdashIntake of Grain Products
Table 12-16 Consumer-Only Intake of Individual Grain Products Based on 1994ndash1996 1998 CSFII (gkg-day edible portion uncooked weight )
Population Group N Cereal
Mean SE N Rice
Mean SE Whole Population 20227 38 003 17481 03 001 Age Group
Birth to 1 year 1116 54 016 900 12 007 1 to 2 years 2092 84 008 1819 07 004 3 to 5 years 4389 87 007 3869 06 003 6 to 12 years 2089 62 006 1847 04 002 13 to 19 years 1222 41 006 1038 03 003 20 to 49 years 4674 31 004 4102 03 001 ge50 years 4645 22 002 3906 02 001
Season Fall 4598 37 006 3957 03 002 Spring 5213 38 007 4530 03 002 Summer 5768 38 006 4989 03 002 Winter 4648 37 006 4005 03 002
Race Asian Pacific Islander 529 45 020 513 18 019 Black 2683 38 012 2346 04 002 American Indian Alaskan Native 175 43 015 151 03 010 OtherNA 1579 44 013 1375 07 008 White 15261 37 004 13096 02 001
Region Midwest 4759 39 009 4186 02 002 Northeast 3639 37 006 3152 04 004 South 7081 36 004 6029 03 001 West 4748 39 009 4114 05 003
Urbanization Central City 6039 38 006 5303 05 003 Suburban 9410 38 005 8105 03 002 Non-metropolitan 4778 36 006 4073 02 002
N = Sample size SE = Standard error
Source US EPA analysis of 1994ndash1996 1998 CSFII
Exposure Factors Handbook Page September 2011 12-25
Table 12-17 Per Capita Intake of Breads a Based on 1994ndash1996 1998 CSFII (gkg-day as-consumed)
Population Group Percent Consuming Mean
Percentile SE 1st 5th 10th 25th 50th 75th 90th 95th 99th Max
Whole Population Age Group lt5 months 6 to 12 months lt1 year 1 to 2 years 3 to 5 years 6 to 11 years 12 to 19 years 20 to 39 years 40 to 69 years ge70 years Season Fall Spring Summer Winter Race Asian Black American IndianAlaska Native OtherNA White Region Midwest Northeast South West Urbanization Central City Suburban Non-metropolitan
872
09 302 146 772 865 871 862 881 900 916
874 871 873 869
691 831 822 804 890
891 883 875 837
856 877 885
11
00 05 03 20 23 17 11 09 09 09
11 11 11 11
08 11 14 12 11
12 11 11 11
11 11 11
001
008 016 011 006 005 004 003 002 001 002
002 002 002 002
006 003 018 004 001
002 002 002 002
002 001 002
00
00 00 00 00 00 00 00 00 00 00
00 00 00 00
00 00 00 00 00
00 00 00 00
00 00 00
00
00 00 00 00 00 00 00 00 00 00
00 00 00 00
00 00 00 00 00
00 00 00 00
00 00 00
00
00 00 00 00 00 00 00 00 00 02
00 00 00 00
00 00 00 00 00
00 00 00 00
00 00 00
04
00 00 00 04 09 07 04 04 04 04
04 04 04 04
00 03 03 03 04
04 04 04 03
04 04 04
09
00 00 00 14 20 14 09 08 08 08
09 09 09 08
04 07 09 09 09
09 09 09 08
08 09 09
15
00 05 00 29 33 24 15 13 13 13
15 15 15 14
12 14 17 16 15
15 15 15 14
14 15 15
23
00 18 08 44 47 35 23 20 19 19
24 23 24 23
19 23 36 27 23
25 23 23 24
23 24 23
31
00 30 17 60 58 43 28 25 23 23
31 31 31 31
29 33 41 34 30
33 29 31 32
31 31 31
51
00 48 46 85 87 67 40 39 35 29
49 51 52 51
45 63 62 56 49
57 45 49 51
51 50 50
200
18 73 73 200 132
113 75 62 84 43
146 116
171 200
146 116
200 75 171
120 98 171 200
132 146 200
a SE
Source
Includes breads rolls muffins bagels biscuits cornbread and tortillas = Standard error
US EPA analysis of the 1994ndash1996 CSFII
Exposure F
actors Handbook
Chapter 12mdash
Intake of Grain Products
Page E
xposure Factors H
andbook 12-26
September 2011
Table 12-18 Per Capita Intake of Sweets a Based on 1994ndash1996 1998 CSFII (gkg-day as-consumed)
Population Group Percent Consuming
Percentile Mean SE 1st 5th 10th 25th 50th 75th 90th 95th 99th Max
Whole Population Age Group lt5 months 6 to 12 months lt1 year 1 to 2 years 3 to 5 years 6 to 11 years 12 to 19 years 20 to 39 years 40 to 69 years ge70 years Season Fall Spring Summer Winter Race Asian Black American IndianAlaska Native OtherNA White Region Midwest Northeast South West Urbanization Central City Suburban Non-metropolitan
526
25 230 121 532 621 642 543 472 529 586
537 522 500 545
402 414 353 350 563
601 554 491 477
512 546 505
06
00 03 02 12 13 12 06 04 05 05
06 06 05 06
04 05 04 04 06
07 06 06 05
06 06 06
001
004 014 010 007 006 006 003 002 002 003
003 002 002 003
008 004 011 005 001
003 003 002 002
002 002 003
00
00 00 00 00 00 00 00 00 00 00
00 00 00 00
00 00 00 00 00
00 00 00 00
00 00 00
00
00 00 00 00 00 00 00 00 00 00
00 00 00 00
00 00 00 00 00
00 00 00 00
00 00 00
00
00 00 00 00 00 00 00 00 00 00
00 00 00 00
00 00 00 00 00
00 00 00 00
00 00 00
00
00 00 00 00 00 00 00 00 00 00
00 00 00 00
00 00 00 00 00
00 00 00 00
00 00 00
01
00 00 00 03 08 06 02 00 01 02
02 01 00 02
00 00 00 00 02
03 02 00 00
01 02 01
08
00 00 00 17 19 17 10 06 07 08
09 08 07 09
06 06 03 05 09
10 09 08 07
08 09 08
18
00 11 04 35 36 32 18 14 13 16
18 18 16 19
14 15 17 13 18
20 17 17 16
16 18 18
25
00 20 10 48 46 39 24 19 19 21
25 26 23 26
20 23 21 19 25
29 25 23 23
23 26 25
46
04 36 36 72 88 67 37 32 32 36
47 47 41 48
31 47 28 41 47
53 48 44 38
46 45 51
220
06 64 64 193 220 209 107
111 73 57
209 220 182 123
157 193
29 70 220
220 127 209 157
209 127 220
a SE
Source
Includes breakfast foods made with grains such as pancakes waffles and French toast = Standard error
US EPA analysis of the 1994ndash1996 CSFII
Exposure F
actors Handbook
Chapter 12mdash
Intake of Grain Products
Exposure F
actors Handbook
Page Septem
ber 2011 12-27
Table 12-19 Per Capita Intake of Snacks Containing Grains a Based on 1994ndash1996 1998 CSFII (gkg-day as-consumed)
Population Group Percent Consuming
Percentile Mean SE 1st 5th 10th 25th 50th 75th 90th 95th 99th Max
Whole Population Age Group lt5 months 6 to 12 months lt1 year 1 to 2 years 3 to 5 years 6 to 11 years 12 to 19 years 20 to 39 years 40 to 69 years ge70 years Season Fall Spring Summer Winter Race Asian Black American IndianAlaska Native OtherNA White Region Midwest Northeast South West Urbanization Central City Suburban Non-metropolitan
431
10 290 141 581 567 513 450 411 411 377
423 436 406 458
241 295 383 284 471
492 419 411 407
401 446 441
02
00 03 01 07 07 05 03 02 01 01
02 03 02 03
01 02 02 02 03
03 02 02 02
02 03 02
001
011 008 006 004 004 003 002 001 001 001
001 001 001 002
004 002 008 003 001
001 002 001 002
001 001 001
00
00 00 00 00 00 00 00 00 00 00
00 00 00 00
00 00 00 00 00
00 00 00 00
00 00 00
00
00 00 00 00 00 00 00 00 00 00
00 00 00 00
00 00 00 00 00
00 00 00 00
00 00 00
00
00 00 00 00 00 00 00 00 00 00
00 00 00 00
00 00 00 00 00
00 00 00 00
00 00 00
00
00 00 00 00 00 00 00 00 00 00
00 00 00 00
00 00 00 00 00
00 00 00 00
00 00 00
00
00 00 00 04 03 01 00 00 00 00
00 00 00 00
00 00 00 00 00
00 00 00 00
00 00 00
03
00 02 00 11 09 06 04 02 02 01
03 03 02 03
00 01 02 01 03
03 02 02 02
02 03 03
07
00 09 06 20 18 13 09 06 05 03
07 08 07 08
04 05 06 05 08
08 07 07 07
07 07 07
12
00 22 09 28 32 19 14 09 07 05
10 13 10 13
10 09 11 08 12
12 12 11 12
11 12 11
26
01 25 22 50 59 46 24 18 14 08
23 29 23 29
23 21 32 24 27
27 27 24 26
26 27 23
91
37 28 37 89 91 73 51 55 56 18
80 89 71 91
44 74 49 87 91
89 91 80 87
78 91 81
a SE
Source
Includes grain snacks such as crackers salty snacks popcorn and pretzels = Standard error
US EPA analysis of the 1994ndash1996 CSFII
Exposure F
actors Handbook
Chapter 12mdash
Intake of Grain Products
Page E
xposure Factors H
andbook 12-28
September 2011
Table 12-20 Per Capita Intake of Breakfast Foods a Based on 1994ndash1996 1998 CSFII (gkg-day as-consumed)
Population Group Percent Consuming
Percentile Mean SE 1st 5th 10th 25th 50th 75th 90th 95th 99th
Max
Whole Population Age Group lt5 months 6 to 12 months lt1 year 1 to 2 years 3 to 5 years 6 to 11 years 12 to 19 years 20 to 39 years 40 to 69 years ge70 years Season Fall Spring Summer Winter Race Asian Black American IndianAlaska Native OtherNA White Region Midwest Northeast South West Urbanization Central City Suburban Non-metropolitan
118
00 42 20 204 208 237 130
89 95 104
116 116
128 113
59 127
88 102 120
121 127 107 124
120 122 107
01
00 01 01 04 04 04 01 01 01 01
01 01 01 01
01 01 01 01 01
01 01 01 02
01 01 01
001
000 024 016 007 006 005 003 002 001 002
002 002 002 002
007 003 008 005 001
002 003 002 002
002 002 002
00
00 00 00 00 00 00 00 00 00 00
00 00 00 00
00 00 00 00 00
00 00 00 00
00 00 00
00
00 00 00 00 00 00 00 00 00 00
00 00 00 00
00 00 00 00 00
00 00 00 00
00 00 00
00
00 00 00 00 00 00 00 00 00 00
00 00 00 00
00 00 00 00 00
00 00 00 00
00 00 00
00
00 00 00 00 00 00 00 00 00 00
00 00 00 00
00 00 00 00 00
00 00 00 00
00 00 00
00
00 00 00 00 00 00 00 00 00 00
00 00 00 00
00 00 00 00 00
00 00 00 00
00 00 00
00
00 00 00 00 00 00 00 00 00 00
00 00 00 00
00 00 00 00 00
00 00 00 00
00 00 00
04
00 00 00 19 16 15 05 00 00 01
04 04 05 03
00 04 00 00 04
04 05 02 05
04 05 03
10
00 00 00 27 25 22 09 06 06 07
10 10 10 09
06 12 03 09 10
11 12 08 10
10 10 09
24
00 41 27 48 45 34 23 15 14 12
23 23 24 26
20 21 12 26 24
26 23 22 26
25 24 22
136
00 41 41 136
80 65 39 30 38 35
136
64 60 80
28 67 12 80 136
67 80 78 136
136
78 64
a SE
Source
Includes breakfast food made with grains such as pancakes waffles and French toast = Standard error
US EPA analysis of the 1994ndash1996 CSFII
Exposure F
actors Handbook
Chapter 12mdash
Intake of Grain Products
Exposure F
actors Handbook
Page Septem
ber 2011 12-29
Table 12-21 Per Capita Intake of Pasta Based on 1994ndash1996 1998 CSFII (gkg-day as-consumed) Population Group
Percent
Consuming Percentile
Mean SE 1st 5th 10th 25th 50th 75th 90th 95th 99th Max Whole Population
Age Group lt5 months 6 to 12 months lt1 year 1 to 2 years 3 to 5 years 6 to 11 years 12 to 19 years 20 to 39 years 40 to 69 years ge70 years Season Fall Spring Summer Winter Race Asian Black American IndianAlaska Native OtherNA White Region Midwest Northeast South West Urbanization Central City Suburban Non-metropolitan
130
00 75 35 160 128 134
117 139 137 90
136 132 126 126
194 70 18 96 141
121 201 95 132
134 140 103
03
00 01 01 08 06 05 03 03 02 02
03 03 03 03
05 02 01 02 03
03 05 02 03
03 03 02
002
000 022 015 015 013 012 009 004 003 006
005 005 005 006
017 010 023 009 003
005 005 005 005
005 003 005
00
00 00 00 00 00 00 00 00 00 00
00 00 00 00
00 00 00 00 00
00 00 00 00
00 00 00
00
00 00 00 00 00 00 00 00 00 00
00 00 00 00
00 00 00 00 00
00 00 00 00
00 00 00
00
00 00 00 00 00 00 00 00 00 00
00 00 00 00
00 00 00 00 00
00 00 00 00
00 00 00
00
00 00 00 00 00 00 00 00 00 00
00 00 00 00
00 00 00 00 00
00 00 00 00
00 00 00
00
00 00 00 00 00 00 00 00 00 00
00 00 00 00
00 00 00 00 00
00 00 00 00
00 00 00
00
00 00 00 00 00 00 00 00 00 00
00 00 00 00
00 00 00 00 00
00 00 00 00
00 00 00
10
00 00 00 34 21 20 08 11 10 00
12 11 09 08
20 00 00 00 11
08 19 00 09
12 12 01
22
00 10 00 62 44 38 21 22 19 13
24 23 21 21
33 17 00 20 23
21 28 18 22
25 22 15
51
00 33 23 106
84 75 42 41 36 29
47 58 52 51
66 36 24 35 53
52 59 44 57
53 53 42
291
00 67 67 167 143
119 291
112 118
77
167 147 154 291
112 291
36 154 167
167 154 291 141
291 167 141
SE
Source
= Standard error
US EPA analysis of the 1994ndash1996 CSFII
Exposure F
actors Handbook
Chapter 12mdash
Intake of Grain Products
Page E
xposure Factors H
andbook 12-30
September 2011
Table 12-22 Per Capita Intake of Cooked Cereals Based on 1994ndash1996 1998 CSFII (gkg-day as-consumed)
Population Group Percent Consuming
Percentile Mean SE 1st 5th 10th 25th 50th 75th 90th 95th 99th Max
Whole Population Age Group lt5 months 6 to 12 months lt1 year 1 to 2 years 3 to 5 years 6 to 11 years 12 to 19 years 20 to 39 years 40 to 69 years ge70 years Season Fall Spring Summer Winter Race Asian Black American IndianAlaska Native OtherNA White Region Midwest Northeast South West Urbanization Central City Suburban Non-metropolitan
104
09 166
83 184 160
87 56 62
116 245
120
91 93
111
44 201
76 76 93
96 90 124
94
116 99 97
04
01 19 09 16 13 05 02 01 03 06
04 03 03 04
02 07 03 04 03
03 03 04 04
04 03 03
004
054 118 082 029 028 017 009 005 003 007
008 006 008 008
020 010 032 030 004
007 010 006 009
008 005 007
00
00 00 00 00 00 00 00 00 00 00
00 00 00 00
00 00 00 00 00
00 00 00 00
00 00 00
00
00 00 00 00 00 00 00 00 00 00
00 00 00 00
00 00 00 00 00
00 00 00 00
00 00 00
00
00 00 00 00 00 00 00 00 00 00
00 00 00 00
00 00 00 00 00
00 00 00 00
00 00 00
00
00 00 00 00 00 00 00 00 00 00
00 00 00 00
00 00 00 00 00
00 00 00 00
00 00 00
00
00 00 00 00 00 00 00 00 00 00
00 00 00 00
00 00 00 00 00
00 00 00 00
00 00 00
00
00 00 00 00 00 00 00 00 00 00
00 00 00 00
00 00 00 00 00
00 00 00 00
00 00 00
06
00 94 00 69 53 00 00 00 09 22
11 00 00 09
00 22 00 00 00
00 00 11 00
09 00 00
23
00 161
57 107
79 40 10 11 19 34
26 20 21 25
00 44 21 20 20
21 22 26 23
26 21 23
72
00 228 228 206 161
94 43 33 44 56
81 64 69 74
53 109
58 106
61
57 59 79 80
81 69 57
725
56 228 228 339 725 241 106
92 87 106
459 209 725 445
161 339 123 725 459
459 725 317 395
725 459 269
SE
Source
= Standard error
US EPA analysis of the 1994ndash1996 CSFII
Exposure F
actors Handbook
Chapter 12mdash
Intake of Grain Products
Exposure F
actors Handbook
Page Septem
ber 2011 12-31
Table 12-23 Per Capita Intake of Ready-to-Eat Cereals a Based on 1994ndash1996 1998 CSFII (gkg-day as-consumed)
Population Group Percent Consuming
Percentile Mean SE 1st 5th 10th 25th 50th 75th 90th 95th 99th Max
Whole Population Age
lt5 months 6 to 12 months lt1 year 1 to 2 years 3 to 5 years 6 to 11 years 12 to 19 years 20 to 39 years 40 to 69 years ge70 years Season Fall Spring Summer Winter Race Asian Black American IndianAlaska Native OtherNA White Region Midwest Northeast South West Urbanization Central City Suburban Non-metropolitan
397
00 199
93 649 698 640 457 305 318 479
391 401 396 399
254 340 331 333 417
422 423 374 384
400 412 358
03
00 01 01 10 11 08 04 02 02 02
03 03 03 03
02 03 03 03 03
04 04 03 03
03 04 03
001
000 007 005 004 004 003 002 001 001 001
002 002 002 002
005 002 009 004 001
002 002 001 002
001 001 001
00
00 00 00 00 00 00 00 00 00 00
00 00 00 00
00 00 00 00 00
00 00 00 00
00 00 00
00
00 00 00 00 00 00 00 00 00 00
00 00 00 00
00 00 00 00 00
00 00 00 00
00 00 00
00
00 00 00 00 00 00 00 00 00 00
00 00 00 00
00 00 00 00 00
00 00 00 00
00 00 00
00
00 00 00 00 00 00 00 00 00 00
00 00 00 00
00 00 00 00 00
00 00 00 00
00 00 00
00
00 00 00 07 09 06 00 00 00 00
00 00 00 00
00 00 00 00 00
00 00 00 00
00 00 00
04
00 00 00 15 17 12 06 03 02 04
04 04 04 05
01 04 04 03 05
05 05 04 04
05 05 04
10
00 03 00 25 26 20 11 07 06 07
11 10 11 10
08 10 08 11 11
11 11 10 11
11 11 08
15
00 10 03 33 33 25 15 10 09 09
16 15 16 14
12 15 14 17 15
16 16 13 16
15 16 12
29
00 18 17 49 48 40 22 17 14 15
29 29 30 27
27 32 26 30 28
29 29 28 31
28 31 26
101
00 26 26 88 101
80 64 53 52 27
88 77 78 101
49 101
44 66 88
80 80 101
88
101 80 88
a SE
Source
Includes dry ready-to-eat corn rice wheat and bran cereals in the form of flakes puffs etc = Standard error
US EPA analysis of the 1994ndash1996 CSFII
Exposure F
actors Handbook
Chapter 12mdash
Intake of Grain Products
Page E
xposure Factors H
andbook 12-32
September 2011
Table 12-24 Per Capita Intake of Baby Cereals Based on 1994ndash1996 1998 CSFII (gkg-day as-consumed)
Population Group Percent Consuming
Percentile Mean SE 1st 5th 10th 25th 50th 75th 90th 95th 99th Max
Whole Population Age
lt5 months 6 to 12 months lt1 year 1 to 2 years 3 to 5 years 6 to 11 years 12 to 19 years 20 to 39 years 40 to 69 years ge70 years Season Fall Spring Summer Winter Race Asian Black American IndianAlaska Native OtherNA White Region Midwest Northeast South West Urbanization Central City Suburban Non-metropolitan
10
408 678 534
62 03 01 00 00 01 00
09 12 08 11
07 10 06 17 10
11 12 09 09
11 11 08
00
08 25 16 02 00 00 00 00 00 00
00 00 00 00
00 00 00 01 00
00 00 00 00
00 00 00
003
024 045 027 010 006 000 000 000 000 000
007 005 006 006
004 012 004 020 003
008 004 005 006
006 004 006
00
00 00 00 00 00 00 00 00 00 00
00 00 00 00
00 00 00 00 00
00 00 00 00
00 00 00
00
00 00 00 00 00 00 00 00 00 00
00 00 00 00
00 00 00 00 00
00 00 00 00
00 00 00
00
00 00 00 00 00 00 00 00 00 00
00 00 00 00
00 00 00 00 00
00 00 00 00
00 00 00
00
00 00 00 00 00 00 00 00 00 00
00 00 00 00
00 00 00 00 00
00 00 00 00
00 00 00
00
00 08 02 00 00 00 00 00 00 00
00 00 00 00
00 00 00 00 00
00 00 00 00
00 00 00
00
10 28 17 00 00 00 00 00 00 00
00 00 00 00
00 00 00 00 00
00 00 00 00
00 00 00
00
24 69 41 00 00 00 00 00 00 00
00 00 00 00
00 00 00 00 00
00 00 00 00
00 00 00
00
31 113
73 08 00 00 00 00 00 00
00 00 00 00
00 00 00 00 00
00 00 00 00
00 00 00
01
88 211 197
58 00 00 00 00 00 00
00 06 00 03
00 00 00 12 00
03 05 00 00
03 01 00
376
266 376 376 125
38 01 00 00 03 00
211 266 260 376
21 376
09 266 260
211 125 376 266
376 211 260
SE
Source
= Standard error
US EPA analysis of the 1994ndash1996 CSFII
Exposure F
actors Handbook
Chapter 12mdash
Intake of Grain Products
Exposure F
actors Handbook
Page Septem
ber 2011 12-33
Table 12-25 Quantity (as-consumed) of Grain Products Consumed per Eating Occasion and the Percentage of Individuals Using These Foods in 2 Days
Indiv Using Quantity Consumed per Consumers Only Food at Least Eating Occasion Quantity Consumed per Eating Occasion at Specified Percentiles
Food Category Once in 2 days (grams) (grams) Average SE 5th 10th 25th 50th 75th 90th 95th
White bread 596 50 1 21 24 33 46 52 78 104 Whole grain and wheat bread 281 50 1 24 25 37 50 56 72 92 Rolls 480 58 1 27 33 43 48 70 89 110 Biscuits 109 61 1 19 19 35 57 76 104 139 Tortillas 155 60 1 14 21 32 48 79 107 135 Quick breads and muffins 125 82 2 21 28 52 60 94 142 187 Doughnuts and sweet rolls 124 77 1 26 36 47 65 93 133 164 Crackers 174 26 1 6 9 12 18 30 47 62 Cookies 307 40 1 9 12 20 31 50 75 96 Cake 162 92 3 22 28 41 77 116 181 217 Pie 85 150 3 52 72 102 143 168 246 300 Pancakes and waffles 103 85 3 21 35 42 75 109 158 205 Cooked cereal 103 248 6 81 117 157 233 291 455 484 Oatmeal 61 264 6 116 117 176 232 333 454 473 Ready-to-eat cereal 406 54 1 18 24 30 46 67 93 113 Corn flakes 81 46 1 17 22 25 37 56 75 100 Toasted oat rings 68 42 1 14 16 27 38 54 65 83 Rice 280 150 3 27 40 76 131 192 312 334 Pasta 360 162 3 26 43 73 133 210 318 420 Macaroni and cheese 85 244 9 53 81 121 191 324 477 556 Spaghetti with tomato sauce 80 436 15 122 124 246 371 494 740 983 Pizza 199 169 5 36 52 78 140 214 338 422 SE = Standard error
Source Smiciklas-Wright et al (2002) (based on 1994ndash1996 CSFII data)
Exposure F
actors Handbook
Chapter 12mdash
Intake of Grain Products
Page E
xposure Factors H
andbook 12-34
September 2011
Table 12-26 Quantity (as-consumed) of Grain Products Consumed per Eating Occasion and Percentage of Individuals Using These Foods in 2 Days by Sex and Age
Food Category
Quantity Consumed per Eating Occasion (grams) 2 to 5 years 6 to 11 years 12 to 19 years
Males and Females (N = 2109)
Males and Females Males (N = 1432) (N = 696)
Females (N = 702)
PC Mean SE PC Mean SE PC Mean SE PC Mean SE White bread
Whole grain and wheat bread Rolls Biscuits
Tortillas Quick breads and muffins
Doughnuts and sweet rolls Crackers
Cookies Cake
Pie Pancakes and waffles Cooked cereal
Oatmeal Ready-to-eat cereal Corn flakes Toasted oat rings Rice
Pasta Macaroni and cheese Spaghetti with tomato sauce
Pizza Corn chips
Popcorn
669 243 400
83 146
96 113
254 510 146
29 191 168 104 729
112 206 296 494 178 168 237 196
116
34 37 39 38 32 55 59 17 28 70 76 49
211 221
33 33 30 84 90 159 242
86 29 20
a
1 1 2 2 4 2 1 1 3 8 1
10 9 1 2 1 3 3 8 11 3 2 1
671 205 535
97 164
96 134 172 467 197
56 215
90 57 673 131 125 246 414 132
115 328 256 127
42 44 48 48 47 67 69 26 37 79
116 77 245 256
47 42 45 124 130 217 322 108
33 31
1 1 1 3 2 5 2 2 2 4 8 3
14 19
1 2 2 6 5
13 18
6 2 2
613 145 619 122 229
110 173 106 290 151
66 135
52 24 456 104
73 242 334
75 101 396 269
78
56 60 69 72 76 125 102
39 53 99 188
96 310b
348b
72 62 62 203 203 408 583 205
58 54
1 2 2 4 5
12 12
5 3 9
15 6
29b
45b
3 4 5
10 9
46 46 13
5 5
579 176 488 103 201
110 138 142 318 155
48 82 60 23 463
87 81 288 378 107
85 305 251 105
47 53 51 55 56 79 78 26 42 85
138b
74 256b
321b
52 49 42 157 155 260 479 143
44 37
1 2 1 4 3
10 5 3 2 8
12b
5 31b
40b
2 4 3
10 9
30 51
8 3 4
Exposure F
actors Handbook
Chapter 12mdash
Intake of Grain Products
Exposure F
actors Handbook
Page Septem
ber 2011 12-35
Exposure F
actors Handbook
Chapter 12mdash
Intake of Grain Products
Page E
xposure Factors H
andbook 12-36
September 2011
Table 12-26 Quantity (as-consumed) of Grain Products Consumed per Eating Occasion and Percentage of Individuals Using These Foods in 2 Days by Sex and Age (continued)
Food Category
Quantity Consumed per Eating Occasion (g) 20 to lt40 years 40 to lt60 years gt60 years
Males Females (N = 1543) (N = 1449)
Males Females (N = 1663) (N = 1694)
Males Females (N = 1545) (N = 1429)
PC Mean SE PC Mean SE PC Mean SE PC Mean SE PC Mean SE PC Mean SE White bread
Whole grain and wheat bread Rolls Biscuits
Tortillas Quick breads and muffins
Doughnuts and sweet rolls Crackers
Cookies Cake
Pie Pancakes and waffles Cooked cereal
Oatmeal Ready-to-eat cereal Corn flakes Toasted oat rings Rice
Pasta Macaroni and cheese
Spaghetti with tomato sauce Pizza
Corn chips Popcorn
630 253 620
115 206
80 133
119 208 135
58 80 52 27 269
65 42 308 371
78 86 237 162
81
63 63 73 73 79 93 94 36 56
113 161 126 313 360a
77 73 62 199 214 301 630 253
61 63
2 1 4 3 4 7 5 3 4 6 7
15 30 42a
3 6 4 9 8
19 48 12
5 6
549 252 464
94 201
113 112
156 265 149
72 74 73 37 347
53 54 321 371
78 78 202 179
97
47 48 53 55 53 79 68 28 39 94 150
80 219 258
55 43 42 139 155 235 385 150
35 35
1 1 1 2 2 5 2 2 2 7 9 6 11
17 1 2 2 6 6
19 22
6 2 2
597 328 479 134 134 157 134 166 276 165
118 75 97 60 298
59 48 294 343
61 55 130 128
96
59 57 65 80 67 93 88 30 47 108 162
117 300 332
68 49 46 167 208 302 543 220
47 50
2 1 1 3 3 7 4 1 2 6 6 8
16 16
2 3 2 5 7
31 59 13
4 4
553 323 434
112 127 149
110 175 290 168
99 80 103
62 297
52 41 288 347
60 54 145 120 109
46 46 52 56 52 72 72 24 36 83 151
74 243 242
51 40 35 130 140 210 386 147
33 39
1 2 1 2 2 4 4 1 1 4 8 5 11
10 1 3 2 4 5
12 18
8 2 3
593 398 378 130
42 174
114 256 297 192 164 108 209 136 446 124
43 231 279
71 50 53 48 61
51 48 54 58 47 86 65 23 40 85 154
99 255 257
53 37 36 147 167 230 450 187
30 52
1 1 1 3 4 5 2 1 2 4 7 5 8
10 1 2 3 6 7
13 22 18
3 4
548 431 306
98 54 183 104 259 322 183 133
82 202 129 440 104
49 214 279
65 45 47 53 76
41 41 43 48 41 72 56 17 30 87 137
68 216 224
41 30 27
118 132 215 379 109
21 34
1 1 1 3 2 4 2 1 1 7 5 4 8
10 1 1 2 5 5
18 33
8 2 3
a Indicates a SE value that is greater than 0 but less than 05 b Indicates a statistic that is potentially unreliable because of small sample size or large coefficient of variation N = Sample size
PC = Percent consuming at least once in 2 days SE = Standard error of the mean
Source Smiciklas-Wright et al (2002) (based on 1994ndash1996 CSFII data)
Exposure Factors Handbook
Chapter 12mdashIntake of Grain Products
Table 12-27 Consumption of Major Food Groups by Older Adults Median Daily Servings (and ranges) by Demographic and Health Characteristics
Subject Characteristic N Bread Cereal Rice and Pasta (servingsday) Sex a
Females 80 27 (09ndash65) Males 50 36 (14ndash73)
Ethnicity African American 44 33 (14ndash64) European American 47 32 (09ndash68) Native American 39 29 (11ndash73)
Age 70 to 74 years 42 33 (11ndash63) 75 to 79 years 36 30 (09ndash68) 80 to 84 years 36 32 (15ndash64) gt85 years 16 36 (16ndash73)
Marital Status Married 49 33 (11ndash58) Not Married 81 30 (09ndash73)
Education 8th grade or less 37 31 (11ndash73) 9th to 12th grades 47 33 (11ndash68) gtHigh School 46 32 (09ndash65)
Dentures Yes 83 33 (11ndash64) No 47 31 (09ndash73)
Chronic Diseases 0 7 41 (22ndash64) 1 31 33 (09ndash73) 2 56 31 (11ndash58) 3 26 37 (11ndash58) gt4 10 29 (14ndash53)
Weightb
le130 pounds 18 31 (11ndash54) 131 to 150 pounds 32 33 (09ndash52) 151 to 170 pounds 27 31 (14ndash73) 171 to 190 pounds 22 36 (14ndash62) ge191 pounds 29 30 (11ndash68)
a p lt 005 b 2 missing values N = Number of subjects
Source Vitolins et al (2002)
Exposure Factors Handbook Page September 2011 12-37
Exposure Factors Handbook
Chapter 12mdashIntake of Grain Products
Table 12-28 Characteristics of the Feeding Infant and Toddlers Study (FITS) Sample Population Sample Size Percentage of Sample
Sex Males Females
1549 1473
513 487
Age of Child 4 to 6 months 7 to 8 months 9 to 11 months 12 to 14 months 15 to 18 months 19 to 24 months
862 483 679 374 308 316
285 160 225 124 102 104
Childrsquos Ethnicity Hispanic or Latino Non-Hispanic or Latino Missing
367 2641
14
121 874 05
Childrsquos Race White Black Other
2417 225 380
800 74 126
Urbanicity Urban Suburban Rural Missing
1389 1014 577 42
460 336 191 13
Household Income Under $10000 $10000 to $14999 $15000 to $24999 $25000 to $34999 $35000 to $49999 $50000 to $74999 $75000 to $99999 $100000 and Over Missing
48 48
221 359 723 588 311 272 452
16 16 73 119 239 195 103 90 149
Receives WIC Yes No Missing
821 2196
5
272 726 02
Sample Size (Unweighted) 3022 1000 WIC = Special Supplemental Nutrition Program for Women Infants and Children
Source Devaney et al (2004)
Page Exposure Factors Handbook 12-38 September 2011
Table 12-29 Percentage of Infants and Toddlers Consuming Different Types of Grain Products Percentage of Infants and Toddlers Consuming at Least Once in a Day
Food GroupFood 4 to 6 7 to 8 9 to 11 12 to 14 15 to 18 19 to 24 Months Months Months Months Months Months
Any Grain or Grain Product 658 915 975 978 986 992 Infant Cereals 648 812 638 239 92 31 Non-infant Cerealsa 06 183 443 589 605 519
Not Pre-sweetened 05 170 370 445 406 319 Pre-sweetenedb 00 18 90 177 264 227
Breads and Rollsc 06 99 245 473 527 531 Crackers Pretzels Rice Cakes 30 162 334 452 464 447 Cereal or Granola Bars 00 11 34 98 100 97 Pancakes Waffles French Toast 01 08 75 151 161 154 Rice and Pastad 23 45 182 262 390 359 Other 02 01 27 28 25 45 Grains in Mixed Dishes 04 53 241 483 520 551 Sandwiches 00 11 86 215 258 258 Burrito Taco Enchilada Nachos 00 00 10 45 28 21 Macaroni and Cheese 02 16 49 146 150 150 Pizza 01 07 22 68 90 94 Pot PieHot Pocket 00 09 05 20 10 18 Spaghetti Ravioli Lasagna 01 18 99 153 121 88 a Includes both ready-to-eat and cooked cereals b Defined as cereals with more than 211 grams sugar per 100 grams c Does not include bread in sandwiches Sandwiches are included in mixed dishes d Does not include rice or pasta in mixed dishes
Source Fox et al (2004)
Exposure Factors Handbook
Chapter 12mdashIntake of Grain Products
Exposure Factors Handbook Page September 2011 12-39
Table 12-30
a Characteristics of Women Infants and Children (WIC) Participants and Non-Participants (percentages)
Infants 4 to 6 month Infants 7 to 11 month Toddlers 12 to 24 month WIC
Participant Non-Participant WIC
Participant Non-Participant WIC
Participant Non-Participant Sex Males 55 Females 45
Childrsquos Ethnicity Hispanic or Latino 20 Non-Hispanic or Latino 80
Childrsquos Race White 69 Black 15 Other 22
Child in Daycare Yes 39 No 61 Age of Mother 14 to 19 years 18 20 to 24 years 33 25 to 29 years 29 30 to 34 years 9 gt35 years 9 Missing 2
Motherrsquos Education 11th Grade or Less 23 Completed High School 35 Some Postsecondary 33 Completed College 7 Missing 2
Parentrsquos Marital Status Married 49 Not Married 50 Missing 1
Mother or Female Guardian Works Yes 46 No 53 Missing 1
54 46
b
11 89
b 84
4 11
38 62
b 1
13 29 33 23
2 b 2
19 26 53
1 b
93 7 1
51 48
1
55 45
24 76
63 17 20
34 66
13 38 23 15
11 1 15 42 32
9 2 57 42
1 45 54
1
51 49
b 8
92 b
86 5 9 b
46 54
b 1 11
30 36 21
1 b 2
20 27 51
0 b
93 7 0 b
60 40
0
57 43
22 78
67 13 20
43 57
9
33 29 18
11 0
17 42 31
9 1
58 41
1
55 45
0
52 48
b 10 89
b 84
5 11
c
53 47
b 1
14 26 34 26
1 b 3
19 28 48
2 b
88 11 1
c
61 38
1
Exposure Factors Handbook
Chapter 12mdashIntake of Grain Products
Page Exposure Factors Handbook 12-40 September 2011
c
Table 12-30 Characteristics of Women Infants and Children (WIC) Participants and Non-Participantsa
(percentages) (continued) Infants 4 to 6 months Infants 7 to 11 months Toddlers 12 to 24 months
WIC WIC WIC Participant Non-Participant Participant Non-Participant Participant Non-Participant
Urbanicity c c c
Urban 34 55 37 50 35 48 Suburban 36 31 31 34 35 35 Rural 28 13 30 15 28 16 Missing 2 1 2 1 2 2
Sample Size (Unweighted) 265 597 351 808 205 791 a χ2 tests were conducted to test for statistical significance in the differences between WIC participants and nonshy
participants within each age group for each variable The results of χ2 tests are listed next to the variable under the column labeled non-participants for each of the three age groups
b = p lt 005 non-participants significantly different from WIC participants on the variable = p lt 001 non-participants significantly different from WIC participants on the variable
WIC = Special Supplemental Nutrition Program for Women Infants and Children
Source Ponza et al (2004)
Table 12-31 Food Choices for Infants and Toddlers by Women Infants and Children (WIC) Participation Status
Infants 4 to 6 months Infants 7 to 11 months Toddlers 12 to 24 months WIC Non- WIC Non- WIC Non-
Participant Participant Participant Participant Participant Participant 697 Infant Cereals 697 625 747 135 92
Non-infant Cereals Total 09 05 217 385a 581 560
Not Pre-sweetened 05 05 187 329a 437 363 Pre-sweetened 00 00 40 69 177 241
Grains in Combination Foods 09 01 188 147 503 529 Sample Size (unweighted) 265 597 351 808 205 791 a = p lt 001 non-participants significantly different from WIC participants WIC = Special Supplemental Nutrition Program for Women Infants and Children
Source Ponza et al (2004)
Exposure Factors Handbook
Chapter 12mdashIntake of Grain Products
Exposure Factors Handbook Page September 2011 12-41
Table 12-32 Average Portion Sizes per Eating Occasion of Grain Products Commonly Consumed by Infants From the 2002 Feeding Infants and Toddlers Study
4 to 5 months 6 to 8 months 9 to 11 months Reference Food Group (N = 624) (N = 708) (N = 687) Unit Mean plusmn SE Infant cereal dry tablespoon 31 plusmn 014 45 plusmn 014 52 plusmn 018 Infant cereal jarred tablespoon - 56 plusmn 026 74 plusmn 034 Ready-to-eat cereal tablespoon - 23 plusmn 034 34 plusmn 021 Crackers ounce - 02 plusmn 002 03 plusmn 001 Crackers saltine - 22 plusmn 014 27 plusmn 012 Bread slice - 05 plusmn 010 08 plusmn 006 - = Cell size was too small to generate a reliable estimate N = Number of respondents SE = Standard error of the mean
Source Fox et al (2006)
Exposure Factors Handbook
Chapter 12mdashIntake of Grain Products
Table 12-33 Average Portion Sizes per Eating Occasion of Grain Products Commonly Consumed by Toddlers From the 2002 Feeding Infants and Toddlers Study
Food Group Reference Unit 12 to 14 months
(N = 371) 15 to 18 months
(N = 312) 19 to 24 months (N = 320)
Mean plusmn SE Bread slice 08 plusmn 004 09 plusmn 005 09 plusmn 005 Rolls ounce 09 plusmn 011 10 plusmn 010 09 plusmn 015 Ready-to-eat cereal cup 03 plusmn 002 05 plusmn 003 06 plusmn 004 Hot cereal prepared cup 06 plusmn 005 06 plusmn 005 07 plusmn 005 Crackers ounce 03 plusmn 002 04 plusmn 002 04 plusmn 002 Crackers saltine 33 plusmn 022 35 plusmn 022 37 plusmn 022 Pasta cup 04 plusmn 004 04 plusmn 004 05 plusmn 005 Rice cup 03 plusmn 004 04 plusmn 005 04 plusmn 005 Pancakes and waffles 1 (4-inch diameter) 10 plusmn 008 14 plusmn 021 14 plusmn 017 N = Number of respondents SE = Standard error of the mean
Source Fox et al (2006)
Page Exposure Factors Handbook 12-42 September 2011
c
Table 12-34 Percentage of Hispanic and Non-Hispanic Infants and Toddlers Consuming Different Types of Grain Products on a Given Day Age 4 to 5 months Age 6 to 11 months Age 12 to 24 months
Hispanic Non-Hispanic Hispanic Non-Hispanic Hispanic Non-Hispanic (N = 84) (N = 538) (N = 163) (N = 1228) (N = 124) (N = 871)
Any Grain or Grain Product Infant Cereal Non-infant Cereal Breadsb
Tortillas Crackers Pretzels Rice Cakes Pancakes Waffles French Toast Rice and Pastad
Rice Grains in Mixed Dishes
Sandwiches Burrito Taco Enchilada Nachos
565 552
-14c
14c
13c
------
569 565
----------
950 741 185a
182 40c
278 14c
201a
159e
159 40c
13c
935 736 292 151
-225 43
103 47
130 46 -
971 159 453 440 67a c
356 130 443
269a c
388a
242 21c
989 93
578 529 06c
469 160 329 130 544 249 30
Macaroni and Cheese - - 30c 31 101 155
Pizza - - - 14 10c e 97
Spaghetti Ravioli Lasagna - - 83c 46 93c 121 a = Significantly different from non-Hispanic at p lt 005 b Does not include bread in sandwiches Sandwiches are included in mixed dishes Includes tortillas also shown
separately = Statistic is potentially unreliable because of a high coefficient of variation
d Does not include rice or pasta in mixed dishes Includes rice (eg white brown wild and Spanish rice without meat) and pasta (eg spaghetti macaroni and egg noodles) Rice is also shown separately
e = Significantly different from non-Hispanic at p lt 001 - = Less than 1 of the group consumed this food on a given day N = Sample size
Source Mennella et al (2006)
Exposure Factors Handbook
Chapter 12mdashIntake of Grain Products
Exposure Factors Handbook Page September 2011 12-43
Exposure Factors Handbook
Chapter 12mdashIntake of Grain Products
Table 12-35 Mean Moisture Content of Selected Grain Products Expressed as Percentages of Edible Portions (grams per 100 grams of edible portion)
Food Moisture Content Comments Raw Cooked Barley―pearled 1009 6880 Corn―grain―endosperm 1037 -Corn―grain―bran 471 - crude Millet 867 7141 Oats 822 -Rice―white―long-grained 1162 6844 Rye 1095 -Rye―flour―medium 985 -Sorghum 920 -Wheat―hard white 957 -Wheat―germ 1112 - crude Wheat―bran 989 - crude Wheat―flour―whole grain 1027 -- Indicates that the grain product was not assessed for water content under these conditions
Source USDA (2007)
Page Exposure Factors Handbook 12-44 September 2011
- TABLE OF CONTENTS
- LIST OF TABLES
- 12 INTAKE OF GRAIN PRODUCTS
-
- 121 INTRODUCTION
- 122 RECOMMENDATIONS
- 123 INTAKE STUDIES
-
- 1231 Key Grain Intake Study
-
- 12311 US EPA Analysis of Consumption Data From 2003minus2006 National Health and Nutrition Examination Survey (NHANES)
-
- 1232 Relevant Grain Intake Studies
-
- 12321 USDA (1996a b 1993 1980)mdashFood and Nutrient Intakes of Individuals in 1 Day in the United States
- 12322 USDA (1999b)mdashFood Consumption Prices and Expenditures 1970minus1997
- 12323 USDA (1999a)mdashFood and Nutrient Intakes by Children 1994minus1996 1998 Table Set 17
- 12324 US EPA Analysis of Continuing Survey of Food Intake by Individuals (CSFII) 1994minus1996 1998
- 12325 Smiciklas-Wright et al (2002)mdashFoods Commonly Eaten in the United States Quantities Consumed per Eating Occasion and in a Day 1994minus1996
- 12326 Vitolins et al (2002)mdashQuality of Diets Consumed by Older Rural Adults
- 12327 Fox et al (2004)mdashFeeding Infants and Toddlers Study What Foods Are Infants and Toddlers Eating
- 12328 Ponza et al (2004)mdashNutrient Food Intakes and Food Choices of Infants and Toddlers Participating in WIC
- 12329 Fox et al (2006)mdashAverage Portion of Foods Commonly Eaten by Infants and Toddlers in the United States
- 123210 Mennella et al (2006)mdashFeeding Infants and Toddlers Study The Types of Foods Fed to Hispanic Infants and Toddlers
-
- 124 CONVERSION BETWEEN WET- AND DRY-WEIGHT INTAKE RATES
- 125 REFERENCES FOR CHAPTER 12
-

Exposure F
actors Handbook
Chapter 12mdash
Intake of Grain Products
Table 12-12 Percentage of Individuals Under 20 Years of Age Consuming Grain Products by Sex and Age ()a
Age Group (years) Sample Size Totalb
Yeast Breads
and Rolls
Cereals and Pasta Quick Breads
Pancakes French Toast
Cakes Cookies Pastries
Pies
Crackers Popcorn Pretzels
Corn Chips
Mixtures Mainly GraincTotal
Ready-to-Eat
Cereals Rice Pasta
Males and Females lt1 1126 706 109 628 91 34 21 44 165 103 150 1 1016 982d 484 706 453 113 94 230 470 390 478 2 1102 990d 587 711 519 144 94 275 466 379 453 1 to 2 2118 987 537 709 487 129 94 253 468 384 465 3 1831 994d 641 697 533 111 86 288 461 385 490 4 1859 995d 670 691 548 114 71 286 523 394 462 5 884 999d 692 704 549 114 68 252 524 321 474 3 to 5 4574 996d 668 697 543 113 75 275 503 367 475 le5 7818 958 555 693 469 109 75 240 450 341 433
Males 6 to 9 787 989d 698 626 508 105 74 281 525 360 445 6 to 11 1031 990d 691 640 524 97 81 271 523 338 453 12 to 19 737 982d 627 446 332 100 59 244 413 272 462
Females 6 to 9 704 997d 715 612 476 90 79 263 571 383 480 6 to 11 969 993d 710 593 456 94 71 271 550 371 457 12 to 19 732 976d 609 459 303 86 93 198 406 309 461
Males and Females le9 9309 972 616 664 479 105 76 253 489 353 444 le19 11287 976 624 576 417 99 76 242 461 325 451 a Based on data from 1994ndash1996 1998 CSFII b Includes yeast breads rolls cereals pastas quick breads pancakes French toast cakes cookies pastries pies crackers popcorn
pretzels corn chips and mixtures having a grain product as a main ingredient Excludes grain products that were ingredients in food mixtures coded as a single item and tabulated under another food group for example noodles in tuna-noodle casserole are tabulated under Meat Poultry and Fish
c Includes mixtures having a grain product as a main ingredient such as burritos tacos pizza egg rolls quiche spaghetti with sauce rice and pasta mixtures frozen meals in which the main course is a grain mixture noodle and rice soups and baby-food macaroni and spaghetti mixtures
d Estimate is not statistically reliable due to small sample size reporting intake Note Percentages shown are representative of the first day of each participantrsquos survey response
Source USDA (1999a)
Exposure F
actors Handbook
Page Septem
ber 2011 12-21
Page E
xposure Factors H
andbook 12-22
September 2011
Exposure F
actors Handbook
Chapter 12mdash
Intake of Grain Products
Table 12-13 Per Capita Intake of Total Grains Based on 1994ndash1996 1998 CSFII (gkg-day edible portion uncooked weight) Population Group N Percent
Consuming Mean SE Percentiles 1st 5th 10th 25th 50th 75th 90th 95th 99th Max
Whole Population Age group Birth to 1 year 1 to 2 years 3 to 5 years 6 to 12 years 13 to 19 years 20 to 49 years ge50 years Season Fall Spring Summer Winter Race Asian Pacific Islander Black American Indian Alaskan Native OtherNA White Region Midwest Northeast South West Urbanization Central City Suburban Non-metropolitan
20607
1486 2096 4391 2089 1222 4677 4646
4687 5308 5890 4722
557 2740
177 1638 15495
4822 3692 7208 4885
6164 9598 4845
995
705 998 1000 1000 1000
999 1000
995 996 995 995
985 994 997 988 996
997 996 995 994
995 995 996
27
25 64 63 43 25 22 17
26 27 26 27
36 26 29 31 26
27 28 25 28
27 27 24
00
01 01 01 01 01 00 00
00 00 00 00
02 01 02 01 00
00 00 00 01
00 00 01
02
00 11 18 09 04 03 03
02 02 03 02
00 01 03 00 03
03 03 02 02
01 03 03
06
00 21 26 17 08 06 06
06 06 07 06
11 05 05 07 07
07 07 06 07
06 07 06
09
00 28 32 20 11 08 07
09 08 09 09
15 07 08 09 09
09 10 08 09
09 09 08
13
00 42 43 28 15 13 11
13 13 13 14
23 11 13 15 13
14 14 12 14
13 14 12
21
16 59 59 40 23 19 15
21 21 21 21
32 19 22 24 20
21 22 19 22
21 21 19
33
38 79 78 54 31 28 21
33 34 33 33
47 33 42 41 32
34 35 30 35
35 34 29
52
62 104 99 70 44 39 28
50 55 51 52
62 54 63 61 50
53 53 50 54
54 53 48
68
86 121
115 82 51 47 35
66 70 68 68
73 73 75 77 66
70 68 66 70
70 69 63
103
127 168 156
111 79 71 49
100 105 105 101
112 115
120 117
98
104 110
97 103
107 100 104
316
263 316 270 172 124 161
112
263 294 282 316
246 294 168 270 316
238 316 282 208
294 316 238
N SE
Source
= Sample size = Standard error
US EPA analysis of 1994ndash1996 1998 CSFII
Exposure F
actors Handbook
Page Septem
ber 2011 12-23
Exposure F
actors Handbook
Chapter 12mdash
Intake of Grain Products
Table 12-14 Consumer-Only Intake of Total Grains Based on 1994ndash1996 1998 CSFII (gkg-day edible portion uncooked weight) Population Group N Mean SE Percentiles
1st 5th 10th 25th 50th 75th 90th 95th 99th Max Whole Population Age Group Birth to 1 year 1 to 2 years 3 to 5 years 6 to 12 years 13 to 19 years 20 to 49 years ge50 years Season Fall Spring Summer Winter Race Asian Pacific Islander Black American Indian Alaskan Native OtherNA White Region Midwest Northeast South West Urbanization Central City Suburban Non-metropolitan
20157
1048 2092 4389 2089 1222 4673 4644
4587 5190 5751 4629
527 2675
175 1570 15210
4743 3628 7053 4733
6023 9378 4756
27
36 64 63 43 25 22 17
26 27 27 27
37 26 30 32 26
27 28 25 28
28 27 24
00
01 01 01 01 01 00 00
00 00 00 00
02 01 02 01 00
00 00 00 01
00 00 01
03
01 12 18 09 04 03 03
03 03 04 03
08 02 03 05 04
04 04 03 04
03 04 03
07
03 21 26 17 08 06 06
07 07 07 07
12 05 05 07 07
07 08 06 07
07 07 06
09
06 28 32 20 11 08 07
09 09 09 09
16 07 08 10 09
09 10 08 09
09 09 08
13
14 42 43 28 15 13 11
13 13 14 14
23 11 13 15 13
14 14 12 14
13 14 12
21
28 59 59 40 23 19 15
21 21 21 21
32 19 22 24 20
21 22 19 22
21 21 19
33
48 79 78 54 31 28 21
33 34 33 33
47 33 42 41 32
34 35 30 35
35 34 29
52
74 104 99 70 44 39 28
50 55 52 52
62 54 63 62 51
53 53 50 54
54 53 48
68
92 121
115 82 51 47 35
66 70 68 68
73 73 75 77 66
70 68 66 70
70 69 64
103
134 168 156
111 79 71 49
100 106 105 101
112 115
120 117
98
104 110
98 103
107 100 104
316
263 316 270 172 124 161
112
263 294 282 316
246 294 168 270 316
238 316 282 208
294 316 238
N SE
Source
= Sample size = Standard error
US EPA analysis of 1994ndash1996 1998 CSFII
Table 12-15 Per Capita Intake of Individual Grain Products Based on 1994ndash1996 1998 CSFII (gkg-day edible portion uncooked weight)
Cereal Rice Population Group
N Percent Consuming Mean SE
Percent Consuming Mean SE
Whole Population Age Group
Birth to 1 year 1 to 2 years 3 to 5 years 6 to 12 years
13 to 19 years 20 to 49 years ge50 years Season Fall Spring Summer Winter Race Asian Pacific Islander Black American Indian Alaskan Native OtherNA White Region Midwest Northeast South West Urbanization Central City Suburban
Non-metropolitan
20607
1486 2096 4391 2089 1222 4677 4646
4687 5308 5890 4722
557 2740
177 1638 15495
4822 3692 7208 4885
6164 9598 4845
996
746 998 1000 1000 1000
999 1000
996 996 995 996
985 995 997 989 997
997 997 996 994
996 995 997
37
40 84 87 62 41 31 22
37 38 38 37
44 38 42 43 37
39 37 36 38
38 38 35
003
014 008 007 006 006 004 002
006 007 006 005
020 012 015 012 004
009 006 004 009
006 005 006
865
602 864 879 880 858 883 845
851 871 869 871
966 863 926 859 862
882 872 850 867
872 866 856
03
07 06 05 04 03 03 02
03 03 03 03
17 03 03 06 02
02 03 02 04
04 03 02
001
004 003 003 002 002 001 001
002 002 002 002
019 002 010 008 001
002 003 001 003
002 002 001
N SE
Source
= Sample size = Standard error
US EPA analysis of 1994ndash1996 1998 CSFII
Exposure Factors Handbook
Chapter 12mdashIntake of Grain Products
Page Exposure Factors Handbook 12-24 September 2011
Exposure Factors Handbook
Chapter 12mdashIntake of Grain Products
Table 12-16 Consumer-Only Intake of Individual Grain Products Based on 1994ndash1996 1998 CSFII (gkg-day edible portion uncooked weight )
Population Group N Cereal
Mean SE N Rice
Mean SE Whole Population 20227 38 003 17481 03 001 Age Group
Birth to 1 year 1116 54 016 900 12 007 1 to 2 years 2092 84 008 1819 07 004 3 to 5 years 4389 87 007 3869 06 003 6 to 12 years 2089 62 006 1847 04 002 13 to 19 years 1222 41 006 1038 03 003 20 to 49 years 4674 31 004 4102 03 001 ge50 years 4645 22 002 3906 02 001
Season Fall 4598 37 006 3957 03 002 Spring 5213 38 007 4530 03 002 Summer 5768 38 006 4989 03 002 Winter 4648 37 006 4005 03 002
Race Asian Pacific Islander 529 45 020 513 18 019 Black 2683 38 012 2346 04 002 American Indian Alaskan Native 175 43 015 151 03 010 OtherNA 1579 44 013 1375 07 008 White 15261 37 004 13096 02 001
Region Midwest 4759 39 009 4186 02 002 Northeast 3639 37 006 3152 04 004 South 7081 36 004 6029 03 001 West 4748 39 009 4114 05 003
Urbanization Central City 6039 38 006 5303 05 003 Suburban 9410 38 005 8105 03 002 Non-metropolitan 4778 36 006 4073 02 002
N = Sample size SE = Standard error
Source US EPA analysis of 1994ndash1996 1998 CSFII
Exposure Factors Handbook Page September 2011 12-25
Table 12-17 Per Capita Intake of Breads a Based on 1994ndash1996 1998 CSFII (gkg-day as-consumed)
Population Group Percent Consuming Mean
Percentile SE 1st 5th 10th 25th 50th 75th 90th 95th 99th Max
Whole Population Age Group lt5 months 6 to 12 months lt1 year 1 to 2 years 3 to 5 years 6 to 11 years 12 to 19 years 20 to 39 years 40 to 69 years ge70 years Season Fall Spring Summer Winter Race Asian Black American IndianAlaska Native OtherNA White Region Midwest Northeast South West Urbanization Central City Suburban Non-metropolitan
872
09 302 146 772 865 871 862 881 900 916
874 871 873 869
691 831 822 804 890
891 883 875 837
856 877 885
11
00 05 03 20 23 17 11 09 09 09
11 11 11 11
08 11 14 12 11
12 11 11 11
11 11 11
001
008 016 011 006 005 004 003 002 001 002
002 002 002 002
006 003 018 004 001
002 002 002 002
002 001 002
00
00 00 00 00 00 00 00 00 00 00
00 00 00 00
00 00 00 00 00
00 00 00 00
00 00 00
00
00 00 00 00 00 00 00 00 00 00
00 00 00 00
00 00 00 00 00
00 00 00 00
00 00 00
00
00 00 00 00 00 00 00 00 00 02
00 00 00 00
00 00 00 00 00
00 00 00 00
00 00 00
04
00 00 00 04 09 07 04 04 04 04
04 04 04 04
00 03 03 03 04
04 04 04 03
04 04 04
09
00 00 00 14 20 14 09 08 08 08
09 09 09 08
04 07 09 09 09
09 09 09 08
08 09 09
15
00 05 00 29 33 24 15 13 13 13
15 15 15 14
12 14 17 16 15
15 15 15 14
14 15 15
23
00 18 08 44 47 35 23 20 19 19
24 23 24 23
19 23 36 27 23
25 23 23 24
23 24 23
31
00 30 17 60 58 43 28 25 23 23
31 31 31 31
29 33 41 34 30
33 29 31 32
31 31 31
51
00 48 46 85 87 67 40 39 35 29
49 51 52 51
45 63 62 56 49
57 45 49 51
51 50 50
200
18 73 73 200 132
113 75 62 84 43
146 116
171 200
146 116
200 75 171
120 98 171 200
132 146 200
a SE
Source
Includes breads rolls muffins bagels biscuits cornbread and tortillas = Standard error
US EPA analysis of the 1994ndash1996 CSFII
Exposure F
actors Handbook
Chapter 12mdash
Intake of Grain Products
Page E
xposure Factors H
andbook 12-26
September 2011
Table 12-18 Per Capita Intake of Sweets a Based on 1994ndash1996 1998 CSFII (gkg-day as-consumed)
Population Group Percent Consuming
Percentile Mean SE 1st 5th 10th 25th 50th 75th 90th 95th 99th Max
Whole Population Age Group lt5 months 6 to 12 months lt1 year 1 to 2 years 3 to 5 years 6 to 11 years 12 to 19 years 20 to 39 years 40 to 69 years ge70 years Season Fall Spring Summer Winter Race Asian Black American IndianAlaska Native OtherNA White Region Midwest Northeast South West Urbanization Central City Suburban Non-metropolitan
526
25 230 121 532 621 642 543 472 529 586
537 522 500 545
402 414 353 350 563
601 554 491 477
512 546 505
06
00 03 02 12 13 12 06 04 05 05
06 06 05 06
04 05 04 04 06
07 06 06 05
06 06 06
001
004 014 010 007 006 006 003 002 002 003
003 002 002 003
008 004 011 005 001
003 003 002 002
002 002 003
00
00 00 00 00 00 00 00 00 00 00
00 00 00 00
00 00 00 00 00
00 00 00 00
00 00 00
00
00 00 00 00 00 00 00 00 00 00
00 00 00 00
00 00 00 00 00
00 00 00 00
00 00 00
00
00 00 00 00 00 00 00 00 00 00
00 00 00 00
00 00 00 00 00
00 00 00 00
00 00 00
00
00 00 00 00 00 00 00 00 00 00
00 00 00 00
00 00 00 00 00
00 00 00 00
00 00 00
01
00 00 00 03 08 06 02 00 01 02
02 01 00 02
00 00 00 00 02
03 02 00 00
01 02 01
08
00 00 00 17 19 17 10 06 07 08
09 08 07 09
06 06 03 05 09
10 09 08 07
08 09 08
18
00 11 04 35 36 32 18 14 13 16
18 18 16 19
14 15 17 13 18
20 17 17 16
16 18 18
25
00 20 10 48 46 39 24 19 19 21
25 26 23 26
20 23 21 19 25
29 25 23 23
23 26 25
46
04 36 36 72 88 67 37 32 32 36
47 47 41 48
31 47 28 41 47
53 48 44 38
46 45 51
220
06 64 64 193 220 209 107
111 73 57
209 220 182 123
157 193
29 70 220
220 127 209 157
209 127 220
a SE
Source
Includes breakfast foods made with grains such as pancakes waffles and French toast = Standard error
US EPA analysis of the 1994ndash1996 CSFII
Exposure F
actors Handbook
Chapter 12mdash
Intake of Grain Products
Exposure F
actors Handbook
Page Septem
ber 2011 12-27
Table 12-19 Per Capita Intake of Snacks Containing Grains a Based on 1994ndash1996 1998 CSFII (gkg-day as-consumed)
Population Group Percent Consuming
Percentile Mean SE 1st 5th 10th 25th 50th 75th 90th 95th 99th Max
Whole Population Age Group lt5 months 6 to 12 months lt1 year 1 to 2 years 3 to 5 years 6 to 11 years 12 to 19 years 20 to 39 years 40 to 69 years ge70 years Season Fall Spring Summer Winter Race Asian Black American IndianAlaska Native OtherNA White Region Midwest Northeast South West Urbanization Central City Suburban Non-metropolitan
431
10 290 141 581 567 513 450 411 411 377
423 436 406 458
241 295 383 284 471
492 419 411 407
401 446 441
02
00 03 01 07 07 05 03 02 01 01
02 03 02 03
01 02 02 02 03
03 02 02 02
02 03 02
001
011 008 006 004 004 003 002 001 001 001
001 001 001 002
004 002 008 003 001
001 002 001 002
001 001 001
00
00 00 00 00 00 00 00 00 00 00
00 00 00 00
00 00 00 00 00
00 00 00 00
00 00 00
00
00 00 00 00 00 00 00 00 00 00
00 00 00 00
00 00 00 00 00
00 00 00 00
00 00 00
00
00 00 00 00 00 00 00 00 00 00
00 00 00 00
00 00 00 00 00
00 00 00 00
00 00 00
00
00 00 00 00 00 00 00 00 00 00
00 00 00 00
00 00 00 00 00
00 00 00 00
00 00 00
00
00 00 00 04 03 01 00 00 00 00
00 00 00 00
00 00 00 00 00
00 00 00 00
00 00 00
03
00 02 00 11 09 06 04 02 02 01
03 03 02 03
00 01 02 01 03
03 02 02 02
02 03 03
07
00 09 06 20 18 13 09 06 05 03
07 08 07 08
04 05 06 05 08
08 07 07 07
07 07 07
12
00 22 09 28 32 19 14 09 07 05
10 13 10 13
10 09 11 08 12
12 12 11 12
11 12 11
26
01 25 22 50 59 46 24 18 14 08
23 29 23 29
23 21 32 24 27
27 27 24 26
26 27 23
91
37 28 37 89 91 73 51 55 56 18
80 89 71 91
44 74 49 87 91
89 91 80 87
78 91 81
a SE
Source
Includes grain snacks such as crackers salty snacks popcorn and pretzels = Standard error
US EPA analysis of the 1994ndash1996 CSFII
Exposure F
actors Handbook
Chapter 12mdash
Intake of Grain Products
Page E
xposure Factors H
andbook 12-28
September 2011
Table 12-20 Per Capita Intake of Breakfast Foods a Based on 1994ndash1996 1998 CSFII (gkg-day as-consumed)
Population Group Percent Consuming
Percentile Mean SE 1st 5th 10th 25th 50th 75th 90th 95th 99th
Max
Whole Population Age Group lt5 months 6 to 12 months lt1 year 1 to 2 years 3 to 5 years 6 to 11 years 12 to 19 years 20 to 39 years 40 to 69 years ge70 years Season Fall Spring Summer Winter Race Asian Black American IndianAlaska Native OtherNA White Region Midwest Northeast South West Urbanization Central City Suburban Non-metropolitan
118
00 42 20 204 208 237 130
89 95 104
116 116
128 113
59 127
88 102 120
121 127 107 124
120 122 107
01
00 01 01 04 04 04 01 01 01 01
01 01 01 01
01 01 01 01 01
01 01 01 02
01 01 01
001
000 024 016 007 006 005 003 002 001 002
002 002 002 002
007 003 008 005 001
002 003 002 002
002 002 002
00
00 00 00 00 00 00 00 00 00 00
00 00 00 00
00 00 00 00 00
00 00 00 00
00 00 00
00
00 00 00 00 00 00 00 00 00 00
00 00 00 00
00 00 00 00 00
00 00 00 00
00 00 00
00
00 00 00 00 00 00 00 00 00 00
00 00 00 00
00 00 00 00 00
00 00 00 00
00 00 00
00
00 00 00 00 00 00 00 00 00 00
00 00 00 00
00 00 00 00 00
00 00 00 00
00 00 00
00
00 00 00 00 00 00 00 00 00 00
00 00 00 00
00 00 00 00 00
00 00 00 00
00 00 00
00
00 00 00 00 00 00 00 00 00 00
00 00 00 00
00 00 00 00 00
00 00 00 00
00 00 00
04
00 00 00 19 16 15 05 00 00 01
04 04 05 03
00 04 00 00 04
04 05 02 05
04 05 03
10
00 00 00 27 25 22 09 06 06 07
10 10 10 09
06 12 03 09 10
11 12 08 10
10 10 09
24
00 41 27 48 45 34 23 15 14 12
23 23 24 26
20 21 12 26 24
26 23 22 26
25 24 22
136
00 41 41 136
80 65 39 30 38 35
136
64 60 80
28 67 12 80 136
67 80 78 136
136
78 64
a SE
Source
Includes breakfast food made with grains such as pancakes waffles and French toast = Standard error
US EPA analysis of the 1994ndash1996 CSFII
Exposure F
actors Handbook
Chapter 12mdash
Intake of Grain Products
Exposure F
actors Handbook
Page Septem
ber 2011 12-29
Table 12-21 Per Capita Intake of Pasta Based on 1994ndash1996 1998 CSFII (gkg-day as-consumed) Population Group
Percent
Consuming Percentile
Mean SE 1st 5th 10th 25th 50th 75th 90th 95th 99th Max Whole Population
Age Group lt5 months 6 to 12 months lt1 year 1 to 2 years 3 to 5 years 6 to 11 years 12 to 19 years 20 to 39 years 40 to 69 years ge70 years Season Fall Spring Summer Winter Race Asian Black American IndianAlaska Native OtherNA White Region Midwest Northeast South West Urbanization Central City Suburban Non-metropolitan
130
00 75 35 160 128 134
117 139 137 90
136 132 126 126
194 70 18 96 141
121 201 95 132
134 140 103
03
00 01 01 08 06 05 03 03 02 02
03 03 03 03
05 02 01 02 03
03 05 02 03
03 03 02
002
000 022 015 015 013 012 009 004 003 006
005 005 005 006
017 010 023 009 003
005 005 005 005
005 003 005
00
00 00 00 00 00 00 00 00 00 00
00 00 00 00
00 00 00 00 00
00 00 00 00
00 00 00
00
00 00 00 00 00 00 00 00 00 00
00 00 00 00
00 00 00 00 00
00 00 00 00
00 00 00
00
00 00 00 00 00 00 00 00 00 00
00 00 00 00
00 00 00 00 00
00 00 00 00
00 00 00
00
00 00 00 00 00 00 00 00 00 00
00 00 00 00
00 00 00 00 00
00 00 00 00
00 00 00
00
00 00 00 00 00 00 00 00 00 00
00 00 00 00
00 00 00 00 00
00 00 00 00
00 00 00
00
00 00 00 00 00 00 00 00 00 00
00 00 00 00
00 00 00 00 00
00 00 00 00
00 00 00
10
00 00 00 34 21 20 08 11 10 00
12 11 09 08
20 00 00 00 11
08 19 00 09
12 12 01
22
00 10 00 62 44 38 21 22 19 13
24 23 21 21
33 17 00 20 23
21 28 18 22
25 22 15
51
00 33 23 106
84 75 42 41 36 29
47 58 52 51
66 36 24 35 53
52 59 44 57
53 53 42
291
00 67 67 167 143
119 291
112 118
77
167 147 154 291
112 291
36 154 167
167 154 291 141
291 167 141
SE
Source
= Standard error
US EPA analysis of the 1994ndash1996 CSFII
Exposure F
actors Handbook
Chapter 12mdash
Intake of Grain Products
Page E
xposure Factors H
andbook 12-30
September 2011
Table 12-22 Per Capita Intake of Cooked Cereals Based on 1994ndash1996 1998 CSFII (gkg-day as-consumed)
Population Group Percent Consuming
Percentile Mean SE 1st 5th 10th 25th 50th 75th 90th 95th 99th Max
Whole Population Age Group lt5 months 6 to 12 months lt1 year 1 to 2 years 3 to 5 years 6 to 11 years 12 to 19 years 20 to 39 years 40 to 69 years ge70 years Season Fall Spring Summer Winter Race Asian Black American IndianAlaska Native OtherNA White Region Midwest Northeast South West Urbanization Central City Suburban Non-metropolitan
104
09 166
83 184 160
87 56 62
116 245
120
91 93
111
44 201
76 76 93
96 90 124
94
116 99 97
04
01 19 09 16 13 05 02 01 03 06
04 03 03 04
02 07 03 04 03
03 03 04 04
04 03 03
004
054 118 082 029 028 017 009 005 003 007
008 006 008 008
020 010 032 030 004
007 010 006 009
008 005 007
00
00 00 00 00 00 00 00 00 00 00
00 00 00 00
00 00 00 00 00
00 00 00 00
00 00 00
00
00 00 00 00 00 00 00 00 00 00
00 00 00 00
00 00 00 00 00
00 00 00 00
00 00 00
00
00 00 00 00 00 00 00 00 00 00
00 00 00 00
00 00 00 00 00
00 00 00 00
00 00 00
00
00 00 00 00 00 00 00 00 00 00
00 00 00 00
00 00 00 00 00
00 00 00 00
00 00 00
00
00 00 00 00 00 00 00 00 00 00
00 00 00 00
00 00 00 00 00
00 00 00 00
00 00 00
00
00 00 00 00 00 00 00 00 00 00
00 00 00 00
00 00 00 00 00
00 00 00 00
00 00 00
06
00 94 00 69 53 00 00 00 09 22
11 00 00 09
00 22 00 00 00
00 00 11 00
09 00 00
23
00 161
57 107
79 40 10 11 19 34
26 20 21 25
00 44 21 20 20
21 22 26 23
26 21 23
72
00 228 228 206 161
94 43 33 44 56
81 64 69 74
53 109
58 106
61
57 59 79 80
81 69 57
725
56 228 228 339 725 241 106
92 87 106
459 209 725 445
161 339 123 725 459
459 725 317 395
725 459 269
SE
Source
= Standard error
US EPA analysis of the 1994ndash1996 CSFII
Exposure F
actors Handbook
Chapter 12mdash
Intake of Grain Products
Exposure F
actors Handbook
Page Septem
ber 2011 12-31
Table 12-23 Per Capita Intake of Ready-to-Eat Cereals a Based on 1994ndash1996 1998 CSFII (gkg-day as-consumed)
Population Group Percent Consuming
Percentile Mean SE 1st 5th 10th 25th 50th 75th 90th 95th 99th Max
Whole Population Age
lt5 months 6 to 12 months lt1 year 1 to 2 years 3 to 5 years 6 to 11 years 12 to 19 years 20 to 39 years 40 to 69 years ge70 years Season Fall Spring Summer Winter Race Asian Black American IndianAlaska Native OtherNA White Region Midwest Northeast South West Urbanization Central City Suburban Non-metropolitan
397
00 199
93 649 698 640 457 305 318 479
391 401 396 399
254 340 331 333 417
422 423 374 384
400 412 358
03
00 01 01 10 11 08 04 02 02 02
03 03 03 03
02 03 03 03 03
04 04 03 03
03 04 03
001
000 007 005 004 004 003 002 001 001 001
002 002 002 002
005 002 009 004 001
002 002 001 002
001 001 001
00
00 00 00 00 00 00 00 00 00 00
00 00 00 00
00 00 00 00 00
00 00 00 00
00 00 00
00
00 00 00 00 00 00 00 00 00 00
00 00 00 00
00 00 00 00 00
00 00 00 00
00 00 00
00
00 00 00 00 00 00 00 00 00 00
00 00 00 00
00 00 00 00 00
00 00 00 00
00 00 00
00
00 00 00 00 00 00 00 00 00 00
00 00 00 00
00 00 00 00 00
00 00 00 00
00 00 00
00
00 00 00 07 09 06 00 00 00 00
00 00 00 00
00 00 00 00 00
00 00 00 00
00 00 00
04
00 00 00 15 17 12 06 03 02 04
04 04 04 05
01 04 04 03 05
05 05 04 04
05 05 04
10
00 03 00 25 26 20 11 07 06 07
11 10 11 10
08 10 08 11 11
11 11 10 11
11 11 08
15
00 10 03 33 33 25 15 10 09 09
16 15 16 14
12 15 14 17 15
16 16 13 16
15 16 12
29
00 18 17 49 48 40 22 17 14 15
29 29 30 27
27 32 26 30 28
29 29 28 31
28 31 26
101
00 26 26 88 101
80 64 53 52 27
88 77 78 101
49 101
44 66 88
80 80 101
88
101 80 88
a SE
Source
Includes dry ready-to-eat corn rice wheat and bran cereals in the form of flakes puffs etc = Standard error
US EPA analysis of the 1994ndash1996 CSFII
Exposure F
actors Handbook
Chapter 12mdash
Intake of Grain Products
Page E
xposure Factors H
andbook 12-32
September 2011
Table 12-24 Per Capita Intake of Baby Cereals Based on 1994ndash1996 1998 CSFII (gkg-day as-consumed)
Population Group Percent Consuming
Percentile Mean SE 1st 5th 10th 25th 50th 75th 90th 95th 99th Max
Whole Population Age
lt5 months 6 to 12 months lt1 year 1 to 2 years 3 to 5 years 6 to 11 years 12 to 19 years 20 to 39 years 40 to 69 years ge70 years Season Fall Spring Summer Winter Race Asian Black American IndianAlaska Native OtherNA White Region Midwest Northeast South West Urbanization Central City Suburban Non-metropolitan
10
408 678 534
62 03 01 00 00 01 00
09 12 08 11
07 10 06 17 10
11 12 09 09
11 11 08
00
08 25 16 02 00 00 00 00 00 00
00 00 00 00
00 00 00 01 00
00 00 00 00
00 00 00
003
024 045 027 010 006 000 000 000 000 000
007 005 006 006
004 012 004 020 003
008 004 005 006
006 004 006
00
00 00 00 00 00 00 00 00 00 00
00 00 00 00
00 00 00 00 00
00 00 00 00
00 00 00
00
00 00 00 00 00 00 00 00 00 00
00 00 00 00
00 00 00 00 00
00 00 00 00
00 00 00
00
00 00 00 00 00 00 00 00 00 00
00 00 00 00
00 00 00 00 00
00 00 00 00
00 00 00
00
00 00 00 00 00 00 00 00 00 00
00 00 00 00
00 00 00 00 00
00 00 00 00
00 00 00
00
00 08 02 00 00 00 00 00 00 00
00 00 00 00
00 00 00 00 00
00 00 00 00
00 00 00
00
10 28 17 00 00 00 00 00 00 00
00 00 00 00
00 00 00 00 00
00 00 00 00
00 00 00
00
24 69 41 00 00 00 00 00 00 00
00 00 00 00
00 00 00 00 00
00 00 00 00
00 00 00
00
31 113
73 08 00 00 00 00 00 00
00 00 00 00
00 00 00 00 00
00 00 00 00
00 00 00
01
88 211 197
58 00 00 00 00 00 00
00 06 00 03
00 00 00 12 00
03 05 00 00
03 01 00
376
266 376 376 125
38 01 00 00 03 00
211 266 260 376
21 376
09 266 260
211 125 376 266
376 211 260
SE
Source
= Standard error
US EPA analysis of the 1994ndash1996 CSFII
Exposure F
actors Handbook
Chapter 12mdash
Intake of Grain Products
Exposure F
actors Handbook
Page Septem
ber 2011 12-33
Table 12-25 Quantity (as-consumed) of Grain Products Consumed per Eating Occasion and the Percentage of Individuals Using These Foods in 2 Days
Indiv Using Quantity Consumed per Consumers Only Food at Least Eating Occasion Quantity Consumed per Eating Occasion at Specified Percentiles
Food Category Once in 2 days (grams) (grams) Average SE 5th 10th 25th 50th 75th 90th 95th
White bread 596 50 1 21 24 33 46 52 78 104 Whole grain and wheat bread 281 50 1 24 25 37 50 56 72 92 Rolls 480 58 1 27 33 43 48 70 89 110 Biscuits 109 61 1 19 19 35 57 76 104 139 Tortillas 155 60 1 14 21 32 48 79 107 135 Quick breads and muffins 125 82 2 21 28 52 60 94 142 187 Doughnuts and sweet rolls 124 77 1 26 36 47 65 93 133 164 Crackers 174 26 1 6 9 12 18 30 47 62 Cookies 307 40 1 9 12 20 31 50 75 96 Cake 162 92 3 22 28 41 77 116 181 217 Pie 85 150 3 52 72 102 143 168 246 300 Pancakes and waffles 103 85 3 21 35 42 75 109 158 205 Cooked cereal 103 248 6 81 117 157 233 291 455 484 Oatmeal 61 264 6 116 117 176 232 333 454 473 Ready-to-eat cereal 406 54 1 18 24 30 46 67 93 113 Corn flakes 81 46 1 17 22 25 37 56 75 100 Toasted oat rings 68 42 1 14 16 27 38 54 65 83 Rice 280 150 3 27 40 76 131 192 312 334 Pasta 360 162 3 26 43 73 133 210 318 420 Macaroni and cheese 85 244 9 53 81 121 191 324 477 556 Spaghetti with tomato sauce 80 436 15 122 124 246 371 494 740 983 Pizza 199 169 5 36 52 78 140 214 338 422 SE = Standard error
Source Smiciklas-Wright et al (2002) (based on 1994ndash1996 CSFII data)
Exposure F
actors Handbook
Chapter 12mdash
Intake of Grain Products
Page E
xposure Factors H
andbook 12-34
September 2011
Table 12-26 Quantity (as-consumed) of Grain Products Consumed per Eating Occasion and Percentage of Individuals Using These Foods in 2 Days by Sex and Age
Food Category
Quantity Consumed per Eating Occasion (grams) 2 to 5 years 6 to 11 years 12 to 19 years
Males and Females (N = 2109)
Males and Females Males (N = 1432) (N = 696)
Females (N = 702)
PC Mean SE PC Mean SE PC Mean SE PC Mean SE White bread
Whole grain and wheat bread Rolls Biscuits
Tortillas Quick breads and muffins
Doughnuts and sweet rolls Crackers
Cookies Cake
Pie Pancakes and waffles Cooked cereal
Oatmeal Ready-to-eat cereal Corn flakes Toasted oat rings Rice
Pasta Macaroni and cheese Spaghetti with tomato sauce
Pizza Corn chips
Popcorn
669 243 400
83 146
96 113
254 510 146
29 191 168 104 729
112 206 296 494 178 168 237 196
116
34 37 39 38 32 55 59 17 28 70 76 49
211 221
33 33 30 84 90 159 242
86 29 20
a
1 1 2 2 4 2 1 1 3 8 1
10 9 1 2 1 3 3 8 11 3 2 1
671 205 535
97 164
96 134 172 467 197
56 215
90 57 673 131 125 246 414 132
115 328 256 127
42 44 48 48 47 67 69 26 37 79
116 77 245 256
47 42 45 124 130 217 322 108
33 31
1 1 1 3 2 5 2 2 2 4 8 3
14 19
1 2 2 6 5
13 18
6 2 2
613 145 619 122 229
110 173 106 290 151
66 135
52 24 456 104
73 242 334
75 101 396 269
78
56 60 69 72 76 125 102
39 53 99 188
96 310b
348b
72 62 62 203 203 408 583 205
58 54
1 2 2 4 5
12 12
5 3 9
15 6
29b
45b
3 4 5
10 9
46 46 13
5 5
579 176 488 103 201
110 138 142 318 155
48 82 60 23 463
87 81 288 378 107
85 305 251 105
47 53 51 55 56 79 78 26 42 85
138b
74 256b
321b
52 49 42 157 155 260 479 143
44 37
1 2 1 4 3
10 5 3 2 8
12b
5 31b
40b
2 4 3
10 9
30 51
8 3 4
Exposure F
actors Handbook
Chapter 12mdash
Intake of Grain Products
Exposure F
actors Handbook
Page Septem
ber 2011 12-35
Exposure F
actors Handbook
Chapter 12mdash
Intake of Grain Products
Page E
xposure Factors H
andbook 12-36
September 2011
Table 12-26 Quantity (as-consumed) of Grain Products Consumed per Eating Occasion and Percentage of Individuals Using These Foods in 2 Days by Sex and Age (continued)
Food Category
Quantity Consumed per Eating Occasion (g) 20 to lt40 years 40 to lt60 years gt60 years
Males Females (N = 1543) (N = 1449)
Males Females (N = 1663) (N = 1694)
Males Females (N = 1545) (N = 1429)
PC Mean SE PC Mean SE PC Mean SE PC Mean SE PC Mean SE PC Mean SE White bread
Whole grain and wheat bread Rolls Biscuits
Tortillas Quick breads and muffins
Doughnuts and sweet rolls Crackers
Cookies Cake
Pie Pancakes and waffles Cooked cereal
Oatmeal Ready-to-eat cereal Corn flakes Toasted oat rings Rice
Pasta Macaroni and cheese
Spaghetti with tomato sauce Pizza
Corn chips Popcorn
630 253 620
115 206
80 133
119 208 135
58 80 52 27 269
65 42 308 371
78 86 237 162
81
63 63 73 73 79 93 94 36 56
113 161 126 313 360a
77 73 62 199 214 301 630 253
61 63
2 1 4 3 4 7 5 3 4 6 7
15 30 42a
3 6 4 9 8
19 48 12
5 6
549 252 464
94 201
113 112
156 265 149
72 74 73 37 347
53 54 321 371
78 78 202 179
97
47 48 53 55 53 79 68 28 39 94 150
80 219 258
55 43 42 139 155 235 385 150
35 35
1 1 1 2 2 5 2 2 2 7 9 6 11
17 1 2 2 6 6
19 22
6 2 2
597 328 479 134 134 157 134 166 276 165
118 75 97 60 298
59 48 294 343
61 55 130 128
96
59 57 65 80 67 93 88 30 47 108 162
117 300 332
68 49 46 167 208 302 543 220
47 50
2 1 1 3 3 7 4 1 2 6 6 8
16 16
2 3 2 5 7
31 59 13
4 4
553 323 434
112 127 149
110 175 290 168
99 80 103
62 297
52 41 288 347
60 54 145 120 109
46 46 52 56 52 72 72 24 36 83 151
74 243 242
51 40 35 130 140 210 386 147
33 39
1 2 1 2 2 4 4 1 1 4 8 5 11
10 1 3 2 4 5
12 18
8 2 3
593 398 378 130
42 174
114 256 297 192 164 108 209 136 446 124
43 231 279
71 50 53 48 61
51 48 54 58 47 86 65 23 40 85 154
99 255 257
53 37 36 147 167 230 450 187
30 52
1 1 1 3 4 5 2 1 2 4 7 5 8
10 1 2 3 6 7
13 22 18
3 4
548 431 306
98 54 183 104 259 322 183 133
82 202 129 440 104
49 214 279
65 45 47 53 76
41 41 43 48 41 72 56 17 30 87 137
68 216 224
41 30 27
118 132 215 379 109
21 34
1 1 1 3 2 4 2 1 1 7 5 4 8
10 1 1 2 5 5
18 33
8 2 3
a Indicates a SE value that is greater than 0 but less than 05 b Indicates a statistic that is potentially unreliable because of small sample size or large coefficient of variation N = Sample size
PC = Percent consuming at least once in 2 days SE = Standard error of the mean
Source Smiciklas-Wright et al (2002) (based on 1994ndash1996 CSFII data)
Exposure Factors Handbook
Chapter 12mdashIntake of Grain Products
Table 12-27 Consumption of Major Food Groups by Older Adults Median Daily Servings (and ranges) by Demographic and Health Characteristics
Subject Characteristic N Bread Cereal Rice and Pasta (servingsday) Sex a
Females 80 27 (09ndash65) Males 50 36 (14ndash73)
Ethnicity African American 44 33 (14ndash64) European American 47 32 (09ndash68) Native American 39 29 (11ndash73)
Age 70 to 74 years 42 33 (11ndash63) 75 to 79 years 36 30 (09ndash68) 80 to 84 years 36 32 (15ndash64) gt85 years 16 36 (16ndash73)
Marital Status Married 49 33 (11ndash58) Not Married 81 30 (09ndash73)
Education 8th grade or less 37 31 (11ndash73) 9th to 12th grades 47 33 (11ndash68) gtHigh School 46 32 (09ndash65)
Dentures Yes 83 33 (11ndash64) No 47 31 (09ndash73)
Chronic Diseases 0 7 41 (22ndash64) 1 31 33 (09ndash73) 2 56 31 (11ndash58) 3 26 37 (11ndash58) gt4 10 29 (14ndash53)
Weightb
le130 pounds 18 31 (11ndash54) 131 to 150 pounds 32 33 (09ndash52) 151 to 170 pounds 27 31 (14ndash73) 171 to 190 pounds 22 36 (14ndash62) ge191 pounds 29 30 (11ndash68)
a p lt 005 b 2 missing values N = Number of subjects
Source Vitolins et al (2002)
Exposure Factors Handbook Page September 2011 12-37
Exposure Factors Handbook
Chapter 12mdashIntake of Grain Products
Table 12-28 Characteristics of the Feeding Infant and Toddlers Study (FITS) Sample Population Sample Size Percentage of Sample
Sex Males Females
1549 1473
513 487
Age of Child 4 to 6 months 7 to 8 months 9 to 11 months 12 to 14 months 15 to 18 months 19 to 24 months
862 483 679 374 308 316
285 160 225 124 102 104
Childrsquos Ethnicity Hispanic or Latino Non-Hispanic or Latino Missing
367 2641
14
121 874 05
Childrsquos Race White Black Other
2417 225 380
800 74 126
Urbanicity Urban Suburban Rural Missing
1389 1014 577 42
460 336 191 13
Household Income Under $10000 $10000 to $14999 $15000 to $24999 $25000 to $34999 $35000 to $49999 $50000 to $74999 $75000 to $99999 $100000 and Over Missing
48 48
221 359 723 588 311 272 452
16 16 73 119 239 195 103 90 149
Receives WIC Yes No Missing
821 2196
5
272 726 02
Sample Size (Unweighted) 3022 1000 WIC = Special Supplemental Nutrition Program for Women Infants and Children
Source Devaney et al (2004)
Page Exposure Factors Handbook 12-38 September 2011
Table 12-29 Percentage of Infants and Toddlers Consuming Different Types of Grain Products Percentage of Infants and Toddlers Consuming at Least Once in a Day
Food GroupFood 4 to 6 7 to 8 9 to 11 12 to 14 15 to 18 19 to 24 Months Months Months Months Months Months
Any Grain or Grain Product 658 915 975 978 986 992 Infant Cereals 648 812 638 239 92 31 Non-infant Cerealsa 06 183 443 589 605 519
Not Pre-sweetened 05 170 370 445 406 319 Pre-sweetenedb 00 18 90 177 264 227
Breads and Rollsc 06 99 245 473 527 531 Crackers Pretzels Rice Cakes 30 162 334 452 464 447 Cereal or Granola Bars 00 11 34 98 100 97 Pancakes Waffles French Toast 01 08 75 151 161 154 Rice and Pastad 23 45 182 262 390 359 Other 02 01 27 28 25 45 Grains in Mixed Dishes 04 53 241 483 520 551 Sandwiches 00 11 86 215 258 258 Burrito Taco Enchilada Nachos 00 00 10 45 28 21 Macaroni and Cheese 02 16 49 146 150 150 Pizza 01 07 22 68 90 94 Pot PieHot Pocket 00 09 05 20 10 18 Spaghetti Ravioli Lasagna 01 18 99 153 121 88 a Includes both ready-to-eat and cooked cereals b Defined as cereals with more than 211 grams sugar per 100 grams c Does not include bread in sandwiches Sandwiches are included in mixed dishes d Does not include rice or pasta in mixed dishes
Source Fox et al (2004)
Exposure Factors Handbook
Chapter 12mdashIntake of Grain Products
Exposure Factors Handbook Page September 2011 12-39
Table 12-30
a Characteristics of Women Infants and Children (WIC) Participants and Non-Participants (percentages)
Infants 4 to 6 month Infants 7 to 11 month Toddlers 12 to 24 month WIC
Participant Non-Participant WIC
Participant Non-Participant WIC
Participant Non-Participant Sex Males 55 Females 45
Childrsquos Ethnicity Hispanic or Latino 20 Non-Hispanic or Latino 80
Childrsquos Race White 69 Black 15 Other 22
Child in Daycare Yes 39 No 61 Age of Mother 14 to 19 years 18 20 to 24 years 33 25 to 29 years 29 30 to 34 years 9 gt35 years 9 Missing 2
Motherrsquos Education 11th Grade or Less 23 Completed High School 35 Some Postsecondary 33 Completed College 7 Missing 2
Parentrsquos Marital Status Married 49 Not Married 50 Missing 1
Mother or Female Guardian Works Yes 46 No 53 Missing 1
54 46
b
11 89
b 84
4 11
38 62
b 1
13 29 33 23
2 b 2
19 26 53
1 b
93 7 1
51 48
1
55 45
24 76
63 17 20
34 66
13 38 23 15
11 1 15 42 32
9 2 57 42
1 45 54
1
51 49
b 8
92 b
86 5 9 b
46 54
b 1 11
30 36 21
1 b 2
20 27 51
0 b
93 7 0 b
60 40
0
57 43
22 78
67 13 20
43 57
9
33 29 18
11 0
17 42 31
9 1
58 41
1
55 45
0
52 48
b 10 89
b 84
5 11
c
53 47
b 1
14 26 34 26
1 b 3
19 28 48
2 b
88 11 1
c
61 38
1
Exposure Factors Handbook
Chapter 12mdashIntake of Grain Products
Page Exposure Factors Handbook 12-40 September 2011
c
Table 12-30 Characteristics of Women Infants and Children (WIC) Participants and Non-Participantsa
(percentages) (continued) Infants 4 to 6 months Infants 7 to 11 months Toddlers 12 to 24 months
WIC WIC WIC Participant Non-Participant Participant Non-Participant Participant Non-Participant
Urbanicity c c c
Urban 34 55 37 50 35 48 Suburban 36 31 31 34 35 35 Rural 28 13 30 15 28 16 Missing 2 1 2 1 2 2
Sample Size (Unweighted) 265 597 351 808 205 791 a χ2 tests were conducted to test for statistical significance in the differences between WIC participants and nonshy
participants within each age group for each variable The results of χ2 tests are listed next to the variable under the column labeled non-participants for each of the three age groups
b = p lt 005 non-participants significantly different from WIC participants on the variable = p lt 001 non-participants significantly different from WIC participants on the variable
WIC = Special Supplemental Nutrition Program for Women Infants and Children
Source Ponza et al (2004)
Table 12-31 Food Choices for Infants and Toddlers by Women Infants and Children (WIC) Participation Status
Infants 4 to 6 months Infants 7 to 11 months Toddlers 12 to 24 months WIC Non- WIC Non- WIC Non-
Participant Participant Participant Participant Participant Participant 697 Infant Cereals 697 625 747 135 92
Non-infant Cereals Total 09 05 217 385a 581 560
Not Pre-sweetened 05 05 187 329a 437 363 Pre-sweetened 00 00 40 69 177 241
Grains in Combination Foods 09 01 188 147 503 529 Sample Size (unweighted) 265 597 351 808 205 791 a = p lt 001 non-participants significantly different from WIC participants WIC = Special Supplemental Nutrition Program for Women Infants and Children
Source Ponza et al (2004)
Exposure Factors Handbook
Chapter 12mdashIntake of Grain Products
Exposure Factors Handbook Page September 2011 12-41
Table 12-32 Average Portion Sizes per Eating Occasion of Grain Products Commonly Consumed by Infants From the 2002 Feeding Infants and Toddlers Study
4 to 5 months 6 to 8 months 9 to 11 months Reference Food Group (N = 624) (N = 708) (N = 687) Unit Mean plusmn SE Infant cereal dry tablespoon 31 plusmn 014 45 plusmn 014 52 plusmn 018 Infant cereal jarred tablespoon - 56 plusmn 026 74 plusmn 034 Ready-to-eat cereal tablespoon - 23 plusmn 034 34 plusmn 021 Crackers ounce - 02 plusmn 002 03 plusmn 001 Crackers saltine - 22 plusmn 014 27 plusmn 012 Bread slice - 05 plusmn 010 08 plusmn 006 - = Cell size was too small to generate a reliable estimate N = Number of respondents SE = Standard error of the mean
Source Fox et al (2006)
Exposure Factors Handbook
Chapter 12mdashIntake of Grain Products
Table 12-33 Average Portion Sizes per Eating Occasion of Grain Products Commonly Consumed by Toddlers From the 2002 Feeding Infants and Toddlers Study
Food Group Reference Unit 12 to 14 months
(N = 371) 15 to 18 months
(N = 312) 19 to 24 months (N = 320)
Mean plusmn SE Bread slice 08 plusmn 004 09 plusmn 005 09 plusmn 005 Rolls ounce 09 plusmn 011 10 plusmn 010 09 plusmn 015 Ready-to-eat cereal cup 03 plusmn 002 05 plusmn 003 06 plusmn 004 Hot cereal prepared cup 06 plusmn 005 06 plusmn 005 07 plusmn 005 Crackers ounce 03 plusmn 002 04 plusmn 002 04 plusmn 002 Crackers saltine 33 plusmn 022 35 plusmn 022 37 plusmn 022 Pasta cup 04 plusmn 004 04 plusmn 004 05 plusmn 005 Rice cup 03 plusmn 004 04 plusmn 005 04 plusmn 005 Pancakes and waffles 1 (4-inch diameter) 10 plusmn 008 14 plusmn 021 14 plusmn 017 N = Number of respondents SE = Standard error of the mean
Source Fox et al (2006)
Page Exposure Factors Handbook 12-42 September 2011
c
Table 12-34 Percentage of Hispanic and Non-Hispanic Infants and Toddlers Consuming Different Types of Grain Products on a Given Day Age 4 to 5 months Age 6 to 11 months Age 12 to 24 months
Hispanic Non-Hispanic Hispanic Non-Hispanic Hispanic Non-Hispanic (N = 84) (N = 538) (N = 163) (N = 1228) (N = 124) (N = 871)
Any Grain or Grain Product Infant Cereal Non-infant Cereal Breadsb
Tortillas Crackers Pretzels Rice Cakes Pancakes Waffles French Toast Rice and Pastad
Rice Grains in Mixed Dishes
Sandwiches Burrito Taco Enchilada Nachos
565 552
-14c
14c
13c
------
569 565
----------
950 741 185a
182 40c
278 14c
201a
159e
159 40c
13c
935 736 292 151
-225 43
103 47
130 46 -
971 159 453 440 67a c
356 130 443
269a c
388a
242 21c
989 93
578 529 06c
469 160 329 130 544 249 30
Macaroni and Cheese - - 30c 31 101 155
Pizza - - - 14 10c e 97
Spaghetti Ravioli Lasagna - - 83c 46 93c 121 a = Significantly different from non-Hispanic at p lt 005 b Does not include bread in sandwiches Sandwiches are included in mixed dishes Includes tortillas also shown
separately = Statistic is potentially unreliable because of a high coefficient of variation
d Does not include rice or pasta in mixed dishes Includes rice (eg white brown wild and Spanish rice without meat) and pasta (eg spaghetti macaroni and egg noodles) Rice is also shown separately
e = Significantly different from non-Hispanic at p lt 001 - = Less than 1 of the group consumed this food on a given day N = Sample size
Source Mennella et al (2006)
Exposure Factors Handbook
Chapter 12mdashIntake of Grain Products
Exposure Factors Handbook Page September 2011 12-43
Exposure Factors Handbook
Chapter 12mdashIntake of Grain Products
Table 12-35 Mean Moisture Content of Selected Grain Products Expressed as Percentages of Edible Portions (grams per 100 grams of edible portion)
Food Moisture Content Comments Raw Cooked Barley―pearled 1009 6880 Corn―grain―endosperm 1037 -Corn―grain―bran 471 - crude Millet 867 7141 Oats 822 -Rice―white―long-grained 1162 6844 Rye 1095 -Rye―flour―medium 985 -Sorghum 920 -Wheat―hard white 957 -Wheat―germ 1112 - crude Wheat―bran 989 - crude Wheat―flour―whole grain 1027 -- Indicates that the grain product was not assessed for water content under these conditions
Source USDA (2007)
Page Exposure Factors Handbook 12-44 September 2011
- TABLE OF CONTENTS
- LIST OF TABLES
- 12 INTAKE OF GRAIN PRODUCTS
-
- 121 INTRODUCTION
- 122 RECOMMENDATIONS
- 123 INTAKE STUDIES
-
- 1231 Key Grain Intake Study
-
- 12311 US EPA Analysis of Consumption Data From 2003minus2006 National Health and Nutrition Examination Survey (NHANES)
-
- 1232 Relevant Grain Intake Studies
-
- 12321 USDA (1996a b 1993 1980)mdashFood and Nutrient Intakes of Individuals in 1 Day in the United States
- 12322 USDA (1999b)mdashFood Consumption Prices and Expenditures 1970minus1997
- 12323 USDA (1999a)mdashFood and Nutrient Intakes by Children 1994minus1996 1998 Table Set 17
- 12324 US EPA Analysis of Continuing Survey of Food Intake by Individuals (CSFII) 1994minus1996 1998
- 12325 Smiciklas-Wright et al (2002)mdashFoods Commonly Eaten in the United States Quantities Consumed per Eating Occasion and in a Day 1994minus1996
- 12326 Vitolins et al (2002)mdashQuality of Diets Consumed by Older Rural Adults
- 12327 Fox et al (2004)mdashFeeding Infants and Toddlers Study What Foods Are Infants and Toddlers Eating
- 12328 Ponza et al (2004)mdashNutrient Food Intakes and Food Choices of Infants and Toddlers Participating in WIC
- 12329 Fox et al (2006)mdashAverage Portion of Foods Commonly Eaten by Infants and Toddlers in the United States
- 123210 Mennella et al (2006)mdashFeeding Infants and Toddlers Study The Types of Foods Fed to Hispanic Infants and Toddlers
-
- 124 CONVERSION BETWEEN WET- AND DRY-WEIGHT INTAKE RATES
- 125 REFERENCES FOR CHAPTER 12
-

Page E
xposure Factors H
andbook 12-22
September 2011
Exposure F
actors Handbook
Chapter 12mdash
Intake of Grain Products
Table 12-13 Per Capita Intake of Total Grains Based on 1994ndash1996 1998 CSFII (gkg-day edible portion uncooked weight) Population Group N Percent
Consuming Mean SE Percentiles 1st 5th 10th 25th 50th 75th 90th 95th 99th Max
Whole Population Age group Birth to 1 year 1 to 2 years 3 to 5 years 6 to 12 years 13 to 19 years 20 to 49 years ge50 years Season Fall Spring Summer Winter Race Asian Pacific Islander Black American Indian Alaskan Native OtherNA White Region Midwest Northeast South West Urbanization Central City Suburban Non-metropolitan
20607
1486 2096 4391 2089 1222 4677 4646
4687 5308 5890 4722
557 2740
177 1638 15495
4822 3692 7208 4885
6164 9598 4845
995
705 998 1000 1000 1000
999 1000
995 996 995 995
985 994 997 988 996
997 996 995 994
995 995 996
27
25 64 63 43 25 22 17
26 27 26 27
36 26 29 31 26
27 28 25 28
27 27 24
00
01 01 01 01 01 00 00
00 00 00 00
02 01 02 01 00
00 00 00 01
00 00 01
02
00 11 18 09 04 03 03
02 02 03 02
00 01 03 00 03
03 03 02 02
01 03 03
06
00 21 26 17 08 06 06
06 06 07 06
11 05 05 07 07
07 07 06 07
06 07 06
09
00 28 32 20 11 08 07
09 08 09 09
15 07 08 09 09
09 10 08 09
09 09 08
13
00 42 43 28 15 13 11
13 13 13 14
23 11 13 15 13
14 14 12 14
13 14 12
21
16 59 59 40 23 19 15
21 21 21 21
32 19 22 24 20
21 22 19 22
21 21 19
33
38 79 78 54 31 28 21
33 34 33 33
47 33 42 41 32
34 35 30 35
35 34 29
52
62 104 99 70 44 39 28
50 55 51 52
62 54 63 61 50
53 53 50 54
54 53 48
68
86 121
115 82 51 47 35
66 70 68 68
73 73 75 77 66
70 68 66 70
70 69 63
103
127 168 156
111 79 71 49
100 105 105 101
112 115
120 117
98
104 110
97 103
107 100 104
316
263 316 270 172 124 161
112
263 294 282 316
246 294 168 270 316
238 316 282 208
294 316 238
N SE
Source
= Sample size = Standard error
US EPA analysis of 1994ndash1996 1998 CSFII
Exposure F
actors Handbook
Page Septem
ber 2011 12-23
Exposure F
actors Handbook
Chapter 12mdash
Intake of Grain Products
Table 12-14 Consumer-Only Intake of Total Grains Based on 1994ndash1996 1998 CSFII (gkg-day edible portion uncooked weight) Population Group N Mean SE Percentiles
1st 5th 10th 25th 50th 75th 90th 95th 99th Max Whole Population Age Group Birth to 1 year 1 to 2 years 3 to 5 years 6 to 12 years 13 to 19 years 20 to 49 years ge50 years Season Fall Spring Summer Winter Race Asian Pacific Islander Black American Indian Alaskan Native OtherNA White Region Midwest Northeast South West Urbanization Central City Suburban Non-metropolitan
20157
1048 2092 4389 2089 1222 4673 4644
4587 5190 5751 4629
527 2675
175 1570 15210
4743 3628 7053 4733
6023 9378 4756
27
36 64 63 43 25 22 17
26 27 27 27
37 26 30 32 26
27 28 25 28
28 27 24
00
01 01 01 01 01 00 00
00 00 00 00
02 01 02 01 00
00 00 00 01
00 00 01
03
01 12 18 09 04 03 03
03 03 04 03
08 02 03 05 04
04 04 03 04
03 04 03
07
03 21 26 17 08 06 06
07 07 07 07
12 05 05 07 07
07 08 06 07
07 07 06
09
06 28 32 20 11 08 07
09 09 09 09
16 07 08 10 09
09 10 08 09
09 09 08
13
14 42 43 28 15 13 11
13 13 14 14
23 11 13 15 13
14 14 12 14
13 14 12
21
28 59 59 40 23 19 15
21 21 21 21
32 19 22 24 20
21 22 19 22
21 21 19
33
48 79 78 54 31 28 21
33 34 33 33
47 33 42 41 32
34 35 30 35
35 34 29
52
74 104 99 70 44 39 28
50 55 52 52
62 54 63 62 51
53 53 50 54
54 53 48
68
92 121
115 82 51 47 35
66 70 68 68
73 73 75 77 66
70 68 66 70
70 69 64
103
134 168 156
111 79 71 49
100 106 105 101
112 115
120 117
98
104 110
98 103
107 100 104
316
263 316 270 172 124 161
112
263 294 282 316
246 294 168 270 316
238 316 282 208
294 316 238
N SE
Source
= Sample size = Standard error
US EPA analysis of 1994ndash1996 1998 CSFII
Table 12-15 Per Capita Intake of Individual Grain Products Based on 1994ndash1996 1998 CSFII (gkg-day edible portion uncooked weight)
Cereal Rice Population Group
N Percent Consuming Mean SE
Percent Consuming Mean SE
Whole Population Age Group
Birth to 1 year 1 to 2 years 3 to 5 years 6 to 12 years
13 to 19 years 20 to 49 years ge50 years Season Fall Spring Summer Winter Race Asian Pacific Islander Black American Indian Alaskan Native OtherNA White Region Midwest Northeast South West Urbanization Central City Suburban
Non-metropolitan
20607
1486 2096 4391 2089 1222 4677 4646
4687 5308 5890 4722
557 2740
177 1638 15495
4822 3692 7208 4885
6164 9598 4845
996
746 998 1000 1000 1000
999 1000
996 996 995 996
985 995 997 989 997
997 997 996 994
996 995 997
37
40 84 87 62 41 31 22
37 38 38 37
44 38 42 43 37
39 37 36 38
38 38 35
003
014 008 007 006 006 004 002
006 007 006 005
020 012 015 012 004
009 006 004 009
006 005 006
865
602 864 879 880 858 883 845
851 871 869 871
966 863 926 859 862
882 872 850 867
872 866 856
03
07 06 05 04 03 03 02
03 03 03 03
17 03 03 06 02
02 03 02 04
04 03 02
001
004 003 003 002 002 001 001
002 002 002 002
019 002 010 008 001
002 003 001 003
002 002 001
N SE
Source
= Sample size = Standard error
US EPA analysis of 1994ndash1996 1998 CSFII
Exposure Factors Handbook
Chapter 12mdashIntake of Grain Products
Page Exposure Factors Handbook 12-24 September 2011
Exposure Factors Handbook
Chapter 12mdashIntake of Grain Products
Table 12-16 Consumer-Only Intake of Individual Grain Products Based on 1994ndash1996 1998 CSFII (gkg-day edible portion uncooked weight )
Population Group N Cereal
Mean SE N Rice
Mean SE Whole Population 20227 38 003 17481 03 001 Age Group
Birth to 1 year 1116 54 016 900 12 007 1 to 2 years 2092 84 008 1819 07 004 3 to 5 years 4389 87 007 3869 06 003 6 to 12 years 2089 62 006 1847 04 002 13 to 19 years 1222 41 006 1038 03 003 20 to 49 years 4674 31 004 4102 03 001 ge50 years 4645 22 002 3906 02 001
Season Fall 4598 37 006 3957 03 002 Spring 5213 38 007 4530 03 002 Summer 5768 38 006 4989 03 002 Winter 4648 37 006 4005 03 002
Race Asian Pacific Islander 529 45 020 513 18 019 Black 2683 38 012 2346 04 002 American Indian Alaskan Native 175 43 015 151 03 010 OtherNA 1579 44 013 1375 07 008 White 15261 37 004 13096 02 001
Region Midwest 4759 39 009 4186 02 002 Northeast 3639 37 006 3152 04 004 South 7081 36 004 6029 03 001 West 4748 39 009 4114 05 003
Urbanization Central City 6039 38 006 5303 05 003 Suburban 9410 38 005 8105 03 002 Non-metropolitan 4778 36 006 4073 02 002
N = Sample size SE = Standard error
Source US EPA analysis of 1994ndash1996 1998 CSFII
Exposure Factors Handbook Page September 2011 12-25
Table 12-17 Per Capita Intake of Breads a Based on 1994ndash1996 1998 CSFII (gkg-day as-consumed)
Population Group Percent Consuming Mean
Percentile SE 1st 5th 10th 25th 50th 75th 90th 95th 99th Max
Whole Population Age Group lt5 months 6 to 12 months lt1 year 1 to 2 years 3 to 5 years 6 to 11 years 12 to 19 years 20 to 39 years 40 to 69 years ge70 years Season Fall Spring Summer Winter Race Asian Black American IndianAlaska Native OtherNA White Region Midwest Northeast South West Urbanization Central City Suburban Non-metropolitan
872
09 302 146 772 865 871 862 881 900 916
874 871 873 869
691 831 822 804 890
891 883 875 837
856 877 885
11
00 05 03 20 23 17 11 09 09 09
11 11 11 11
08 11 14 12 11
12 11 11 11
11 11 11
001
008 016 011 006 005 004 003 002 001 002
002 002 002 002
006 003 018 004 001
002 002 002 002
002 001 002
00
00 00 00 00 00 00 00 00 00 00
00 00 00 00
00 00 00 00 00
00 00 00 00
00 00 00
00
00 00 00 00 00 00 00 00 00 00
00 00 00 00
00 00 00 00 00
00 00 00 00
00 00 00
00
00 00 00 00 00 00 00 00 00 02
00 00 00 00
00 00 00 00 00
00 00 00 00
00 00 00
04
00 00 00 04 09 07 04 04 04 04
04 04 04 04
00 03 03 03 04
04 04 04 03
04 04 04
09
00 00 00 14 20 14 09 08 08 08
09 09 09 08
04 07 09 09 09
09 09 09 08
08 09 09
15
00 05 00 29 33 24 15 13 13 13
15 15 15 14
12 14 17 16 15
15 15 15 14
14 15 15
23
00 18 08 44 47 35 23 20 19 19
24 23 24 23
19 23 36 27 23
25 23 23 24
23 24 23
31
00 30 17 60 58 43 28 25 23 23
31 31 31 31
29 33 41 34 30
33 29 31 32
31 31 31
51
00 48 46 85 87 67 40 39 35 29
49 51 52 51
45 63 62 56 49
57 45 49 51
51 50 50
200
18 73 73 200 132
113 75 62 84 43
146 116
171 200
146 116
200 75 171
120 98 171 200
132 146 200
a SE
Source
Includes breads rolls muffins bagels biscuits cornbread and tortillas = Standard error
US EPA analysis of the 1994ndash1996 CSFII
Exposure F
actors Handbook
Chapter 12mdash
Intake of Grain Products
Page E
xposure Factors H
andbook 12-26
September 2011
Table 12-18 Per Capita Intake of Sweets a Based on 1994ndash1996 1998 CSFII (gkg-day as-consumed)
Population Group Percent Consuming
Percentile Mean SE 1st 5th 10th 25th 50th 75th 90th 95th 99th Max
Whole Population Age Group lt5 months 6 to 12 months lt1 year 1 to 2 years 3 to 5 years 6 to 11 years 12 to 19 years 20 to 39 years 40 to 69 years ge70 years Season Fall Spring Summer Winter Race Asian Black American IndianAlaska Native OtherNA White Region Midwest Northeast South West Urbanization Central City Suburban Non-metropolitan
526
25 230 121 532 621 642 543 472 529 586
537 522 500 545
402 414 353 350 563
601 554 491 477
512 546 505
06
00 03 02 12 13 12 06 04 05 05
06 06 05 06
04 05 04 04 06
07 06 06 05
06 06 06
001
004 014 010 007 006 006 003 002 002 003
003 002 002 003
008 004 011 005 001
003 003 002 002
002 002 003
00
00 00 00 00 00 00 00 00 00 00
00 00 00 00
00 00 00 00 00
00 00 00 00
00 00 00
00
00 00 00 00 00 00 00 00 00 00
00 00 00 00
00 00 00 00 00
00 00 00 00
00 00 00
00
00 00 00 00 00 00 00 00 00 00
00 00 00 00
00 00 00 00 00
00 00 00 00
00 00 00
00
00 00 00 00 00 00 00 00 00 00
00 00 00 00
00 00 00 00 00
00 00 00 00
00 00 00
01
00 00 00 03 08 06 02 00 01 02
02 01 00 02
00 00 00 00 02
03 02 00 00
01 02 01
08
00 00 00 17 19 17 10 06 07 08
09 08 07 09
06 06 03 05 09
10 09 08 07
08 09 08
18
00 11 04 35 36 32 18 14 13 16
18 18 16 19
14 15 17 13 18
20 17 17 16
16 18 18
25
00 20 10 48 46 39 24 19 19 21
25 26 23 26
20 23 21 19 25
29 25 23 23
23 26 25
46
04 36 36 72 88 67 37 32 32 36
47 47 41 48
31 47 28 41 47
53 48 44 38
46 45 51
220
06 64 64 193 220 209 107
111 73 57
209 220 182 123
157 193
29 70 220
220 127 209 157
209 127 220
a SE
Source
Includes breakfast foods made with grains such as pancakes waffles and French toast = Standard error
US EPA analysis of the 1994ndash1996 CSFII
Exposure F
actors Handbook
Chapter 12mdash
Intake of Grain Products
Exposure F
actors Handbook
Page Septem
ber 2011 12-27
Table 12-19 Per Capita Intake of Snacks Containing Grains a Based on 1994ndash1996 1998 CSFII (gkg-day as-consumed)
Population Group Percent Consuming
Percentile Mean SE 1st 5th 10th 25th 50th 75th 90th 95th 99th Max
Whole Population Age Group lt5 months 6 to 12 months lt1 year 1 to 2 years 3 to 5 years 6 to 11 years 12 to 19 years 20 to 39 years 40 to 69 years ge70 years Season Fall Spring Summer Winter Race Asian Black American IndianAlaska Native OtherNA White Region Midwest Northeast South West Urbanization Central City Suburban Non-metropolitan
431
10 290 141 581 567 513 450 411 411 377
423 436 406 458
241 295 383 284 471
492 419 411 407
401 446 441
02
00 03 01 07 07 05 03 02 01 01
02 03 02 03
01 02 02 02 03
03 02 02 02
02 03 02
001
011 008 006 004 004 003 002 001 001 001
001 001 001 002
004 002 008 003 001
001 002 001 002
001 001 001
00
00 00 00 00 00 00 00 00 00 00
00 00 00 00
00 00 00 00 00
00 00 00 00
00 00 00
00
00 00 00 00 00 00 00 00 00 00
00 00 00 00
00 00 00 00 00
00 00 00 00
00 00 00
00
00 00 00 00 00 00 00 00 00 00
00 00 00 00
00 00 00 00 00
00 00 00 00
00 00 00
00
00 00 00 00 00 00 00 00 00 00
00 00 00 00
00 00 00 00 00
00 00 00 00
00 00 00
00
00 00 00 04 03 01 00 00 00 00
00 00 00 00
00 00 00 00 00
00 00 00 00
00 00 00
03
00 02 00 11 09 06 04 02 02 01
03 03 02 03
00 01 02 01 03
03 02 02 02
02 03 03
07
00 09 06 20 18 13 09 06 05 03
07 08 07 08
04 05 06 05 08
08 07 07 07
07 07 07
12
00 22 09 28 32 19 14 09 07 05
10 13 10 13
10 09 11 08 12
12 12 11 12
11 12 11
26
01 25 22 50 59 46 24 18 14 08
23 29 23 29
23 21 32 24 27
27 27 24 26
26 27 23
91
37 28 37 89 91 73 51 55 56 18
80 89 71 91
44 74 49 87 91
89 91 80 87
78 91 81
a SE
Source
Includes grain snacks such as crackers salty snacks popcorn and pretzels = Standard error
US EPA analysis of the 1994ndash1996 CSFII
Exposure F
actors Handbook
Chapter 12mdash
Intake of Grain Products
Page E
xposure Factors H
andbook 12-28
September 2011
Table 12-20 Per Capita Intake of Breakfast Foods a Based on 1994ndash1996 1998 CSFII (gkg-day as-consumed)
Population Group Percent Consuming
Percentile Mean SE 1st 5th 10th 25th 50th 75th 90th 95th 99th
Max
Whole Population Age Group lt5 months 6 to 12 months lt1 year 1 to 2 years 3 to 5 years 6 to 11 years 12 to 19 years 20 to 39 years 40 to 69 years ge70 years Season Fall Spring Summer Winter Race Asian Black American IndianAlaska Native OtherNA White Region Midwest Northeast South West Urbanization Central City Suburban Non-metropolitan
118
00 42 20 204 208 237 130
89 95 104
116 116
128 113
59 127
88 102 120
121 127 107 124
120 122 107
01
00 01 01 04 04 04 01 01 01 01
01 01 01 01
01 01 01 01 01
01 01 01 02
01 01 01
001
000 024 016 007 006 005 003 002 001 002
002 002 002 002
007 003 008 005 001
002 003 002 002
002 002 002
00
00 00 00 00 00 00 00 00 00 00
00 00 00 00
00 00 00 00 00
00 00 00 00
00 00 00
00
00 00 00 00 00 00 00 00 00 00
00 00 00 00
00 00 00 00 00
00 00 00 00
00 00 00
00
00 00 00 00 00 00 00 00 00 00
00 00 00 00
00 00 00 00 00
00 00 00 00
00 00 00
00
00 00 00 00 00 00 00 00 00 00
00 00 00 00
00 00 00 00 00
00 00 00 00
00 00 00
00
00 00 00 00 00 00 00 00 00 00
00 00 00 00
00 00 00 00 00
00 00 00 00
00 00 00
00
00 00 00 00 00 00 00 00 00 00
00 00 00 00
00 00 00 00 00
00 00 00 00
00 00 00
04
00 00 00 19 16 15 05 00 00 01
04 04 05 03
00 04 00 00 04
04 05 02 05
04 05 03
10
00 00 00 27 25 22 09 06 06 07
10 10 10 09
06 12 03 09 10
11 12 08 10
10 10 09
24
00 41 27 48 45 34 23 15 14 12
23 23 24 26
20 21 12 26 24
26 23 22 26
25 24 22
136
00 41 41 136
80 65 39 30 38 35
136
64 60 80
28 67 12 80 136
67 80 78 136
136
78 64
a SE
Source
Includes breakfast food made with grains such as pancakes waffles and French toast = Standard error
US EPA analysis of the 1994ndash1996 CSFII
Exposure F
actors Handbook
Chapter 12mdash
Intake of Grain Products
Exposure F
actors Handbook
Page Septem
ber 2011 12-29
Table 12-21 Per Capita Intake of Pasta Based on 1994ndash1996 1998 CSFII (gkg-day as-consumed) Population Group
Percent
Consuming Percentile
Mean SE 1st 5th 10th 25th 50th 75th 90th 95th 99th Max Whole Population
Age Group lt5 months 6 to 12 months lt1 year 1 to 2 years 3 to 5 years 6 to 11 years 12 to 19 years 20 to 39 years 40 to 69 years ge70 years Season Fall Spring Summer Winter Race Asian Black American IndianAlaska Native OtherNA White Region Midwest Northeast South West Urbanization Central City Suburban Non-metropolitan
130
00 75 35 160 128 134
117 139 137 90
136 132 126 126
194 70 18 96 141
121 201 95 132
134 140 103
03
00 01 01 08 06 05 03 03 02 02
03 03 03 03
05 02 01 02 03
03 05 02 03
03 03 02
002
000 022 015 015 013 012 009 004 003 006
005 005 005 006
017 010 023 009 003
005 005 005 005
005 003 005
00
00 00 00 00 00 00 00 00 00 00
00 00 00 00
00 00 00 00 00
00 00 00 00
00 00 00
00
00 00 00 00 00 00 00 00 00 00
00 00 00 00
00 00 00 00 00
00 00 00 00
00 00 00
00
00 00 00 00 00 00 00 00 00 00
00 00 00 00
00 00 00 00 00
00 00 00 00
00 00 00
00
00 00 00 00 00 00 00 00 00 00
00 00 00 00
00 00 00 00 00
00 00 00 00
00 00 00
00
00 00 00 00 00 00 00 00 00 00
00 00 00 00
00 00 00 00 00
00 00 00 00
00 00 00
00
00 00 00 00 00 00 00 00 00 00
00 00 00 00
00 00 00 00 00
00 00 00 00
00 00 00
10
00 00 00 34 21 20 08 11 10 00
12 11 09 08
20 00 00 00 11
08 19 00 09
12 12 01
22
00 10 00 62 44 38 21 22 19 13
24 23 21 21
33 17 00 20 23
21 28 18 22
25 22 15
51
00 33 23 106
84 75 42 41 36 29
47 58 52 51
66 36 24 35 53
52 59 44 57
53 53 42
291
00 67 67 167 143
119 291
112 118
77
167 147 154 291
112 291
36 154 167
167 154 291 141
291 167 141
SE
Source
= Standard error
US EPA analysis of the 1994ndash1996 CSFII
Exposure F
actors Handbook
Chapter 12mdash
Intake of Grain Products
Page E
xposure Factors H
andbook 12-30
September 2011
Table 12-22 Per Capita Intake of Cooked Cereals Based on 1994ndash1996 1998 CSFII (gkg-day as-consumed)
Population Group Percent Consuming
Percentile Mean SE 1st 5th 10th 25th 50th 75th 90th 95th 99th Max
Whole Population Age Group lt5 months 6 to 12 months lt1 year 1 to 2 years 3 to 5 years 6 to 11 years 12 to 19 years 20 to 39 years 40 to 69 years ge70 years Season Fall Spring Summer Winter Race Asian Black American IndianAlaska Native OtherNA White Region Midwest Northeast South West Urbanization Central City Suburban Non-metropolitan
104
09 166
83 184 160
87 56 62
116 245
120
91 93
111
44 201
76 76 93
96 90 124
94
116 99 97
04
01 19 09 16 13 05 02 01 03 06
04 03 03 04
02 07 03 04 03
03 03 04 04
04 03 03
004
054 118 082 029 028 017 009 005 003 007
008 006 008 008
020 010 032 030 004
007 010 006 009
008 005 007
00
00 00 00 00 00 00 00 00 00 00
00 00 00 00
00 00 00 00 00
00 00 00 00
00 00 00
00
00 00 00 00 00 00 00 00 00 00
00 00 00 00
00 00 00 00 00
00 00 00 00
00 00 00
00
00 00 00 00 00 00 00 00 00 00
00 00 00 00
00 00 00 00 00
00 00 00 00
00 00 00
00
00 00 00 00 00 00 00 00 00 00
00 00 00 00
00 00 00 00 00
00 00 00 00
00 00 00
00
00 00 00 00 00 00 00 00 00 00
00 00 00 00
00 00 00 00 00
00 00 00 00
00 00 00
00
00 00 00 00 00 00 00 00 00 00
00 00 00 00
00 00 00 00 00
00 00 00 00
00 00 00
06
00 94 00 69 53 00 00 00 09 22
11 00 00 09
00 22 00 00 00
00 00 11 00
09 00 00
23
00 161
57 107
79 40 10 11 19 34
26 20 21 25
00 44 21 20 20
21 22 26 23
26 21 23
72
00 228 228 206 161
94 43 33 44 56
81 64 69 74
53 109
58 106
61
57 59 79 80
81 69 57
725
56 228 228 339 725 241 106
92 87 106
459 209 725 445
161 339 123 725 459
459 725 317 395
725 459 269
SE
Source
= Standard error
US EPA analysis of the 1994ndash1996 CSFII
Exposure F
actors Handbook
Chapter 12mdash
Intake of Grain Products
Exposure F
actors Handbook
Page Septem
ber 2011 12-31
Table 12-23 Per Capita Intake of Ready-to-Eat Cereals a Based on 1994ndash1996 1998 CSFII (gkg-day as-consumed)
Population Group Percent Consuming
Percentile Mean SE 1st 5th 10th 25th 50th 75th 90th 95th 99th Max
Whole Population Age
lt5 months 6 to 12 months lt1 year 1 to 2 years 3 to 5 years 6 to 11 years 12 to 19 years 20 to 39 years 40 to 69 years ge70 years Season Fall Spring Summer Winter Race Asian Black American IndianAlaska Native OtherNA White Region Midwest Northeast South West Urbanization Central City Suburban Non-metropolitan
397
00 199
93 649 698 640 457 305 318 479
391 401 396 399
254 340 331 333 417
422 423 374 384
400 412 358
03
00 01 01 10 11 08 04 02 02 02
03 03 03 03
02 03 03 03 03
04 04 03 03
03 04 03
001
000 007 005 004 004 003 002 001 001 001
002 002 002 002
005 002 009 004 001
002 002 001 002
001 001 001
00
00 00 00 00 00 00 00 00 00 00
00 00 00 00
00 00 00 00 00
00 00 00 00
00 00 00
00
00 00 00 00 00 00 00 00 00 00
00 00 00 00
00 00 00 00 00
00 00 00 00
00 00 00
00
00 00 00 00 00 00 00 00 00 00
00 00 00 00
00 00 00 00 00
00 00 00 00
00 00 00
00
00 00 00 00 00 00 00 00 00 00
00 00 00 00
00 00 00 00 00
00 00 00 00
00 00 00
00
00 00 00 07 09 06 00 00 00 00
00 00 00 00
00 00 00 00 00
00 00 00 00
00 00 00
04
00 00 00 15 17 12 06 03 02 04
04 04 04 05
01 04 04 03 05
05 05 04 04
05 05 04
10
00 03 00 25 26 20 11 07 06 07
11 10 11 10
08 10 08 11 11
11 11 10 11
11 11 08
15
00 10 03 33 33 25 15 10 09 09
16 15 16 14
12 15 14 17 15
16 16 13 16
15 16 12
29
00 18 17 49 48 40 22 17 14 15
29 29 30 27
27 32 26 30 28
29 29 28 31
28 31 26
101
00 26 26 88 101
80 64 53 52 27
88 77 78 101
49 101
44 66 88
80 80 101
88
101 80 88
a SE
Source
Includes dry ready-to-eat corn rice wheat and bran cereals in the form of flakes puffs etc = Standard error
US EPA analysis of the 1994ndash1996 CSFII
Exposure F
actors Handbook
Chapter 12mdash
Intake of Grain Products
Page E
xposure Factors H
andbook 12-32
September 2011
Table 12-24 Per Capita Intake of Baby Cereals Based on 1994ndash1996 1998 CSFII (gkg-day as-consumed)
Population Group Percent Consuming
Percentile Mean SE 1st 5th 10th 25th 50th 75th 90th 95th 99th Max
Whole Population Age
lt5 months 6 to 12 months lt1 year 1 to 2 years 3 to 5 years 6 to 11 years 12 to 19 years 20 to 39 years 40 to 69 years ge70 years Season Fall Spring Summer Winter Race Asian Black American IndianAlaska Native OtherNA White Region Midwest Northeast South West Urbanization Central City Suburban Non-metropolitan
10
408 678 534
62 03 01 00 00 01 00
09 12 08 11
07 10 06 17 10
11 12 09 09
11 11 08
00
08 25 16 02 00 00 00 00 00 00
00 00 00 00
00 00 00 01 00
00 00 00 00
00 00 00
003
024 045 027 010 006 000 000 000 000 000
007 005 006 006
004 012 004 020 003
008 004 005 006
006 004 006
00
00 00 00 00 00 00 00 00 00 00
00 00 00 00
00 00 00 00 00
00 00 00 00
00 00 00
00
00 00 00 00 00 00 00 00 00 00
00 00 00 00
00 00 00 00 00
00 00 00 00
00 00 00
00
00 00 00 00 00 00 00 00 00 00
00 00 00 00
00 00 00 00 00
00 00 00 00
00 00 00
00
00 00 00 00 00 00 00 00 00 00
00 00 00 00
00 00 00 00 00
00 00 00 00
00 00 00
00
00 08 02 00 00 00 00 00 00 00
00 00 00 00
00 00 00 00 00
00 00 00 00
00 00 00
00
10 28 17 00 00 00 00 00 00 00
00 00 00 00
00 00 00 00 00
00 00 00 00
00 00 00
00
24 69 41 00 00 00 00 00 00 00
00 00 00 00
00 00 00 00 00
00 00 00 00
00 00 00
00
31 113
73 08 00 00 00 00 00 00
00 00 00 00
00 00 00 00 00
00 00 00 00
00 00 00
01
88 211 197
58 00 00 00 00 00 00
00 06 00 03
00 00 00 12 00
03 05 00 00
03 01 00
376
266 376 376 125
38 01 00 00 03 00
211 266 260 376
21 376
09 266 260
211 125 376 266
376 211 260
SE
Source
= Standard error
US EPA analysis of the 1994ndash1996 CSFII
Exposure F
actors Handbook
Chapter 12mdash
Intake of Grain Products
Exposure F
actors Handbook
Page Septem
ber 2011 12-33
Table 12-25 Quantity (as-consumed) of Grain Products Consumed per Eating Occasion and the Percentage of Individuals Using These Foods in 2 Days
Indiv Using Quantity Consumed per Consumers Only Food at Least Eating Occasion Quantity Consumed per Eating Occasion at Specified Percentiles
Food Category Once in 2 days (grams) (grams) Average SE 5th 10th 25th 50th 75th 90th 95th
White bread 596 50 1 21 24 33 46 52 78 104 Whole grain and wheat bread 281 50 1 24 25 37 50 56 72 92 Rolls 480 58 1 27 33 43 48 70 89 110 Biscuits 109 61 1 19 19 35 57 76 104 139 Tortillas 155 60 1 14 21 32 48 79 107 135 Quick breads and muffins 125 82 2 21 28 52 60 94 142 187 Doughnuts and sweet rolls 124 77 1 26 36 47 65 93 133 164 Crackers 174 26 1 6 9 12 18 30 47 62 Cookies 307 40 1 9 12 20 31 50 75 96 Cake 162 92 3 22 28 41 77 116 181 217 Pie 85 150 3 52 72 102 143 168 246 300 Pancakes and waffles 103 85 3 21 35 42 75 109 158 205 Cooked cereal 103 248 6 81 117 157 233 291 455 484 Oatmeal 61 264 6 116 117 176 232 333 454 473 Ready-to-eat cereal 406 54 1 18 24 30 46 67 93 113 Corn flakes 81 46 1 17 22 25 37 56 75 100 Toasted oat rings 68 42 1 14 16 27 38 54 65 83 Rice 280 150 3 27 40 76 131 192 312 334 Pasta 360 162 3 26 43 73 133 210 318 420 Macaroni and cheese 85 244 9 53 81 121 191 324 477 556 Spaghetti with tomato sauce 80 436 15 122 124 246 371 494 740 983 Pizza 199 169 5 36 52 78 140 214 338 422 SE = Standard error
Source Smiciklas-Wright et al (2002) (based on 1994ndash1996 CSFII data)
Exposure F
actors Handbook
Chapter 12mdash
Intake of Grain Products
Page E
xposure Factors H
andbook 12-34
September 2011
Table 12-26 Quantity (as-consumed) of Grain Products Consumed per Eating Occasion and Percentage of Individuals Using These Foods in 2 Days by Sex and Age
Food Category
Quantity Consumed per Eating Occasion (grams) 2 to 5 years 6 to 11 years 12 to 19 years
Males and Females (N = 2109)
Males and Females Males (N = 1432) (N = 696)
Females (N = 702)
PC Mean SE PC Mean SE PC Mean SE PC Mean SE White bread
Whole grain and wheat bread Rolls Biscuits
Tortillas Quick breads and muffins
Doughnuts and sweet rolls Crackers
Cookies Cake
Pie Pancakes and waffles Cooked cereal
Oatmeal Ready-to-eat cereal Corn flakes Toasted oat rings Rice
Pasta Macaroni and cheese Spaghetti with tomato sauce
Pizza Corn chips
Popcorn
669 243 400
83 146
96 113
254 510 146
29 191 168 104 729
112 206 296 494 178 168 237 196
116
34 37 39 38 32 55 59 17 28 70 76 49
211 221
33 33 30 84 90 159 242
86 29 20
a
1 1 2 2 4 2 1 1 3 8 1
10 9 1 2 1 3 3 8 11 3 2 1
671 205 535
97 164
96 134 172 467 197
56 215
90 57 673 131 125 246 414 132
115 328 256 127
42 44 48 48 47 67 69 26 37 79
116 77 245 256
47 42 45 124 130 217 322 108
33 31
1 1 1 3 2 5 2 2 2 4 8 3
14 19
1 2 2 6 5
13 18
6 2 2
613 145 619 122 229
110 173 106 290 151
66 135
52 24 456 104
73 242 334
75 101 396 269
78
56 60 69 72 76 125 102
39 53 99 188
96 310b
348b
72 62 62 203 203 408 583 205
58 54
1 2 2 4 5
12 12
5 3 9
15 6
29b
45b
3 4 5
10 9
46 46 13
5 5
579 176 488 103 201
110 138 142 318 155
48 82 60 23 463
87 81 288 378 107
85 305 251 105
47 53 51 55 56 79 78 26 42 85
138b
74 256b
321b
52 49 42 157 155 260 479 143
44 37
1 2 1 4 3
10 5 3 2 8
12b
5 31b
40b
2 4 3
10 9
30 51
8 3 4
Exposure F
actors Handbook
Chapter 12mdash
Intake of Grain Products
Exposure F
actors Handbook
Page Septem
ber 2011 12-35
Exposure F
actors Handbook
Chapter 12mdash
Intake of Grain Products
Page E
xposure Factors H
andbook 12-36
September 2011
Table 12-26 Quantity (as-consumed) of Grain Products Consumed per Eating Occasion and Percentage of Individuals Using These Foods in 2 Days by Sex and Age (continued)
Food Category
Quantity Consumed per Eating Occasion (g) 20 to lt40 years 40 to lt60 years gt60 years
Males Females (N = 1543) (N = 1449)
Males Females (N = 1663) (N = 1694)
Males Females (N = 1545) (N = 1429)
PC Mean SE PC Mean SE PC Mean SE PC Mean SE PC Mean SE PC Mean SE White bread
Whole grain and wheat bread Rolls Biscuits
Tortillas Quick breads and muffins
Doughnuts and sweet rolls Crackers
Cookies Cake
Pie Pancakes and waffles Cooked cereal
Oatmeal Ready-to-eat cereal Corn flakes Toasted oat rings Rice
Pasta Macaroni and cheese
Spaghetti with tomato sauce Pizza
Corn chips Popcorn
630 253 620
115 206
80 133
119 208 135
58 80 52 27 269
65 42 308 371
78 86 237 162
81
63 63 73 73 79 93 94 36 56
113 161 126 313 360a
77 73 62 199 214 301 630 253
61 63
2 1 4 3 4 7 5 3 4 6 7
15 30 42a
3 6 4 9 8
19 48 12
5 6
549 252 464
94 201
113 112
156 265 149
72 74 73 37 347
53 54 321 371
78 78 202 179
97
47 48 53 55 53 79 68 28 39 94 150
80 219 258
55 43 42 139 155 235 385 150
35 35
1 1 1 2 2 5 2 2 2 7 9 6 11
17 1 2 2 6 6
19 22
6 2 2
597 328 479 134 134 157 134 166 276 165
118 75 97 60 298
59 48 294 343
61 55 130 128
96
59 57 65 80 67 93 88 30 47 108 162
117 300 332
68 49 46 167 208 302 543 220
47 50
2 1 1 3 3 7 4 1 2 6 6 8
16 16
2 3 2 5 7
31 59 13
4 4
553 323 434
112 127 149
110 175 290 168
99 80 103
62 297
52 41 288 347
60 54 145 120 109
46 46 52 56 52 72 72 24 36 83 151
74 243 242
51 40 35 130 140 210 386 147
33 39
1 2 1 2 2 4 4 1 1 4 8 5 11
10 1 3 2 4 5
12 18
8 2 3
593 398 378 130
42 174
114 256 297 192 164 108 209 136 446 124
43 231 279
71 50 53 48 61
51 48 54 58 47 86 65 23 40 85 154
99 255 257
53 37 36 147 167 230 450 187
30 52
1 1 1 3 4 5 2 1 2 4 7 5 8
10 1 2 3 6 7
13 22 18
3 4
548 431 306
98 54 183 104 259 322 183 133
82 202 129 440 104
49 214 279
65 45 47 53 76
41 41 43 48 41 72 56 17 30 87 137
68 216 224
41 30 27
118 132 215 379 109
21 34
1 1 1 3 2 4 2 1 1 7 5 4 8
10 1 1 2 5 5
18 33
8 2 3
a Indicates a SE value that is greater than 0 but less than 05 b Indicates a statistic that is potentially unreliable because of small sample size or large coefficient of variation N = Sample size
PC = Percent consuming at least once in 2 days SE = Standard error of the mean
Source Smiciklas-Wright et al (2002) (based on 1994ndash1996 CSFII data)
Exposure Factors Handbook
Chapter 12mdashIntake of Grain Products
Table 12-27 Consumption of Major Food Groups by Older Adults Median Daily Servings (and ranges) by Demographic and Health Characteristics
Subject Characteristic N Bread Cereal Rice and Pasta (servingsday) Sex a
Females 80 27 (09ndash65) Males 50 36 (14ndash73)
Ethnicity African American 44 33 (14ndash64) European American 47 32 (09ndash68) Native American 39 29 (11ndash73)
Age 70 to 74 years 42 33 (11ndash63) 75 to 79 years 36 30 (09ndash68) 80 to 84 years 36 32 (15ndash64) gt85 years 16 36 (16ndash73)
Marital Status Married 49 33 (11ndash58) Not Married 81 30 (09ndash73)
Education 8th grade or less 37 31 (11ndash73) 9th to 12th grades 47 33 (11ndash68) gtHigh School 46 32 (09ndash65)
Dentures Yes 83 33 (11ndash64) No 47 31 (09ndash73)
Chronic Diseases 0 7 41 (22ndash64) 1 31 33 (09ndash73) 2 56 31 (11ndash58) 3 26 37 (11ndash58) gt4 10 29 (14ndash53)
Weightb
le130 pounds 18 31 (11ndash54) 131 to 150 pounds 32 33 (09ndash52) 151 to 170 pounds 27 31 (14ndash73) 171 to 190 pounds 22 36 (14ndash62) ge191 pounds 29 30 (11ndash68)
a p lt 005 b 2 missing values N = Number of subjects
Source Vitolins et al (2002)
Exposure Factors Handbook Page September 2011 12-37
Exposure Factors Handbook
Chapter 12mdashIntake of Grain Products
Table 12-28 Characteristics of the Feeding Infant and Toddlers Study (FITS) Sample Population Sample Size Percentage of Sample
Sex Males Females
1549 1473
513 487
Age of Child 4 to 6 months 7 to 8 months 9 to 11 months 12 to 14 months 15 to 18 months 19 to 24 months
862 483 679 374 308 316
285 160 225 124 102 104
Childrsquos Ethnicity Hispanic or Latino Non-Hispanic or Latino Missing
367 2641
14
121 874 05
Childrsquos Race White Black Other
2417 225 380
800 74 126
Urbanicity Urban Suburban Rural Missing
1389 1014 577 42
460 336 191 13
Household Income Under $10000 $10000 to $14999 $15000 to $24999 $25000 to $34999 $35000 to $49999 $50000 to $74999 $75000 to $99999 $100000 and Over Missing
48 48
221 359 723 588 311 272 452
16 16 73 119 239 195 103 90 149
Receives WIC Yes No Missing
821 2196
5
272 726 02
Sample Size (Unweighted) 3022 1000 WIC = Special Supplemental Nutrition Program for Women Infants and Children
Source Devaney et al (2004)
Page Exposure Factors Handbook 12-38 September 2011
Table 12-29 Percentage of Infants and Toddlers Consuming Different Types of Grain Products Percentage of Infants and Toddlers Consuming at Least Once in a Day
Food GroupFood 4 to 6 7 to 8 9 to 11 12 to 14 15 to 18 19 to 24 Months Months Months Months Months Months
Any Grain or Grain Product 658 915 975 978 986 992 Infant Cereals 648 812 638 239 92 31 Non-infant Cerealsa 06 183 443 589 605 519
Not Pre-sweetened 05 170 370 445 406 319 Pre-sweetenedb 00 18 90 177 264 227
Breads and Rollsc 06 99 245 473 527 531 Crackers Pretzels Rice Cakes 30 162 334 452 464 447 Cereal or Granola Bars 00 11 34 98 100 97 Pancakes Waffles French Toast 01 08 75 151 161 154 Rice and Pastad 23 45 182 262 390 359 Other 02 01 27 28 25 45 Grains in Mixed Dishes 04 53 241 483 520 551 Sandwiches 00 11 86 215 258 258 Burrito Taco Enchilada Nachos 00 00 10 45 28 21 Macaroni and Cheese 02 16 49 146 150 150 Pizza 01 07 22 68 90 94 Pot PieHot Pocket 00 09 05 20 10 18 Spaghetti Ravioli Lasagna 01 18 99 153 121 88 a Includes both ready-to-eat and cooked cereals b Defined as cereals with more than 211 grams sugar per 100 grams c Does not include bread in sandwiches Sandwiches are included in mixed dishes d Does not include rice or pasta in mixed dishes
Source Fox et al (2004)
Exposure Factors Handbook
Chapter 12mdashIntake of Grain Products
Exposure Factors Handbook Page September 2011 12-39
Table 12-30
a Characteristics of Women Infants and Children (WIC) Participants and Non-Participants (percentages)
Infants 4 to 6 month Infants 7 to 11 month Toddlers 12 to 24 month WIC
Participant Non-Participant WIC
Participant Non-Participant WIC
Participant Non-Participant Sex Males 55 Females 45
Childrsquos Ethnicity Hispanic or Latino 20 Non-Hispanic or Latino 80
Childrsquos Race White 69 Black 15 Other 22
Child in Daycare Yes 39 No 61 Age of Mother 14 to 19 years 18 20 to 24 years 33 25 to 29 years 29 30 to 34 years 9 gt35 years 9 Missing 2
Motherrsquos Education 11th Grade or Less 23 Completed High School 35 Some Postsecondary 33 Completed College 7 Missing 2
Parentrsquos Marital Status Married 49 Not Married 50 Missing 1
Mother or Female Guardian Works Yes 46 No 53 Missing 1
54 46
b
11 89
b 84
4 11
38 62
b 1
13 29 33 23
2 b 2
19 26 53
1 b
93 7 1
51 48
1
55 45
24 76
63 17 20
34 66
13 38 23 15
11 1 15 42 32
9 2 57 42
1 45 54
1
51 49
b 8
92 b
86 5 9 b
46 54
b 1 11
30 36 21
1 b 2
20 27 51
0 b
93 7 0 b
60 40
0
57 43
22 78
67 13 20
43 57
9
33 29 18
11 0
17 42 31
9 1
58 41
1
55 45
0
52 48
b 10 89
b 84
5 11
c
53 47
b 1
14 26 34 26
1 b 3
19 28 48
2 b
88 11 1
c
61 38
1
Exposure Factors Handbook
Chapter 12mdashIntake of Grain Products
Page Exposure Factors Handbook 12-40 September 2011
c
Table 12-30 Characteristics of Women Infants and Children (WIC) Participants and Non-Participantsa
(percentages) (continued) Infants 4 to 6 months Infants 7 to 11 months Toddlers 12 to 24 months
WIC WIC WIC Participant Non-Participant Participant Non-Participant Participant Non-Participant
Urbanicity c c c
Urban 34 55 37 50 35 48 Suburban 36 31 31 34 35 35 Rural 28 13 30 15 28 16 Missing 2 1 2 1 2 2
Sample Size (Unweighted) 265 597 351 808 205 791 a χ2 tests were conducted to test for statistical significance in the differences between WIC participants and nonshy
participants within each age group for each variable The results of χ2 tests are listed next to the variable under the column labeled non-participants for each of the three age groups
b = p lt 005 non-participants significantly different from WIC participants on the variable = p lt 001 non-participants significantly different from WIC participants on the variable
WIC = Special Supplemental Nutrition Program for Women Infants and Children
Source Ponza et al (2004)
Table 12-31 Food Choices for Infants and Toddlers by Women Infants and Children (WIC) Participation Status
Infants 4 to 6 months Infants 7 to 11 months Toddlers 12 to 24 months WIC Non- WIC Non- WIC Non-
Participant Participant Participant Participant Participant Participant 697 Infant Cereals 697 625 747 135 92
Non-infant Cereals Total 09 05 217 385a 581 560
Not Pre-sweetened 05 05 187 329a 437 363 Pre-sweetened 00 00 40 69 177 241
Grains in Combination Foods 09 01 188 147 503 529 Sample Size (unweighted) 265 597 351 808 205 791 a = p lt 001 non-participants significantly different from WIC participants WIC = Special Supplemental Nutrition Program for Women Infants and Children
Source Ponza et al (2004)
Exposure Factors Handbook
Chapter 12mdashIntake of Grain Products
Exposure Factors Handbook Page September 2011 12-41
Table 12-32 Average Portion Sizes per Eating Occasion of Grain Products Commonly Consumed by Infants From the 2002 Feeding Infants and Toddlers Study
4 to 5 months 6 to 8 months 9 to 11 months Reference Food Group (N = 624) (N = 708) (N = 687) Unit Mean plusmn SE Infant cereal dry tablespoon 31 plusmn 014 45 plusmn 014 52 plusmn 018 Infant cereal jarred tablespoon - 56 plusmn 026 74 plusmn 034 Ready-to-eat cereal tablespoon - 23 plusmn 034 34 plusmn 021 Crackers ounce - 02 plusmn 002 03 plusmn 001 Crackers saltine - 22 plusmn 014 27 plusmn 012 Bread slice - 05 plusmn 010 08 plusmn 006 - = Cell size was too small to generate a reliable estimate N = Number of respondents SE = Standard error of the mean
Source Fox et al (2006)
Exposure Factors Handbook
Chapter 12mdashIntake of Grain Products
Table 12-33 Average Portion Sizes per Eating Occasion of Grain Products Commonly Consumed by Toddlers From the 2002 Feeding Infants and Toddlers Study
Food Group Reference Unit 12 to 14 months
(N = 371) 15 to 18 months
(N = 312) 19 to 24 months (N = 320)
Mean plusmn SE Bread slice 08 plusmn 004 09 plusmn 005 09 plusmn 005 Rolls ounce 09 plusmn 011 10 plusmn 010 09 plusmn 015 Ready-to-eat cereal cup 03 plusmn 002 05 plusmn 003 06 plusmn 004 Hot cereal prepared cup 06 plusmn 005 06 plusmn 005 07 plusmn 005 Crackers ounce 03 plusmn 002 04 plusmn 002 04 plusmn 002 Crackers saltine 33 plusmn 022 35 plusmn 022 37 plusmn 022 Pasta cup 04 plusmn 004 04 plusmn 004 05 plusmn 005 Rice cup 03 plusmn 004 04 plusmn 005 04 plusmn 005 Pancakes and waffles 1 (4-inch diameter) 10 plusmn 008 14 plusmn 021 14 plusmn 017 N = Number of respondents SE = Standard error of the mean
Source Fox et al (2006)
Page Exposure Factors Handbook 12-42 September 2011
c
Table 12-34 Percentage of Hispanic and Non-Hispanic Infants and Toddlers Consuming Different Types of Grain Products on a Given Day Age 4 to 5 months Age 6 to 11 months Age 12 to 24 months
Hispanic Non-Hispanic Hispanic Non-Hispanic Hispanic Non-Hispanic (N = 84) (N = 538) (N = 163) (N = 1228) (N = 124) (N = 871)
Any Grain or Grain Product Infant Cereal Non-infant Cereal Breadsb
Tortillas Crackers Pretzels Rice Cakes Pancakes Waffles French Toast Rice and Pastad
Rice Grains in Mixed Dishes
Sandwiches Burrito Taco Enchilada Nachos
565 552
-14c
14c
13c
------
569 565
----------
950 741 185a
182 40c
278 14c
201a
159e
159 40c
13c
935 736 292 151
-225 43
103 47
130 46 -
971 159 453 440 67a c
356 130 443
269a c
388a
242 21c
989 93
578 529 06c
469 160 329 130 544 249 30
Macaroni and Cheese - - 30c 31 101 155
Pizza - - - 14 10c e 97
Spaghetti Ravioli Lasagna - - 83c 46 93c 121 a = Significantly different from non-Hispanic at p lt 005 b Does not include bread in sandwiches Sandwiches are included in mixed dishes Includes tortillas also shown
separately = Statistic is potentially unreliable because of a high coefficient of variation
d Does not include rice or pasta in mixed dishes Includes rice (eg white brown wild and Spanish rice without meat) and pasta (eg spaghetti macaroni and egg noodles) Rice is also shown separately
e = Significantly different from non-Hispanic at p lt 001 - = Less than 1 of the group consumed this food on a given day N = Sample size
Source Mennella et al (2006)
Exposure Factors Handbook
Chapter 12mdashIntake of Grain Products
Exposure Factors Handbook Page September 2011 12-43
Exposure Factors Handbook
Chapter 12mdashIntake of Grain Products
Table 12-35 Mean Moisture Content of Selected Grain Products Expressed as Percentages of Edible Portions (grams per 100 grams of edible portion)
Food Moisture Content Comments Raw Cooked Barley―pearled 1009 6880 Corn―grain―endosperm 1037 -Corn―grain―bran 471 - crude Millet 867 7141 Oats 822 -Rice―white―long-grained 1162 6844 Rye 1095 -Rye―flour―medium 985 -Sorghum 920 -Wheat―hard white 957 -Wheat―germ 1112 - crude Wheat―bran 989 - crude Wheat―flour―whole grain 1027 -- Indicates that the grain product was not assessed for water content under these conditions
Source USDA (2007)
Page Exposure Factors Handbook 12-44 September 2011
- TABLE OF CONTENTS
- LIST OF TABLES
- 12 INTAKE OF GRAIN PRODUCTS
-
- 121 INTRODUCTION
- 122 RECOMMENDATIONS
- 123 INTAKE STUDIES
-
- 1231 Key Grain Intake Study
-
- 12311 US EPA Analysis of Consumption Data From 2003minus2006 National Health and Nutrition Examination Survey (NHANES)
-
- 1232 Relevant Grain Intake Studies
-
- 12321 USDA (1996a b 1993 1980)mdashFood and Nutrient Intakes of Individuals in 1 Day in the United States
- 12322 USDA (1999b)mdashFood Consumption Prices and Expenditures 1970minus1997
- 12323 USDA (1999a)mdashFood and Nutrient Intakes by Children 1994minus1996 1998 Table Set 17
- 12324 US EPA Analysis of Continuing Survey of Food Intake by Individuals (CSFII) 1994minus1996 1998
- 12325 Smiciklas-Wright et al (2002)mdashFoods Commonly Eaten in the United States Quantities Consumed per Eating Occasion and in a Day 1994minus1996
- 12326 Vitolins et al (2002)mdashQuality of Diets Consumed by Older Rural Adults
- 12327 Fox et al (2004)mdashFeeding Infants and Toddlers Study What Foods Are Infants and Toddlers Eating
- 12328 Ponza et al (2004)mdashNutrient Food Intakes and Food Choices of Infants and Toddlers Participating in WIC
- 12329 Fox et al (2006)mdashAverage Portion of Foods Commonly Eaten by Infants and Toddlers in the United States
- 123210 Mennella et al (2006)mdashFeeding Infants and Toddlers Study The Types of Foods Fed to Hispanic Infants and Toddlers
-
- 124 CONVERSION BETWEEN WET- AND DRY-WEIGHT INTAKE RATES
- 125 REFERENCES FOR CHAPTER 12
-

Exposure F
actors Handbook
Page Septem
ber 2011 12-23
Exposure F
actors Handbook
Chapter 12mdash
Intake of Grain Products
Table 12-14 Consumer-Only Intake of Total Grains Based on 1994ndash1996 1998 CSFII (gkg-day edible portion uncooked weight) Population Group N Mean SE Percentiles
1st 5th 10th 25th 50th 75th 90th 95th 99th Max Whole Population Age Group Birth to 1 year 1 to 2 years 3 to 5 years 6 to 12 years 13 to 19 years 20 to 49 years ge50 years Season Fall Spring Summer Winter Race Asian Pacific Islander Black American Indian Alaskan Native OtherNA White Region Midwest Northeast South West Urbanization Central City Suburban Non-metropolitan
20157
1048 2092 4389 2089 1222 4673 4644
4587 5190 5751 4629
527 2675
175 1570 15210
4743 3628 7053 4733
6023 9378 4756
27
36 64 63 43 25 22 17
26 27 27 27
37 26 30 32 26
27 28 25 28
28 27 24
00
01 01 01 01 01 00 00
00 00 00 00
02 01 02 01 00
00 00 00 01
00 00 01
03
01 12 18 09 04 03 03
03 03 04 03
08 02 03 05 04
04 04 03 04
03 04 03
07
03 21 26 17 08 06 06
07 07 07 07
12 05 05 07 07
07 08 06 07
07 07 06
09
06 28 32 20 11 08 07
09 09 09 09
16 07 08 10 09
09 10 08 09
09 09 08
13
14 42 43 28 15 13 11
13 13 14 14
23 11 13 15 13
14 14 12 14
13 14 12
21
28 59 59 40 23 19 15
21 21 21 21
32 19 22 24 20
21 22 19 22
21 21 19
33
48 79 78 54 31 28 21
33 34 33 33
47 33 42 41 32
34 35 30 35
35 34 29
52
74 104 99 70 44 39 28
50 55 52 52
62 54 63 62 51
53 53 50 54
54 53 48
68
92 121
115 82 51 47 35
66 70 68 68
73 73 75 77 66
70 68 66 70
70 69 64
103
134 168 156
111 79 71 49
100 106 105 101
112 115
120 117
98
104 110
98 103
107 100 104
316
263 316 270 172 124 161
112
263 294 282 316
246 294 168 270 316
238 316 282 208
294 316 238
N SE
Source
= Sample size = Standard error
US EPA analysis of 1994ndash1996 1998 CSFII
Table 12-15 Per Capita Intake of Individual Grain Products Based on 1994ndash1996 1998 CSFII (gkg-day edible portion uncooked weight)
Cereal Rice Population Group
N Percent Consuming Mean SE
Percent Consuming Mean SE
Whole Population Age Group
Birth to 1 year 1 to 2 years 3 to 5 years 6 to 12 years
13 to 19 years 20 to 49 years ge50 years Season Fall Spring Summer Winter Race Asian Pacific Islander Black American Indian Alaskan Native OtherNA White Region Midwest Northeast South West Urbanization Central City Suburban
Non-metropolitan
20607
1486 2096 4391 2089 1222 4677 4646
4687 5308 5890 4722
557 2740
177 1638 15495
4822 3692 7208 4885
6164 9598 4845
996
746 998 1000 1000 1000
999 1000
996 996 995 996
985 995 997 989 997
997 997 996 994
996 995 997
37
40 84 87 62 41 31 22
37 38 38 37
44 38 42 43 37
39 37 36 38
38 38 35
003
014 008 007 006 006 004 002
006 007 006 005
020 012 015 012 004
009 006 004 009
006 005 006
865
602 864 879 880 858 883 845
851 871 869 871
966 863 926 859 862
882 872 850 867
872 866 856
03
07 06 05 04 03 03 02
03 03 03 03
17 03 03 06 02
02 03 02 04
04 03 02
001
004 003 003 002 002 001 001
002 002 002 002
019 002 010 008 001
002 003 001 003
002 002 001
N SE
Source
= Sample size = Standard error
US EPA analysis of 1994ndash1996 1998 CSFII
Exposure Factors Handbook
Chapter 12mdashIntake of Grain Products
Page Exposure Factors Handbook 12-24 September 2011
Exposure Factors Handbook
Chapter 12mdashIntake of Grain Products
Table 12-16 Consumer-Only Intake of Individual Grain Products Based on 1994ndash1996 1998 CSFII (gkg-day edible portion uncooked weight )
Population Group N Cereal
Mean SE N Rice
Mean SE Whole Population 20227 38 003 17481 03 001 Age Group
Birth to 1 year 1116 54 016 900 12 007 1 to 2 years 2092 84 008 1819 07 004 3 to 5 years 4389 87 007 3869 06 003 6 to 12 years 2089 62 006 1847 04 002 13 to 19 years 1222 41 006 1038 03 003 20 to 49 years 4674 31 004 4102 03 001 ge50 years 4645 22 002 3906 02 001
Season Fall 4598 37 006 3957 03 002 Spring 5213 38 007 4530 03 002 Summer 5768 38 006 4989 03 002 Winter 4648 37 006 4005 03 002
Race Asian Pacific Islander 529 45 020 513 18 019 Black 2683 38 012 2346 04 002 American Indian Alaskan Native 175 43 015 151 03 010 OtherNA 1579 44 013 1375 07 008 White 15261 37 004 13096 02 001
Region Midwest 4759 39 009 4186 02 002 Northeast 3639 37 006 3152 04 004 South 7081 36 004 6029 03 001 West 4748 39 009 4114 05 003
Urbanization Central City 6039 38 006 5303 05 003 Suburban 9410 38 005 8105 03 002 Non-metropolitan 4778 36 006 4073 02 002
N = Sample size SE = Standard error
Source US EPA analysis of 1994ndash1996 1998 CSFII
Exposure Factors Handbook Page September 2011 12-25
Table 12-17 Per Capita Intake of Breads a Based on 1994ndash1996 1998 CSFII (gkg-day as-consumed)
Population Group Percent Consuming Mean
Percentile SE 1st 5th 10th 25th 50th 75th 90th 95th 99th Max
Whole Population Age Group lt5 months 6 to 12 months lt1 year 1 to 2 years 3 to 5 years 6 to 11 years 12 to 19 years 20 to 39 years 40 to 69 years ge70 years Season Fall Spring Summer Winter Race Asian Black American IndianAlaska Native OtherNA White Region Midwest Northeast South West Urbanization Central City Suburban Non-metropolitan
872
09 302 146 772 865 871 862 881 900 916
874 871 873 869
691 831 822 804 890
891 883 875 837
856 877 885
11
00 05 03 20 23 17 11 09 09 09
11 11 11 11
08 11 14 12 11
12 11 11 11
11 11 11
001
008 016 011 006 005 004 003 002 001 002
002 002 002 002
006 003 018 004 001
002 002 002 002
002 001 002
00
00 00 00 00 00 00 00 00 00 00
00 00 00 00
00 00 00 00 00
00 00 00 00
00 00 00
00
00 00 00 00 00 00 00 00 00 00
00 00 00 00
00 00 00 00 00
00 00 00 00
00 00 00
00
00 00 00 00 00 00 00 00 00 02
00 00 00 00
00 00 00 00 00
00 00 00 00
00 00 00
04
00 00 00 04 09 07 04 04 04 04
04 04 04 04
00 03 03 03 04
04 04 04 03
04 04 04
09
00 00 00 14 20 14 09 08 08 08
09 09 09 08
04 07 09 09 09
09 09 09 08
08 09 09
15
00 05 00 29 33 24 15 13 13 13
15 15 15 14
12 14 17 16 15
15 15 15 14
14 15 15
23
00 18 08 44 47 35 23 20 19 19
24 23 24 23
19 23 36 27 23
25 23 23 24
23 24 23
31
00 30 17 60 58 43 28 25 23 23
31 31 31 31
29 33 41 34 30
33 29 31 32
31 31 31
51
00 48 46 85 87 67 40 39 35 29
49 51 52 51
45 63 62 56 49
57 45 49 51
51 50 50
200
18 73 73 200 132
113 75 62 84 43
146 116
171 200
146 116
200 75 171
120 98 171 200
132 146 200
a SE
Source
Includes breads rolls muffins bagels biscuits cornbread and tortillas = Standard error
US EPA analysis of the 1994ndash1996 CSFII
Exposure F
actors Handbook
Chapter 12mdash
Intake of Grain Products
Page E
xposure Factors H
andbook 12-26
September 2011
Table 12-18 Per Capita Intake of Sweets a Based on 1994ndash1996 1998 CSFII (gkg-day as-consumed)
Population Group Percent Consuming
Percentile Mean SE 1st 5th 10th 25th 50th 75th 90th 95th 99th Max
Whole Population Age Group lt5 months 6 to 12 months lt1 year 1 to 2 years 3 to 5 years 6 to 11 years 12 to 19 years 20 to 39 years 40 to 69 years ge70 years Season Fall Spring Summer Winter Race Asian Black American IndianAlaska Native OtherNA White Region Midwest Northeast South West Urbanization Central City Suburban Non-metropolitan
526
25 230 121 532 621 642 543 472 529 586
537 522 500 545
402 414 353 350 563
601 554 491 477
512 546 505
06
00 03 02 12 13 12 06 04 05 05
06 06 05 06
04 05 04 04 06
07 06 06 05
06 06 06
001
004 014 010 007 006 006 003 002 002 003
003 002 002 003
008 004 011 005 001
003 003 002 002
002 002 003
00
00 00 00 00 00 00 00 00 00 00
00 00 00 00
00 00 00 00 00
00 00 00 00
00 00 00
00
00 00 00 00 00 00 00 00 00 00
00 00 00 00
00 00 00 00 00
00 00 00 00
00 00 00
00
00 00 00 00 00 00 00 00 00 00
00 00 00 00
00 00 00 00 00
00 00 00 00
00 00 00
00
00 00 00 00 00 00 00 00 00 00
00 00 00 00
00 00 00 00 00
00 00 00 00
00 00 00
01
00 00 00 03 08 06 02 00 01 02
02 01 00 02
00 00 00 00 02
03 02 00 00
01 02 01
08
00 00 00 17 19 17 10 06 07 08
09 08 07 09
06 06 03 05 09
10 09 08 07
08 09 08
18
00 11 04 35 36 32 18 14 13 16
18 18 16 19
14 15 17 13 18
20 17 17 16
16 18 18
25
00 20 10 48 46 39 24 19 19 21
25 26 23 26
20 23 21 19 25
29 25 23 23
23 26 25
46
04 36 36 72 88 67 37 32 32 36
47 47 41 48
31 47 28 41 47
53 48 44 38
46 45 51
220
06 64 64 193 220 209 107
111 73 57
209 220 182 123
157 193
29 70 220
220 127 209 157
209 127 220
a SE
Source
Includes breakfast foods made with grains such as pancakes waffles and French toast = Standard error
US EPA analysis of the 1994ndash1996 CSFII
Exposure F
actors Handbook
Chapter 12mdash
Intake of Grain Products
Exposure F
actors Handbook
Page Septem
ber 2011 12-27
Table 12-19 Per Capita Intake of Snacks Containing Grains a Based on 1994ndash1996 1998 CSFII (gkg-day as-consumed)
Population Group Percent Consuming
Percentile Mean SE 1st 5th 10th 25th 50th 75th 90th 95th 99th Max
Whole Population Age Group lt5 months 6 to 12 months lt1 year 1 to 2 years 3 to 5 years 6 to 11 years 12 to 19 years 20 to 39 years 40 to 69 years ge70 years Season Fall Spring Summer Winter Race Asian Black American IndianAlaska Native OtherNA White Region Midwest Northeast South West Urbanization Central City Suburban Non-metropolitan
431
10 290 141 581 567 513 450 411 411 377
423 436 406 458
241 295 383 284 471
492 419 411 407
401 446 441
02
00 03 01 07 07 05 03 02 01 01
02 03 02 03
01 02 02 02 03
03 02 02 02
02 03 02
001
011 008 006 004 004 003 002 001 001 001
001 001 001 002
004 002 008 003 001
001 002 001 002
001 001 001
00
00 00 00 00 00 00 00 00 00 00
00 00 00 00
00 00 00 00 00
00 00 00 00
00 00 00
00
00 00 00 00 00 00 00 00 00 00
00 00 00 00
00 00 00 00 00
00 00 00 00
00 00 00
00
00 00 00 00 00 00 00 00 00 00
00 00 00 00
00 00 00 00 00
00 00 00 00
00 00 00
00
00 00 00 00 00 00 00 00 00 00
00 00 00 00
00 00 00 00 00
00 00 00 00
00 00 00
00
00 00 00 04 03 01 00 00 00 00
00 00 00 00
00 00 00 00 00
00 00 00 00
00 00 00
03
00 02 00 11 09 06 04 02 02 01
03 03 02 03
00 01 02 01 03
03 02 02 02
02 03 03
07
00 09 06 20 18 13 09 06 05 03
07 08 07 08
04 05 06 05 08
08 07 07 07
07 07 07
12
00 22 09 28 32 19 14 09 07 05
10 13 10 13
10 09 11 08 12
12 12 11 12
11 12 11
26
01 25 22 50 59 46 24 18 14 08
23 29 23 29
23 21 32 24 27
27 27 24 26
26 27 23
91
37 28 37 89 91 73 51 55 56 18
80 89 71 91
44 74 49 87 91
89 91 80 87
78 91 81
a SE
Source
Includes grain snacks such as crackers salty snacks popcorn and pretzels = Standard error
US EPA analysis of the 1994ndash1996 CSFII
Exposure F
actors Handbook
Chapter 12mdash
Intake of Grain Products
Page E
xposure Factors H
andbook 12-28
September 2011
Table 12-20 Per Capita Intake of Breakfast Foods a Based on 1994ndash1996 1998 CSFII (gkg-day as-consumed)
Population Group Percent Consuming
Percentile Mean SE 1st 5th 10th 25th 50th 75th 90th 95th 99th
Max
Whole Population Age Group lt5 months 6 to 12 months lt1 year 1 to 2 years 3 to 5 years 6 to 11 years 12 to 19 years 20 to 39 years 40 to 69 years ge70 years Season Fall Spring Summer Winter Race Asian Black American IndianAlaska Native OtherNA White Region Midwest Northeast South West Urbanization Central City Suburban Non-metropolitan
118
00 42 20 204 208 237 130
89 95 104
116 116
128 113
59 127
88 102 120
121 127 107 124
120 122 107
01
00 01 01 04 04 04 01 01 01 01
01 01 01 01
01 01 01 01 01
01 01 01 02
01 01 01
001
000 024 016 007 006 005 003 002 001 002
002 002 002 002
007 003 008 005 001
002 003 002 002
002 002 002
00
00 00 00 00 00 00 00 00 00 00
00 00 00 00
00 00 00 00 00
00 00 00 00
00 00 00
00
00 00 00 00 00 00 00 00 00 00
00 00 00 00
00 00 00 00 00
00 00 00 00
00 00 00
00
00 00 00 00 00 00 00 00 00 00
00 00 00 00
00 00 00 00 00
00 00 00 00
00 00 00
00
00 00 00 00 00 00 00 00 00 00
00 00 00 00
00 00 00 00 00
00 00 00 00
00 00 00
00
00 00 00 00 00 00 00 00 00 00
00 00 00 00
00 00 00 00 00
00 00 00 00
00 00 00
00
00 00 00 00 00 00 00 00 00 00
00 00 00 00
00 00 00 00 00
00 00 00 00
00 00 00
04
00 00 00 19 16 15 05 00 00 01
04 04 05 03
00 04 00 00 04
04 05 02 05
04 05 03
10
00 00 00 27 25 22 09 06 06 07
10 10 10 09
06 12 03 09 10
11 12 08 10
10 10 09
24
00 41 27 48 45 34 23 15 14 12
23 23 24 26
20 21 12 26 24
26 23 22 26
25 24 22
136
00 41 41 136
80 65 39 30 38 35
136
64 60 80
28 67 12 80 136
67 80 78 136
136
78 64
a SE
Source
Includes breakfast food made with grains such as pancakes waffles and French toast = Standard error
US EPA analysis of the 1994ndash1996 CSFII
Exposure F
actors Handbook
Chapter 12mdash
Intake of Grain Products
Exposure F
actors Handbook
Page Septem
ber 2011 12-29
Table 12-21 Per Capita Intake of Pasta Based on 1994ndash1996 1998 CSFII (gkg-day as-consumed) Population Group
Percent
Consuming Percentile
Mean SE 1st 5th 10th 25th 50th 75th 90th 95th 99th Max Whole Population
Age Group lt5 months 6 to 12 months lt1 year 1 to 2 years 3 to 5 years 6 to 11 years 12 to 19 years 20 to 39 years 40 to 69 years ge70 years Season Fall Spring Summer Winter Race Asian Black American IndianAlaska Native OtherNA White Region Midwest Northeast South West Urbanization Central City Suburban Non-metropolitan
130
00 75 35 160 128 134
117 139 137 90
136 132 126 126
194 70 18 96 141
121 201 95 132
134 140 103
03
00 01 01 08 06 05 03 03 02 02
03 03 03 03
05 02 01 02 03
03 05 02 03
03 03 02
002
000 022 015 015 013 012 009 004 003 006
005 005 005 006
017 010 023 009 003
005 005 005 005
005 003 005
00
00 00 00 00 00 00 00 00 00 00
00 00 00 00
00 00 00 00 00
00 00 00 00
00 00 00
00
00 00 00 00 00 00 00 00 00 00
00 00 00 00
00 00 00 00 00
00 00 00 00
00 00 00
00
00 00 00 00 00 00 00 00 00 00
00 00 00 00
00 00 00 00 00
00 00 00 00
00 00 00
00
00 00 00 00 00 00 00 00 00 00
00 00 00 00
00 00 00 00 00
00 00 00 00
00 00 00
00
00 00 00 00 00 00 00 00 00 00
00 00 00 00
00 00 00 00 00
00 00 00 00
00 00 00
00
00 00 00 00 00 00 00 00 00 00
00 00 00 00
00 00 00 00 00
00 00 00 00
00 00 00
10
00 00 00 34 21 20 08 11 10 00
12 11 09 08
20 00 00 00 11
08 19 00 09
12 12 01
22
00 10 00 62 44 38 21 22 19 13
24 23 21 21
33 17 00 20 23
21 28 18 22
25 22 15
51
00 33 23 106
84 75 42 41 36 29
47 58 52 51
66 36 24 35 53
52 59 44 57
53 53 42
291
00 67 67 167 143
119 291
112 118
77
167 147 154 291
112 291
36 154 167
167 154 291 141
291 167 141
SE
Source
= Standard error
US EPA analysis of the 1994ndash1996 CSFII
Exposure F
actors Handbook
Chapter 12mdash
Intake of Grain Products
Page E
xposure Factors H
andbook 12-30
September 2011
Table 12-22 Per Capita Intake of Cooked Cereals Based on 1994ndash1996 1998 CSFII (gkg-day as-consumed)
Population Group Percent Consuming
Percentile Mean SE 1st 5th 10th 25th 50th 75th 90th 95th 99th Max
Whole Population Age Group lt5 months 6 to 12 months lt1 year 1 to 2 years 3 to 5 years 6 to 11 years 12 to 19 years 20 to 39 years 40 to 69 years ge70 years Season Fall Spring Summer Winter Race Asian Black American IndianAlaska Native OtherNA White Region Midwest Northeast South West Urbanization Central City Suburban Non-metropolitan
104
09 166
83 184 160
87 56 62
116 245
120
91 93
111
44 201
76 76 93
96 90 124
94
116 99 97
04
01 19 09 16 13 05 02 01 03 06
04 03 03 04
02 07 03 04 03
03 03 04 04
04 03 03
004
054 118 082 029 028 017 009 005 003 007
008 006 008 008
020 010 032 030 004
007 010 006 009
008 005 007
00
00 00 00 00 00 00 00 00 00 00
00 00 00 00
00 00 00 00 00
00 00 00 00
00 00 00
00
00 00 00 00 00 00 00 00 00 00
00 00 00 00
00 00 00 00 00
00 00 00 00
00 00 00
00
00 00 00 00 00 00 00 00 00 00
00 00 00 00
00 00 00 00 00
00 00 00 00
00 00 00
00
00 00 00 00 00 00 00 00 00 00
00 00 00 00
00 00 00 00 00
00 00 00 00
00 00 00
00
00 00 00 00 00 00 00 00 00 00
00 00 00 00
00 00 00 00 00
00 00 00 00
00 00 00
00
00 00 00 00 00 00 00 00 00 00
00 00 00 00
00 00 00 00 00
00 00 00 00
00 00 00
06
00 94 00 69 53 00 00 00 09 22
11 00 00 09
00 22 00 00 00
00 00 11 00
09 00 00
23
00 161
57 107
79 40 10 11 19 34
26 20 21 25
00 44 21 20 20
21 22 26 23
26 21 23
72
00 228 228 206 161
94 43 33 44 56
81 64 69 74
53 109
58 106
61
57 59 79 80
81 69 57
725
56 228 228 339 725 241 106
92 87 106
459 209 725 445
161 339 123 725 459
459 725 317 395
725 459 269
SE
Source
= Standard error
US EPA analysis of the 1994ndash1996 CSFII
Exposure F
actors Handbook
Chapter 12mdash
Intake of Grain Products
Exposure F
actors Handbook
Page Septem
ber 2011 12-31
Table 12-23 Per Capita Intake of Ready-to-Eat Cereals a Based on 1994ndash1996 1998 CSFII (gkg-day as-consumed)
Population Group Percent Consuming
Percentile Mean SE 1st 5th 10th 25th 50th 75th 90th 95th 99th Max
Whole Population Age
lt5 months 6 to 12 months lt1 year 1 to 2 years 3 to 5 years 6 to 11 years 12 to 19 years 20 to 39 years 40 to 69 years ge70 years Season Fall Spring Summer Winter Race Asian Black American IndianAlaska Native OtherNA White Region Midwest Northeast South West Urbanization Central City Suburban Non-metropolitan
397
00 199
93 649 698 640 457 305 318 479
391 401 396 399
254 340 331 333 417
422 423 374 384
400 412 358
03
00 01 01 10 11 08 04 02 02 02
03 03 03 03
02 03 03 03 03
04 04 03 03
03 04 03
001
000 007 005 004 004 003 002 001 001 001
002 002 002 002
005 002 009 004 001
002 002 001 002
001 001 001
00
00 00 00 00 00 00 00 00 00 00
00 00 00 00
00 00 00 00 00
00 00 00 00
00 00 00
00
00 00 00 00 00 00 00 00 00 00
00 00 00 00
00 00 00 00 00
00 00 00 00
00 00 00
00
00 00 00 00 00 00 00 00 00 00
00 00 00 00
00 00 00 00 00
00 00 00 00
00 00 00
00
00 00 00 00 00 00 00 00 00 00
00 00 00 00
00 00 00 00 00
00 00 00 00
00 00 00
00
00 00 00 07 09 06 00 00 00 00
00 00 00 00
00 00 00 00 00
00 00 00 00
00 00 00
04
00 00 00 15 17 12 06 03 02 04
04 04 04 05
01 04 04 03 05
05 05 04 04
05 05 04
10
00 03 00 25 26 20 11 07 06 07
11 10 11 10
08 10 08 11 11
11 11 10 11
11 11 08
15
00 10 03 33 33 25 15 10 09 09
16 15 16 14
12 15 14 17 15
16 16 13 16
15 16 12
29
00 18 17 49 48 40 22 17 14 15
29 29 30 27
27 32 26 30 28
29 29 28 31
28 31 26
101
00 26 26 88 101
80 64 53 52 27
88 77 78 101
49 101
44 66 88
80 80 101
88
101 80 88
a SE
Source
Includes dry ready-to-eat corn rice wheat and bran cereals in the form of flakes puffs etc = Standard error
US EPA analysis of the 1994ndash1996 CSFII
Exposure F
actors Handbook
Chapter 12mdash
Intake of Grain Products
Page E
xposure Factors H
andbook 12-32
September 2011
Table 12-24 Per Capita Intake of Baby Cereals Based on 1994ndash1996 1998 CSFII (gkg-day as-consumed)
Population Group Percent Consuming
Percentile Mean SE 1st 5th 10th 25th 50th 75th 90th 95th 99th Max
Whole Population Age
lt5 months 6 to 12 months lt1 year 1 to 2 years 3 to 5 years 6 to 11 years 12 to 19 years 20 to 39 years 40 to 69 years ge70 years Season Fall Spring Summer Winter Race Asian Black American IndianAlaska Native OtherNA White Region Midwest Northeast South West Urbanization Central City Suburban Non-metropolitan
10
408 678 534
62 03 01 00 00 01 00
09 12 08 11
07 10 06 17 10
11 12 09 09
11 11 08
00
08 25 16 02 00 00 00 00 00 00
00 00 00 00
00 00 00 01 00
00 00 00 00
00 00 00
003
024 045 027 010 006 000 000 000 000 000
007 005 006 006
004 012 004 020 003
008 004 005 006
006 004 006
00
00 00 00 00 00 00 00 00 00 00
00 00 00 00
00 00 00 00 00
00 00 00 00
00 00 00
00
00 00 00 00 00 00 00 00 00 00
00 00 00 00
00 00 00 00 00
00 00 00 00
00 00 00
00
00 00 00 00 00 00 00 00 00 00
00 00 00 00
00 00 00 00 00
00 00 00 00
00 00 00
00
00 00 00 00 00 00 00 00 00 00
00 00 00 00
00 00 00 00 00
00 00 00 00
00 00 00
00
00 08 02 00 00 00 00 00 00 00
00 00 00 00
00 00 00 00 00
00 00 00 00
00 00 00
00
10 28 17 00 00 00 00 00 00 00
00 00 00 00
00 00 00 00 00
00 00 00 00
00 00 00
00
24 69 41 00 00 00 00 00 00 00
00 00 00 00
00 00 00 00 00
00 00 00 00
00 00 00
00
31 113
73 08 00 00 00 00 00 00
00 00 00 00
00 00 00 00 00
00 00 00 00
00 00 00
01
88 211 197
58 00 00 00 00 00 00
00 06 00 03
00 00 00 12 00
03 05 00 00
03 01 00
376
266 376 376 125
38 01 00 00 03 00
211 266 260 376
21 376
09 266 260
211 125 376 266
376 211 260
SE
Source
= Standard error
US EPA analysis of the 1994ndash1996 CSFII
Exposure F
actors Handbook
Chapter 12mdash
Intake of Grain Products
Exposure F
actors Handbook
Page Septem
ber 2011 12-33
Table 12-25 Quantity (as-consumed) of Grain Products Consumed per Eating Occasion and the Percentage of Individuals Using These Foods in 2 Days
Indiv Using Quantity Consumed per Consumers Only Food at Least Eating Occasion Quantity Consumed per Eating Occasion at Specified Percentiles
Food Category Once in 2 days (grams) (grams) Average SE 5th 10th 25th 50th 75th 90th 95th
White bread 596 50 1 21 24 33 46 52 78 104 Whole grain and wheat bread 281 50 1 24 25 37 50 56 72 92 Rolls 480 58 1 27 33 43 48 70 89 110 Biscuits 109 61 1 19 19 35 57 76 104 139 Tortillas 155 60 1 14 21 32 48 79 107 135 Quick breads and muffins 125 82 2 21 28 52 60 94 142 187 Doughnuts and sweet rolls 124 77 1 26 36 47 65 93 133 164 Crackers 174 26 1 6 9 12 18 30 47 62 Cookies 307 40 1 9 12 20 31 50 75 96 Cake 162 92 3 22 28 41 77 116 181 217 Pie 85 150 3 52 72 102 143 168 246 300 Pancakes and waffles 103 85 3 21 35 42 75 109 158 205 Cooked cereal 103 248 6 81 117 157 233 291 455 484 Oatmeal 61 264 6 116 117 176 232 333 454 473 Ready-to-eat cereal 406 54 1 18 24 30 46 67 93 113 Corn flakes 81 46 1 17 22 25 37 56 75 100 Toasted oat rings 68 42 1 14 16 27 38 54 65 83 Rice 280 150 3 27 40 76 131 192 312 334 Pasta 360 162 3 26 43 73 133 210 318 420 Macaroni and cheese 85 244 9 53 81 121 191 324 477 556 Spaghetti with tomato sauce 80 436 15 122 124 246 371 494 740 983 Pizza 199 169 5 36 52 78 140 214 338 422 SE = Standard error
Source Smiciklas-Wright et al (2002) (based on 1994ndash1996 CSFII data)
Exposure F
actors Handbook
Chapter 12mdash
Intake of Grain Products
Page E
xposure Factors H
andbook 12-34
September 2011
Table 12-26 Quantity (as-consumed) of Grain Products Consumed per Eating Occasion and Percentage of Individuals Using These Foods in 2 Days by Sex and Age
Food Category
Quantity Consumed per Eating Occasion (grams) 2 to 5 years 6 to 11 years 12 to 19 years
Males and Females (N = 2109)
Males and Females Males (N = 1432) (N = 696)
Females (N = 702)
PC Mean SE PC Mean SE PC Mean SE PC Mean SE White bread
Whole grain and wheat bread Rolls Biscuits
Tortillas Quick breads and muffins
Doughnuts and sweet rolls Crackers
Cookies Cake
Pie Pancakes and waffles Cooked cereal
Oatmeal Ready-to-eat cereal Corn flakes Toasted oat rings Rice
Pasta Macaroni and cheese Spaghetti with tomato sauce
Pizza Corn chips
Popcorn
669 243 400
83 146
96 113
254 510 146
29 191 168 104 729
112 206 296 494 178 168 237 196
116
34 37 39 38 32 55 59 17 28 70 76 49
211 221
33 33 30 84 90 159 242
86 29 20
a
1 1 2 2 4 2 1 1 3 8 1
10 9 1 2 1 3 3 8 11 3 2 1
671 205 535
97 164
96 134 172 467 197
56 215
90 57 673 131 125 246 414 132
115 328 256 127
42 44 48 48 47 67 69 26 37 79
116 77 245 256
47 42 45 124 130 217 322 108
33 31
1 1 1 3 2 5 2 2 2 4 8 3
14 19
1 2 2 6 5
13 18
6 2 2
613 145 619 122 229
110 173 106 290 151
66 135
52 24 456 104
73 242 334
75 101 396 269
78
56 60 69 72 76 125 102
39 53 99 188
96 310b
348b
72 62 62 203 203 408 583 205
58 54
1 2 2 4 5
12 12
5 3 9
15 6
29b
45b
3 4 5
10 9
46 46 13
5 5
579 176 488 103 201
110 138 142 318 155
48 82 60 23 463
87 81 288 378 107
85 305 251 105
47 53 51 55 56 79 78 26 42 85
138b
74 256b
321b
52 49 42 157 155 260 479 143
44 37
1 2 1 4 3
10 5 3 2 8
12b
5 31b
40b
2 4 3
10 9
30 51
8 3 4
Exposure F
actors Handbook
Chapter 12mdash
Intake of Grain Products
Exposure F
actors Handbook
Page Septem
ber 2011 12-35
Exposure F
actors Handbook
Chapter 12mdash
Intake of Grain Products
Page E
xposure Factors H
andbook 12-36
September 2011
Table 12-26 Quantity (as-consumed) of Grain Products Consumed per Eating Occasion and Percentage of Individuals Using These Foods in 2 Days by Sex and Age (continued)
Food Category
Quantity Consumed per Eating Occasion (g) 20 to lt40 years 40 to lt60 years gt60 years
Males Females (N = 1543) (N = 1449)
Males Females (N = 1663) (N = 1694)
Males Females (N = 1545) (N = 1429)
PC Mean SE PC Mean SE PC Mean SE PC Mean SE PC Mean SE PC Mean SE White bread
Whole grain and wheat bread Rolls Biscuits
Tortillas Quick breads and muffins
Doughnuts and sweet rolls Crackers
Cookies Cake
Pie Pancakes and waffles Cooked cereal
Oatmeal Ready-to-eat cereal Corn flakes Toasted oat rings Rice
Pasta Macaroni and cheese
Spaghetti with tomato sauce Pizza
Corn chips Popcorn
630 253 620
115 206
80 133
119 208 135
58 80 52 27 269
65 42 308 371
78 86 237 162
81
63 63 73 73 79 93 94 36 56
113 161 126 313 360a
77 73 62 199 214 301 630 253
61 63
2 1 4 3 4 7 5 3 4 6 7
15 30 42a
3 6 4 9 8
19 48 12
5 6
549 252 464
94 201
113 112
156 265 149
72 74 73 37 347
53 54 321 371
78 78 202 179
97
47 48 53 55 53 79 68 28 39 94 150
80 219 258
55 43 42 139 155 235 385 150
35 35
1 1 1 2 2 5 2 2 2 7 9 6 11
17 1 2 2 6 6
19 22
6 2 2
597 328 479 134 134 157 134 166 276 165
118 75 97 60 298
59 48 294 343
61 55 130 128
96
59 57 65 80 67 93 88 30 47 108 162
117 300 332
68 49 46 167 208 302 543 220
47 50
2 1 1 3 3 7 4 1 2 6 6 8
16 16
2 3 2 5 7
31 59 13
4 4
553 323 434
112 127 149
110 175 290 168
99 80 103
62 297
52 41 288 347
60 54 145 120 109
46 46 52 56 52 72 72 24 36 83 151
74 243 242
51 40 35 130 140 210 386 147
33 39
1 2 1 2 2 4 4 1 1 4 8 5 11
10 1 3 2 4 5
12 18
8 2 3
593 398 378 130
42 174
114 256 297 192 164 108 209 136 446 124
43 231 279
71 50 53 48 61
51 48 54 58 47 86 65 23 40 85 154
99 255 257
53 37 36 147 167 230 450 187
30 52
1 1 1 3 4 5 2 1 2 4 7 5 8
10 1 2 3 6 7
13 22 18
3 4
548 431 306
98 54 183 104 259 322 183 133
82 202 129 440 104
49 214 279
65 45 47 53 76
41 41 43 48 41 72 56 17 30 87 137
68 216 224
41 30 27
118 132 215 379 109
21 34
1 1 1 3 2 4 2 1 1 7 5 4 8
10 1 1 2 5 5
18 33
8 2 3
a Indicates a SE value that is greater than 0 but less than 05 b Indicates a statistic that is potentially unreliable because of small sample size or large coefficient of variation N = Sample size
PC = Percent consuming at least once in 2 days SE = Standard error of the mean
Source Smiciklas-Wright et al (2002) (based on 1994ndash1996 CSFII data)
Exposure Factors Handbook
Chapter 12mdashIntake of Grain Products
Table 12-27 Consumption of Major Food Groups by Older Adults Median Daily Servings (and ranges) by Demographic and Health Characteristics
Subject Characteristic N Bread Cereal Rice and Pasta (servingsday) Sex a
Females 80 27 (09ndash65) Males 50 36 (14ndash73)
Ethnicity African American 44 33 (14ndash64) European American 47 32 (09ndash68) Native American 39 29 (11ndash73)
Age 70 to 74 years 42 33 (11ndash63) 75 to 79 years 36 30 (09ndash68) 80 to 84 years 36 32 (15ndash64) gt85 years 16 36 (16ndash73)
Marital Status Married 49 33 (11ndash58) Not Married 81 30 (09ndash73)
Education 8th grade or less 37 31 (11ndash73) 9th to 12th grades 47 33 (11ndash68) gtHigh School 46 32 (09ndash65)
Dentures Yes 83 33 (11ndash64) No 47 31 (09ndash73)
Chronic Diseases 0 7 41 (22ndash64) 1 31 33 (09ndash73) 2 56 31 (11ndash58) 3 26 37 (11ndash58) gt4 10 29 (14ndash53)
Weightb
le130 pounds 18 31 (11ndash54) 131 to 150 pounds 32 33 (09ndash52) 151 to 170 pounds 27 31 (14ndash73) 171 to 190 pounds 22 36 (14ndash62) ge191 pounds 29 30 (11ndash68)
a p lt 005 b 2 missing values N = Number of subjects
Source Vitolins et al (2002)
Exposure Factors Handbook Page September 2011 12-37
Exposure Factors Handbook
Chapter 12mdashIntake of Grain Products
Table 12-28 Characteristics of the Feeding Infant and Toddlers Study (FITS) Sample Population Sample Size Percentage of Sample
Sex Males Females
1549 1473
513 487
Age of Child 4 to 6 months 7 to 8 months 9 to 11 months 12 to 14 months 15 to 18 months 19 to 24 months
862 483 679 374 308 316
285 160 225 124 102 104
Childrsquos Ethnicity Hispanic or Latino Non-Hispanic or Latino Missing
367 2641
14
121 874 05
Childrsquos Race White Black Other
2417 225 380
800 74 126
Urbanicity Urban Suburban Rural Missing
1389 1014 577 42
460 336 191 13
Household Income Under $10000 $10000 to $14999 $15000 to $24999 $25000 to $34999 $35000 to $49999 $50000 to $74999 $75000 to $99999 $100000 and Over Missing
48 48
221 359 723 588 311 272 452
16 16 73 119 239 195 103 90 149
Receives WIC Yes No Missing
821 2196
5
272 726 02
Sample Size (Unweighted) 3022 1000 WIC = Special Supplemental Nutrition Program for Women Infants and Children
Source Devaney et al (2004)
Page Exposure Factors Handbook 12-38 September 2011
Table 12-29 Percentage of Infants and Toddlers Consuming Different Types of Grain Products Percentage of Infants and Toddlers Consuming at Least Once in a Day
Food GroupFood 4 to 6 7 to 8 9 to 11 12 to 14 15 to 18 19 to 24 Months Months Months Months Months Months
Any Grain or Grain Product 658 915 975 978 986 992 Infant Cereals 648 812 638 239 92 31 Non-infant Cerealsa 06 183 443 589 605 519
Not Pre-sweetened 05 170 370 445 406 319 Pre-sweetenedb 00 18 90 177 264 227
Breads and Rollsc 06 99 245 473 527 531 Crackers Pretzels Rice Cakes 30 162 334 452 464 447 Cereal or Granola Bars 00 11 34 98 100 97 Pancakes Waffles French Toast 01 08 75 151 161 154 Rice and Pastad 23 45 182 262 390 359 Other 02 01 27 28 25 45 Grains in Mixed Dishes 04 53 241 483 520 551 Sandwiches 00 11 86 215 258 258 Burrito Taco Enchilada Nachos 00 00 10 45 28 21 Macaroni and Cheese 02 16 49 146 150 150 Pizza 01 07 22 68 90 94 Pot PieHot Pocket 00 09 05 20 10 18 Spaghetti Ravioli Lasagna 01 18 99 153 121 88 a Includes both ready-to-eat and cooked cereals b Defined as cereals with more than 211 grams sugar per 100 grams c Does not include bread in sandwiches Sandwiches are included in mixed dishes d Does not include rice or pasta in mixed dishes
Source Fox et al (2004)
Exposure Factors Handbook
Chapter 12mdashIntake of Grain Products
Exposure Factors Handbook Page September 2011 12-39
Table 12-30
a Characteristics of Women Infants and Children (WIC) Participants and Non-Participants (percentages)
Infants 4 to 6 month Infants 7 to 11 month Toddlers 12 to 24 month WIC
Participant Non-Participant WIC
Participant Non-Participant WIC
Participant Non-Participant Sex Males 55 Females 45
Childrsquos Ethnicity Hispanic or Latino 20 Non-Hispanic or Latino 80
Childrsquos Race White 69 Black 15 Other 22
Child in Daycare Yes 39 No 61 Age of Mother 14 to 19 years 18 20 to 24 years 33 25 to 29 years 29 30 to 34 years 9 gt35 years 9 Missing 2
Motherrsquos Education 11th Grade or Less 23 Completed High School 35 Some Postsecondary 33 Completed College 7 Missing 2
Parentrsquos Marital Status Married 49 Not Married 50 Missing 1
Mother or Female Guardian Works Yes 46 No 53 Missing 1
54 46
b
11 89
b 84
4 11
38 62
b 1
13 29 33 23
2 b 2
19 26 53
1 b
93 7 1
51 48
1
55 45
24 76
63 17 20
34 66
13 38 23 15
11 1 15 42 32
9 2 57 42
1 45 54
1
51 49
b 8
92 b
86 5 9 b
46 54
b 1 11
30 36 21
1 b 2
20 27 51
0 b
93 7 0 b
60 40
0
57 43
22 78
67 13 20
43 57
9
33 29 18
11 0
17 42 31
9 1
58 41
1
55 45
0
52 48
b 10 89
b 84
5 11
c
53 47
b 1
14 26 34 26
1 b 3
19 28 48
2 b
88 11 1
c
61 38
1
Exposure Factors Handbook
Chapter 12mdashIntake of Grain Products
Page Exposure Factors Handbook 12-40 September 2011
c
Table 12-30 Characteristics of Women Infants and Children (WIC) Participants and Non-Participantsa
(percentages) (continued) Infants 4 to 6 months Infants 7 to 11 months Toddlers 12 to 24 months
WIC WIC WIC Participant Non-Participant Participant Non-Participant Participant Non-Participant
Urbanicity c c c
Urban 34 55 37 50 35 48 Suburban 36 31 31 34 35 35 Rural 28 13 30 15 28 16 Missing 2 1 2 1 2 2
Sample Size (Unweighted) 265 597 351 808 205 791 a χ2 tests were conducted to test for statistical significance in the differences between WIC participants and nonshy
participants within each age group for each variable The results of χ2 tests are listed next to the variable under the column labeled non-participants for each of the three age groups
b = p lt 005 non-participants significantly different from WIC participants on the variable = p lt 001 non-participants significantly different from WIC participants on the variable
WIC = Special Supplemental Nutrition Program for Women Infants and Children
Source Ponza et al (2004)
Table 12-31 Food Choices for Infants and Toddlers by Women Infants and Children (WIC) Participation Status
Infants 4 to 6 months Infants 7 to 11 months Toddlers 12 to 24 months WIC Non- WIC Non- WIC Non-
Participant Participant Participant Participant Participant Participant 697 Infant Cereals 697 625 747 135 92
Non-infant Cereals Total 09 05 217 385a 581 560
Not Pre-sweetened 05 05 187 329a 437 363 Pre-sweetened 00 00 40 69 177 241
Grains in Combination Foods 09 01 188 147 503 529 Sample Size (unweighted) 265 597 351 808 205 791 a = p lt 001 non-participants significantly different from WIC participants WIC = Special Supplemental Nutrition Program for Women Infants and Children
Source Ponza et al (2004)
Exposure Factors Handbook
Chapter 12mdashIntake of Grain Products
Exposure Factors Handbook Page September 2011 12-41
Table 12-32 Average Portion Sizes per Eating Occasion of Grain Products Commonly Consumed by Infants From the 2002 Feeding Infants and Toddlers Study
4 to 5 months 6 to 8 months 9 to 11 months Reference Food Group (N = 624) (N = 708) (N = 687) Unit Mean plusmn SE Infant cereal dry tablespoon 31 plusmn 014 45 plusmn 014 52 plusmn 018 Infant cereal jarred tablespoon - 56 plusmn 026 74 plusmn 034 Ready-to-eat cereal tablespoon - 23 plusmn 034 34 plusmn 021 Crackers ounce - 02 plusmn 002 03 plusmn 001 Crackers saltine - 22 plusmn 014 27 plusmn 012 Bread slice - 05 plusmn 010 08 plusmn 006 - = Cell size was too small to generate a reliable estimate N = Number of respondents SE = Standard error of the mean
Source Fox et al (2006)
Exposure Factors Handbook
Chapter 12mdashIntake of Grain Products
Table 12-33 Average Portion Sizes per Eating Occasion of Grain Products Commonly Consumed by Toddlers From the 2002 Feeding Infants and Toddlers Study
Food Group Reference Unit 12 to 14 months
(N = 371) 15 to 18 months
(N = 312) 19 to 24 months (N = 320)
Mean plusmn SE Bread slice 08 plusmn 004 09 plusmn 005 09 plusmn 005 Rolls ounce 09 plusmn 011 10 plusmn 010 09 plusmn 015 Ready-to-eat cereal cup 03 plusmn 002 05 plusmn 003 06 plusmn 004 Hot cereal prepared cup 06 plusmn 005 06 plusmn 005 07 plusmn 005 Crackers ounce 03 plusmn 002 04 plusmn 002 04 plusmn 002 Crackers saltine 33 plusmn 022 35 plusmn 022 37 plusmn 022 Pasta cup 04 plusmn 004 04 plusmn 004 05 plusmn 005 Rice cup 03 plusmn 004 04 plusmn 005 04 plusmn 005 Pancakes and waffles 1 (4-inch diameter) 10 plusmn 008 14 plusmn 021 14 plusmn 017 N = Number of respondents SE = Standard error of the mean
Source Fox et al (2006)
Page Exposure Factors Handbook 12-42 September 2011
c
Table 12-34 Percentage of Hispanic and Non-Hispanic Infants and Toddlers Consuming Different Types of Grain Products on a Given Day Age 4 to 5 months Age 6 to 11 months Age 12 to 24 months
Hispanic Non-Hispanic Hispanic Non-Hispanic Hispanic Non-Hispanic (N = 84) (N = 538) (N = 163) (N = 1228) (N = 124) (N = 871)
Any Grain or Grain Product Infant Cereal Non-infant Cereal Breadsb
Tortillas Crackers Pretzels Rice Cakes Pancakes Waffles French Toast Rice and Pastad
Rice Grains in Mixed Dishes
Sandwiches Burrito Taco Enchilada Nachos
565 552
-14c
14c
13c
------
569 565
----------
950 741 185a
182 40c
278 14c
201a
159e
159 40c
13c
935 736 292 151
-225 43
103 47
130 46 -
971 159 453 440 67a c
356 130 443
269a c
388a
242 21c
989 93
578 529 06c
469 160 329 130 544 249 30
Macaroni and Cheese - - 30c 31 101 155
Pizza - - - 14 10c e 97
Spaghetti Ravioli Lasagna - - 83c 46 93c 121 a = Significantly different from non-Hispanic at p lt 005 b Does not include bread in sandwiches Sandwiches are included in mixed dishes Includes tortillas also shown
separately = Statistic is potentially unreliable because of a high coefficient of variation
d Does not include rice or pasta in mixed dishes Includes rice (eg white brown wild and Spanish rice without meat) and pasta (eg spaghetti macaroni and egg noodles) Rice is also shown separately
e = Significantly different from non-Hispanic at p lt 001 - = Less than 1 of the group consumed this food on a given day N = Sample size
Source Mennella et al (2006)
Exposure Factors Handbook
Chapter 12mdashIntake of Grain Products
Exposure Factors Handbook Page September 2011 12-43
Exposure Factors Handbook
Chapter 12mdashIntake of Grain Products
Table 12-35 Mean Moisture Content of Selected Grain Products Expressed as Percentages of Edible Portions (grams per 100 grams of edible portion)
Food Moisture Content Comments Raw Cooked Barley―pearled 1009 6880 Corn―grain―endosperm 1037 -Corn―grain―bran 471 - crude Millet 867 7141 Oats 822 -Rice―white―long-grained 1162 6844 Rye 1095 -Rye―flour―medium 985 -Sorghum 920 -Wheat―hard white 957 -Wheat―germ 1112 - crude Wheat―bran 989 - crude Wheat―flour―whole grain 1027 -- Indicates that the grain product was not assessed for water content under these conditions
Source USDA (2007)
Page Exposure Factors Handbook 12-44 September 2011
- TABLE OF CONTENTS
- LIST OF TABLES
- 12 INTAKE OF GRAIN PRODUCTS
-
- 121 INTRODUCTION
- 122 RECOMMENDATIONS
- 123 INTAKE STUDIES
-
- 1231 Key Grain Intake Study
-
- 12311 US EPA Analysis of Consumption Data From 2003minus2006 National Health and Nutrition Examination Survey (NHANES)
-
- 1232 Relevant Grain Intake Studies
-
- 12321 USDA (1996a b 1993 1980)mdashFood and Nutrient Intakes of Individuals in 1 Day in the United States
- 12322 USDA (1999b)mdashFood Consumption Prices and Expenditures 1970minus1997
- 12323 USDA (1999a)mdashFood and Nutrient Intakes by Children 1994minus1996 1998 Table Set 17
- 12324 US EPA Analysis of Continuing Survey of Food Intake by Individuals (CSFII) 1994minus1996 1998
- 12325 Smiciklas-Wright et al (2002)mdashFoods Commonly Eaten in the United States Quantities Consumed per Eating Occasion and in a Day 1994minus1996
- 12326 Vitolins et al (2002)mdashQuality of Diets Consumed by Older Rural Adults
- 12327 Fox et al (2004)mdashFeeding Infants and Toddlers Study What Foods Are Infants and Toddlers Eating
- 12328 Ponza et al (2004)mdashNutrient Food Intakes and Food Choices of Infants and Toddlers Participating in WIC
- 12329 Fox et al (2006)mdashAverage Portion of Foods Commonly Eaten by Infants and Toddlers in the United States
- 123210 Mennella et al (2006)mdashFeeding Infants and Toddlers Study The Types of Foods Fed to Hispanic Infants and Toddlers
-
- 124 CONVERSION BETWEEN WET- AND DRY-WEIGHT INTAKE RATES
- 125 REFERENCES FOR CHAPTER 12
-

Exposure Factors Handbook
Chapter 12mdashIntake of Grain Products
Table 12-16 Consumer-Only Intake of Individual Grain Products Based on 1994ndash1996 1998 CSFII (gkg-day edible portion uncooked weight )
Population Group N Cereal
Mean SE N Rice
Mean SE Whole Population 20227 38 003 17481 03 001 Age Group
Birth to 1 year 1116 54 016 900 12 007 1 to 2 years 2092 84 008 1819 07 004 3 to 5 years 4389 87 007 3869 06 003 6 to 12 years 2089 62 006 1847 04 002 13 to 19 years 1222 41 006 1038 03 003 20 to 49 years 4674 31 004 4102 03 001 ge50 years 4645 22 002 3906 02 001
Season Fall 4598 37 006 3957 03 002 Spring 5213 38 007 4530 03 002 Summer 5768 38 006 4989 03 002 Winter 4648 37 006 4005 03 002
Race Asian Pacific Islander 529 45 020 513 18 019 Black 2683 38 012 2346 04 002 American Indian Alaskan Native 175 43 015 151 03 010 OtherNA 1579 44 013 1375 07 008 White 15261 37 004 13096 02 001
Region Midwest 4759 39 009 4186 02 002 Northeast 3639 37 006 3152 04 004 South 7081 36 004 6029 03 001 West 4748 39 009 4114 05 003
Urbanization Central City 6039 38 006 5303 05 003 Suburban 9410 38 005 8105 03 002 Non-metropolitan 4778 36 006 4073 02 002
N = Sample size SE = Standard error
Source US EPA analysis of 1994ndash1996 1998 CSFII
Exposure Factors Handbook Page September 2011 12-25
Table 12-17 Per Capita Intake of Breads a Based on 1994ndash1996 1998 CSFII (gkg-day as-consumed)
Population Group Percent Consuming Mean
Percentile SE 1st 5th 10th 25th 50th 75th 90th 95th 99th Max
Whole Population Age Group lt5 months 6 to 12 months lt1 year 1 to 2 years 3 to 5 years 6 to 11 years 12 to 19 years 20 to 39 years 40 to 69 years ge70 years Season Fall Spring Summer Winter Race Asian Black American IndianAlaska Native OtherNA White Region Midwest Northeast South West Urbanization Central City Suburban Non-metropolitan
872
09 302 146 772 865 871 862 881 900 916
874 871 873 869
691 831 822 804 890
891 883 875 837
856 877 885
11
00 05 03 20 23 17 11 09 09 09
11 11 11 11
08 11 14 12 11
12 11 11 11
11 11 11
001
008 016 011 006 005 004 003 002 001 002
002 002 002 002
006 003 018 004 001
002 002 002 002
002 001 002
00
00 00 00 00 00 00 00 00 00 00
00 00 00 00
00 00 00 00 00
00 00 00 00
00 00 00
00
00 00 00 00 00 00 00 00 00 00
00 00 00 00
00 00 00 00 00
00 00 00 00
00 00 00
00
00 00 00 00 00 00 00 00 00 02
00 00 00 00
00 00 00 00 00
00 00 00 00
00 00 00
04
00 00 00 04 09 07 04 04 04 04
04 04 04 04
00 03 03 03 04
04 04 04 03
04 04 04
09
00 00 00 14 20 14 09 08 08 08
09 09 09 08
04 07 09 09 09
09 09 09 08
08 09 09
15
00 05 00 29 33 24 15 13 13 13
15 15 15 14
12 14 17 16 15
15 15 15 14
14 15 15
23
00 18 08 44 47 35 23 20 19 19
24 23 24 23
19 23 36 27 23
25 23 23 24
23 24 23
31
00 30 17 60 58 43 28 25 23 23
31 31 31 31
29 33 41 34 30
33 29 31 32
31 31 31
51
00 48 46 85 87 67 40 39 35 29
49 51 52 51
45 63 62 56 49
57 45 49 51
51 50 50
200
18 73 73 200 132
113 75 62 84 43
146 116
171 200
146 116
200 75 171
120 98 171 200
132 146 200
a SE
Source
Includes breads rolls muffins bagels biscuits cornbread and tortillas = Standard error
US EPA analysis of the 1994ndash1996 CSFII
Exposure F
actors Handbook
Chapter 12mdash
Intake of Grain Products
Page E
xposure Factors H
andbook 12-26
September 2011
Table 12-18 Per Capita Intake of Sweets a Based on 1994ndash1996 1998 CSFII (gkg-day as-consumed)
Population Group Percent Consuming
Percentile Mean SE 1st 5th 10th 25th 50th 75th 90th 95th 99th Max
Whole Population Age Group lt5 months 6 to 12 months lt1 year 1 to 2 years 3 to 5 years 6 to 11 years 12 to 19 years 20 to 39 years 40 to 69 years ge70 years Season Fall Spring Summer Winter Race Asian Black American IndianAlaska Native OtherNA White Region Midwest Northeast South West Urbanization Central City Suburban Non-metropolitan
526
25 230 121 532 621 642 543 472 529 586
537 522 500 545
402 414 353 350 563
601 554 491 477
512 546 505
06
00 03 02 12 13 12 06 04 05 05
06 06 05 06
04 05 04 04 06
07 06 06 05
06 06 06
001
004 014 010 007 006 006 003 002 002 003
003 002 002 003
008 004 011 005 001
003 003 002 002
002 002 003
00
00 00 00 00 00 00 00 00 00 00
00 00 00 00
00 00 00 00 00
00 00 00 00
00 00 00
00
00 00 00 00 00 00 00 00 00 00
00 00 00 00
00 00 00 00 00
00 00 00 00
00 00 00
00
00 00 00 00 00 00 00 00 00 00
00 00 00 00
00 00 00 00 00
00 00 00 00
00 00 00
00
00 00 00 00 00 00 00 00 00 00
00 00 00 00
00 00 00 00 00
00 00 00 00
00 00 00
01
00 00 00 03 08 06 02 00 01 02
02 01 00 02
00 00 00 00 02
03 02 00 00
01 02 01
08
00 00 00 17 19 17 10 06 07 08
09 08 07 09
06 06 03 05 09
10 09 08 07
08 09 08
18
00 11 04 35 36 32 18 14 13 16
18 18 16 19
14 15 17 13 18
20 17 17 16
16 18 18
25
00 20 10 48 46 39 24 19 19 21
25 26 23 26
20 23 21 19 25
29 25 23 23
23 26 25
46
04 36 36 72 88 67 37 32 32 36
47 47 41 48
31 47 28 41 47
53 48 44 38
46 45 51
220
06 64 64 193 220 209 107
111 73 57
209 220 182 123
157 193
29 70 220
220 127 209 157
209 127 220
a SE
Source
Includes breakfast foods made with grains such as pancakes waffles and French toast = Standard error
US EPA analysis of the 1994ndash1996 CSFII
Exposure F
actors Handbook
Chapter 12mdash
Intake of Grain Products
Exposure F
actors Handbook
Page Septem
ber 2011 12-27
Table 12-19 Per Capita Intake of Snacks Containing Grains a Based on 1994ndash1996 1998 CSFII (gkg-day as-consumed)
Population Group Percent Consuming
Percentile Mean SE 1st 5th 10th 25th 50th 75th 90th 95th 99th Max
Whole Population Age Group lt5 months 6 to 12 months lt1 year 1 to 2 years 3 to 5 years 6 to 11 years 12 to 19 years 20 to 39 years 40 to 69 years ge70 years Season Fall Spring Summer Winter Race Asian Black American IndianAlaska Native OtherNA White Region Midwest Northeast South West Urbanization Central City Suburban Non-metropolitan
431
10 290 141 581 567 513 450 411 411 377
423 436 406 458
241 295 383 284 471
492 419 411 407
401 446 441
02
00 03 01 07 07 05 03 02 01 01
02 03 02 03
01 02 02 02 03
03 02 02 02
02 03 02
001
011 008 006 004 004 003 002 001 001 001
001 001 001 002
004 002 008 003 001
001 002 001 002
001 001 001
00
00 00 00 00 00 00 00 00 00 00
00 00 00 00
00 00 00 00 00
00 00 00 00
00 00 00
00
00 00 00 00 00 00 00 00 00 00
00 00 00 00
00 00 00 00 00
00 00 00 00
00 00 00
00
00 00 00 00 00 00 00 00 00 00
00 00 00 00
00 00 00 00 00
00 00 00 00
00 00 00
00
00 00 00 00 00 00 00 00 00 00
00 00 00 00
00 00 00 00 00
00 00 00 00
00 00 00
00
00 00 00 04 03 01 00 00 00 00
00 00 00 00
00 00 00 00 00
00 00 00 00
00 00 00
03
00 02 00 11 09 06 04 02 02 01
03 03 02 03
00 01 02 01 03
03 02 02 02
02 03 03
07
00 09 06 20 18 13 09 06 05 03
07 08 07 08
04 05 06 05 08
08 07 07 07
07 07 07
12
00 22 09 28 32 19 14 09 07 05
10 13 10 13
10 09 11 08 12
12 12 11 12
11 12 11
26
01 25 22 50 59 46 24 18 14 08
23 29 23 29
23 21 32 24 27
27 27 24 26
26 27 23
91
37 28 37 89 91 73 51 55 56 18
80 89 71 91
44 74 49 87 91
89 91 80 87
78 91 81
a SE
Source
Includes grain snacks such as crackers salty snacks popcorn and pretzels = Standard error
US EPA analysis of the 1994ndash1996 CSFII
Exposure F
actors Handbook
Chapter 12mdash
Intake of Grain Products
Page E
xposure Factors H
andbook 12-28
September 2011
Table 12-20 Per Capita Intake of Breakfast Foods a Based on 1994ndash1996 1998 CSFII (gkg-day as-consumed)
Population Group Percent Consuming
Percentile Mean SE 1st 5th 10th 25th 50th 75th 90th 95th 99th
Max
Whole Population Age Group lt5 months 6 to 12 months lt1 year 1 to 2 years 3 to 5 years 6 to 11 years 12 to 19 years 20 to 39 years 40 to 69 years ge70 years Season Fall Spring Summer Winter Race Asian Black American IndianAlaska Native OtherNA White Region Midwest Northeast South West Urbanization Central City Suburban Non-metropolitan
118
00 42 20 204 208 237 130
89 95 104
116 116
128 113
59 127
88 102 120
121 127 107 124
120 122 107
01
00 01 01 04 04 04 01 01 01 01
01 01 01 01
01 01 01 01 01
01 01 01 02
01 01 01
001
000 024 016 007 006 005 003 002 001 002
002 002 002 002
007 003 008 005 001
002 003 002 002
002 002 002
00
00 00 00 00 00 00 00 00 00 00
00 00 00 00
00 00 00 00 00
00 00 00 00
00 00 00
00
00 00 00 00 00 00 00 00 00 00
00 00 00 00
00 00 00 00 00
00 00 00 00
00 00 00
00
00 00 00 00 00 00 00 00 00 00
00 00 00 00
00 00 00 00 00
00 00 00 00
00 00 00
00
00 00 00 00 00 00 00 00 00 00
00 00 00 00
00 00 00 00 00
00 00 00 00
00 00 00
00
00 00 00 00 00 00 00 00 00 00
00 00 00 00
00 00 00 00 00
00 00 00 00
00 00 00
00
00 00 00 00 00 00 00 00 00 00
00 00 00 00
00 00 00 00 00
00 00 00 00
00 00 00
04
00 00 00 19 16 15 05 00 00 01
04 04 05 03
00 04 00 00 04
04 05 02 05
04 05 03
10
00 00 00 27 25 22 09 06 06 07
10 10 10 09
06 12 03 09 10
11 12 08 10
10 10 09
24
00 41 27 48 45 34 23 15 14 12
23 23 24 26
20 21 12 26 24
26 23 22 26
25 24 22
136
00 41 41 136
80 65 39 30 38 35
136
64 60 80
28 67 12 80 136
67 80 78 136
136
78 64
a SE
Source
Includes breakfast food made with grains such as pancakes waffles and French toast = Standard error
US EPA analysis of the 1994ndash1996 CSFII
Exposure F
actors Handbook
Chapter 12mdash
Intake of Grain Products
Exposure F
actors Handbook
Page Septem
ber 2011 12-29
Table 12-21 Per Capita Intake of Pasta Based on 1994ndash1996 1998 CSFII (gkg-day as-consumed) Population Group
Percent
Consuming Percentile
Mean SE 1st 5th 10th 25th 50th 75th 90th 95th 99th Max Whole Population
Age Group lt5 months 6 to 12 months lt1 year 1 to 2 years 3 to 5 years 6 to 11 years 12 to 19 years 20 to 39 years 40 to 69 years ge70 years Season Fall Spring Summer Winter Race Asian Black American IndianAlaska Native OtherNA White Region Midwest Northeast South West Urbanization Central City Suburban Non-metropolitan
130
00 75 35 160 128 134
117 139 137 90
136 132 126 126
194 70 18 96 141
121 201 95 132
134 140 103
03
00 01 01 08 06 05 03 03 02 02
03 03 03 03
05 02 01 02 03
03 05 02 03
03 03 02
002
000 022 015 015 013 012 009 004 003 006
005 005 005 006
017 010 023 009 003
005 005 005 005
005 003 005
00
00 00 00 00 00 00 00 00 00 00
00 00 00 00
00 00 00 00 00
00 00 00 00
00 00 00
00
00 00 00 00 00 00 00 00 00 00
00 00 00 00
00 00 00 00 00
00 00 00 00
00 00 00
00
00 00 00 00 00 00 00 00 00 00
00 00 00 00
00 00 00 00 00
00 00 00 00
00 00 00
00
00 00 00 00 00 00 00 00 00 00
00 00 00 00
00 00 00 00 00
00 00 00 00
00 00 00
00
00 00 00 00 00 00 00 00 00 00
00 00 00 00
00 00 00 00 00
00 00 00 00
00 00 00
00
00 00 00 00 00 00 00 00 00 00
00 00 00 00
00 00 00 00 00
00 00 00 00
00 00 00
10
00 00 00 34 21 20 08 11 10 00
12 11 09 08
20 00 00 00 11
08 19 00 09
12 12 01
22
00 10 00 62 44 38 21 22 19 13
24 23 21 21
33 17 00 20 23
21 28 18 22
25 22 15
51
00 33 23 106
84 75 42 41 36 29
47 58 52 51
66 36 24 35 53
52 59 44 57
53 53 42
291
00 67 67 167 143
119 291
112 118
77
167 147 154 291
112 291
36 154 167
167 154 291 141
291 167 141
SE
Source
= Standard error
US EPA analysis of the 1994ndash1996 CSFII
Exposure F
actors Handbook
Chapter 12mdash
Intake of Grain Products
Page E
xposure Factors H
andbook 12-30
September 2011
Table 12-22 Per Capita Intake of Cooked Cereals Based on 1994ndash1996 1998 CSFII (gkg-day as-consumed)
Population Group Percent Consuming
Percentile Mean SE 1st 5th 10th 25th 50th 75th 90th 95th 99th Max
Whole Population Age Group lt5 months 6 to 12 months lt1 year 1 to 2 years 3 to 5 years 6 to 11 years 12 to 19 years 20 to 39 years 40 to 69 years ge70 years Season Fall Spring Summer Winter Race Asian Black American IndianAlaska Native OtherNA White Region Midwest Northeast South West Urbanization Central City Suburban Non-metropolitan
104
09 166
83 184 160
87 56 62
116 245
120
91 93
111
44 201
76 76 93
96 90 124
94
116 99 97
04
01 19 09 16 13 05 02 01 03 06
04 03 03 04
02 07 03 04 03
03 03 04 04
04 03 03
004
054 118 082 029 028 017 009 005 003 007
008 006 008 008
020 010 032 030 004
007 010 006 009
008 005 007
00
00 00 00 00 00 00 00 00 00 00
00 00 00 00
00 00 00 00 00
00 00 00 00
00 00 00
00
00 00 00 00 00 00 00 00 00 00
00 00 00 00
00 00 00 00 00
00 00 00 00
00 00 00
00
00 00 00 00 00 00 00 00 00 00
00 00 00 00
00 00 00 00 00
00 00 00 00
00 00 00
00
00 00 00 00 00 00 00 00 00 00
00 00 00 00
00 00 00 00 00
00 00 00 00
00 00 00
00
00 00 00 00 00 00 00 00 00 00
00 00 00 00
00 00 00 00 00
00 00 00 00
00 00 00
00
00 00 00 00 00 00 00 00 00 00
00 00 00 00
00 00 00 00 00
00 00 00 00
00 00 00
06
00 94 00 69 53 00 00 00 09 22
11 00 00 09
00 22 00 00 00
00 00 11 00
09 00 00
23
00 161
57 107
79 40 10 11 19 34
26 20 21 25
00 44 21 20 20
21 22 26 23
26 21 23
72
00 228 228 206 161
94 43 33 44 56
81 64 69 74
53 109
58 106
61
57 59 79 80
81 69 57
725
56 228 228 339 725 241 106
92 87 106
459 209 725 445
161 339 123 725 459
459 725 317 395
725 459 269
SE
Source
= Standard error
US EPA analysis of the 1994ndash1996 CSFII
Exposure F
actors Handbook
Chapter 12mdash
Intake of Grain Products
Exposure F
actors Handbook
Page Septem
ber 2011 12-31
Table 12-23 Per Capita Intake of Ready-to-Eat Cereals a Based on 1994ndash1996 1998 CSFII (gkg-day as-consumed)
Population Group Percent Consuming
Percentile Mean SE 1st 5th 10th 25th 50th 75th 90th 95th 99th Max
Whole Population Age
lt5 months 6 to 12 months lt1 year 1 to 2 years 3 to 5 years 6 to 11 years 12 to 19 years 20 to 39 years 40 to 69 years ge70 years Season Fall Spring Summer Winter Race Asian Black American IndianAlaska Native OtherNA White Region Midwest Northeast South West Urbanization Central City Suburban Non-metropolitan
397
00 199
93 649 698 640 457 305 318 479
391 401 396 399
254 340 331 333 417
422 423 374 384
400 412 358
03
00 01 01 10 11 08 04 02 02 02
03 03 03 03
02 03 03 03 03
04 04 03 03
03 04 03
001
000 007 005 004 004 003 002 001 001 001
002 002 002 002
005 002 009 004 001
002 002 001 002
001 001 001
00
00 00 00 00 00 00 00 00 00 00
00 00 00 00
00 00 00 00 00
00 00 00 00
00 00 00
00
00 00 00 00 00 00 00 00 00 00
00 00 00 00
00 00 00 00 00
00 00 00 00
00 00 00
00
00 00 00 00 00 00 00 00 00 00
00 00 00 00
00 00 00 00 00
00 00 00 00
00 00 00
00
00 00 00 00 00 00 00 00 00 00
00 00 00 00
00 00 00 00 00
00 00 00 00
00 00 00
00
00 00 00 07 09 06 00 00 00 00
00 00 00 00
00 00 00 00 00
00 00 00 00
00 00 00
04
00 00 00 15 17 12 06 03 02 04
04 04 04 05
01 04 04 03 05
05 05 04 04
05 05 04
10
00 03 00 25 26 20 11 07 06 07
11 10 11 10
08 10 08 11 11
11 11 10 11
11 11 08
15
00 10 03 33 33 25 15 10 09 09
16 15 16 14
12 15 14 17 15
16 16 13 16
15 16 12
29
00 18 17 49 48 40 22 17 14 15
29 29 30 27
27 32 26 30 28
29 29 28 31
28 31 26
101
00 26 26 88 101
80 64 53 52 27
88 77 78 101
49 101
44 66 88
80 80 101
88
101 80 88
a SE
Source
Includes dry ready-to-eat corn rice wheat and bran cereals in the form of flakes puffs etc = Standard error
US EPA analysis of the 1994ndash1996 CSFII
Exposure F
actors Handbook
Chapter 12mdash
Intake of Grain Products
Page E
xposure Factors H
andbook 12-32
September 2011
Table 12-24 Per Capita Intake of Baby Cereals Based on 1994ndash1996 1998 CSFII (gkg-day as-consumed)
Population Group Percent Consuming
Percentile Mean SE 1st 5th 10th 25th 50th 75th 90th 95th 99th Max
Whole Population Age
lt5 months 6 to 12 months lt1 year 1 to 2 years 3 to 5 years 6 to 11 years 12 to 19 years 20 to 39 years 40 to 69 years ge70 years Season Fall Spring Summer Winter Race Asian Black American IndianAlaska Native OtherNA White Region Midwest Northeast South West Urbanization Central City Suburban Non-metropolitan
10
408 678 534
62 03 01 00 00 01 00
09 12 08 11
07 10 06 17 10
11 12 09 09
11 11 08
00
08 25 16 02 00 00 00 00 00 00
00 00 00 00
00 00 00 01 00
00 00 00 00
00 00 00
003
024 045 027 010 006 000 000 000 000 000
007 005 006 006
004 012 004 020 003
008 004 005 006
006 004 006
00
00 00 00 00 00 00 00 00 00 00
00 00 00 00
00 00 00 00 00
00 00 00 00
00 00 00
00
00 00 00 00 00 00 00 00 00 00
00 00 00 00
00 00 00 00 00
00 00 00 00
00 00 00
00
00 00 00 00 00 00 00 00 00 00
00 00 00 00
00 00 00 00 00
00 00 00 00
00 00 00
00
00 00 00 00 00 00 00 00 00 00
00 00 00 00
00 00 00 00 00
00 00 00 00
00 00 00
00
00 08 02 00 00 00 00 00 00 00
00 00 00 00
00 00 00 00 00
00 00 00 00
00 00 00
00
10 28 17 00 00 00 00 00 00 00
00 00 00 00
00 00 00 00 00
00 00 00 00
00 00 00
00
24 69 41 00 00 00 00 00 00 00
00 00 00 00
00 00 00 00 00
00 00 00 00
00 00 00
00
31 113
73 08 00 00 00 00 00 00
00 00 00 00
00 00 00 00 00
00 00 00 00
00 00 00
01
88 211 197
58 00 00 00 00 00 00
00 06 00 03
00 00 00 12 00
03 05 00 00
03 01 00
376
266 376 376 125
38 01 00 00 03 00
211 266 260 376
21 376
09 266 260
211 125 376 266
376 211 260
SE
Source
= Standard error
US EPA analysis of the 1994ndash1996 CSFII
Exposure F
actors Handbook
Chapter 12mdash
Intake of Grain Products
Exposure F
actors Handbook
Page Septem
ber 2011 12-33
Table 12-25 Quantity (as-consumed) of Grain Products Consumed per Eating Occasion and the Percentage of Individuals Using These Foods in 2 Days
Indiv Using Quantity Consumed per Consumers Only Food at Least Eating Occasion Quantity Consumed per Eating Occasion at Specified Percentiles
Food Category Once in 2 days (grams) (grams) Average SE 5th 10th 25th 50th 75th 90th 95th
White bread 596 50 1 21 24 33 46 52 78 104 Whole grain and wheat bread 281 50 1 24 25 37 50 56 72 92 Rolls 480 58 1 27 33 43 48 70 89 110 Biscuits 109 61 1 19 19 35 57 76 104 139 Tortillas 155 60 1 14 21 32 48 79 107 135 Quick breads and muffins 125 82 2 21 28 52 60 94 142 187 Doughnuts and sweet rolls 124 77 1 26 36 47 65 93 133 164 Crackers 174 26 1 6 9 12 18 30 47 62 Cookies 307 40 1 9 12 20 31 50 75 96 Cake 162 92 3 22 28 41 77 116 181 217 Pie 85 150 3 52 72 102 143 168 246 300 Pancakes and waffles 103 85 3 21 35 42 75 109 158 205 Cooked cereal 103 248 6 81 117 157 233 291 455 484 Oatmeal 61 264 6 116 117 176 232 333 454 473 Ready-to-eat cereal 406 54 1 18 24 30 46 67 93 113 Corn flakes 81 46 1 17 22 25 37 56 75 100 Toasted oat rings 68 42 1 14 16 27 38 54 65 83 Rice 280 150 3 27 40 76 131 192 312 334 Pasta 360 162 3 26 43 73 133 210 318 420 Macaroni and cheese 85 244 9 53 81 121 191 324 477 556 Spaghetti with tomato sauce 80 436 15 122 124 246 371 494 740 983 Pizza 199 169 5 36 52 78 140 214 338 422 SE = Standard error
Source Smiciklas-Wright et al (2002) (based on 1994ndash1996 CSFII data)
Exposure F
actors Handbook
Chapter 12mdash
Intake of Grain Products
Page E
xposure Factors H
andbook 12-34
September 2011
Table 12-26 Quantity (as-consumed) of Grain Products Consumed per Eating Occasion and Percentage of Individuals Using These Foods in 2 Days by Sex and Age
Food Category
Quantity Consumed per Eating Occasion (grams) 2 to 5 years 6 to 11 years 12 to 19 years
Males and Females (N = 2109)
Males and Females Males (N = 1432) (N = 696)
Females (N = 702)
PC Mean SE PC Mean SE PC Mean SE PC Mean SE White bread
Whole grain and wheat bread Rolls Biscuits
Tortillas Quick breads and muffins
Doughnuts and sweet rolls Crackers
Cookies Cake
Pie Pancakes and waffles Cooked cereal
Oatmeal Ready-to-eat cereal Corn flakes Toasted oat rings Rice
Pasta Macaroni and cheese Spaghetti with tomato sauce
Pizza Corn chips
Popcorn
669 243 400
83 146
96 113
254 510 146
29 191 168 104 729
112 206 296 494 178 168 237 196
116
34 37 39 38 32 55 59 17 28 70 76 49
211 221
33 33 30 84 90 159 242
86 29 20
a
1 1 2 2 4 2 1 1 3 8 1
10 9 1 2 1 3 3 8 11 3 2 1
671 205 535
97 164
96 134 172 467 197
56 215
90 57 673 131 125 246 414 132
115 328 256 127
42 44 48 48 47 67 69 26 37 79
116 77 245 256
47 42 45 124 130 217 322 108
33 31
1 1 1 3 2 5 2 2 2 4 8 3
14 19
1 2 2 6 5
13 18
6 2 2
613 145 619 122 229
110 173 106 290 151
66 135
52 24 456 104
73 242 334
75 101 396 269
78
56 60 69 72 76 125 102
39 53 99 188
96 310b
348b
72 62 62 203 203 408 583 205
58 54
1 2 2 4 5
12 12
5 3 9
15 6
29b
45b
3 4 5
10 9
46 46 13
5 5
579 176 488 103 201
110 138 142 318 155
48 82 60 23 463
87 81 288 378 107
85 305 251 105
47 53 51 55 56 79 78 26 42 85
138b
74 256b
321b
52 49 42 157 155 260 479 143
44 37
1 2 1 4 3
10 5 3 2 8
12b
5 31b
40b
2 4 3
10 9
30 51
8 3 4
Exposure F
actors Handbook
Chapter 12mdash
Intake of Grain Products
Exposure F
actors Handbook
Page Septem
ber 2011 12-35
Exposure F
actors Handbook
Chapter 12mdash
Intake of Grain Products
Page E
xposure Factors H
andbook 12-36
September 2011
Table 12-26 Quantity (as-consumed) of Grain Products Consumed per Eating Occasion and Percentage of Individuals Using These Foods in 2 Days by Sex and Age (continued)
Food Category
Quantity Consumed per Eating Occasion (g) 20 to lt40 years 40 to lt60 years gt60 years
Males Females (N = 1543) (N = 1449)
Males Females (N = 1663) (N = 1694)
Males Females (N = 1545) (N = 1429)
PC Mean SE PC Mean SE PC Mean SE PC Mean SE PC Mean SE PC Mean SE White bread
Whole grain and wheat bread Rolls Biscuits
Tortillas Quick breads and muffins
Doughnuts and sweet rolls Crackers
Cookies Cake
Pie Pancakes and waffles Cooked cereal
Oatmeal Ready-to-eat cereal Corn flakes Toasted oat rings Rice
Pasta Macaroni and cheese
Spaghetti with tomato sauce Pizza
Corn chips Popcorn
630 253 620
115 206
80 133
119 208 135
58 80 52 27 269
65 42 308 371
78 86 237 162
81
63 63 73 73 79 93 94 36 56
113 161 126 313 360a
77 73 62 199 214 301 630 253
61 63
2 1 4 3 4 7 5 3 4 6 7
15 30 42a
3 6 4 9 8
19 48 12
5 6
549 252 464
94 201
113 112
156 265 149
72 74 73 37 347
53 54 321 371
78 78 202 179
97
47 48 53 55 53 79 68 28 39 94 150
80 219 258
55 43 42 139 155 235 385 150
35 35
1 1 1 2 2 5 2 2 2 7 9 6 11
17 1 2 2 6 6
19 22
6 2 2
597 328 479 134 134 157 134 166 276 165
118 75 97 60 298
59 48 294 343
61 55 130 128
96
59 57 65 80 67 93 88 30 47 108 162
117 300 332
68 49 46 167 208 302 543 220
47 50
2 1 1 3 3 7 4 1 2 6 6 8
16 16
2 3 2 5 7
31 59 13
4 4
553 323 434
112 127 149
110 175 290 168
99 80 103
62 297
52 41 288 347
60 54 145 120 109
46 46 52 56 52 72 72 24 36 83 151
74 243 242
51 40 35 130 140 210 386 147
33 39
1 2 1 2 2 4 4 1 1 4 8 5 11
10 1 3 2 4 5
12 18
8 2 3
593 398 378 130
42 174
114 256 297 192 164 108 209 136 446 124
43 231 279
71 50 53 48 61
51 48 54 58 47 86 65 23 40 85 154
99 255 257
53 37 36 147 167 230 450 187
30 52
1 1 1 3 4 5 2 1 2 4 7 5 8
10 1 2 3 6 7
13 22 18
3 4
548 431 306
98 54 183 104 259 322 183 133
82 202 129 440 104
49 214 279
65 45 47 53 76
41 41 43 48 41 72 56 17 30 87 137
68 216 224
41 30 27
118 132 215 379 109
21 34
1 1 1 3 2 4 2 1 1 7 5 4 8
10 1 1 2 5 5
18 33
8 2 3
a Indicates a SE value that is greater than 0 but less than 05 b Indicates a statistic that is potentially unreliable because of small sample size or large coefficient of variation N = Sample size
PC = Percent consuming at least once in 2 days SE = Standard error of the mean
Source Smiciklas-Wright et al (2002) (based on 1994ndash1996 CSFII data)
Exposure Factors Handbook
Chapter 12mdashIntake of Grain Products
Table 12-27 Consumption of Major Food Groups by Older Adults Median Daily Servings (and ranges) by Demographic and Health Characteristics
Subject Characteristic N Bread Cereal Rice and Pasta (servingsday) Sex a
Females 80 27 (09ndash65) Males 50 36 (14ndash73)
Ethnicity African American 44 33 (14ndash64) European American 47 32 (09ndash68) Native American 39 29 (11ndash73)
Age 70 to 74 years 42 33 (11ndash63) 75 to 79 years 36 30 (09ndash68) 80 to 84 years 36 32 (15ndash64) gt85 years 16 36 (16ndash73)
Marital Status Married 49 33 (11ndash58) Not Married 81 30 (09ndash73)
Education 8th grade or less 37 31 (11ndash73) 9th to 12th grades 47 33 (11ndash68) gtHigh School 46 32 (09ndash65)
Dentures Yes 83 33 (11ndash64) No 47 31 (09ndash73)
Chronic Diseases 0 7 41 (22ndash64) 1 31 33 (09ndash73) 2 56 31 (11ndash58) 3 26 37 (11ndash58) gt4 10 29 (14ndash53)
Weightb
le130 pounds 18 31 (11ndash54) 131 to 150 pounds 32 33 (09ndash52) 151 to 170 pounds 27 31 (14ndash73) 171 to 190 pounds 22 36 (14ndash62) ge191 pounds 29 30 (11ndash68)
a p lt 005 b 2 missing values N = Number of subjects
Source Vitolins et al (2002)
Exposure Factors Handbook Page September 2011 12-37
Exposure Factors Handbook
Chapter 12mdashIntake of Grain Products
Table 12-28 Characteristics of the Feeding Infant and Toddlers Study (FITS) Sample Population Sample Size Percentage of Sample
Sex Males Females
1549 1473
513 487
Age of Child 4 to 6 months 7 to 8 months 9 to 11 months 12 to 14 months 15 to 18 months 19 to 24 months
862 483 679 374 308 316
285 160 225 124 102 104
Childrsquos Ethnicity Hispanic or Latino Non-Hispanic or Latino Missing
367 2641
14
121 874 05
Childrsquos Race White Black Other
2417 225 380
800 74 126
Urbanicity Urban Suburban Rural Missing
1389 1014 577 42
460 336 191 13
Household Income Under $10000 $10000 to $14999 $15000 to $24999 $25000 to $34999 $35000 to $49999 $50000 to $74999 $75000 to $99999 $100000 and Over Missing
48 48
221 359 723 588 311 272 452
16 16 73 119 239 195 103 90 149
Receives WIC Yes No Missing
821 2196
5
272 726 02
Sample Size (Unweighted) 3022 1000 WIC = Special Supplemental Nutrition Program for Women Infants and Children
Source Devaney et al (2004)
Page Exposure Factors Handbook 12-38 September 2011
Table 12-29 Percentage of Infants and Toddlers Consuming Different Types of Grain Products Percentage of Infants and Toddlers Consuming at Least Once in a Day
Food GroupFood 4 to 6 7 to 8 9 to 11 12 to 14 15 to 18 19 to 24 Months Months Months Months Months Months
Any Grain or Grain Product 658 915 975 978 986 992 Infant Cereals 648 812 638 239 92 31 Non-infant Cerealsa 06 183 443 589 605 519
Not Pre-sweetened 05 170 370 445 406 319 Pre-sweetenedb 00 18 90 177 264 227
Breads and Rollsc 06 99 245 473 527 531 Crackers Pretzels Rice Cakes 30 162 334 452 464 447 Cereal or Granola Bars 00 11 34 98 100 97 Pancakes Waffles French Toast 01 08 75 151 161 154 Rice and Pastad 23 45 182 262 390 359 Other 02 01 27 28 25 45 Grains in Mixed Dishes 04 53 241 483 520 551 Sandwiches 00 11 86 215 258 258 Burrito Taco Enchilada Nachos 00 00 10 45 28 21 Macaroni and Cheese 02 16 49 146 150 150 Pizza 01 07 22 68 90 94 Pot PieHot Pocket 00 09 05 20 10 18 Spaghetti Ravioli Lasagna 01 18 99 153 121 88 a Includes both ready-to-eat and cooked cereals b Defined as cereals with more than 211 grams sugar per 100 grams c Does not include bread in sandwiches Sandwiches are included in mixed dishes d Does not include rice or pasta in mixed dishes
Source Fox et al (2004)
Exposure Factors Handbook
Chapter 12mdashIntake of Grain Products
Exposure Factors Handbook Page September 2011 12-39
Table 12-30
a Characteristics of Women Infants and Children (WIC) Participants and Non-Participants (percentages)
Infants 4 to 6 month Infants 7 to 11 month Toddlers 12 to 24 month WIC
Participant Non-Participant WIC
Participant Non-Participant WIC
Participant Non-Participant Sex Males 55 Females 45
Childrsquos Ethnicity Hispanic or Latino 20 Non-Hispanic or Latino 80
Childrsquos Race White 69 Black 15 Other 22
Child in Daycare Yes 39 No 61 Age of Mother 14 to 19 years 18 20 to 24 years 33 25 to 29 years 29 30 to 34 years 9 gt35 years 9 Missing 2
Motherrsquos Education 11th Grade or Less 23 Completed High School 35 Some Postsecondary 33 Completed College 7 Missing 2
Parentrsquos Marital Status Married 49 Not Married 50 Missing 1
Mother or Female Guardian Works Yes 46 No 53 Missing 1
54 46
b
11 89
b 84
4 11
38 62
b 1
13 29 33 23
2 b 2
19 26 53
1 b
93 7 1
51 48
1
55 45
24 76
63 17 20
34 66
13 38 23 15
11 1 15 42 32
9 2 57 42
1 45 54
1
51 49
b 8
92 b
86 5 9 b
46 54
b 1 11
30 36 21
1 b 2
20 27 51
0 b
93 7 0 b
60 40
0
57 43
22 78
67 13 20
43 57
9
33 29 18
11 0
17 42 31
9 1
58 41
1
55 45
0
52 48
b 10 89
b 84
5 11
c
53 47
b 1
14 26 34 26
1 b 3
19 28 48
2 b
88 11 1
c
61 38
1
Exposure Factors Handbook
Chapter 12mdashIntake of Grain Products
Page Exposure Factors Handbook 12-40 September 2011
c
Table 12-30 Characteristics of Women Infants and Children (WIC) Participants and Non-Participantsa
(percentages) (continued) Infants 4 to 6 months Infants 7 to 11 months Toddlers 12 to 24 months
WIC WIC WIC Participant Non-Participant Participant Non-Participant Participant Non-Participant
Urbanicity c c c
Urban 34 55 37 50 35 48 Suburban 36 31 31 34 35 35 Rural 28 13 30 15 28 16 Missing 2 1 2 1 2 2
Sample Size (Unweighted) 265 597 351 808 205 791 a χ2 tests were conducted to test for statistical significance in the differences between WIC participants and nonshy
participants within each age group for each variable The results of χ2 tests are listed next to the variable under the column labeled non-participants for each of the three age groups
b = p lt 005 non-participants significantly different from WIC participants on the variable = p lt 001 non-participants significantly different from WIC participants on the variable
WIC = Special Supplemental Nutrition Program for Women Infants and Children
Source Ponza et al (2004)
Table 12-31 Food Choices for Infants and Toddlers by Women Infants and Children (WIC) Participation Status
Infants 4 to 6 months Infants 7 to 11 months Toddlers 12 to 24 months WIC Non- WIC Non- WIC Non-
Participant Participant Participant Participant Participant Participant 697 Infant Cereals 697 625 747 135 92
Non-infant Cereals Total 09 05 217 385a 581 560
Not Pre-sweetened 05 05 187 329a 437 363 Pre-sweetened 00 00 40 69 177 241
Grains in Combination Foods 09 01 188 147 503 529 Sample Size (unweighted) 265 597 351 808 205 791 a = p lt 001 non-participants significantly different from WIC participants WIC = Special Supplemental Nutrition Program for Women Infants and Children
Source Ponza et al (2004)
Exposure Factors Handbook
Chapter 12mdashIntake of Grain Products
Exposure Factors Handbook Page September 2011 12-41
Table 12-32 Average Portion Sizes per Eating Occasion of Grain Products Commonly Consumed by Infants From the 2002 Feeding Infants and Toddlers Study
4 to 5 months 6 to 8 months 9 to 11 months Reference Food Group (N = 624) (N = 708) (N = 687) Unit Mean plusmn SE Infant cereal dry tablespoon 31 plusmn 014 45 plusmn 014 52 plusmn 018 Infant cereal jarred tablespoon - 56 plusmn 026 74 plusmn 034 Ready-to-eat cereal tablespoon - 23 plusmn 034 34 plusmn 021 Crackers ounce - 02 plusmn 002 03 plusmn 001 Crackers saltine - 22 plusmn 014 27 plusmn 012 Bread slice - 05 plusmn 010 08 plusmn 006 - = Cell size was too small to generate a reliable estimate N = Number of respondents SE = Standard error of the mean
Source Fox et al (2006)
Exposure Factors Handbook
Chapter 12mdashIntake of Grain Products
Table 12-33 Average Portion Sizes per Eating Occasion of Grain Products Commonly Consumed by Toddlers From the 2002 Feeding Infants and Toddlers Study
Food Group Reference Unit 12 to 14 months
(N = 371) 15 to 18 months
(N = 312) 19 to 24 months (N = 320)
Mean plusmn SE Bread slice 08 plusmn 004 09 plusmn 005 09 plusmn 005 Rolls ounce 09 plusmn 011 10 plusmn 010 09 plusmn 015 Ready-to-eat cereal cup 03 plusmn 002 05 plusmn 003 06 plusmn 004 Hot cereal prepared cup 06 plusmn 005 06 plusmn 005 07 plusmn 005 Crackers ounce 03 plusmn 002 04 plusmn 002 04 plusmn 002 Crackers saltine 33 plusmn 022 35 plusmn 022 37 plusmn 022 Pasta cup 04 plusmn 004 04 plusmn 004 05 plusmn 005 Rice cup 03 plusmn 004 04 plusmn 005 04 plusmn 005 Pancakes and waffles 1 (4-inch diameter) 10 plusmn 008 14 plusmn 021 14 plusmn 017 N = Number of respondents SE = Standard error of the mean
Source Fox et al (2006)
Page Exposure Factors Handbook 12-42 September 2011
c
Table 12-34 Percentage of Hispanic and Non-Hispanic Infants and Toddlers Consuming Different Types of Grain Products on a Given Day Age 4 to 5 months Age 6 to 11 months Age 12 to 24 months
Hispanic Non-Hispanic Hispanic Non-Hispanic Hispanic Non-Hispanic (N = 84) (N = 538) (N = 163) (N = 1228) (N = 124) (N = 871)
Any Grain or Grain Product Infant Cereal Non-infant Cereal Breadsb
Tortillas Crackers Pretzels Rice Cakes Pancakes Waffles French Toast Rice and Pastad
Rice Grains in Mixed Dishes
Sandwiches Burrito Taco Enchilada Nachos
565 552
-14c
14c
13c
------
569 565
----------
950 741 185a
182 40c
278 14c
201a
159e
159 40c
13c
935 736 292 151
-225 43
103 47
130 46 -
971 159 453 440 67a c
356 130 443
269a c
388a
242 21c
989 93
578 529 06c
469 160 329 130 544 249 30
Macaroni and Cheese - - 30c 31 101 155
Pizza - - - 14 10c e 97
Spaghetti Ravioli Lasagna - - 83c 46 93c 121 a = Significantly different from non-Hispanic at p lt 005 b Does not include bread in sandwiches Sandwiches are included in mixed dishes Includes tortillas also shown
separately = Statistic is potentially unreliable because of a high coefficient of variation
d Does not include rice or pasta in mixed dishes Includes rice (eg white brown wild and Spanish rice without meat) and pasta (eg spaghetti macaroni and egg noodles) Rice is also shown separately
e = Significantly different from non-Hispanic at p lt 001 - = Less than 1 of the group consumed this food on a given day N = Sample size
Source Mennella et al (2006)
Exposure Factors Handbook
Chapter 12mdashIntake of Grain Products
Exposure Factors Handbook Page September 2011 12-43
Exposure Factors Handbook
Chapter 12mdashIntake of Grain Products
Table 12-35 Mean Moisture Content of Selected Grain Products Expressed as Percentages of Edible Portions (grams per 100 grams of edible portion)
Food Moisture Content Comments Raw Cooked Barley―pearled 1009 6880 Corn―grain―endosperm 1037 -Corn―grain―bran 471 - crude Millet 867 7141 Oats 822 -Rice―white―long-grained 1162 6844 Rye 1095 -Rye―flour―medium 985 -Sorghum 920 -Wheat―hard white 957 -Wheat―germ 1112 - crude Wheat―bran 989 - crude Wheat―flour―whole grain 1027 -- Indicates that the grain product was not assessed for water content under these conditions
Source USDA (2007)
Page Exposure Factors Handbook 12-44 September 2011
- TABLE OF CONTENTS
- LIST OF TABLES
- 12 INTAKE OF GRAIN PRODUCTS
-
- 121 INTRODUCTION
- 122 RECOMMENDATIONS
- 123 INTAKE STUDIES
-
- 1231 Key Grain Intake Study
-
- 12311 US EPA Analysis of Consumption Data From 2003minus2006 National Health and Nutrition Examination Survey (NHANES)
-
- 1232 Relevant Grain Intake Studies
-
- 12321 USDA (1996a b 1993 1980)mdashFood and Nutrient Intakes of Individuals in 1 Day in the United States
- 12322 USDA (1999b)mdashFood Consumption Prices and Expenditures 1970minus1997
- 12323 USDA (1999a)mdashFood and Nutrient Intakes by Children 1994minus1996 1998 Table Set 17
- 12324 US EPA Analysis of Continuing Survey of Food Intake by Individuals (CSFII) 1994minus1996 1998
- 12325 Smiciklas-Wright et al (2002)mdashFoods Commonly Eaten in the United States Quantities Consumed per Eating Occasion and in a Day 1994minus1996
- 12326 Vitolins et al (2002)mdashQuality of Diets Consumed by Older Rural Adults
- 12327 Fox et al (2004)mdashFeeding Infants and Toddlers Study What Foods Are Infants and Toddlers Eating
- 12328 Ponza et al (2004)mdashNutrient Food Intakes and Food Choices of Infants and Toddlers Participating in WIC
- 12329 Fox et al (2006)mdashAverage Portion of Foods Commonly Eaten by Infants and Toddlers in the United States
- 123210 Mennella et al (2006)mdashFeeding Infants and Toddlers Study The Types of Foods Fed to Hispanic Infants and Toddlers
-
- 124 CONVERSION BETWEEN WET- AND DRY-WEIGHT INTAKE RATES
- 125 REFERENCES FOR CHAPTER 12
-
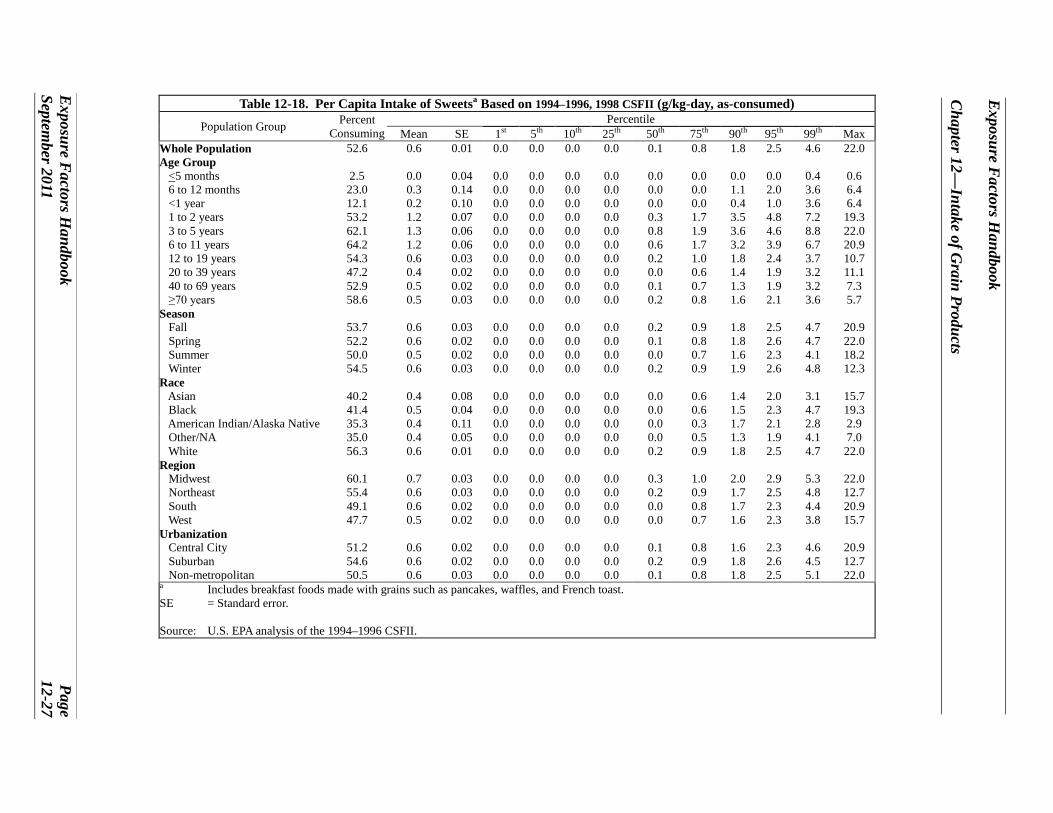
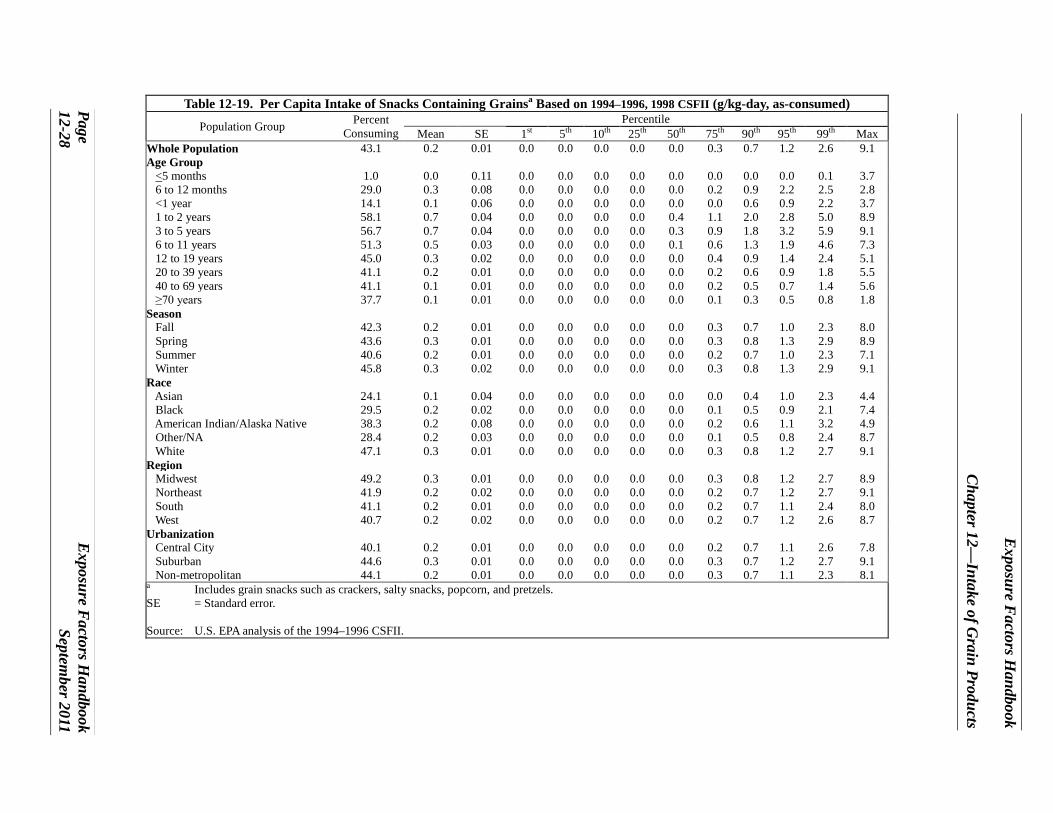

Exposure Factors Handbook
Chapter 12mdashIntake of Grain Products
Table 12-28 Characteristics of the Feeding Infant and Toddlers Study (FITS) Sample Population Sample Size Percentage of Sample
Sex Males Females
1549 1473
513 487
Age of Child 4 to 6 months 7 to 8 months 9 to 11 months 12 to 14 months 15 to 18 months 19 to 24 months
862 483 679 374 308 316
285 160 225 124 102 104
Childrsquos Ethnicity Hispanic or Latino Non-Hispanic or Latino Missing
367 2641
14
121 874 05
Childrsquos Race White Black Other
2417 225 380
800 74 126
Urbanicity Urban Suburban Rural Missing
1389 1014 577 42
460 336 191 13
Household Income Under $10000 $10000 to $14999 $15000 to $24999 $25000 to $34999 $35000 to $49999 $50000 to $74999 $75000 to $99999 $100000 and Over Missing
48 48
221 359 723 588 311 272 452
16 16 73 119 239 195 103 90 149
Receives WIC Yes No Missing
821 2196
5
272 726 02
Sample Size (Unweighted) 3022 1000 WIC = Special Supplemental Nutrition Program for Women Infants and Children
Source Devaney et al (2004)
Page Exposure Factors Handbook 12-38 September 2011
Table 12-29 Percentage of Infants and Toddlers Consuming Different Types of Grain Products Percentage of Infants and Toddlers Consuming at Least Once in a Day
Food GroupFood 4 to 6 7 to 8 9 to 11 12 to 14 15 to 18 19 to 24 Months Months Months Months Months Months
Any Grain or Grain Product 658 915 975 978 986 992 Infant Cereals 648 812 638 239 92 31 Non-infant Cerealsa 06 183 443 589 605 519
Not Pre-sweetened 05 170 370 445 406 319 Pre-sweetenedb 00 18 90 177 264 227
Breads and Rollsc 06 99 245 473 527 531 Crackers Pretzels Rice Cakes 30 162 334 452 464 447 Cereal or Granola Bars 00 11 34 98 100 97 Pancakes Waffles French Toast 01 08 75 151 161 154 Rice and Pastad 23 45 182 262 390 359 Other 02 01 27 28 25 45 Grains in Mixed Dishes 04 53 241 483 520 551 Sandwiches 00 11 86 215 258 258 Burrito Taco Enchilada Nachos 00 00 10 45 28 21 Macaroni and Cheese 02 16 49 146 150 150 Pizza 01 07 22 68 90 94 Pot PieHot Pocket 00 09 05 20 10 18 Spaghetti Ravioli Lasagna 01 18 99 153 121 88 a Includes both ready-to-eat and cooked cereals b Defined as cereals with more than 211 grams sugar per 100 grams c Does not include bread in sandwiches Sandwiches are included in mixed dishes d Does not include rice or pasta in mixed dishes
Source Fox et al (2004)
Exposure Factors Handbook
Chapter 12mdashIntake of Grain Products
Exposure Factors Handbook Page September 2011 12-39
Table 12-30
a Characteristics of Women Infants and Children (WIC) Participants and Non-Participants (percentages)
Infants 4 to 6 month Infants 7 to 11 month Toddlers 12 to 24 month WIC
Participant Non-Participant WIC
Participant Non-Participant WIC
Participant Non-Participant Sex Males 55 Females 45
Childrsquos Ethnicity Hispanic or Latino 20 Non-Hispanic or Latino 80
Childrsquos Race White 69 Black 15 Other 22
Child in Daycare Yes 39 No 61 Age of Mother 14 to 19 years 18 20 to 24 years 33 25 to 29 years 29 30 to 34 years 9 gt35 years 9 Missing 2
Motherrsquos Education 11th Grade or Less 23 Completed High School 35 Some Postsecondary 33 Completed College 7 Missing 2
Parentrsquos Marital Status Married 49 Not Married 50 Missing 1
Mother or Female Guardian Works Yes 46 No 53 Missing 1
54 46
b
11 89
b 84
4 11
38 62
b 1
13 29 33 23
2 b 2
19 26 53
1 b
93 7 1
51 48
1
55 45
24 76
63 17 20
34 66
13 38 23 15
11 1 15 42 32
9 2 57 42
1 45 54
1
51 49
b 8
92 b
86 5 9 b
46 54
b 1 11
30 36 21
1 b 2
20 27 51
0 b
93 7 0 b
60 40
0
57 43
22 78
67 13 20
43 57
9
33 29 18
11 0
17 42 31
9 1
58 41
1
55 45
0
52 48
b 10 89
b 84
5 11
c
53 47
b 1
14 26 34 26
1 b 3
19 28 48
2 b
88 11 1
c
61 38
1
Exposure Factors Handbook
Chapter 12mdashIntake of Grain Products
Page Exposure Factors Handbook 12-40 September 2011
c
Table 12-30 Characteristics of Women Infants and Children (WIC) Participants and Non-Participantsa
(percentages) (continued) Infants 4 to 6 months Infants 7 to 11 months Toddlers 12 to 24 months
WIC WIC WIC Participant Non-Participant Participant Non-Participant Participant Non-Participant
Urbanicity c c c
Urban 34 55 37 50 35 48 Suburban 36 31 31 34 35 35 Rural 28 13 30 15 28 16 Missing 2 1 2 1 2 2
Sample Size (Unweighted) 265 597 351 808 205 791 a χ2 tests were conducted to test for statistical significance in the differences between WIC participants and nonshy
participants within each age group for each variable The results of χ2 tests are listed next to the variable under the column labeled non-participants for each of the three age groups
b = p lt 005 non-participants significantly different from WIC participants on the variable = p lt 001 non-participants significantly different from WIC participants on the variable
WIC = Special Supplemental Nutrition Program for Women Infants and Children
Source Ponza et al (2004)
Table 12-31 Food Choices for Infants and Toddlers by Women Infants and Children (WIC) Participation Status
Infants 4 to 6 months Infants 7 to 11 months Toddlers 12 to 24 months WIC Non- WIC Non- WIC Non-
Participant Participant Participant Participant Participant Participant 697 Infant Cereals 697 625 747 135 92
Non-infant Cereals Total 09 05 217 385a 581 560
Not Pre-sweetened 05 05 187 329a 437 363 Pre-sweetened 00 00 40 69 177 241
Grains in Combination Foods 09 01 188 147 503 529 Sample Size (unweighted) 265 597 351 808 205 791 a = p lt 001 non-participants significantly different from WIC participants WIC = Special Supplemental Nutrition Program for Women Infants and Children
Source Ponza et al (2004)
Exposure Factors Handbook
Chapter 12mdashIntake of Grain Products
Exposure Factors Handbook Page September 2011 12-41
Table 12-32 Average Portion Sizes per Eating Occasion of Grain Products Commonly Consumed by Infants From the 2002 Feeding Infants and Toddlers Study
4 to 5 months 6 to 8 months 9 to 11 months Reference Food Group (N = 624) (N = 708) (N = 687) Unit Mean plusmn SE Infant cereal dry tablespoon 31 plusmn 014 45 plusmn 014 52 plusmn 018 Infant cereal jarred tablespoon - 56 plusmn 026 74 plusmn 034 Ready-to-eat cereal tablespoon - 23 plusmn 034 34 plusmn 021 Crackers ounce - 02 plusmn 002 03 plusmn 001 Crackers saltine - 22 plusmn 014 27 plusmn 012 Bread slice - 05 plusmn 010 08 plusmn 006 - = Cell size was too small to generate a reliable estimate N = Number of respondents SE = Standard error of the mean
Source Fox et al (2006)
Exposure Factors Handbook
Chapter 12mdashIntake of Grain Products
Table 12-33 Average Portion Sizes per Eating Occasion of Grain Products Commonly Consumed by Toddlers From the 2002 Feeding Infants and Toddlers Study
Food Group Reference Unit 12 to 14 months
(N = 371) 15 to 18 months
(N = 312) 19 to 24 months (N = 320)
Mean plusmn SE Bread slice 08 plusmn 004 09 plusmn 005 09 plusmn 005 Rolls ounce 09 plusmn 011 10 plusmn 010 09 plusmn 015 Ready-to-eat cereal cup 03 plusmn 002 05 plusmn 003 06 plusmn 004 Hot cereal prepared cup 06 plusmn 005 06 plusmn 005 07 plusmn 005 Crackers ounce 03 plusmn 002 04 plusmn 002 04 plusmn 002 Crackers saltine 33 plusmn 022 35 plusmn 022 37 plusmn 022 Pasta cup 04 plusmn 004 04 plusmn 004 05 plusmn 005 Rice cup 03 plusmn 004 04 plusmn 005 04 plusmn 005 Pancakes and waffles 1 (4-inch diameter) 10 plusmn 008 14 plusmn 021 14 plusmn 017 N = Number of respondents SE = Standard error of the mean
Source Fox et al (2006)
Page Exposure Factors Handbook 12-42 September 2011
c
Table 12-34 Percentage of Hispanic and Non-Hispanic Infants and Toddlers Consuming Different Types of Grain Products on a Given Day Age 4 to 5 months Age 6 to 11 months Age 12 to 24 months
Hispanic Non-Hispanic Hispanic Non-Hispanic Hispanic Non-Hispanic (N = 84) (N = 538) (N = 163) (N = 1228) (N = 124) (N = 871)
Any Grain or Grain Product Infant Cereal Non-infant Cereal Breadsb
Tortillas Crackers Pretzels Rice Cakes Pancakes Waffles French Toast Rice and Pastad
Rice Grains in Mixed Dishes
Sandwiches Burrito Taco Enchilada Nachos
565 552
-14c
14c
13c
------
569 565
----------
950 741 185a
182 40c
278 14c
201a
159e
159 40c
13c
935 736 292 151
-225 43
103 47
130 46 -
971 159 453 440 67a c
356 130 443
269a c
388a
242 21c
989 93
578 529 06c
469 160 329 130 544 249 30
Macaroni and Cheese - - 30c 31 101 155
Pizza - - - 14 10c e 97
Spaghetti Ravioli Lasagna - - 83c 46 93c 121 a = Significantly different from non-Hispanic at p lt 005 b Does not include bread in sandwiches Sandwiches are included in mixed dishes Includes tortillas also shown
separately = Statistic is potentially unreliable because of a high coefficient of variation
d Does not include rice or pasta in mixed dishes Includes rice (eg white brown wild and Spanish rice without meat) and pasta (eg spaghetti macaroni and egg noodles) Rice is also shown separately
e = Significantly different from non-Hispanic at p lt 001 - = Less than 1 of the group consumed this food on a given day N = Sample size
Source Mennella et al (2006)
Exposure Factors Handbook
Chapter 12mdashIntake of Grain Products
Exposure Factors Handbook Page September 2011 12-43
Exposure Factors Handbook
Chapter 12mdashIntake of Grain Products
Table 12-35 Mean Moisture Content of Selected Grain Products Expressed as Percentages of Edible Portions (grams per 100 grams of edible portion)
Food Moisture Content Comments Raw Cooked Barley―pearled 1009 6880 Corn―grain―endosperm 1037 -Corn―grain―bran 471 - crude Millet 867 7141 Oats 822 -Rice―white―long-grained 1162 6844 Rye 1095 -Rye―flour―medium 985 -Sorghum 920 -Wheat―hard white 957 -Wheat―germ 1112 - crude Wheat―bran 989 - crude Wheat―flour―whole grain 1027 -- Indicates that the grain product was not assessed for water content under these conditions
Source USDA (2007)
Page Exposure Factors Handbook 12-44 September 2011
- TABLE OF CONTENTS
- LIST OF TABLES
- 12 INTAKE OF GRAIN PRODUCTS
-
- 121 INTRODUCTION
- 122 RECOMMENDATIONS
- 123 INTAKE STUDIES
-
- 1231 Key Grain Intake Study
-
- 12311 US EPA Analysis of Consumption Data From 2003minus2006 National Health and Nutrition Examination Survey (NHANES)
-
- 1232 Relevant Grain Intake Studies
-
- 12321 USDA (1996a b 1993 1980)mdashFood and Nutrient Intakes of Individuals in 1 Day in the United States
- 12322 USDA (1999b)mdashFood Consumption Prices and Expenditures 1970minus1997
- 12323 USDA (1999a)mdashFood and Nutrient Intakes by Children 1994minus1996 1998 Table Set 17
- 12324 US EPA Analysis of Continuing Survey of Food Intake by Individuals (CSFII) 1994minus1996 1998
- 12325 Smiciklas-Wright et al (2002)mdashFoods Commonly Eaten in the United States Quantities Consumed per Eating Occasion and in a Day 1994minus1996
- 12326 Vitolins et al (2002)mdashQuality of Diets Consumed by Older Rural Adults
- 12327 Fox et al (2004)mdashFeeding Infants and Toddlers Study What Foods Are Infants and Toddlers Eating
- 12328 Ponza et al (2004)mdashNutrient Food Intakes and Food Choices of Infants and Toddlers Participating in WIC
- 12329 Fox et al (2006)mdashAverage Portion of Foods Commonly Eaten by Infants and Toddlers in the United States
- 123210 Mennella et al (2006)mdashFeeding Infants and Toddlers Study The Types of Foods Fed to Hispanic Infants and Toddlers
-
- 124 CONVERSION BETWEEN WET- AND DRY-WEIGHT INTAKE RATES
- 125 REFERENCES FOR CHAPTER 12
-

c
Table 12-30 Characteristics of Women Infants and Children (WIC) Participants and Non-Participantsa
(percentages) (continued) Infants 4 to 6 months Infants 7 to 11 months Toddlers 12 to 24 months
WIC WIC WIC Participant Non-Participant Participant Non-Participant Participant Non-Participant
Urbanicity c c c
Urban 34 55 37 50 35 48 Suburban 36 31 31 34 35 35 Rural 28 13 30 15 28 16 Missing 2 1 2 1 2 2
Sample Size (Unweighted) 265 597 351 808 205 791 a χ2 tests were conducted to test for statistical significance in the differences between WIC participants and nonshy
participants within each age group for each variable The results of χ2 tests are listed next to the variable under the column labeled non-participants for each of the three age groups
b = p lt 005 non-participants significantly different from WIC participants on the variable = p lt 001 non-participants significantly different from WIC participants on the variable
WIC = Special Supplemental Nutrition Program for Women Infants and Children
Source Ponza et al (2004)
Table 12-31 Food Choices for Infants and Toddlers by Women Infants and Children (WIC) Participation Status
Infants 4 to 6 months Infants 7 to 11 months Toddlers 12 to 24 months WIC Non- WIC Non- WIC Non-
Participant Participant Participant Participant Participant Participant 697 Infant Cereals 697 625 747 135 92
Non-infant Cereals Total 09 05 217 385a 581 560
Not Pre-sweetened 05 05 187 329a 437 363 Pre-sweetened 00 00 40 69 177 241
Grains in Combination Foods 09 01 188 147 503 529 Sample Size (unweighted) 265 597 351 808 205 791 a = p lt 001 non-participants significantly different from WIC participants WIC = Special Supplemental Nutrition Program for Women Infants and Children
Source Ponza et al (2004)
Exposure Factors Handbook
Chapter 12mdashIntake of Grain Products
Exposure Factors Handbook Page September 2011 12-41
Table 12-32 Average Portion Sizes per Eating Occasion of Grain Products Commonly Consumed by Infants From the 2002 Feeding Infants and Toddlers Study
4 to 5 months 6 to 8 months 9 to 11 months Reference Food Group (N = 624) (N = 708) (N = 687) Unit Mean plusmn SE Infant cereal dry tablespoon 31 plusmn 014 45 plusmn 014 52 plusmn 018 Infant cereal jarred tablespoon - 56 plusmn 026 74 plusmn 034 Ready-to-eat cereal tablespoon - 23 plusmn 034 34 plusmn 021 Crackers ounce - 02 plusmn 002 03 plusmn 001 Crackers saltine - 22 plusmn 014 27 plusmn 012 Bread slice - 05 plusmn 010 08 plusmn 006 - = Cell size was too small to generate a reliable estimate N = Number of respondents SE = Standard error of the mean
Source Fox et al (2006)
Exposure Factors Handbook
Chapter 12mdashIntake of Grain Products
Table 12-33 Average Portion Sizes per Eating Occasion of Grain Products Commonly Consumed by Toddlers From the 2002 Feeding Infants and Toddlers Study
Food Group Reference Unit 12 to 14 months
(N = 371) 15 to 18 months
(N = 312) 19 to 24 months (N = 320)
Mean plusmn SE Bread slice 08 plusmn 004 09 plusmn 005 09 plusmn 005 Rolls ounce 09 plusmn 011 10 plusmn 010 09 plusmn 015 Ready-to-eat cereal cup 03 plusmn 002 05 plusmn 003 06 plusmn 004 Hot cereal prepared cup 06 plusmn 005 06 plusmn 005 07 plusmn 005 Crackers ounce 03 plusmn 002 04 plusmn 002 04 plusmn 002 Crackers saltine 33 plusmn 022 35 plusmn 022 37 plusmn 022 Pasta cup 04 plusmn 004 04 plusmn 004 05 plusmn 005 Rice cup 03 plusmn 004 04 plusmn 005 04 plusmn 005 Pancakes and waffles 1 (4-inch diameter) 10 plusmn 008 14 plusmn 021 14 plusmn 017 N = Number of respondents SE = Standard error of the mean
Source Fox et al (2006)
Page Exposure Factors Handbook 12-42 September 2011
c
Table 12-34 Percentage of Hispanic and Non-Hispanic Infants and Toddlers Consuming Different Types of Grain Products on a Given Day Age 4 to 5 months Age 6 to 11 months Age 12 to 24 months
Hispanic Non-Hispanic Hispanic Non-Hispanic Hispanic Non-Hispanic (N = 84) (N = 538) (N = 163) (N = 1228) (N = 124) (N = 871)
Any Grain or Grain Product Infant Cereal Non-infant Cereal Breadsb
Tortillas Crackers Pretzels Rice Cakes Pancakes Waffles French Toast Rice and Pastad
Rice Grains in Mixed Dishes
Sandwiches Burrito Taco Enchilada Nachos
565 552
-14c
14c
13c
------
569 565
----------
950 741 185a
182 40c
278 14c
201a
159e
159 40c
13c
935 736 292 151
-225 43
103 47
130 46 -
971 159 453 440 67a c
356 130 443
269a c
388a
242 21c
989 93
578 529 06c
469 160 329 130 544 249 30
Macaroni and Cheese - - 30c 31 101 155
Pizza - - - 14 10c e 97
Spaghetti Ravioli Lasagna - - 83c 46 93c 121 a = Significantly different from non-Hispanic at p lt 005 b Does not include bread in sandwiches Sandwiches are included in mixed dishes Includes tortillas also shown
separately = Statistic is potentially unreliable because of a high coefficient of variation
d Does not include rice or pasta in mixed dishes Includes rice (eg white brown wild and Spanish rice without meat) and pasta (eg spaghetti macaroni and egg noodles) Rice is also shown separately
e = Significantly different from non-Hispanic at p lt 001 - = Less than 1 of the group consumed this food on a given day N = Sample size
Source Mennella et al (2006)
Exposure Factors Handbook
Chapter 12mdashIntake of Grain Products
Exposure Factors Handbook Page September 2011 12-43
Exposure Factors Handbook
Chapter 12mdashIntake of Grain Products
Table 12-35 Mean Moisture Content of Selected Grain Products Expressed as Percentages of Edible Portions (grams per 100 grams of edible portion)
Food Moisture Content Comments Raw Cooked Barley―pearled 1009 6880 Corn―grain―endosperm 1037 -Corn―grain―bran 471 - crude Millet 867 7141 Oats 822 -Rice―white―long-grained 1162 6844 Rye 1095 -Rye―flour―medium 985 -Sorghum 920 -Wheat―hard white 957 -Wheat―germ 1112 - crude Wheat―bran 989 - crude Wheat―flour―whole grain 1027 -- Indicates that the grain product was not assessed for water content under these conditions
Source USDA (2007)
Page Exposure Factors Handbook 12-44 September 2011
- TABLE OF CONTENTS
- LIST OF TABLES
- 12 INTAKE OF GRAIN PRODUCTS
-
- 121 INTRODUCTION
- 122 RECOMMENDATIONS
- 123 INTAKE STUDIES
-
- 1231 Key Grain Intake Study
-
- 12311 US EPA Analysis of Consumption Data From 2003minus2006 National Health and Nutrition Examination Survey (NHANES)
-
- 1232 Relevant Grain Intake Studies
-
- 12321 USDA (1996a b 1993 1980)mdashFood and Nutrient Intakes of Individuals in 1 Day in the United States
- 12322 USDA (1999b)mdashFood Consumption Prices and Expenditures 1970minus1997
- 12323 USDA (1999a)mdashFood and Nutrient Intakes by Children 1994minus1996 1998 Table Set 17
- 12324 US EPA Analysis of Continuing Survey of Food Intake by Individuals (CSFII) 1994minus1996 1998
- 12325 Smiciklas-Wright et al (2002)mdashFoods Commonly Eaten in the United States Quantities Consumed per Eating Occasion and in a Day 1994minus1996
- 12326 Vitolins et al (2002)mdashQuality of Diets Consumed by Older Rural Adults
- 12327 Fox et al (2004)mdashFeeding Infants and Toddlers Study What Foods Are Infants and Toddlers Eating
- 12328 Ponza et al (2004)mdashNutrient Food Intakes and Food Choices of Infants and Toddlers Participating in WIC
- 12329 Fox et al (2006)mdashAverage Portion of Foods Commonly Eaten by Infants and Toddlers in the United States
- 123210 Mennella et al (2006)mdashFeeding Infants and Toddlers Study The Types of Foods Fed to Hispanic Infants and Toddlers
-
- 124 CONVERSION BETWEEN WET- AND DRY-WEIGHT INTAKE RATES
- 125 REFERENCES FOR CHAPTER 12
-
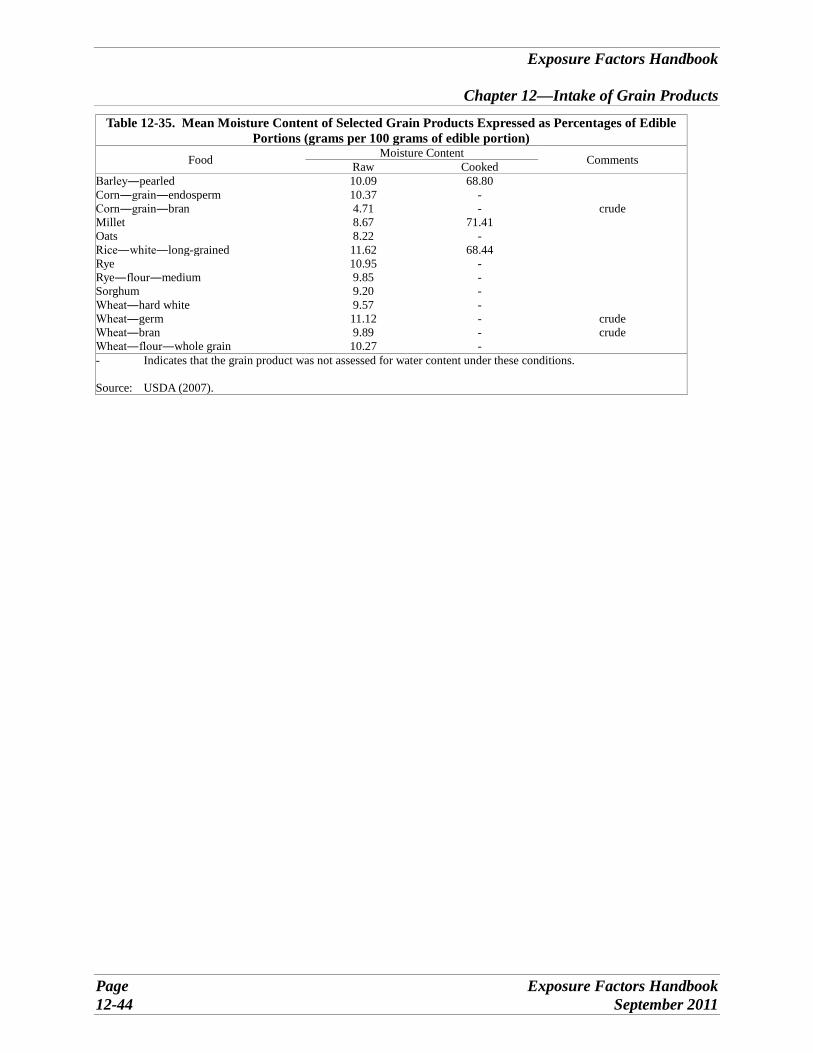