Export Marketing Assistance Service (EMAS) Project Impact ...

Export Marketing and Investment Assistance
Annual Report 2008/09

© Department of Trade and Industry, June 2010.
Reproduction is permitted, provided the source is acknowledged.
Images are courtesy of the dti Photo Library,
South African Tourism (www.southafrica.net),
Stock.Xchng (www.sxc.hu) and
Media Club South Africa (www.MediaClubSouthAfrica.com).
ISBN: 978-0-9814415-7-3
Published by the Department of Trade and Industry
Department of Trade and Industry
Private Bag X84
Pretoria
0001

Abbreviations and Acronyms ........................................................................................................................................ iv
IntroductionForeword by the Deputy Directors-General ...................................................................................................................v
EMIA Directors’ Fund Overview ................................................................................................................................... vii
EMIA ProfileVision and Mission .........................................................................................................................................................2
Strategic Objectives.......................................................................................................................................................5
Secretariat .....................................................................................................................................................................5
EMIA Success Stories 2008/09International Events .......................................................................................................................................................6
Black-Owned Enterprise ..............................................................................................................................................12
Small, Medium and Micro-Sized Enterprise ................................................................................................................13
Woman-Owned Enterprise ..........................................................................................................................................14
EMIA Performance AreasJob Creation ................................................................................................................................................................16
Governance .................................................................................................................................................................16
Strategic Impact...........................................................................................................................................................17
Customer Service ........................................................................................................................................................22
Summary of Assistance via the EMIA Scheme Summary of Assistance Provided per Scheme ...........................................................................................................24
Cost of Assistance by Sector .......................................................................................................................................24
Number of Instances of Assistance Provided per Scheme..........................................................................................25
Number of Feedback Questionnaires Received ..........................................................................................................26
Capital Projects Feasibility Programme.......................................................................................................................27
Sector-Specific Assistance Scheme ............................................................................................................................27
EMIA Contact Information............................................................................................................................................28

Exp
ort
Mar
keti
ng
an
d In
vest
men
t A
ssis
tan
ce |
Ann
ual R
epor
t 200
8/09
iv
BEE Black Economic Empowerment
BPO Business Process Outsourcing
CPFP Capital Projects Feasibility Programme
EMIA Export Marketing and Investment Assistance
FDI Foreign Direct Investment
HDI Historically Disadvantaged Individual
IDZ Industrial Development Zone
IPAP Industrial Policy Action Plan
Mercosur Mercado Común del Sur/Southern Common Market
NAFTA North American Free Trade Agreement
NEPAD New Partnership for Africa’s Development
NIPF National Industrial Policy Framework
PDIs Previously Disadvantaged Individuals
PFMA Public Finance Management Act
PMR Primary Market Research
SACU Southern African Customs Union
SADC Southern African Development Community
seda Small Enterprise Development Agency
SMMEs Small, Medium and Micro-sized Enterprises
SSAS Sector-Specific Assistance Scheme
the dti Department of Trade and Industry
TEO The Enterprise Organisation
TISA Trade and Investment South Africa
WTO World Trade Organisation

Foreword by the Deputy Directors-General The past financial year saw the Department of Trade
and Industry (the dti) continue to implement key policy
initiatives intended to support the economy’s growth
momentum of recent years, prior to the onset of the
global crisis and the resultant domestic recession.
As part of its mandate, the dti endeavoured to utilise its
trade strategy to promote the growth and development
of the economy, establishing trade and investment links
with both existing main trade partners and fast-growing
emerging markets. Efforts have continued to ensure that the
industrial policy and trade policy were mutually aligned and
co-ordinated to achieve developmental objectives. In the
context of the Doha Round of the World Trade Organisation
(WTO) negotiations, the dti’s work has focused on ensuring
a developmental outcome, notably in the industrial tariff
negotiations. In addition, a preferential trade agreement
was concluded with the Southern Common Market, or
Mercado Común del Sur (Mercosur) (Brazil, Argentina,
Paraguay and Uruguay), during December 2008, giving
South Africa a strategic foot in the door of a crucial growth
market. The implementation of this agreement should take
full effect during 2011.
In advancing regional trade integration, a Southern
African Development Community (SADC) free trade
agreement was launched in 2008, while work in the
Southern African Customs Union (SACU) entailed
continuing to build key institutional arrangements
and common policies. Efforts to promote trade and
investment saw exports increasing by 26% in 2008,
compared with a rise in imports of 22%. A more targeted
approach to export promotion was pursued, resulting
in a 44% growth in support of international efforts by
South African firms through the Export Marketing and
Investment Assistance (EMIA) scheme.
Over the course of 2008/09, the South African economy
performed relatively well in the face of a deteriorating
global climate. Even so, economic growth slowed down
significantly for the first time in a decade. This led to
a weakening in consumer and business confidence,
declining global sales and production, and a relatively
tight domestic monetary policy. This translated into
decreased export demand from major trading partners
and diminishing capital bases for fixed capital formation.
In response, the dti focused on preserving the gains
made through the implementation measures identified
in the National Industrial Policy Framework (NIPF) and
Industrial Policy Action Plan (IPAP).
the dti recognises that much industrial policy work is still
required to achieve greater productive employment and
structural transformation in key sectors of the economy,
boost growth and address the current account deficit.
With this in mind, the Department will continue, in its
capacity as co-chair of the Economic and Employment
Cluster and elsewhere, to implement key interventions
that are aimed at achieving Government’s new post-
election priorities of transforming the economy to create
decent work and sustainable livelihoods.
The importance of the EMIA scheme in achieving
these goals cannot be over-emphasised. The purpose
of assistance under this scheme is to partially
compensate exporters for costs incurred in respect
of activities aimed at developing export markets for
South African products and services, and to recruit new
foreign direct investment (FDI) into South Africa. EMIA
therefore supports the export community by offering
financial assistance through various offerings, such as
participation in National Pavilion exhibitions, individual
exhibitions, group trade missions, and so on, to actively
promote South African products in foreign markets.
During the year under review, EMIA financially assisted
more than a thousand entities with their export marketing
activities, as well as their recruitment of FDI. The cost
of this financial assistance amounted to more than
R114 million.
Like the world economy, EMIA faced several challenges
during the period under review, of which the participation
of previously disadvantaged clusters, especially black-
owned entities, remained the most significant. EMIA,
however, introduced the Emerging Exporters Scheme
to address these challenges, make the funding scheme
more accessible and increase financial support to the
previously disadvantaged exporting community, and
will continue to assess and evaluate the rules and
criteria of the scheme to ensure broader participation
across all sectors of the economy. As a result of these
measures, EMIA saw a 25,7% increase in the number of
black-owned entities assisted and a 17,6% increase in
the number of woman-owned (black and white) entities
assisted.
Further challenges include equal assistance to all
targeted economic sectors; budget and human
resources constraints; macro constraints, including
logistics and supply chains; and exporter development,
which Trade and Investment South Africa (TISA), in
co-operation with The Enterprise Organisation (TEO)
and the Small Enterprise Development Agency (seda),
will address by hosting approximately 12 workshops
annually in order to increase the exporter base.
EMIA is still the primary incentive scheme aimed at
funding export promotion and investment recruitment
marketing, and we will continue to assist South African
entities to penetrate world markets and recruit foreign
direct investment in order to create sustainable jobs and
alleviate poverty in South Africa.
IQBAL SHARMA
DEPUTY DIRECTOR-
GENERAL
TRADE AND INVESTMENT
SOUTH AFRICA
TUMELO CHIPFUPA
DEPUTY DIRECTOR-
GENERAL
THE ENTERPRISE
ORGANISATION
Exp
ort
Mar
keti
ng
an
d In
vest
men
t A
ssis
tan
ce |
Ann
ual R
epor
t 200
8/09
vi

EMIA Directors’ Fund OverviewThe past reporting year, 2008/09, has again been a
remarkable and exciting year for EMIA in terms of
assistance provided for many local and international
events, which included the World Meat Congress, China
Expos in celebration of 10 years of diplomatic relations
with South Africa, and Cape Wine 2008 (the largest to
date, with 94 foreign companies).
EMIA has greatly assisted in supporting South
African exporters to market their products at leading
international trade fairs, helping business people to
meet their counterparts, secure new exports and cement
existing export deals. In addition, the National Pavilion
Unit was awarded several prizes, including ‘Best Stand’
at the Goldfields Mining Expo 2008 and ‘Outstanding
Participation and Support’ at the Mena-Ex mining show,
2009. In general, exports generated through EMIA
support, and the overall amount of assistance granted
to firms, have increased in comparison with previous
years.
Strategically, EMIA has significantly contributed to the
drive by Government to increase South African exports.
EMIA’s direct support to industry grew by 44% in the
reporting year, as the fund overall supported more
participants than in previous years. The most assisted
sectors were multi-sectoral events, the Agro-processing
sector and the Mining and Metals sector.
Although the Mining and Metals, and the Textiles,
Clothing and Footwear sectors showed some decline,
the total export sales reported as a result of EMIA
assistance increased by 54%. Return on investment,
based on export sales achieved six months after
the event, was 1:56; that is, for every rand spent, the
return on investment was R56. This is a tremendous
achievement for the programme.
Customer service remains a priority for EMIA to ensure
that we deliver a world-class service to our customers
and meet acceptable best-practice turnaround times,
and that customer applications and claims are processed
in a professional manner. EMIA Group Support is proud
to say that, on average, a fully completed application
is still processed within 10 working days and claims
paid within 20 working days. EMIA staff also receives
continuous training on world best-practice customer
service principles.
The day-to-day management of EMIA to meet
acceptable standards of good governance and financial
accountability is still a challenging area for all managers
involved. Maintaining a high level of good corporate
governance, while also meeting the needs of our
customers and being more flexible in applying rules and
criteria, still remains a great challenge to EMIA.
It is still EMIA’s long-term vision to deliver a world-
class service to all South African exporters and we will
continue to strive to overcome the challenges and meet
the needs of our customers.
We continue to encourage South African companies to
take advantage of the EMIA programme and explore
international export markets: ‘EMIA – Bringing the World
to You’.
DONALD MABUSELA
DIRECTOR:
EXPORT MARKETING AND
INVESTMENT ASSISTANCE
CHRISTIAAN SAAIMAN
DIRECTOR:
EXPORT PROMOTION

Exp
ort
Mar
keti
ng
an
d In
vest
men
t A
ssis
tan
ce |
Ann
ual R
epor
t 200
8/09
2
Vision and MissionThe Trade and Investment South Africa (TISA) Division
of the dti is responsible for the management of the
National Pavilions and Group Inward- and Outward-
Bound Mission offerings (group participation), as these
offerings are closely linked to the activities of the Export
Promotion Directorate and informed by the customised
Sector-Specific Assistance Scheme (SSAS) of TISA.
The EMIA scheme consists of various offerings, namely:
• Individual exhibition assistance;
• Primary Market Research (PMR) and Foreign Direct
Investment (FDI) research, patent registration
included;
• Individual inward-bound mission support;
• Group missions;
• National Pavilions; and
• Sector-specific funding (Export Council and Project
Funding support).
Assistance under the EMIA scheme is to partially
compensate exporters for certain costs incurred in
respect of activities aimed at developing export markets
for South African products and services.
The organisation and funding of National Pavilions
are undertaken by the National Pavilions Unit of
EMIA, whereas the organisation of group missions
is undertaken by various stakeholders such as export
councils, provincial investment promotion agencies,
chambers of commerce and the dti. The funding of
group missions is undertaken by the Missions Unit of
EMIA.
The purpose of the SSAS is to enable the funding of
non-profit business organisations in sectors and sub-
sectors of industry prioritised by the dti, in respect of (i)
generic funding and (ii) project funding, provided that the
purpose of the organisation and/or its proposed project
aims conform to TISA’s objectives and the dti’s export
strategy.
Th
e E
nte
rpri
se O
rgan
isat
ion
sta
ff d
edic
ated
to
th
e E
MIA
sch
eme
Exp
ort
Mar
keti
ng
an
d In
vest
men
t A
ssis
tan
ce |
Ann
ual R
epor
t 200
8/09
4
Th
e T
rad
e an
d In
vest
men
t S
ou
th A
fric
a st
aff
ded
icat
ed t
o t
he
EM
IA s
chem
e
Strategic Objectives
The Enterprise Organisation (TEO)Purpose
Stimulate and facilitate the development of enterprises
through the provision of incentive measures that
support investment, job creation and regional economic
development, such as through Industrial Development
Zones (IDZs).
Measurable Objective
Efficient and effective administration of enterprise
support measures.
Trade and Investment South Africa (TISA)
Purpose
Increase South Africa’s capacity to export by developing
and implementing strategies for targeted markets.
Increase the level of direct investment flow. Effectively
manage the Department’s network of foreign offices.
Measurable Objective
Increased levels of direct investment and exports, in
aggregate and in government’s priority sectors.
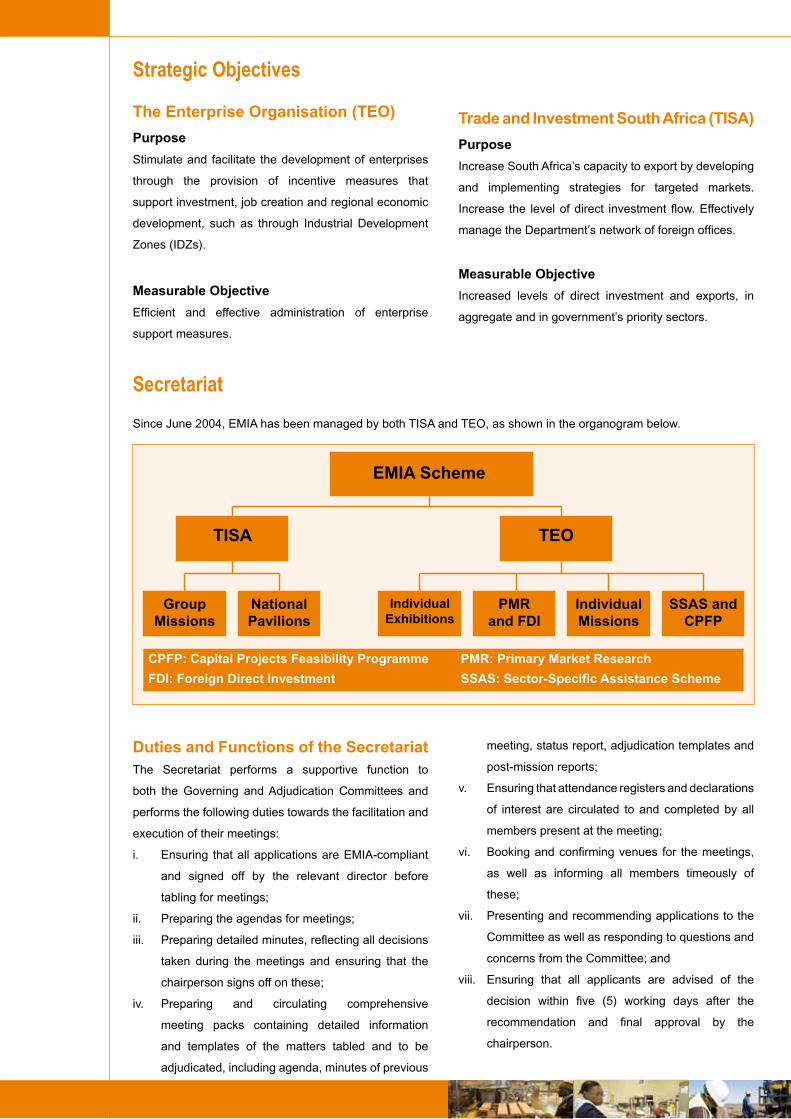
Secretariat Since June 2004, EMIA has been managed by both TISA and TEO, as shown in the organogram below.
Duties and Functions of the SecretariatThe Secretariat performs a supportive function to
both the Governing and Adjudication Committees and
performs the following duties towards the facilitation and
execution of their meetings:
i. Ensuring that all applications are EMIA-compliant
and signed off by the relevant director before
tabling for meetings;
ii. Preparing the agendas for meetings;
iii. Preparing detailed minutes, reflecting all decisions
taken during the meetings and ensuring that the
chairperson signs off on these;
iv. Preparing and circulating comprehensive
meeting packs containing detailed information
and templates of the matters tabled and to be
adjudicated, including agenda, minutes of previous
meeting, status report, adjudication templates and
post-mission reports;
v. Ensuring that attendance registers and declarations
of interest are circulated to and completed by all
members present at the meeting;
vi. Booking and confirming venues for the meetings,
as well as informing all members timeously of
these;
vii. Presenting and recommending applications to the
Committee as well as responding to questions and
concerns from the Committee; and
viii. Ensuring that all applicants are advised of the
decision within five (5) working days after the
recommendation and final approval by the
chairperson.
EMIA Scheme
TISA TEO
Individual Exhibitions
PMR and FDI
GroupMissions
National Pavilions
Individual Missions
SSAS and CPFP
CPFP: Capital Projects Feasibility Programme
FDI: Foreign Direct Investment
PMR: Primary Market Research
SSAS: Sector-Specific Assistance Scheme

Exp
ort
Mar
keti
ng
an
d In
vest
men
t A
ssis
tan
ce |
Ann
ual R
epor
t 200
8/09
6
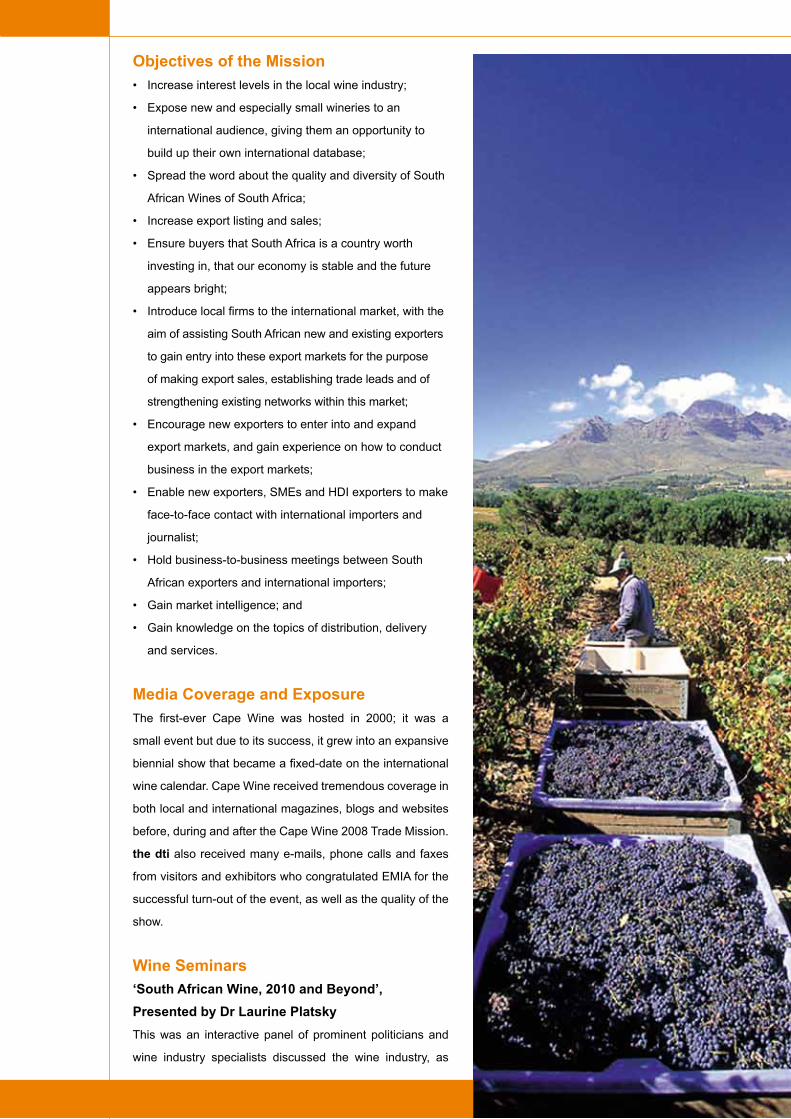
International EventsCape Wine 2008 Trade MissionMission Organiser: Wines of South Africa (WOSA)
Mission Type and Name: Inward-Buying Mission
The fifth biennial Cape Wine trade show was held at
the Cape Town International Convention, from 23 to 25
September 2008. The entire South African wine industry
enthusiastically supported Cape Wine and more than 300
wineries exhibited over 4 000 wines. This was the largest
mission ever undertaken by the dti and Wines of South
Africa (WOSA). the dti welcomed 87 participants to the
Cape Wine Mission, while wide-spread representation
was visible from the UK, the Netherlands, Switzerland,
Canada, Sweden, Finland, China, India, Japan, South
Korea, Malaysia, Africa and Latin America.
The ‘wish lists’ of WOSA’s delegates, in terms of their
preferred regions, varieties of wines, brands and price
points, and producers/members, were matched with
the list of producers seeking representation with buyers
from the various countries. Delegates were provided with
personalised itineraries, and producers were informed
about proposed visits and given background information
about the various companies in order for them to
adequately prepare for meetings.
Trade visitors and journalists from all over the world
joined in networking with the South African winemakers
and discovering the wide array of wines available.
This exciting and informative wine-tasting event also
afforded trade and media a chance to sample the unique
diversity and exceptional quality of wines emanating
from the breathtakingly beautiful Cape winelands.
The event was augmented by various seminars, which
were hosted in conjunction with several wine-tasting
initiatives. A ‘cuisine evening’, which afforded international
and local guests the opportunity to sample regional and
fusion dishes and matching local wines served by twenty
of Cape Town’s finest chefs, proved to be another highlight
of the Cape Wine Mission.
capewine2008
sponsored by
Objectives of the Mission
• Increase interest levels in the local wine industry;
• Expose new and especially small wineries to an
international audience, giving them an opportunity to
build up their own international database;
• Spread the word about the quality and diversity of South
African Wines of South Africa;
• Increase export listing and sales;
• Ensure buyers that South Africa is a country worth
investing in, that our economy is stable and the future
appears bright;
• Introduce local firms to the international market, with the
aim of assisting South African new and existing exporters
to gain entry into these export markets for the purpose
of making export sales, establishing trade leads and of
strengthening existing networks within this market;
• Encourage new exporters to enter into and expand
export markets, and gain experience on how to conduct
business in the export markets;
• Enable new exporters, SMEs and HDI exporters to make
face-to-face contact with international importers and
journalist;
• Hold business-to-business meetings between South
African exporters and international importers;
• Gain market intelligence; and
• Gain knowledge on the topics of distribution, delivery
and services.
Media Coverage and Exposure
The first-ever Cape Wine was hosted in 2000; it was a
small event but due to its success, it grew into an expansive
biennial show that became a fixed-date on the international
wine calendar. Cape Wine received tremendous coverage in
both local and international magazines, blogs and websites
before, during and after the Cape Wine 2008 Trade Mission.
the dti also received many e-mails, phone calls and faxes
from visitors and exhibitors who congratulated EMIA for the
successful turn-out of the event, as well as the quality of the
show.
Wine Seminars
‘South African Wine, 2010 and Beyond’,
Presented by Dr Laurine Platsky
This was an interactive panel of prominent politicians and
wine industry specialists discussed the wine industry, as

Exp
ort
Mar
keti
ng
an
d In
vest
men
t A
ssis
tan
ce |
Ann
ual R
epor
t 200
8/09
8
well as the political and socio-economic outlook for
South Africa for the next five years. The seminar was
well-received and helped gain confidence in South Africa
from a business point of view.
‘Cutting-Edge Terroir’,
Presented by Duimpie Bayly,
Chairman of the Wine and Spirit Delineation Board
The seminar outlined the new wards identified over the
past two years. Cutting-edge winemakers presented
wines from unique terroirs. It served to highlight South
Africa’s differences and supported the uniqueness of the
country’s wine styles. The seminar showed how much
South Africa’s winemakers have progressed over the last
15 years.
‘Red, White and Rainbow’,
Presented by Lynne Sherriff (MW)
This seminar showed the new generation of winemakers
and their different styles in winemaking. Each winemaker
presented the wines which embody their personal
philosophy. This reflected the change in the South
African wine industry and immense progress made in
the country in terms of transformation. The seminar was
used as a platform to provide much-needed exposure to
the country’s first black and coloured winemakers.
‘Red, White and Going Green’,
Chaired by Bruce Jack
A leading viticulturist discussed the future of organic and
biodynamic wines in South Africa. A panel of winemakers
introduced a tasting of their organic and biodynamic
wines. Internationally, supermarkets internationally are
under pressure to show their commitment towards the
environment and this seminar made it clear to them that
South Africa was a global leader with which to recon in
the protection of the environment. It also showed them
the wide array of wines South Africa had to offer to
organic buyers.
‘The Champions Concept’,
Presented by Inge Kotze (BWI)
Producers such as Graham Beck, Delheim and
Vergelegen, who all have champion status in the
Biodiversity & Wine Initiative, demonstrated the unique
synergy between their wine, biodiversity, terroir,
sustainability and conservation. Discussions were held on
the significant increase in foreign investment in the wine
industry over the last two years. Leading international
wine executives explained why they have chosen to
invest in South Africa and what their vision is for their
South African brands. This seminar clearly showed that
the international icons are interested in South Africa and
that they are wiling to invest in South Africa.
‘Vintage Pinotage Styles from South Africa’,
Presented by Beyers Truter
The seminar proved that South Africa was capable of
making wines of the highest quality. Some of the vintage
bottles revealed during the seminar dated back to early
1960. Pinotage is South Africa’s unique wine grape
variety.
Market Intelligence Gained
• Accessibility/trade barriers: Information on wine label
requirements and costing, adherence to strict rules
for the exporting of wines, export duties, etc.;
• Competitors: Information on how to compete against
the ‘New World’ (Australia, Chile and Argentina) and
‘Old World’ (France) and adapt marketing strategies
accordingly, as well as combine berry flavours of the
New World with the elegance of the Old World;
• Import restrictions;
• Product needs/demands;
• Pricing: Information on how South African
winemakers can compete at the entry level of the
market, due to their being costly (owing to high
interest rates, making the cost of capital expensive,
the high cost of land and labour concerns, the lack of
government subsidies for wine farmers);
• Customer base: Information on how South Africa can
reach its main markets, with minimal expense;
• Supplier base: Information on how to grow an
existing supplier/exporter base; and
• EMIA administration process: Information on how
the EMIA scheme is managed, how exporters can
make optimal use of the scheme and its offerings, to
increase their exports and turn-over.
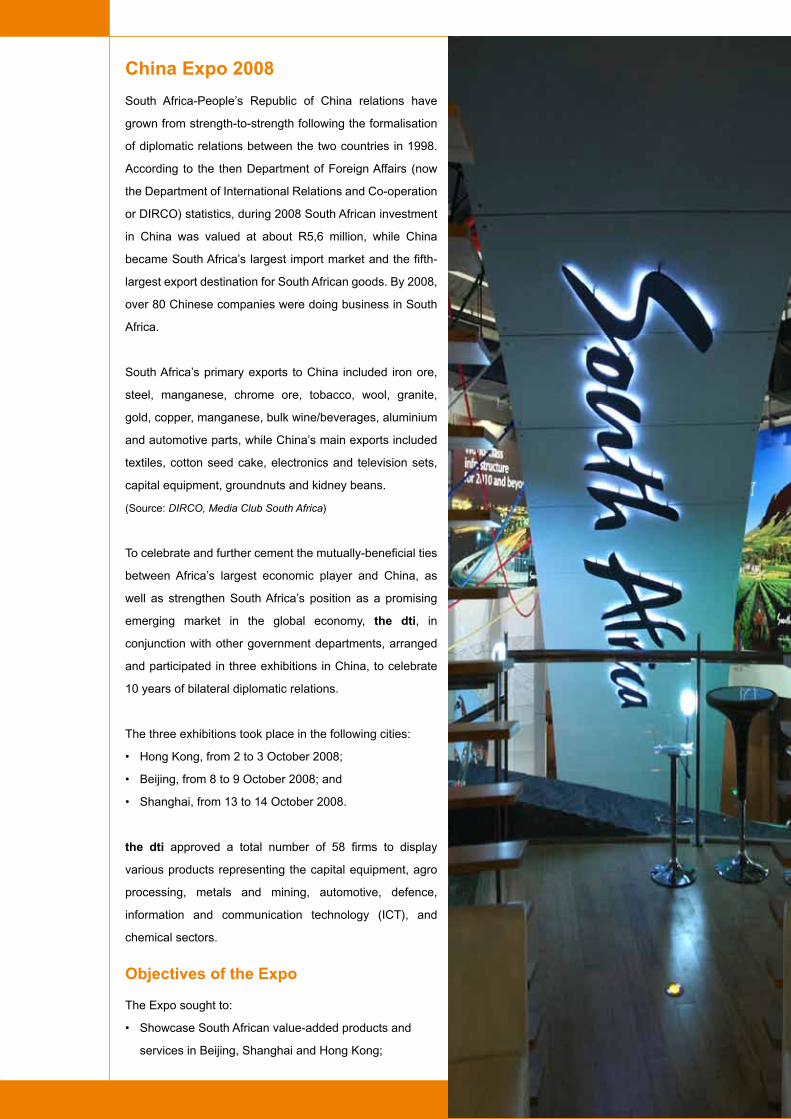
China Expo 2008
South Africa-People’s Republic of China relations have
grown from strength-to-strength following the formalisation
of diplomatic relations between the two countries in 1998.
According to the then Department of Foreign Affairs (now
the Department of International Relations and Co-operation
or DIRCO) statistics, during 2008 South African investment
in China was valued at about R5,6 million, while China
became South Africa’s largest import market and the fifth-
largest export destination for South African goods. By 2008,
over 80 Chinese companies were doing business in South
Africa.
South Africa’s primary exports to China included iron ore,
steel, manganese, chrome ore, tobacco, wool, granite,
gold, copper, manganese, bulk wine/beverages, aluminium
and automotive parts, while China’s main exports included
textiles, cotton seed cake, electronics and television sets,
capital equipment, groundnuts and kidney beans.
(Source: DIRCO, Media Club South Africa)
To celebrate and further cement the mutually-beneficial ties
between Africa’s largest economic player and China, as
well as strengthen South Africa’s position as a promising
emerging market in the global economy, the dti, in
conjunction with other government departments, arranged
and participated in three exhibitions in China, to celebrate
10 years of bilateral diplomatic relations.
The three exhibitions took place in the following cities:
• Hong Kong, from 2 to 3 October 2008;
• Beijing, from 8 to 9 October 2008; and
• Shanghai, from 13 to 14 October 2008.
the dti approved a total number of 58 firms to display
various products representing the capital equipment, agro
processing, metals and mining, automotive, defence,
information and communication technology (ICT), and
chemical sectors.
Objectives of the Expo
The Expo sought to:
• Showcase South African value-added products and
services in Beijing, Shanghai and Hong Kong;

Exp
ort
Mar
keti
ng
an
d In
vest
men
t A
ssis
tan
ce |
Ann
ual R
epor
t 200
8/09
10
• Create awareness of South Africa’s goods and
services;
• Sell South Africa’s technology advancements and
innovations, mining, defence technology, agro-
processing advancements, and arts and culture
capabilities, as well as market South Africa as a
prime tourist destination;
• Increase exports to the Asia region;
• Enhance Chinese direct investment in South Africa;
• Promote and increase joint ventures between South
African and Chinese firms; and
• Enable South African firms to take advantage of
export opportunities in the Chinese market.
Media Coverage and Exposure
At least 15 international media houses, providing both
print and electronic media coverage for this event, were
present at the Expo. The national broadcaster, the South
African Broadcasting Corporation (SABC), profiled the
Beijing and Hong Kong Expos on television and radio.
Highlights of the Expo
The China Expo included investment and wine-tasting
seminars, as well as cultural performances and food-
tasting events.
A number of Provincial Investment Promotion Agencies
such as Western Cape Investment and Trade Promotion
Agency, Eastern Cape Development Corporation, Invest
North West, Mpumalanga Economic Growth Agency,
Trade and Investment KwaZulu-Natal and Trade and
Investment Limpopo not only exhibited at these events
but also participated in the investment seminars, which
were hosted in each of the cities.
The previous Minister of Trade and Industry, Mandisi
Mpahlwa, and the then Deputy Minister (now Minister),
Dr Rob Davies, delivered the exhibition opening
addresses in the various cities. The Ambassador and
Consul-Generals based in these cities, and their Chinese
counterparts, also attended these events.
The South African National Expo in Beijing attracted
more than 4 900 visitors to the exhibition, while 210
participants attended the investment promotion
seminars. The South African National Expo in Hong
Kong attracted more than 2 500 visitors to the exhibition,
while 65 participants attended the investment promotion
seminars.
The South African National Expo in Shanghai attracted
more than 8 098 visitors to the exhibition, on average
147 visitors per stand, which resulted in the collection
of 193 trade leads. The exhibitors reported that an
estimated R2,352 million of deals and orders were signed
during these events, while the orders for the following
12 months were estimated at R503 million.

Exp
ort
Mar
keti
ng
an
d In
vest
men
t A
ssis
tan
ce |
Ann
ual R
epor
t 200
8/09
12
Black-Owned Enterprise
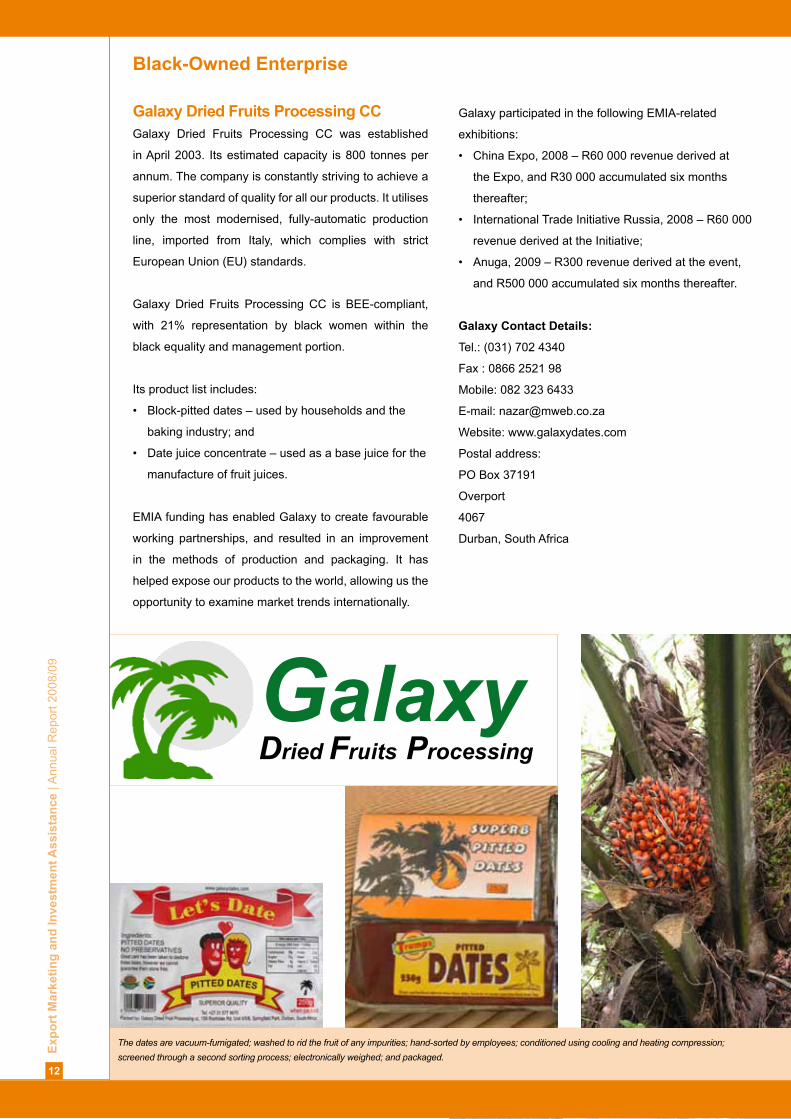
Galaxy Dried Fruits Processing CCGalaxy Dried Fruits Processing CC was established
in April 2003. Its estimated capacity is 800 tonnes per
annum. The company is constantly striving to achieve a
superior standard of quality for all our products. It utilises
only the most modernised, fully-automatic production
line, imported from Italy, which complies with strict
European Union (EU) standards.
Galaxy Dried Fruits Processing CC is BEE-compliant,
with 21% representation by black women within the
black equality and management portion.
Its product list includes:
• Block-pitted dates – used by households and the
baking industry; and
• Date juice concentrate – used as a base juice for the
manufacture of fruit juices.
EMIA funding has enabled Galaxy to create favourable
working partnerships, and resulted in an improvement
in the methods of production and packaging. It has
helped expose our products to the world, allowing us the
opportunity to examine market trends internationally.
Galaxy participated in the following EMIA-related
exhibitions:
• China Expo, 2008 – R60 000 revenue derived at
the Expo, and R30 000 accumulated six months
thereafter;
• International Trade Initiative Russia, 2008 – R60 000
revenue derived at the Initiative;
• Anuga, 2009 – R300 revenue derived at the event,
and R500 000 accumulated six months thereafter.
Galaxy Contact Details:
Tel.: (031) 702 4340
Fax : 0866 2521 98
Mobile: 082 323 6433
E-mail: [email protected]
Website: www.galaxydates.com
Postal address:
PO Box 37191
Overport
4067
Durban, South Africa
The dates are vacuum-fumigated; washed to rid the fruit of any impurities; hand-sorted by employees; conditioned using cooling and heating compression;
screened through a second sorting process; electronically weighed; and packaged.
GalaxyDried Fruits Processing

Small, Medium and Micro-sized Enterprise
AfriplexAfriplex, established in 2001, produces essential oils,
powders, tinctures, and other plant and liquid extracts
unique to South Africa. The company specialises in
providing high-quality plant extracts for food, beverage,
pharmaceutical, cosmetic and other industries. Due
to the diversity of its clients’ needs, Afriplex produces
extracts in many different forms, each allowing the client
to derive the greatest benefit and satisfaction for the
intended purpose.
Afriplex participated in a number of EMIA-funded shows,
including the following:
• Outward-Investment and Selling Trade Missions; and
• National Pavilions.
EMIA funding has not only increased Afriplex’s exposure
to a wider spectrum of customers, but it has also
augmented the number of orders, from an average of
two orders per month to six.
Afriplex Contact Details:
Tel.: +27 (021) 872 4976
Fax:+27 (021) 872 4930
E-mail: [email protected]
Postal address:
PO Box 3186
Paarl
7620
South Africa
The coconut shell-like Baobab fruit contains
many seeds, from which a natural fruit powder
is extracted. This powder is used in food and
drink products. Baobab fruit is high in anti-
oxidants and is fast becoming a staple in many
South African and international diets.
Afriplex extracts plant and
liquid extracts from Africa’s
indigenous plants. The company
is environmentally-conscious, and
provides national and international
clients with innovative, cost effective,
natural products for the nutritional and
neutraceutical markets.
The above value-added Rooibos beauty and
health products were derived from the plant’s
natural oils.

Exp
ort
Mar
keti
ng
an
d In
vest
men
t A
ssis
tan
ce |
Ann
ual R
epor
t 200
8/09
14
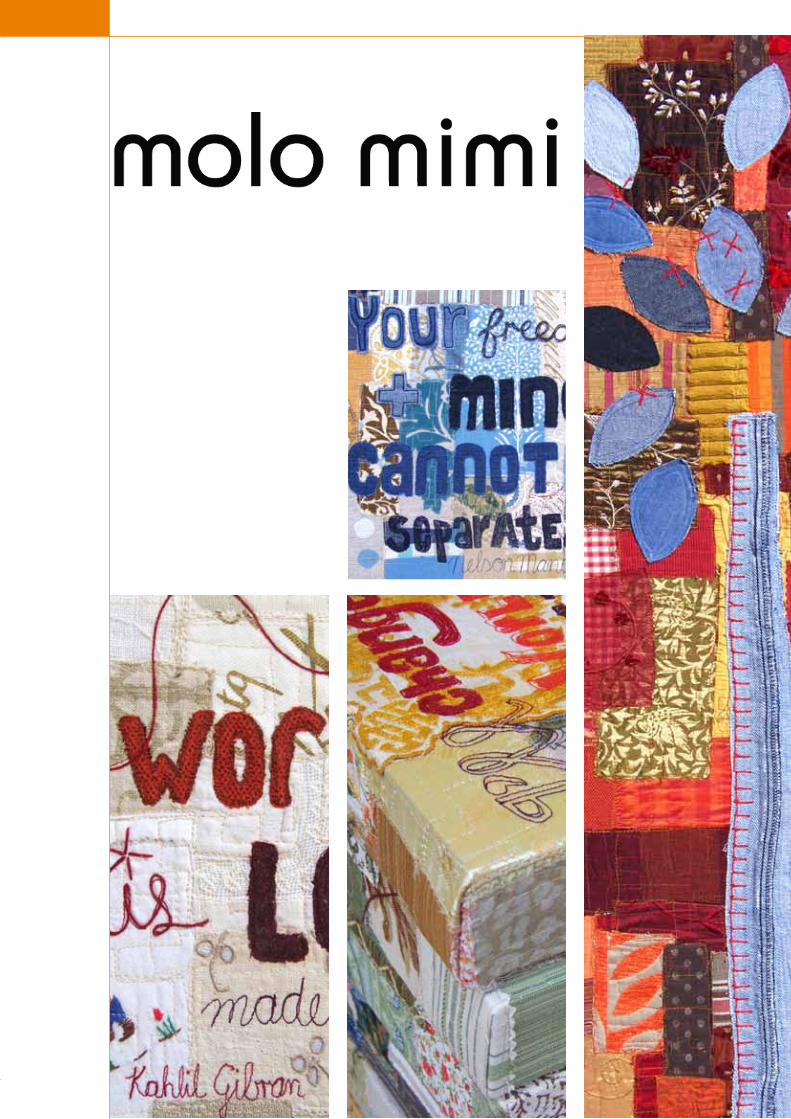
molo mimi was established by Lisa Nettelton as a Close
Corporation (CC) in early 2008. molo mimi is situated in Port
Alfred, in the Eastern Cape province of South Africa. After
completing a course in free stitch and with her grandmother’s
Bernina sewing machine, Lisa Nettelton began creating
‘Fibre Art’ in early 2007 using recycled fabrics.
Thabisa Kameni, a former domestic worker, was keen to
learn to sew and quickly learnt this technique, leading to
her employment at molo mimi and the development of
her own unique sewing methods. A year later, Sibongile
Manyati, a tailor, joined the team. Lisa Nettelton and her
team share a dynamic and supportive bond, resulting in
a work environment that uplifts, inspires and motivates
them to produce innovative threads which have a
multitude of applications and are constantly unravelling.
This technique is referred to as ‘free-stitch’.
All fabrics used by molo mimi are collected off-cuts,
which would otherwise have been discarded. The
fabrics are shredded, using a rotor blade or are cut
into specific shapes. Mohair, wool and the various
threads incorporated are donated from scraps and
excess fabric. The traditional technique of sewing
has thus been deconstructed, with fabrics being torn,
randomly positioned and meandering stitching. The
fabrics are stretched over wooden frames to create
‘Fibre Art’. The fabrics can also be used for upholstery,
cushions, lampshades, the applications are extensive.
Recently, molo mimi developed a new fabric called
threads, from which it has created lamp shades over
two-litre plastic bottles, disguising both the bottle and
the less attractive energy-saving bulbs. The threads
are developed into small works of art, which can be
framed as desired, with the advantage of being flat-
packed, allowing for easier, more cost-effective postage
and opened-up new market channels. Small ‘thread
messages’ have also been created using glass tumblers
and a t-light. These can be personalised and are perfect
for weddings and corporate gifts.
molo mimi participated in a number of EMIA-funded
shows, including the following:
• Decorex Johannesburg, SA Handmade Collection
(Provincial Stand), 2008 and 2009;
• Decorex Cape Town, SA Handmade Collection,
2009; and
• Ambiente, Frankfurt, Germany, SA Handmade
Collection, 2009.
Without the assistance of EMIA funds, which enabled
molo mimi’s participation in various trade shows, both
locally and abroad, molo mimi would not be where it is
today. According to Lisa Nettelton, these trade shows
have offered the CC the opportunity to reach new
markets, obtain orders, network, collaborate and gather
information about the market at large. The feedback
collected at the shows has also permitted molo mimi to
design and create new products based on the information
received. Repeat exhibiting at shows and the continued
support of EMIA funding has given the CC consistent
exposure, thereby increasing the confidence and support
of the buyer. We attribute our success to this strategy as
sales and orders have increased exponentially.
The export sector has been particularly successful and
has doubled in the past year. Increased revenue has
offered us the opportunity to employ a third seamstress
as our participation and the exposure in such trade
shows continues to allow us to expand.
molo mimi’s focus is ‘green’ and as such, the CC is
continually working on new recycling options for its
business. Integrity is key to its approach on creativity
and its business acumen.
molo mimi Contact Details:
Lisa Nettelton
36 van der Riet Street
PO Box 339
Port Alfred
6170
Mobile: 082 409 8447
Tel.: 046 624 5722
E-mail: [email protected]
Website: www.molomimi.com
Woman-Owned Enterprise
Exp
ort
Mar
keti
ng
an
d In
vest
men
t A
ssis
tan
ce |
Ann
ual R
epor
t 200
8/09
16
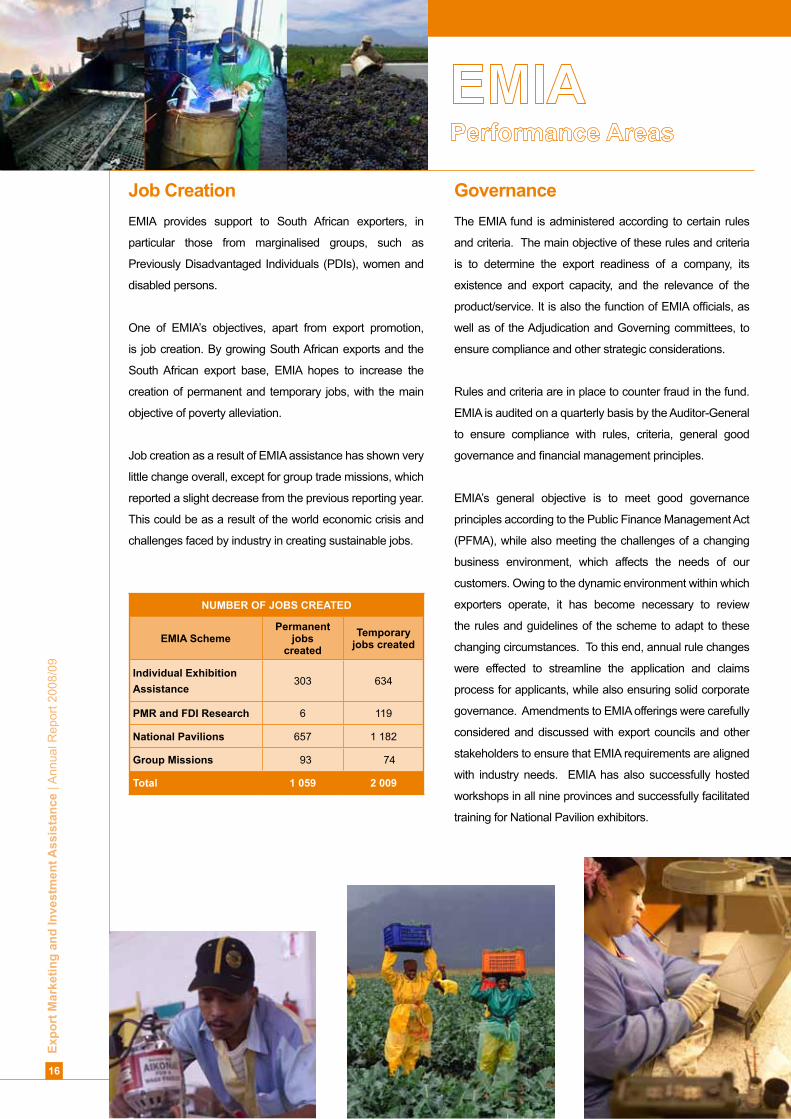
Job Creation
EMIA provides support to South African exporters, in
particular those from marginalised groups, such as
Previously Disadvantaged Individuals (PDIs), women and
disabled persons.
One of EMIA’s objectives, apart from export promotion,
is job creation. By growing South African exports and the
South African export base, EMIA hopes to increase the
creation of permanent and temporary jobs, with the main
objective of poverty alleviation.
Job creation as a result of EMIA assistance has shown very
little change overall, except for group trade missions, which
reported a slight decrease from the previous reporting year.
This could be as a result of the world economic crisis and
challenges faced by industry in creating sustainable jobs.
NUMBER OF JOBS CREATED
EMIA SchemePermanent
jobscreated
Temporary jobs created
Individual Exhibition
Assistance303 634
PMR and FDI Research 6 119
National Pavilions 657 1 182
Group Missions 93 74
Total 1 059 2 009
Governance
The EMIA fund is administered according to certain rules
and criteria. The main objective of these rules and criteria
is to determine the export readiness of a company, its
existence and export capacity, and the relevance of the
product/service. It is also the function of EMIA officials, as
well as of the Adjudication and Governing committees, to
ensure compliance and other strategic considerations.
Rules and criteria are in place to counter fraud in the fund.
EMIA is audited on a quarterly basis by the Auditor-General
to ensure compliance with rules, criteria, general good
governance and financial management principles.
EMIA’s general objective is to meet good governance
principles according to the Public Finance Management Act
(PFMA), while also meeting the challenges of a changing
business environment, which affects the needs of our
customers. Owing to the dynamic environment within which
exporters operate, it has become necessary to review
the rules and guidelines of the scheme to adapt to these
changing circumstances. To this end, annual rule changes
were effected to streamline the application and claims
process for applicants, while also ensuring solid corporate
governance. Amendments to EMIA offerings were carefully
considered and discussed with export councils and other
stakeholders to ensure that EMIA requirements are aligned
with industry needs. EMIA has also successfully hosted
workshops in all nine provinces and successfully facilitated
training for National Pavilion exhibitors.

Strategic Impact
EXPORT SALES ACHIEVED AT EVENTS, BY REGION (in rands)
RegionIndividual
ExhibitionsPMR and FDI
National
Pavilions
Group
MissionsTotal
Africa/Middle East 27 406 291 0 10 327 630 3 010 000 40 743 921
Asia East 404 330 592 800 12 465 100 4 134 966 17 597 196
Asia West 1 508 320 0 861 230 1 600 000 3 969 550
Europe 1 153 343 286 60 567 14 993 600 1 540 000 169 937 453
Europe 2 42 553 769 95 000 61 143 748 2 910 000 106 702 517
Latin American Countries
2 503 500 0 6 560 0 2 510 060
NAFTA 4 907 768 0 68 685 423 215 000 73 808 191
Total 232 627 264 748 367 168 483 291 13 409 966 415 268 888
Notes: Export sales at events as a result of EMIA assistance declined by 273% in this reporting cycle, but this could be attributed to the R1,2 billion contract that
was signed at the International Foundry Trade Fair GIFA/Newcast National Pavilion during the previous financial year. In general, all target regions have
shown decreases in export sales at events; however, Europe 1 and 2 have shown some stability, whereas the North American Free Trade Agreement
(NAFTA) has shown the biggest increase. Europe is still the best-performing export region.
1%4%10%
18%
26%40%
1%
Africa/Middle East
Asia East
Asia
Europe 1
Europe 2
Latin American countries
NAFTA
EXPORT SALES ACHIEVED BY REGION AT EVENTSEMIA
1%0%
1%2%
12%
66%
18%
Africa/Middle East
Asia East
Asia
Europe 1
Europe 2
Latin American countries
NAFTA
EXPORT SALES ACHIEVED BY REGION AT EVENTSINDIVIDUAL EXHIBITIONS
41%
13%
8%
79%
Asia East
Europe 1
Europe 2
EXPORT SALES ACHIEVED BY REGION AT EVENTSPMR
7%1%
9%
0%36%
Africa/Middle East
Asia East
Asia
Europe 1
Europe 2
Latin American countries
NAFTA
EXPORT SALES ACHIEVED BY REGION AT EVENTSNATIONAL PAVILIONS
6%
22%22%
2%
31%
11%
12%
Africa/Middle East
Asia East
Asia
Europe 1
Europe 2
Latin American countries
NAFTA
EXPORT SALES ACHIEVED BY REGION AT EVENTSMISSIONS
0%

Exp
ort
Mar
keti
ng
an
d In
vest
men
t A
ssis
tan
ce |
Ann
ual R
epor
t 200
8/09
18
EXPORT SALES ACHIEVED BY REGION, SIX MONTHS AFTER EVENTS (in rands)
RegionIndividual
ExhibitionsPMR and FDI
National
Pavilions
Group
MissionsTotal
Africa/Middle East 241 375 133 1 976 000 1 152 531 459 3 203 811 1 399 086 403
Asia East 33 777 730 20 000 589 924 921 1 200 000 624 922 651
Asia West 32 717 679 5 474 480 486 366 500 000 513 709 519
Europe 1 391 758 388 179 965 1 497 117 896 340 810 000 2 229 866 249
Europe 2 114 395 223 18 520 000 715 375 738 923 986 849 214 947
Latin American Countries 14 121 711 0 78 135 891 0 92 257 602
NAFTA 83 123 964 0 174 167 273 525 000 257 816 237
Total 911 269 828 20 701 439 4 687 739 544 347 162 797 5 966 873 608
Notes: Export sales reported six months after events as a result of EMIA assistance have shown an increase of 77%, with regions such as Africa/the
Middle East, Europe and Asia showing the largest increase in export sales. The National Pavilion offering seems to be the driver of most of these
sales. (Export sales after events are estimated export sales for the ensuing 12 months as a result of EMIA participation.)
23%
10%
14%2% 4%
38% 9%
Africa/Middle East
Africa/Middle East
Asia East
Asia East
Asia West
Asia West
Europe 1
Europe 1
Europe 2
Latin American countries
Latin American countries
NAFTA
NAFTA
EXPORT SALES ACHIEVED BY REGION SIX MONTHS AFTER EVENTSEMIA
4%
4%
2% 9%
26%
42%
13%
Africa/Middle East
Asia East
Asia West
Europe 1
Europe 2
Latin American countries
NAFTA
EXPORT SALES ACHIEVED BY REGION SIX MONTHS AFTER EVENTSINDIVIDUAL EXHIBITIONS
EXPORT SALES ACHIEVED BY REGION SIX MONTHS AFTER EVENTSPMR
EXPORT SALES ACHIEVED BY REGION SIX MONTHS AFTER EVENTSNATIONAL PAVILIONS
1%0%0%
10%
89%
EXPORT SALES ACHIEVED BY REGION SIX MONTHS AFTER EVENTSMISSIONS
25%15%
4%
13%
10%
33%
Africa/Middle East
Asia East
Asia
Europe 1
Europe 2
Latin American countries
NAFTA
0%
0%0%
0%0%
1%
99%
Africa/Middle East
Asia East
Asia West
Europe 1
Europe 2
NAFTA

EXPORT SALES BY PROVINCE (in rands)
ProvinceIndividual
ExhibitionsPMR and FDI
National
Pavilions
Group
MissionsTotal
Eastern Cape 6 392 909 20 000 221 382 075 0 227 794 984
Free State 2 092 139 0 25 500 0 2 117 639
Gauteng 170 498 942 2 046 474 2 378 157 701 340 257 797 2 890 960 914
KwaZulu-Natal 184 702 365 30 000 86 850 545 620 000 272 202 910
Limpopo 0 0 12 868 314 0 12 868 314
Mpumalanga 1 318 829 0 198 032 230 0 199 351 059
North West 9 840 000 0 1 381 460 0 11 221 460
Northern Cape 0 0 900 000 0 900 000
Western Cape 769 051 908 19 353 332 1 956 625 010 19 694 966 2 764 725 216
Total 1 143 897 092 21 449 806 4 856 222 835 360 572 763 6 382 142 496
Notes: Gauteng and the Western Cape reported the highest total export sales, with the Western Cape as the province showing the highest export growth,
followed by Gauteng, Mpumalanga and the Eastern Cape. The last two could be attributed to EMIA’s continued efforts to promote the fund in these
historically disadvantaged provinces.
46%
43%
4%0%3%
0%0%
Eastern Cape
Free State
Gauteng
KwaZulu-Natal
Limpopo
Mpumalanga
North West
Northern Cape
Western Cape
Eastern Cape
Free State
Gauteng
KwaZulu-Natal
Limpopo
Mpumalanga
North West
Northern Cape
Western Cape
Eastern Cape
Free State
Gauteng
KwaZulu-Natal
Limpopo
Mpumalanga
North West
Northern Cape
Western Cape
Gauteng
KwaZulu-Natal
Western Cape
Eastern Cape
Gauteng
Western Cape
EXPORT SALES BY PROVINCEEMIA
0%
0%
1%
16%
15%
67%
1% 0%
EXPORT SALES BY PROVINCEINDIVIDUAL EXHIBITORS
EXPORT SALES BY PROVINCEPMR
EXPORT SALES BY PROVINCENATIONAL PAVILIONS
0%
4%
20%
0%
32%
48%
EXPORT SALES BY PROVINCEGROUP MISSIONS
5%
40%
49%
2%
0%
0%
0%
4%
0%
5%
95%

Exp
ort
Mar
keti
ng
an
d In
vest
men
t A
ssis
tan
ce |
Ann
ual R
epor
t 200
8/09
20
EXPORT SALES ACHIEVED AT EVENTS, BY REGION (in rands)
RegionIndividual
ExhibitionsPMR and FDI
National
Pavilions
Group
MissionsTotal
Africa/Middle East 27 406 291 0 10 327 630 3 010 000 40 743 921
Asia East 404 330 592 800 12 465 100 4 134 966 17 597 196
Asia West 1 508 320 0 861 230 1 600 000 3 969 550
Europe 1 153 343 286 60 567 14 993 600 1 540 000 169 937 453
Europe 2 42 553 769 95 000 61 143 748 2 910 000 106 702 517
Latin American Countries
2 503 500 0 6 560 0 2 510 060
NAFTA 4 907 768 0 68 685 423 215 000 73 808 191
Total 232 627 264 748 367 168 483 291 13 409 966 415 268 888
Notes: Export sales at events as a result of EMIA assistance declined by 273% in this reporting cycle, but this could be attributed to the R1,2 billion contract that
was signed at the International Foundry Trade Fair GIFA/Newcast National Pavilion during the previous financial year. In general, all target regions have
shown decreases in export sales at events; however, Europe 1 and 2 have shown some stability, whereas the North American Free Trade Agreement
(NAFTA) has shown the biggest increase. Europe is still the best-performing export region.
1%4%10%
18%
26%40%
1%
Africa/Middle East
Asia East
Asia
Europe 1
Europe 2
Latin American countries
NAFTA
EXPORT SALES ACHIEVED BY REGION AT EVENTSEMIA
1%0%
1%2%
12%
66%
18%
Africa/Middle East
Asia East
Asia
Europe 1
Europe 2
Latin American countries
NAFTA
EXPORT SALES ACHIEVED BY REGION AT EVENTSINDIVIDUAL EXHIBITIONS
41%
13%
8%
79%
Asia East
Europe 1
Europe 2
EXPORT SALES ACHIEVED BY REGION AT EVENTSPMR
7%1%
9%
0%36%
Africa/Middle East
Asia East
Asia
Europe 1
Europe 2
Latin American countries
NAFTA
EXPORT SALES ACHIEVED BY REGION AT EVENTSNATIONAL PAVILIONS
6%
22%22%
2%
31%
11%
12%
Africa/Middle East
Asia East
Asia
Europe 1
Europe 2
Latin American countries
NAFTA
EXPORT SALES ACHIEVED BY REGION AT EVENTSMISSIONS
0%

EXPORT SALES PER SECTOR (in rands)
SectorsIndividual
ExhibitionsPMR and FDI
National
Pavilions
Group
MissionsTotal
Agro-Processing 506 191 151 612 800 2 183 050 116 18 563 986 2 708 418 053
Aerospace, Rail and Marine 3 860 596 0 1 669 542 174 0 1 673 402 770
Automotive 1 892 900 0 166 215 597 500 000 168 608 497
Chemicals 22 002 815 2 231 532 0 500 000 24 734 347
Cultural Industries 35 774 988 18 500 000 863 252 3 794 966 58 933 206
ICT and Electronics 205 822 900 50 000 11 300 381 500 000 217 673 281
Mining and Metals 212 387 648 5 474 782 059 474 4 703 811 999 156 407
Textiles, Clothing and Footwear 155 934 094 20 000 0 0 155 954 094
Tourism 0 0 0 1 610 000 1 610 000
Other 30 000 30 000 43 191 841 330 400 000 373 651 841
Total 1 143 897 092 21 449 806 4 856 222 835 360 572 763 6 382 142 496
Notes: Export sales reported six months after events as a result of EMIA assistance have shown an increase of 77%, with regions such as Africa/the
Middle East, Europe and Asia showing the largest increase in export sales. The National Pavilion offering seems to be the driver of most of these
sales. (Export sales after events are estimated export sales for the ensuing 12 months as a result of EMIA participation.)
6%
16%
2%
26%
43%
3%
3%
0%
0%
1%
Agro-Processing
Agro-Processing
Aero-Space, Rail & Marine
Automotive
Chemicals
Chemicals
Cultural Industries
Cultural Industries
ICT & Electronics
Mining & Metals
Textiles, Clothing & Footwear
Tourism
Other
Agro-Processing
Aero-Space, Rail & Marine
Automotive
Chemicals
Cultural Industries
ICT & Electronics
Mining & Metals
Textiles, Clothing & Footwear
Tourism
Other
SALES EXPORTS PER SECTOREMIA
SALES EXPORTS PER SECTORINDIVIDUAL EXHIBITIONS
10%
3%
87%
SALES EXPORTS PER SECTORPMR
19%
18%14%
44%
0%
0%
1% 0%3%
Agro-Processing
Aero-Space, Rail & Marine
Automotive
Chemicals
Cultural Industries
ICT & Electronics
Mining & Metals
Textiles, Clothing & Footwear
Other
SALES EXPORTS PER SECTORNATIONAL PAVILIONS
0%0%
1%
18%0%0%0%
34%
0%
0%
1%
46%
3%
Agro-Processing
Aero-Space, Rail & Marine
Automotive
Chemicals
Cultural Industries
ICT & Electronics
Mining & Metals
Textiles, Clothing & Footwear
Tourism
Other
SALES EXPORTS PER SECTORMISSIONS
0%0%
0%0%
0%1%5%
93%

Exp
ort
Mar
keti
ng
an
d In
vest
men
t A
ssis
tan
ce |
Ann
ual R
epor
t 200
8/09
22
Notes: Although only the Aerospace, Rail and Marine and the Textiles, Clothing and Footwear sectors did not report on any export sales, the percentages
of export sales reported by most of the other sectors were insignificant compared with those of the Other (Multi-sectoral), Agro-processing,
Cultural Industries and Mining and Metals sectors, and are therefore displayed as 0%. It should further be noted that multi-sectoral missions
make up the bulk of group trade missions funded by EMIA.
Customer Service
Customer service is another of EMIA’s key performance
areas. In this regard, EMIA has committed to the
following timelines in processing applications and claims:
• EMIA will provide a letter of acknowledgement to all
applicants and claimants within 48 working hours of
receipt of the application/claim.
• EMIA aims at a turnaround time of fifteen (15)
working days for the processing of and decision on a
complete application.
• Applicants will be informed of the final outcome of an
application within five (5) working days of the date of
an Adjudication Committee meeting.
• All telephone calls and e-mails will be answered
within 24 hours.
• EMIA aims at a turnaround time of twenty (20)
working days for the processing of and decision on a
complete claim.
• EMIA will supply a notification of approval/rejection
within twenty (20) working days of a claim being
submitted to EMIA.
• There should be a turnaround time of nine (9)
working days after approval notification for payment
to be effected.
A total of 79% of EMIA customers rated our customer service levels as ‘Good’ or ‘Excellent’.
During the reporting period, EMIA Group Offerings (TISA) conducted 144 customer surveys in order to determine and
manage customer service levels in the unit. EMIA customers were contacted by telephone and asked to rate EMIA
service levels as: Excellent, Good, Satisfactory, Poor or Very Poor. The results were as follows:
Excellent
Good
Satisfactory
Poor
Very Poor
0%4%17%
60%
19%
Exp
ort
Mar
keti
ng
an
d In
vest
men
t A
ssis
tan
ce |
Ann
ual R
epor
t 200
8/09
24
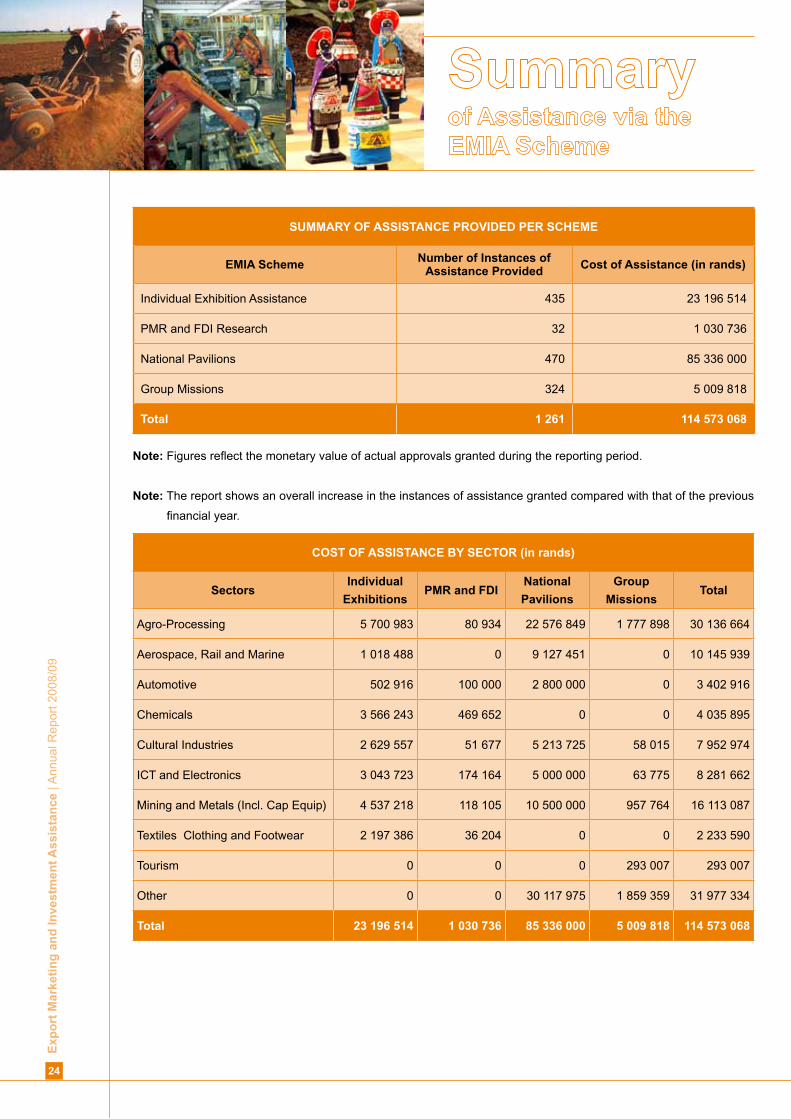
SUMMARY OF ASSISTANCE PROVIDED PER SCHEME
EMIA Scheme Number of Instances of Assistance Provided Cost of Assistance (in rands)
Individual Exhibition Assistance 435 23 196 514
PMR and FDI Research 32 1 030 736
National Pavilions 470 85 336 000
Group Missions 324 5 009 818
Total 1 261 114 573 068
Note: Figures reflect the monetary value of actual approvals granted during the reporting period.
Note: The report shows an overall increase in the instances of assistance granted compared with that of the previous
financial year.
COST OF ASSISTANCE BY SECTOR (in rands)
SectorsIndividual
ExhibitionsPMR and FDI
National
Pavilions
Group
MissionsTotal
Agro-Processing 5 700 983 80 934 22 576 849 1 777 898 30 136 664
Aerospace, Rail and Marine 1 018 488 0 9 127 451 0 10 145 939
Automotive 502 916 100 000 2 800 000 0 3 402 916
Chemicals 3 566 243 469 652 0 0 4 035 895
Cultural Industries 2 629 557 51 677 5 213 725 58 015 7 952 974
ICT and Electronics 3 043 723 174 164 5 000 000 63 775 8 281 662
Mining and Metals (Incl. Cap Equip) 4 537 218 118 105 10 500 000 957 764 16 113 087
Textiles Clothing and Footwear 2 197 386 36 204 0 0 2 233 590
Tourism 0 0 0 293 007 293 007
Other 0 0 30 117 975 1 859 359 31 977 334
Total 23 196 514 1 030 736 85 336 000 5 009 818 114 573 068
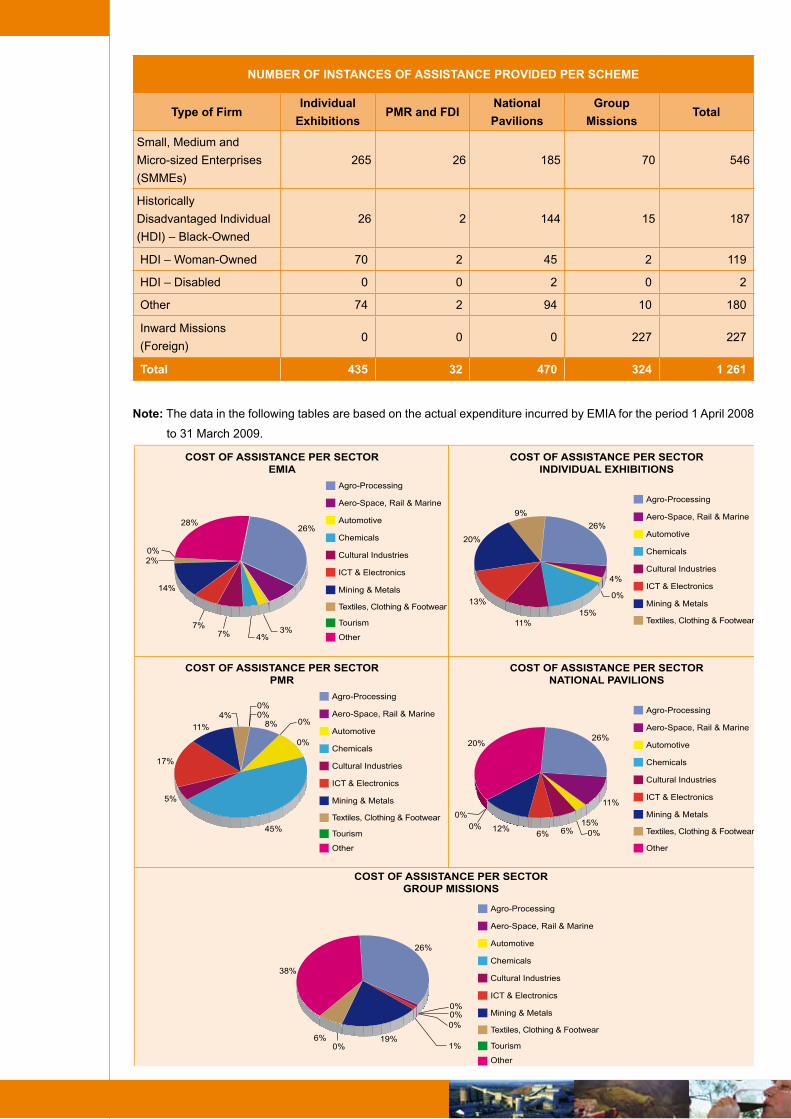
NUMBER OF INSTANCES OF ASSISTANCE PROVIDED PER SCHEME
Type of FirmIndividual
ExhibitionsPMR and FDI
National
Pavilions
Group
MissionsTotal
Small, Medium and
Micro-sized Enterprises
(SMMEs)
265 26 185 70 546
Historically
Disadvantaged Individual
(HDI) – Black-Owned
26 2 144 15 187
HDI – Woman-Owned 70 2 45 2 119
HDI – Disabled 0 0 2 0 2
Other 74 2 94 10 180
Inward Missions
(Foreign)0 0 0 227 227
Total 435 32 470 324 1 261
Note: The data in the following tables are based on the actual expenditure incurred by EMIA for the period 1 April 2008
to 31 March 2009.
28%
7% 3%4%
26%
14%
7%
0%2%
Agro-Processing
Aero-Space, Rail & Marine
Automotive
Chemicals
Cultural Industries
ICT & Electronics
Mining & Metals
Textiles, Clothing & Footwear
Tourism
Other
COST OF ASSISTANCE PER SECTOREMIA
COST OF ASSISTANCE PER SECTORINDIVIDUAL EXHIBITIONS
26%
9%
20%
15%11%
13%
4%
0%
Agro-Processing
Aero-Space, Rail & Marine
Automotive
Chemicals
Cultural Industries
ICT & Electronics
Mining & Metals
Textiles, Clothing & Footwear
Agro-Processing
Aero-Space, Rail & Marine
Automotive
Chemicals
Cultural Industries
ICT & Electronics
Mining & Metals
Textiles, Clothing & Footwear
Tourism
Other
COST OF ASSISTANCE PER SECTORGROUP MISSIONS
0%0%0%
0%6%
38%
1%
26%
19%
11%
45%
0%
8% 0%4%
0%0%
5%
17%
Agro-Processing
Aero-Space, Rail & Marine
Automotive
Chemicals
Cultural Industries
ICT & Electronics
Mining & Metals
Textiles, Clothing & Footwear
Tourism
Other Other
COST OF ASSISTANCE PER SECTORPMR
COST OF ASSISTANCE PER SECTORNATIONAL PAVILIONS
26%20%
0%
0% 15%0%6%6%
12%
11%
Agro-Processing
Aero-Space, Rail & Marine
Automotive
Chemicals
Cultural Industries
ICT & Electronics
Mining & Metals
Textiles, Clothing & Footwear
Exp
ort
Mar
keti
ng
an
d In
vest
men
t A
ssis
tan
ce |
Ann
ual R
epor
t 200
8/09
26
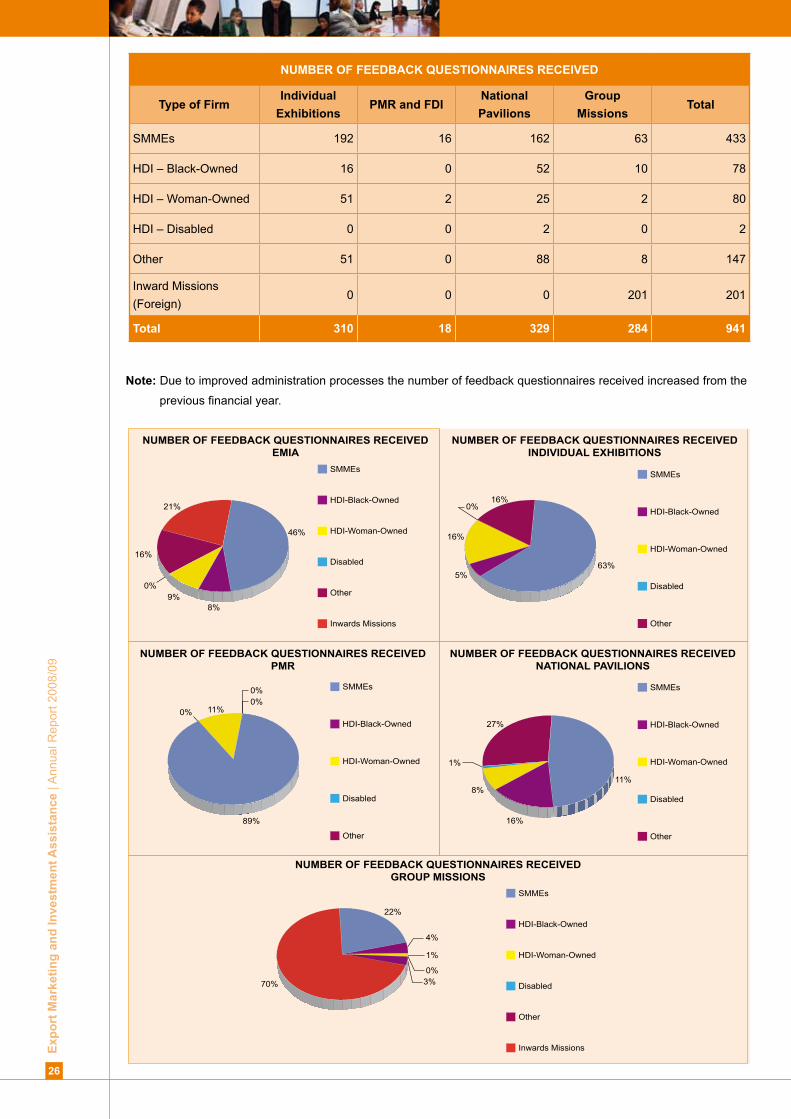
NUMBER OF FEEDBACK QUESTIONNAIRES RECEIVED
Type of FirmIndividual
ExhibitionsPMR and FDI
National
Pavilions
Group
MissionsTotal
SMMEs 192 16 162 63 433
HDI – Black-Owned 16 0 52 10 78
HDI – Woman-Owned 51 2 25 2 80
HDI – Disabled 0 0 2 0 2
Other 51 0 88 8 147
Inward Missions
(Foreign)0 0 0 201 201
Total 310 18 329 284 941
21%
9%8%
46%
16%
0%
SMMEs
HDI-Black-Owned
HDI-Woman-Owned
Disabled
Other
Inwards Missions
SMMEs
HDI-Black-Owned
HDI-Woman-Owned
Disabled
Other
Inwards Missions
SMMEs
HDI-Black-Owned
HDI-Woman-Owned
Disabled
Other
SMMEs
HDI-Black-Owned
HDI-Woman-Owned
Disabled
Other
SMMEs
HDI-Black-Owned
HDI-Woman-Owned
Disabled
Other
NUMBER OF FEEDBACK QUESTIONNAIRES RECEIVED EMIA
NUMBER OF FEEDBACK QUESTIONNAIRES RECEIVEDINDIVIDUAL EXHIBITIONS
63%
16%
16%
5%
0%
NUMBER OF FEEDBACK QUESTIONNAIRES RECEIVEDGROUP MISSIONS
70% 3%0%
1%
4%
22%
11%
89%
0%0%
0%
NUMBER OF FEEDBACK QUESTIONNAIRES RECEIVEDPMR
NUMBER OF FEEDBACK QUESTIONNAIRES RECEIVEDNATIONAL PAVILIONS
1%
8%
16%
27%
11%
Note: Due to improved administration processes the number of feedback questionnaires received increased from the
previous financial year.
Capital Projects Feasibility Programme
The primary objective of the Capital Projects Feasibility
Programme (CPFP) is to facilitate feasibility studies
likely to lead to projects that will increase South African
exports and stimulate growth for the local Capital Goods
and Services sector and allied industries.
The secondary objectives of the programme are to:
• Attract higher levels of domestic and foreign
investment;
• Strengthen the international competitiveness of
South African business;
• Create jobs in South Africa;
• Stimulate projects development in Africa, and
in particular the Southern African Development
Community (SADC) countries, and support the
objectives of the New Partnership for Africa’s
Development (NEPAD);
• Promote linkages with and the development of
SMMEs and BEE businesses.
During the 2008/09 financial year, four projects located
in Oman, Lesotho, Uganda and Mozambique were
approved to the value of R14,991,798.
Sector-Specific Assistance Scheme
The purpose of the Sector-Specific Assistance Scheme
(SSAS) is to enable the funding of non-profit business
organisations in sectors and sub-sectors of industry
prioritised by the dti, in respect of (i) generic funding,
and (ii) project funding, provided that the purpose of the
organisation and/or its proposed project aims conform to
TISA’s objectives and those of the dti’s export strategy.
SCHEME Number of Projects Total (in rands)
CPFP 4 14 991 798
SSAS 21 14 122 516
Total 25 29 114 314

Exp
ort
Mar
keti
ng
an
d In
vest
men
t A
ssis
tan
ce |
Ann
ual R
epor
t 200
8/09
28
Programmes: National Pavilions and Group Trade Missions
Please submit all documents to Trade and Investment South Africa in person, or by registered mail or courier.
the dti
EMIA Division
Building A: Ground Floor
77 Meintjies Street
Sunnyside
Pretoria
0002
Manager Responsibility Area Telephone No. Fax No.
Christiaan Saaiman Director (012) 394 1021
(012) 394 1019
(012) 394 0114/7
Koos Janse van Rensburg National Pavilions (012) 394 1029 (012) 394 0114/7
Corné du Plessis Group Trade Missions (012) 394 1020 (012) 394 0114/7
Normelia Mashele Claims (012) 394 1146 (012) 394 0114/7
Complaints should be directed to Christiaan Saaiman:
Tel.: (012) 394 1021/1019
Fax: (012) 394 0114/7
E-mail: [email protected]
Programmes: Individual Exhibitions; Primary Market Research; Foreign Direct
Investment Research; Individual Missions; Sector-Specific Assistance Scheme;
Capital Projects Feasibility Programme; and Co-operative Incentive Scheme
Please submit all documents to The Enterprise Organisation in person or by registered mail or courier.
Manager Responsibility Area Telephone No. Fax No.
Donald Mabusela Director (012) 394 1716 (012) 394 2716
Mangi Kekana Individual Exhibitions (012) 394 1044 (012) 394 2044
James Koko SSAS and CPFP Applications and Claims (012) 394 1037 (012) 394 2037
Sue Joubert General Enquiries (012) 394 1014 (012) 394 2014
Complaints should be directed to Donald Mabusela:
Tel.: (012) 394 1716
Fax: (012) 394 2716
E-mail: [email protected]

the dti Customer Contact Centre
International: +27 12 394 9500
National: 0861 843 384
the dti Website: www.thedti.gov.za
the dti Postal Address
Private Bag X84
Pretoria
0001
the dti Physical Address
77 Meintjies Street
Sunnyside
Pretoria
0002