Exponential Time Decay Constants of Marimba Bars · Exponential Time Decay Constants of Marimba...
8
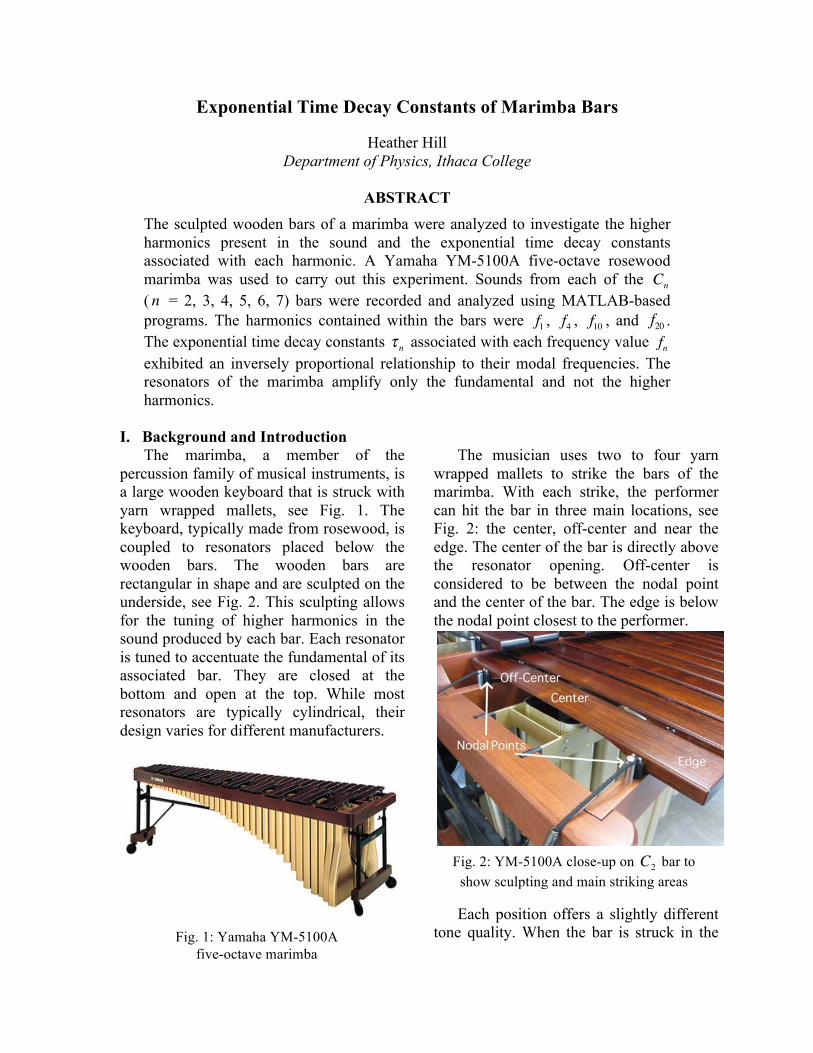
Exponential Time Decay Constants of Marimba Bars Heather Hill Department of Physics, Ithaca College ABSTRACT The sculpted wooden bars of a marimba were analyzed to investigate the higher harmonics present in the sound and the exponential time decay constants associated with each harmonic. A Yamaha YM-5100A five-octave rosewood marimba was used to carry out this experiment. Sounds from each of the C n ( n = 2, 3, 4, 5, 6, 7) bars were recorded and analyzed using MATLAB-based programs. The harmonics contained within the bars were f 1 , f 4 , f 10 , and f 20 . The exponential time decay constants τ n associated with each frequency value f n exhibited an inversely proportional relationship to their modal frequencies. The resonators of the marimba amplify only the fundamental and not the higher harmonics. I. Background and Introduction The marimba, a member of the percussion family of musical instruments, is a large wooden keyboard that is struck with yarn wrapped mallets, see Fig. 1. The keyboard, typically made from rosewood, is coupled to resonators placed below the wooden bars. The wooden bars are rectangular in shape and are sculpted on the underside, see Fig. 2. This sculpting allows for the tuning of higher harmonics in the sound produced by each bar. Each resonator is tuned to accentuate the fundamental of its associated bar. They are closed at the bottom and open at the top. While most resonators are typically cylindrical, their design varies for different manufacturers. The musician uses two to four yarn wrapped mallets to strike the bars of the marimba. With each strike, the performer can hit the bar in three main locations, see Fig. 2: the center, off-center and near the edge. The center of the bar is directly above the resonator opening. Off-center is considered to be between the nodal point and the center of the bar. The edge is below the nodal point closest to the performer. Each position offers a slightly different tone quality. When the bar is struck in the Fig. 1: Yamaha YM-5100A five-octave marimba Fig. 2: YM-5100A close-up on C 2 bar to show sculpting and main striking areas
Transcript of Exponential Time Decay Constants of Marimba Bars · Exponential Time Decay Constants of Marimba...
Exponential Time Decay Constants of Marimba Bars
Heather Hill Department of Physics, Ithaca College
ABSTRACT
The sculpted wooden bars of a marimba were analyzed to investigate the higher harmonics present in the sound and the exponential time decay constants associated with each harmonic. A Yamaha YM-5100A five-octave rosewood marimba was used to carry out this experiment. Sounds from each of the Cn ( n = 2, 3, 4, 5, 6, 7) bars were recorded and analyzed using MATLAB-based programs. The harmonics contained within the bars were f1 , f4 , f10 , and f20 . The exponential time decay constants τ n associated with each frequency value fn exhibited an inversely proportional relationship to their modal frequencies. The resonators of the marimba amplify only the fundamental and not the higher harmonics.
I. Background and Introduction The marimba, a member of the percussion family of musical instruments, is a large wooden keyboard that is struck with yarn wrapped mallets, see Fig. 1. The keyboard, typically made from rosewood, is coupled to resonators placed below the wooden bars. The wooden bars are rectangular in shape and are sculpted on the underside, see Fig. 2. This sculpting allows for the tuning of higher harmonics in the sound produced by each bar. Each resonator is tuned to accentuate the fundamental of its associated bar. They are closed at the bottom and open at the top. While most resonators are typically cylindrical, their design varies for different manufacturers.
The musician uses two to four yarn wrapped mallets to strike the bars of the marimba. With each strike, the performer can hit the bar in three main locations, see Fig. 2: the center, off-center and near the edge. The center of the bar is directly above the resonator opening. Off-center is considered to be between the nodal point and the center of the bar. The edge is below the nodal point closest to the performer.
Each position offers a slightly different tone quality. When the bar is struck in the Fig. 1: Yamaha YM-5100A
five-octave marimba
Fig. 2: YM-5100A close-up on C2 bar to show sculpting and main striking areas
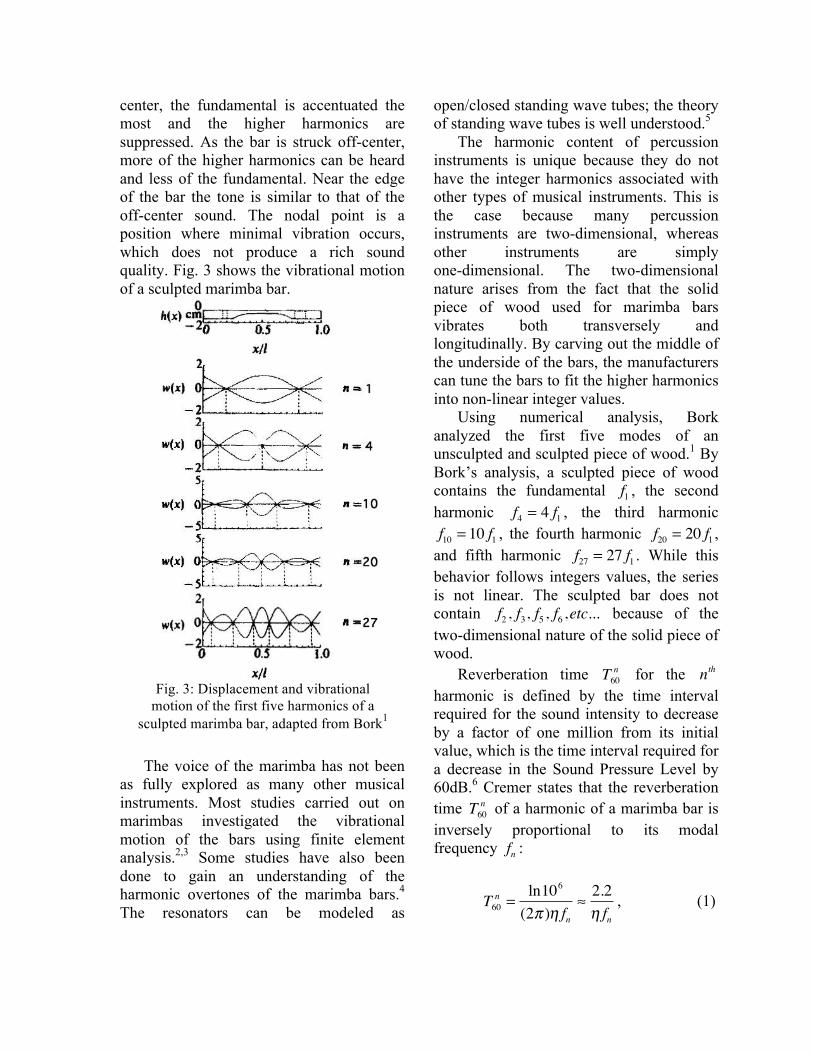
center, the fundamental is accentuated the most and the higher harmonics are suppressed. As the bar is struck off-center, more of the higher harmonics can be heard and less of the fundamental. Near the edge of the bar the tone is similar to that of the off-center sound. The nodal point is a position where minimal vibration occurs, which does not produce a rich sound quality. Fig. 3 shows the vibrational motion of a sculpted marimba bar.
The voice of the marimba has not been as fully explored as many other musical instruments. Most studies carried out on marimbas investigated the vibrational motion of the bars using finite element analysis.2,3 Some studies have also been done to gain an understanding of the harmonic overtones of the marimba bars.4 The resonators can be modeled as
open/closed standing wave tubes; the theory of standing wave tubes is well understood.5 The harmonic content of percussion instruments is unique because they do not have the integer harmonics associated with other types of musical instruments. This is the case because many percussion instruments are two-dimensional, whereas other instruments are simply one-dimensional. The two-dimensional nature arises from the fact that the solid piece of wood used for marimba bars vibrates both transversely and longitudinally. By carving out the middle of the underside of the bars, the manufacturers can tune the bars to fit the higher harmonics into non-linear integer values. Using numerical analysis, Bork analyzed the first five modes of an unsculpted and sculpted piece of wood.1 By Bork’s analysis, a sculpted piece of wood contains the fundamental f1 , the second harmonic f4 = 4 f1 , the third harmonic f10 = 10 f1 , the fourth harmonic f20 = 20 f1 ,
and fifth harmonic f27 = 27 f1 . While this behavior follows integers values, the series is not linear. The sculpted bar does not contain f2 , f3, f5 , f6 ,etc... because of the two-dimensional nature of the solid piece of wood. Reverberation time T60
n for the nth harmonic is defined by the time interval required for the sound intensity to decrease by a factor of one million from its initial value, which is the time interval required for a decrease in the Sound Pressure Level by 60dB.6 Cremer states that the reverberation time T60
n of a harmonic of a marimba bar is inversely proportional to its modal frequency fn :
T60n =
ln106
(2π )η fn≈2.2η fn
, (1)
Fig. 3: Displacement and vibrational motion of the first five harmonics of a
sculpted marimba bar, adapted from Bork1
whereη is the ratio of the imaginary to the real part of the complex elastic modulus.7 The value of η is associated with the absorptive properties of the wooden bar and is expected to be frequency independent for small amplitude vibrations.
As a follow-up to Bork’s and Cremer’s research, I was interested in seeing if both relationships held true in my personal marimba, a Yamaha YM-5100A. II. Method A Yamaha YM-5100A was used for this experiment. It includes a five-octave range from C2 to C7 (65.5 to 2118.0 Hz respectively). Each Cn (n = 2, 3, 4, 5, 6, 7) bar was struck with a Malletech GS-13 mallet (general hardness) using a moderate velocity and force stroke. Each bar was struck with as much consistency as possible. Each bar was struck in three locations: the center, off-center below the upper node and on the bottom edge, see Fig. 2. Sounds from each Cn bar were recorded with and without the resonators on the instrument. A Behringer ECM 8000 condenser microphone and a 24-bit Marantz PMD671 digital recorder were used to record the sounds with a 44.1kHz sampling rate. The microphone was placed above the bar being struck. It was angled down at a 45 degree angle and set about one foot above each Cn bar. The resulting .wav file was processed using the MATLAB Wav_Analysis.m program, written by a previous REU student, Joe Yasi8, and updated by myself. This program was used to fit the harmonic frequencies for each .wav file. The ratios between harmonics from Bork’s analysis were used to determine which frequencies to analyze. Only the first four harmonics were processed due to the increased difficulty analyzing the higher-order harmonics. From the processed data, the
fitted frequency values for each harmonic were compiled. Using Microsoft Excel, the compiled frequencies were further analyzed determine their inharmonicities, i.e. the degree of variance from predicted values of each bar. Marimba_4_Harmonic_Studies_NoDec.m, written by Professor Steven Errede, used the fitted frequency values as input to obtain exponential decay fits to each harmonic present in the .wav file. With the fitted frequencies for f1 , f4 , f10 , and f20 declared in the program, it used digital filters to separate the sound into four frequency bands centered on each harmonic. The program fit decaying exponentials to the envelope within a 0.5 second window designated by the user. The slope and y-intercept values and their statistical uncertainties were then compiled into a Microsoft Excel spreadsheet with their associated frequencies. The fitted slope value given by the program is the exponential time decay constant τ n for each harmonic. Once the data was compiled into Excel, plots were made showing the exponential time decay constants τ n versus the frequency for each harmonic. In addition, plots were made to show the effect of the resonators on the time decay constants and a compilation was made of all time decay constants τ n versus their frequencies with and without resonators. The effect of the resonators is due to its open/closed construction. Because of this open/closed design, the resonators only amplify odd integer harmonics.5 The speed of sound propagation in air can be described as the relationship between the frequency fn and the wavelength λn :
v = fnλn . (2)
From (2) and knowing that n = 1,3,5,7... ,
λn =4Lnodd
, (3)
where L is the length of the resonator. For each bar, the resonator length is fixed. Only the fundamental is amplified by the resonator. This is because the higher harmonics of marimba bars are even integer harmonics, where n = 4,10,20 . These even integer harmonics will not couple with an open/closed resonator because of its odd integer harmonic spectrum. The exponential time decay constant τ n is directly related to the reverberation time T60
n .6 T60
n = 2T30n = ln103τ n (4)
From (4) it is possible to solve (1) for η in terms of τ n :
η ≡ℑm YE{ }ℜe YE{ } =
2ωnτ n
=1
πτ n fn (5)
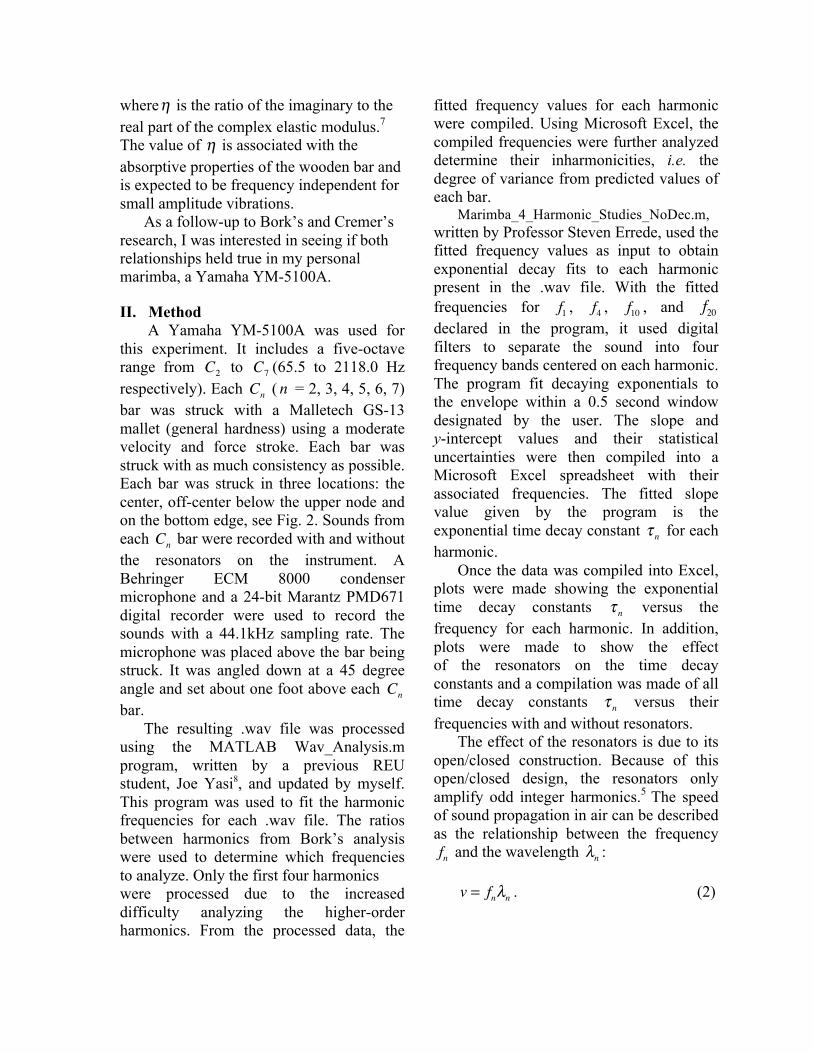
From (5) the values of η were calculated for each Cn bar frequency in the three different locations without the resonators on the instrument. This data was compiled using Microsoft Excel. III. Results and Discussion To test Bork’s claim that the marimba bars would have f1 , f4 , f10 , and f20 , the fitted frequencies from Wav_Analysis.m were analyzed in Microsoft Excel. Ratios were calculated in relation the first harmonic. For example, the second harmonic ratio was f4 : f1 . The results of these calculations are shown in Fig. 4. The second harmonic ratio is consistent with the value of four. The third harmonic ratio is in good agreement with the value of ten. The fourth harmonic ratio is between nineteen and twenty. As the Cn bar values increased, it became increasingly difficult to analyze the higher harmonics above the fundamental; hence only two bars could be analyzed at the fourth harmonic. The fifth harmonic mentioned by Bork was observed in the raw data, but was extremely weak. The inharmonicity of the marimba bar is
Fig. 4: Graph of frequency ratios for the first four harmonics of the marimba bar
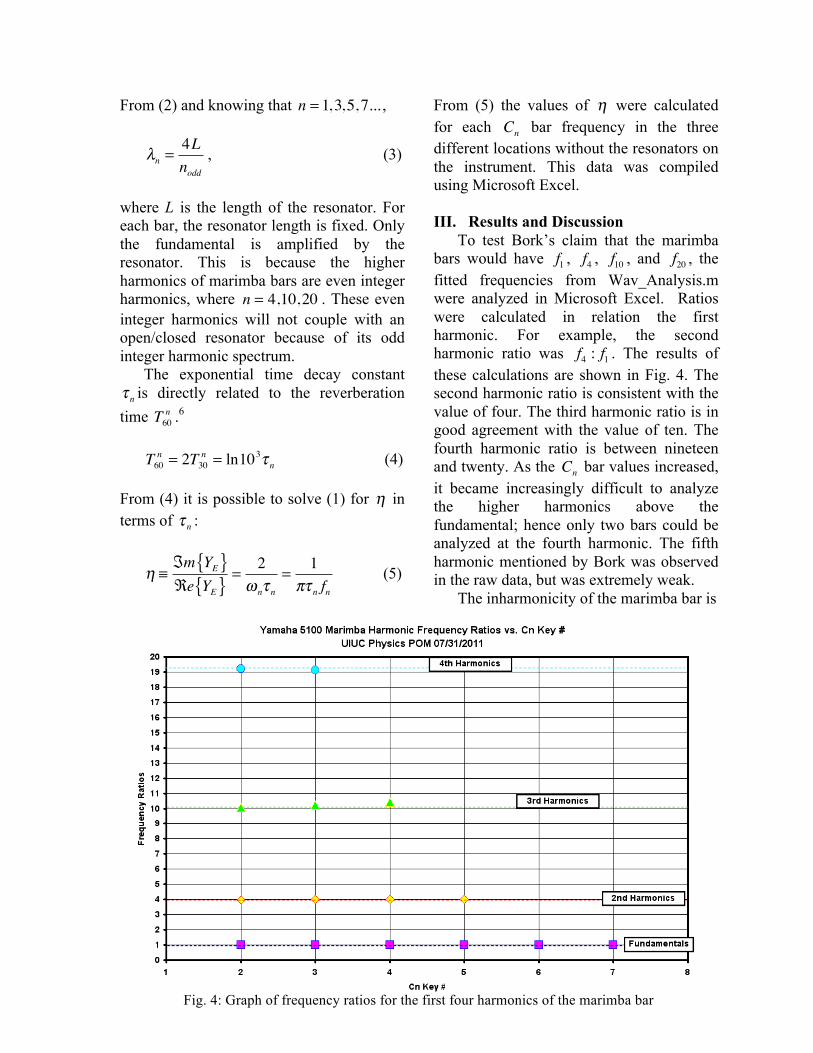
based on the absolute values expected to be present in the sound. The frequency ratios were compared to the absolute values 1, 4, 10, and 20 respectively for each harmonic. The percentage of inharmonicity was then graphed in Fig. 5. The second harmonics are only off by about 1% from the predicted value suggesting that they are easier to tune than the third and fourth harmonics that vary up to about 4.5% from
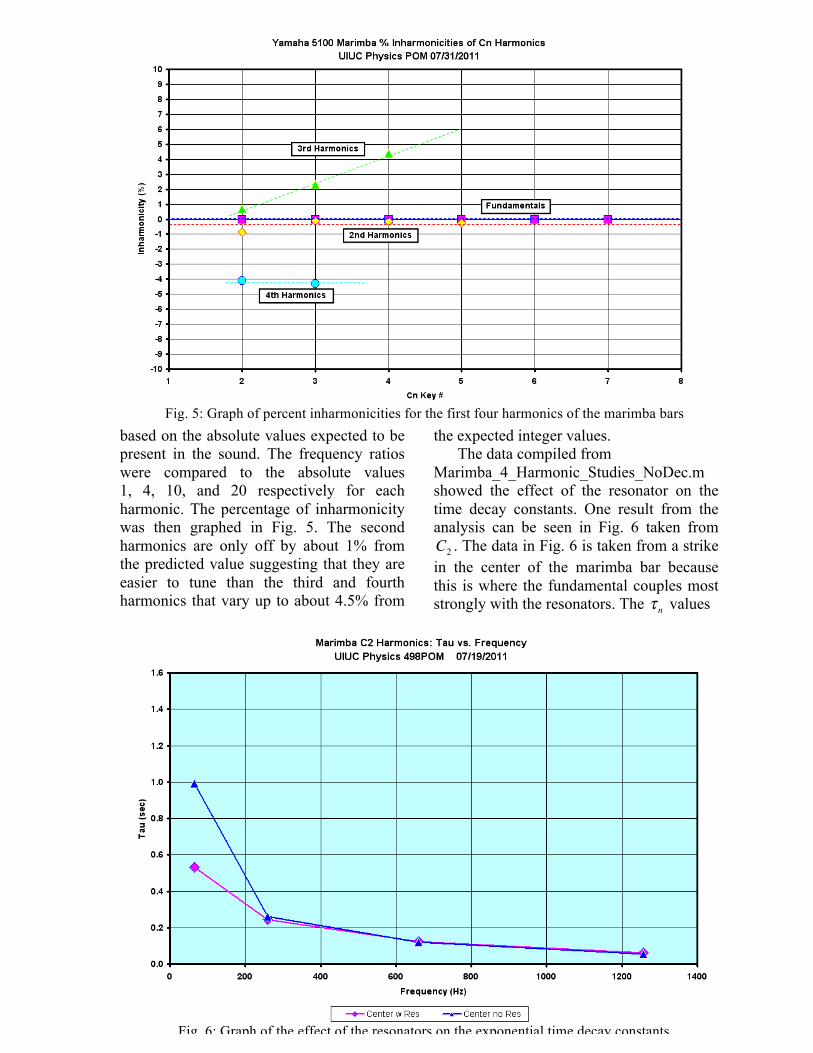
the expected integer values. The data compiled from Marimba_4_Harmonic_Studies_NoDec.m showed the effect of the resonator on the time decay constants. One result from the analysis can be seen in Fig. 6 taken from C2 . The data in Fig. 6 is taken from a strike in the center of the marimba bar because this is where the fundamental couples most strongly with the resonators. The τ n values
Fig. 6: Graph of the effect of the resonators on the exponential time decay constants
Fig. 5: Graph of percent inharmonicities for the first four harmonics of the marimba bars

only show variation on the fundamental.9 The time decay constant for the fundamental of the Cn bar is significantly decreased when coupled to its resonator. This verifies that the resonators only couple to and affect the fundamental. Once the data had been compiled from Marimba_4_Harmonic_Studies_NoDec.m, all the frequency values were graphed against their respective τ n values. As seen in Fig. 7, τ n has an inversely proportional relationship to the frequencies within margins of uncertainty. This verifies the relationship predicted by Cremer. The data calculated from (5) was able to verify that the τ n values found in the analysis are accurate. 9 The η values should be consistent within each bar and even similar between the bars. Fig. 8 shows the values of η within each bar. The η values range between 0.0036 to 0.0068. The average η value is η = 0.0045 ± 0.0009 , shown by the thick black line.
IV. Conclusions and Future Work The frequency series for the harmonics present in the sculpted marimba bars do not follow a linear series. The harmonics contained in a marimba bar are f1 , f4 , f10 , and f20 . As the number of harmonics increases it becomes more difficult to tune and maintain an accurate relationship to the fundamental. As Cn increases, the higher harmonics become more difficult to analyze due to weaker amplitudes and increasingly shorter decay times. The resonators only have an effect on the fundamental because it is the only odd harmonic present. The fundamental couples to the resonator most strongly when the bar is struck in the center because this is where the relative amplitude of the fundamental is the greatest. By amplifying only the fundamental, the majority of the sound heard by a listener is the fundamental, which is ideal from a performer’s viewpoint.
Fig. 7: Graph of all τ n values verses the frequencies with no resonators
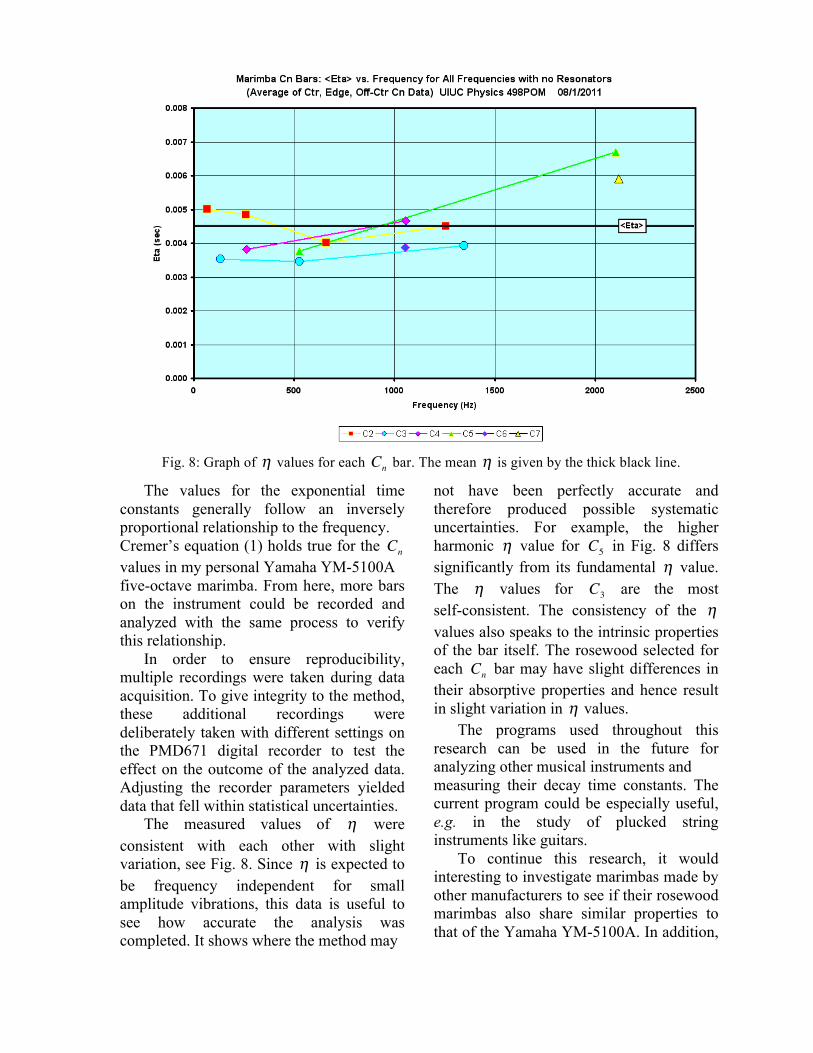
The values for the exponential time constants generally follow an inversely proportional relationship to the frequency. Cremer’s equation (1) holds true for the Cn values in my personal Yamaha YM-5100A five-octave marimba. From here, more bars on the instrument could be recorded and analyzed with the same process to verify this relationship. In order to ensure reproducibility, multiple recordings were taken during data acquisition. To give integrity to the method, these additional recordings were deliberately taken with different settings on the PMD671 digital recorder to test the effect on the outcome of the analyzed data. Adjusting the recorder parameters yielded data that fell within statistical uncertainties. The measured values of η were consistent with each other with slight variation, see Fig. 8. Since η is expected to be frequency independent for small amplitude vibrations, this data is useful to see how accurate the analysis was completed. It shows where the method may
not have been perfectly accurate and therefore produced possible systematic uncertainties. For example, the higher harmonic η value for C5 in Fig. 8 differs significantly from its fundamental η value. The η values for C3 are the most self-consistent. The consistency of the η values also speaks to the intrinsic properties of the bar itself. The rosewood selected for each Cn bar may have slight differences in their absorptive properties and hence result in slight variation in η values. The programs used throughout this research can be used in the future for analyzing other musical instruments and measuring their decay time constants. The current program could be especially useful, e.g. in the study of plucked string instruments like guitars. To continue this research, it would interesting to investigate marimbas made by other manufacturers to see if their rosewood marimbas also share similar properties to that of the Yamaha YM-5100A. In addition,
Fig. 8: Graph of η values for each Cn bar. The mean η is given by the thick black line.
an analysis of bars made from different types of wood and synthetic material would add to the understanding of marimba construction. To expand even further, this methodology could also be used on other keyboard percussion instruments like the vibraphone and xylophone. V. Acknowledgments I give a special thanks to Professor Steven Errede for all his advice and support throughout my research. I also thank John Nichols for his additional guidance. The NSF Grant PHY-1062690 supports the REU program at University of Illinois. VI. Footnotes and References 1Bork, Ingolf. “Practical Tuning of Xylophone Bars and Resonators,” Appl. Acoust. J. Acoust. 46, 103-127 (1995). 2Bretos, J., Santamaria, C. and Moral, J. Alonso, J. “Finite element analysis and experimental measurements of natural eigenmodes and random responses of wooden bars used in musical instruments,” Appl. Acoust. 56, 141-156 (1999). 3Petrolito, J. and Legge, K. “Optimal undercuts for the tuning of percussive beams,” J. Acoust. Soc. Am. 102 (4), 2432-2437 (1997). 4Orduña-Bustamante, Felipe. “Nonuniform beams with harmonically
related overtones for use in percussion instruments,” J. Acoust. Soc. Am. 90 (6), 2935-3583 (1991). 5Errede, Steven. “The Acoustical Physics of a Standing Wave Tube.” (unpublished) <http://online.physics.uiuc.edu/courses/phys193/NSF_REU_Reports/2007_reu/David_Pignotti_Senior_Thesis/The_Acoustical_Physics_of_a_Standing_Wave_Tube.pdf>. 6Errede, Steven. “Derivation of the Sabine Equation: Conservation of Energy.” Lecture Notes. (unpublished) <http://online.physics.uiuc.edu/courses/phys498pom/Lecture_Notes/P498POM_Lecture_Notes/Derivation_of_the_Sabine_Equation.pdf>. 7Cremer, Ing. L. and Heckl, rer. Nat. M. Körperschall, (Springer-Verlag, Berlin, 1967), pp. 165-201.
8Yasi, Joe. “An Algorithm for Extracting the Relative Phase of Harmonics from a Periodic Digital Signal.” (unpublished) <http://online.physics.uiuc.edu/courses/phys193/NSF_REU_Reports/2004_reu/Joe_Yasi_Final_Paper.pdf>.
9The statistical uncertainties on the fitted τ n values are much smaller than the size of their symbols on the plots and hence are omitted for the sake of clarity.