application of public relations theories inthe practice of public ...
The MARKAL-QuCbec multi-period process model is usedto simulate the reaction ofthe Quebec energy and industrialsectors to the imposition of upper limits on the globalernissions of NOx and 502 acid gases into the atmosphere.Two economic scenarios are used respectively for high andlow demands for goods and services, with moderate pricesof imported energy forms. Several emissions reduction constraints are tested. The main results are: important reductions are achieved in the copper smelting industry, aswitchfrom heavy fuel oil to natural gas and aswitch toward dieselvehicles impacting the refining of oil products and thetransportation sector.
Le modi!le dynamique d'analyse d'activit<!s, MARKALQuebec, est utilise pour simuler la reaction des systemesenergetique et industriel quebecois aI'imposition de limitessuperieures d'emissions atmospheriques des gaz acidesNOx et S02. Le modele est dirige par deux scenarioseconomiques contrastes, representant respectivement desdemandes fortes et faibles de biens et services, associes adesprix moderes des formes d'encrgie importees. Des contraintes sur Ies emissions atmosphcriques sont testees. Lesprincipaux resuItats sont Ies suivants: realisation dereductions importantes dans I'industrie de fa Jonte ducuivre, un passage du mazout Iourd au gaz naturel et unpassage aux voitures Jonclionnant au diesel, ayant desimpacts se repercutant sur Ie raffinage des produitspCfroliers et Ie secleur des transports.
Alain Haurie, Doctorat d'Etat, is Professor ofOperations Research, Universite de Geneve andEcole des Hautes Etudes Commerciales. RichardLoulou, Ph.D., is Director of Groupe d'Etudes et deRecherche en Analyse des Decisions (GERAD), andProfessor of Management Science, McGillUniversity. Claude Berger, Eudes Lessard andJean-Philippe Waaub are research analysts atGERAD, Ecole des Hautes Etudes Commerciales,Montreal. This research was partially supported bythe Canadian Ministries of the Environment and ofEnergy, Mines and Resources, and conducted aspart of the Canadian participation to the EnergyTechnology Systems Analysis Project (ETSAP) of theInternational Energy Agency (lEA).
124
Exploring Add GasEmission Reductionsin the Province ofQuebec viaMARKAL-Quebec
C. BERGER, A. HAURIE,E. LESSARD, R. LOULOU, andJ-P. WAAUB
1. Introduction
The general objective of this research is the computation of efficient responses by the Quebecenergy system to the imposition of global limitson emissions of acid gas. Emission reductionscan be achieved through: (i) increased energyefficiency (including end-use conservation);(ii) fuel switching (including cleaner fuels);(iii) abatement technologies; (iv) changing industrial processes; and (v) reducing end-use demands for goods and services. The model usedhere takes into account the first four means ofreducing emissions. The fifth method is handledby running two contrasted economic scenariosand comparing the responses of the model.
In Quebec S02 is emitted mainly by the coppersmelting and refining industry (57%) and byburning coal and oil fuels in industrial boilersand furnaces (26%), whereas NOx is emittedmainly by the transportation sector (71 %) andindustrial combustion (14%) (Environment Canada, 1986). Our model accounts for emissionsfrom the complete energy and industrial system,and focuses on the above three sectors to achievedesired reductions in emissions.
The simulations were run with MARKAL, alarge-scale, multi-period, linear programming,process model. The advantage of using a de-
Enerh'Y Studies Review Vol. 3, No.2, 1991 Printed in Canada

Table 1: Prices of Imporied Fuels ($CDN 1980/GJ)
1980 1985 1990 1995 2000 2005 2010 2015
Crude Oils
Arabian Light 2.87 4.12 2.90 3.10 3.30 3.40 3.50 3.60
Tiajuana Medium 2.62 3.77 2.62 2.81 3.00 3.09 3,19 3,28
Canadian Light 2,99 4.29 3,02 3,23 3,44 3,54 3,65 3.75
Canadian Natural Gas 2,31 2.71 2,61 3,10 3,30 3.40 350 3,60
Coal 2,11 2.28 2.46 2,74 3,01 3,39 3,77 4,25
tailed process model lies in the enormous flexibility to add the requisite level of detail for thesubsectors that contribute most to emissionsand/ or to energy supply and consumption,while keeping an adequate representation of theless energy-intensive subsectors, Another flexibility of process models is that the technologicalconsequences of various scenarios are directlyand explicitly available, As discussed inFishbone and Abilock (1981) and Fishbone et ai,(1983), MARKAL was used for this study, withsignificant modifications made by our team (Berger, 1987; Berger, 1988), to facilitate detailedmodelling of the industrial sector (in particular,explicit representation of material flows, in addition to the energy flows allowed by MARKAL),
In the simulation ofa MARKAL model, energyis extracted from primary sources, then transformed by supply technologies into a variety ofenergy carriers including fuels, and electricity,These energy carriers are finally used by a vastarray of end-use technologies to satisfy varioussocio-economic needs (useful demands), such asspace heating, car travel, and steel production,without imposing the energy forms or the technologies that will satisfy these needs. The usefulenergy demands are provided by the user, foreach period,
The technologies related to extraction, transformation, transportation and end use of energyforms constitute the Reference Energy System(RES) of the country or region being studied. TheRES also specifies the various energy carriersthat link together the technologies.
MARKAL simulates the competition amongthe available technologies via linear programming, which selects the activities that are cost-effective from the perspective of the whole system.As an example of the benefits of the systemapproach, Wene et al. (1988) show that the globalcost of achieving 502 and NOx emission limits isconsiderably reduced if the optimization takesboth constraints into account simultaneously,rather than sequentially. In fact, this procedureis very close to the real life economic computations done by the agents involved in the choices;the only difference comes from the fact that thechoices are computed under an assumption ofperfect foresight which permits decision makersto anticipate benefits and costs far in the future.
Two contrasted economic scenarios are used; foreach economic scenario, several levels of reduction of 502 emissions are tested. Each scenarioassumes a series of annual limits on emissions ofSO" one for each of the last five of the eightfive-year periods from 1980 to 2015, Three alternate levels of reduction on emissions of NOxareassumed, and are combined with the constraintson SO, to form the environmental scenarios.
In both economic scenarios, the same moderate prices for the five imported fossil energyforms are assumed, as shown in Table 1.
The Ifhigh" and "lowH economic scenarios correspond respectively to high and low demandsfor goods and services and moderate oil and gasprices. For the "high" ("low") scenarios, the annual growth rates in the main sectors are asfollows:
125

Table 2: Environmental Scenarios
Scenario NOx Limit (1995 and later)
F-F None
C-F 1985 level
C-50 1985 level
C-60 1985 level
C-70 1985 level
C-80 1985 level
10-50 1985 level minus 10%
• 3.12% (0.30%) in the industrial sector as awhole (growth rates in individual industriesare given in Baillard et al. (1987));1.52% (1.00%) in the residential and commercial sectors; and,2.40% (1.84%) in the transportation sector.
The environmental scenarios are described inTable 2 above. Scenario F-F imposes no restriction on either type of emission. In scenario C-F,NOx emissions must not exceed the 1985 level,from 1995 on, while no restriction is imposed onemissions of502• The next four scenarios assumethat emissions of NOx are limited to their 1985level, but that the reductions in 502 are increasingly severe. In preliminary runs, intermediatelevels of 0, 20, and 33% reductions in 502 weretried, showing that there were no qualitative differences between these runs and the C-50 scenario; therefore, we eliminated these intermediate runs from this presentation. The 10-50 scenario tests a plausible combination of reductionsof NOx and 502 emissions. All reductions areimposed starting in 1995, and the levels prior to1995 are left free.
In the "low" case, an 80% 502 reduction scenario (C-80) is feasible, but not so in the "high"case. In the latter case, a C-60 scenario was runinstead.
The 1980 and 1985 levels of reference used inthe model are those of a MARKAL-Quebec runwith no constraint on emissions of 502 and NOx.They are 1,045,689 tonnes of 502 in 1980, and252,877 tonnes of NOx in 1985, respectively. Both
126
S02 Limit (1995 and later)
None
None
1980 level minus 50%
1980 level minus 60%
1980 level minus 70%
1980 level minus 80%
1980 level minus 50%
of these values are within 5% of those providedby official sources (Environment Canada, 1986;Quebec Environment, 1989).
For each chosen reduction level, the modelfinds a minimum-cost system configuration.This information is a useful input to the selectionand testingof policyalternatives in comprehensive energy/environment management. Theglobal net cost of achieving a certain reductionof emissions is easily found as the differencebetween the cost of the corresponding scenarioand the"do-nothing" (F-F) scenario. In additionto total system cost, the model provides a detailed account of the changes in fuel use, technologies, and energy conservation levels, thus allowing a thorough energy/ technology analysisof each scenario.
The remainder of this report is organized asfollows: Section 2 describes those parts of theMARKAL model that have been added or modified for an adequate representation of 502; Section 3 does the same for NOx; Section 4 comments on the results of the corresponding runsof the model; Section 5 presents conclusions.
2. Modelling 502
The accounting of 502 emissions, energy conservation measures, fuel switching, and more efficient processes are modelled in each sector (residential, commercial, industrial and transportation). The copper industry and the boilers andfurnaces, identified as key sectors regarding

/SCH&SCL
PP'
- FLUIDIZED BED
GRINDING AND ~CALCINE Matte
/SCCREVERBERATORYFURNACE PIERCE SMITH s"Ft ANODE REFINING
CONVERTERS f- ELECTROREFINING/SCl - WITH40%CU ANDCA5TING
Scrap MATIE AND SCRAPL( WET CHARGE } Refined CopperREVERBERATORY
( MINING AND )-FURNACE WITH 02
CONCENTRATION /SCH Blister BlisterOF COPPER ORE
---{ EXISTINGConcentrate NORA~~~I-lR~~CTOR
/SCC/SCH PIERCE SMITH ANODE REFININGrl RETROFIT "' M"". CONVERTERS ElECTROREFINING
NORANDA REACTOR WITH 30% & 73% CU RETROFIT WITH BEDERAUTOGENOUS - MADE AND SCRAP PRECIOUS METAL
S<>ap RECOVERY( JMPORTEDCOPPER}-- /SCV IS; p AND CASTING
CONCENTRATE o NEWRefined Copper
Concentrate NORANDA REACTOR Matte Blister BlisterAUTOGENOUS
/SCV /SCD ANODE REFINING
ri NORANDA REACTOR PIERCE SMITH NEW ELECTRO-CONTINUOUS CONVERTERS REF1N1NGWITH BETIER
SCl: S02 light flow PROCESS WlTH 73% CU f- PRECIOUS METAL
SCH: S02 heavy flow - MATIEAND SCRAP RECOVERY
$CV: 502 very heavy flow Scrap~
AND CASTING
SCC: S021ight flow conv.SCD: S02 heavy fJowconv. Refined Copper ~
G,C.M.HYDROMETALLURGICAlPROCESS\. AND PRODUCTION OF ELEMENTAL SULPHUR
Relined Co ,'I.
Figure 1: Copper Module
their contributions to global SO, emissions (seeSection 1), are presented in detail below, sincethey required substantial modelling improvements for the representation of S02 emissions and abatement measures.
2.1 The Copper Industry
The primary copper industry in Quebec uses asulfide ore which is currently processed by pyrometallurgy. The modelling effort for the copper sector focuses on the different processes thatcan be used to produce refined copper throughthe current pyrometallurgy process. Processesare modeled with sufficient detail to allow agood representation of emissions of S02 fromburning sulfur in the materials involved. Fur-
thermore, an alternate hydrometallurgy processis modeled as an alternative to the current pyrometallurgy path. Figure 1 illustrates the coppermodule of MARKAL-Quebec. As pictured, thepyrometallurgy of copper is divided into fourparts: (1) mining and concentration; (2) smeltingofcopper concentrate; (3) converting of differentmatte grades, and (4) refining of blister copper.The Noranda Gaspe operations (hot calcine reverberatory smelting) are represented by theboxes in the top row. The Noranda Horne operations (wet charge reverberatory and Norandareactor under different operation modes) arerepresented in rows below. Use of oxygen in theNoranda reactor is emphasized as a way to improve energy efficiency and to reduce operatingcosts. Different operation modes of Pierce-Smith
127

S02 IN ATMOSPHERE
S02 IN LIGHT FLOW r CONCENTRATION ACID PLANT ACID MARKETREVERBERATORY I-~ SINGLE CONTACT
from smelter GASES
S02 IN HEAVY FLOW rfrom smelter ~
NEUTRALIZATIONPLANT
S02 IN LIGHT FLOW r '- ACID PLANT I-
~HOODED DOUBLE CONTACTCONVERTER I-
from converter 40% & mixed mattes Lf iNTEGRATED' "\FERTILIZER I
S02 IN HEAVY FLOW r \.. PLANT oJHOODED I-
----~from converter CONVERTER
73% matte I--. ;;,.FLUIDIZED BED
ACID PLANTS02 IN VERY HEAVY
1/FLOWfrom smelter
Figure 2: S02 Module
converters referring to the matte grades are considered to reflect the necessary flexibility in thetreatment of"dirty" concentrates.
The continuous operation mode of theNoranda reactor is represented in the model. Useof scrap is allowed, both at the converting (second quality scrap) and at the refining (first quality scrap) stages, to decrease the growing dependence upon imported concentrates, and to reduce emissions of 502. Better precious metal recovery is also modeled (existing, retrofitted andnew capacities). The hydrometallurgy of copperis modeled as small integrated plants, and isrepresented in the last row. The Great CentralMines Ltd (GCM) hydrometallurgical processproduces elemental sulfur which is less costly toproduce and to market than sulfuric acid.
Emissions of SO, from each source are computed according to the concentration of the gas
128
flow. Figure 2 shows that SO, can be emitteddirectly to the atmosphere or transferred to acidplants (single contact, double contact and fluidized bed options). In addition, hooding of converters and concentration of reverberatory gasesare also available. In the model, acid is neutralized, even though it can be sold on a local market;this modelling choice thus represents a "worstcase" situation. Itmight also be interestingto addthe promising potential of using the acid in aphosphate fertilizer plant (dotted line box)whose market is growing, as opposed to thetraditional market for acid.
2.2 Boilers and Furnaces
The 502 emitted is directly proportional to thesulfur content of the following fuels: coal, lightfuel oil (No.2), and heavy fuel oil (No.6). Coal

is a marginal fuel in Quebec and is modeled as asingle quality coal. In MARKAL, fuel oils areproduced endogenously by the petroleum refining module; this permits modelling of emissionreductions by making available a series of different sulfur contents in fuels at the supply point(the refinery). The model can respond to a demand for low sulfur fuels by additional investments in desulfurization units, etc., or by purchasing crudes which are lighter and sweeter(i.e. with less sulfur), at a higher price. To insureadequate flexibility, we have modeled four different levels of sulfur content in heavy fuel oil(HFO) - 0.5,1,1.5, and 2.5%. The 2.5% level isthe maximum currently allowed in most ofQuebec. Each category of boiler and furnace isallowed to switch between the different HFOqualities.
In Quebec, light fuel oil was used mainly forresidential heating during the seventies, but wasrapidly replaced by electric heaters, so that onlyone level of sulfur content is retained in themodel; this level is 0.5%, which already satisfiesQuebec regulations.
3. Modelling NOx
As with 502, the accounting of NOx emissions,energy conservation measures, fuel switching,and more efficient processes are modelled ineach sector, with particular care in the industrialheat and transportation sectors.
The transportation sector is modeled with thevehicle classes used by the United States Environmental Protection Agency (1985) andadapted to Canadian conditions (EnvironmentCanada, 1988). Emissions of NOx and 502 fromall types of vehicles are accounted for in themodel. The main concern of the modelling is toallow a sufficient capability for reducing emissions of NOx. This is achieved in three ways: (1)better efficiency of the vehicles; (2) gradual implementation of abatement technologies (different types of catalytic converters); and (3) fuel andtechnology switching (e.g., gasoline, compressed natural gas (CNG), propane, diesel).Electric cars are not considered in this discussion.
4. Scenario Analysis
In this section, we discuss the MARKAL-Quebecruns for the two contrasted economic scenariosand the set of emission level scenarios ofTable 2.The analysis starts with an overview of the mainresults, including the cost!emission trade-offcurves and other general observations. This isfollowed by a sectoral analysis of the technological changes in the "high" and "low" cases.Throughout this section, the analysis emphasizes the copper sector, the oil refining sector andthe transportation sector. In all figures, resultsfor the first and second periods (1980 and 1985,respectively) are historical, whereas results forperiods three to eight (1990 to 2015) are obtainedfrom the model runs.
4.1 Overview of Results
COST(EMISSION TRADE-OFFS
Figures 3A and 3B summarize in graphical formthe total costs incurred in the system to achievespecific reductions in emissions. The costs areexpressed in 1989 Canadian dollars discountedat 7% to 1989; the abscissa indicates the reductionof 502 emissions in 2015 as a percentage of 1985emission levels. In both cases, the cost curve isremarkably linear between the C-F scenario andthe C-50 scenario (this was verified by runningseveral intermediate cases that are not presentedhere), meaning that, when the limit on emissionsof NOx is held constant, redUcing emissions of502 has a fairly constant unit cost up to a 50%reduction (and probably up to almost 60%). Further reduction of 502 emissions is much morecostly to achieve: the slopes are much steeperfrom 50 to 70% or more. Detailed analyses of thetwo cases support this observation.
In order to put the costs of figures 3A and 3Bin perspective, we computed, for each scenario,the discounted net present value (DNPV) of thefuture stream of Quebec annual gross domesticproduct (GDP) over the post 1989 horizon, andwe then established the value of discounted reduction costs as a percentage of the DNPV of theGDP stream. For example, in the "high" case, thelargest (discounted) reduction cost of$4.6 billion
129

5000
10-50 •
c;;-'"cO>
.5!~
U 0::1-
""f .,'" c0::1Ul 8..--0"
4000
3000
2000
..._--------- C - 5 0
C-F
C-70
".,z'Eo::10o" ....!!" coco:oi1--
1000
F-Fo-Hh-.............,........,.~T""""' ....~-...."T"""-."'T""""1r-.--r-...-r........,-60 -50 -40 -30 -20 -10 0 10 20 30 40 50 60 70
Reduction of S02 emissions (%)
Figure 3a: Cost / Emission Trade-Off Curve - "High"
c;;-'"cO>
.5!~
U 0::1-
""f .,",'E0::1Ul 8..--0"- -.. 0>0'",,0>~
".,z'Eo::10o" ....!!" co"i=oi1--
4000
3000
200010 - 50
•1000
C-FC-50
F-F0-10 0 10 20 30 40 50 60 70 80
Reduction of S02 emissions (%)
COSO
Figure 3b: Cost/Emission Trade-Off Curve - "Low"
130

(scenario 10-50) represents 0.23% of the discounted GOP, whereas in the "low" case, thelargest cost of $3.8 billion (scenario C-80)amounts to 0.20% of discounted GOP. These arerelatively very small costs indeed.
Another interesting point is that in the absenceof constraints on NOx or 502 (scenario F-F), thequantity of 502 emitted in 2015, for the "high"case, exceeds by 55% the 1980 level, whereaswhen only NOx is constrained (scenario C-F), thequantity of 502 emitted in 2015 exceeds the 1980level by only 19%. This clearly illustrates thatwhen demands are high, the initial reduction ofNOx induces an important reduction of 502 aswell. This beneficial side-effect disappears whena stricter constraint is imposed on emissions ofNOx, as may be seen by comparing scenariosC-50 and 10-50.
A similar analysis in the "low" case shows thatreducing emissions of NOxdoes not significantlyaffect emissions of SO" which in scenarios F-Fand C-F, remain close to constant at their 1985level; this is caused by the modest increase indemands in the low economic scenario, whichmakes it possible to achieve sufficient reductionsin emissions of NOx within the transportationsector alone.
The above remarks help explain why the costof maintainingemissions of NOxat the 1985 levelwhile leaving emissions of 502 free (obtained bycomparing scenarios F-F and C-F) is muchhigher in the "high" case than in the "low" case($2.4 billion and $0.42 billion respectively). Similarly, the additional cost of cutting emissions ofNOx by 10% and 502 by 50%, versus constantemissions of NOx and a 50% cut in emissions ofSO, (by comparison of C-50 and 10-50), isroughly 2.5 times larger in the "high" than in the"low" case.
REDUCTION STRATEGIES
This section describes in broad terms, the meansused by the model to achieve the emission constraints imposed in both economic cases. Comparing scenarios F-F and C-F, the means toachieve NOx reductions in both economic cases,are mainly:• an important switch from oil products (espe-
cially heavy fuel oil) to natural gas as shownin Figure 4, which presents for each scenariothe amounts of natural gas imported intoQuebec. There are of course correspondingdecreases in the amounts of crude oil imported into Quebec; and,
• an important switch toward diesel vehiclesas shown in Figure 5, which presents theshare of diesel by transportation vehicles.
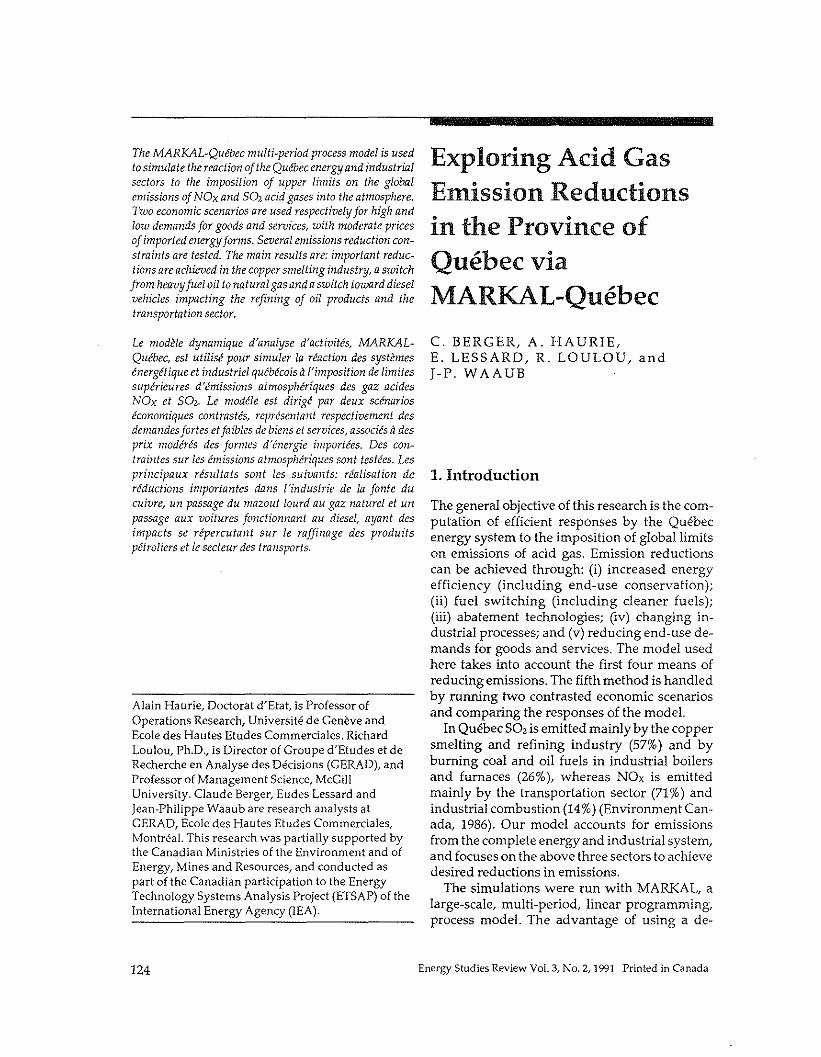
Figure 6 shows that the changes are accompanied by an increased share of imported, lighterand "sweeter" crude oil (a "sweet" crude is onewith a low sulfur content, as opposed to a "sour"crude which has a high sulfur content). Theseswitches are more pronounced and occur earlierin the "high" than in the "low" cases. Detailedanalysis shows that the impact of scenario C-Fon the refining supply and structure is muchlargerin the "high" case, which explains the highcost differential between F-F and C-F. The copper sector is not affected by this scenario.
Reductions in emissions of SO, from C-F toC-50 are achieved mostly in the copper industry(Figure 7), as well as from small additional gasimports. In the C-50 scenario, the copper industry emits almost no SO,. Note that this occurseven though the acid produced in this sectormust be neutralized in our model (we assume nosignificant market for acid).
With the 70% reduction constraint, the abatement potential in the copper industry is alreadyexhausted, and the model achieves the desiredemission level by a large switch to light andsweet crude oil, which more than doubles itsshare of the total imports of crude oil in 2015(Figure 6). This provokes important changes inthe structure of the refining industry, which arediscussed in more detail below. These changesin oil refining account for the high additionalcost of scenario C-70.
In the "low" case, reducing further the emissions of 502 from 70 to 80% costs more than thecumulative cost of previous reductions of 502
and NOx. This shows clearly that the C-80 scenario challenges the ability of the model (andindeed of the energy system), which responds byan almost total conversion of boilers and furnaces to natural gas and other"clean" fuels, and
131

20152010200520001995
YEAR1990
---0- F-F
• C-F
-f::r- C-50.. C-60
-0- C-70
-- ..--
1985
1200
c:: 1000<I:w>-- 800enW..J:::l 6000"")
<I:I- 400Wc..
200
01980
Figure 4a: Importation of Natural Gas - "High"
---0- F-F
• C-F
-f::r- C-50
-0- C-70
• C-80_...-- 10-50
2015
,.,,,,,,,,,
201020052000199519901985
550
SOOc::<I: 450W>- 400-enw 350..J:::l 3000"")
<I: 250I-W 200c..
150
100
501980
YEAR
Figure 4b: Importation of Natural Gas - "Low"
132

30 -D- F-F
• C-F .......... ...".- "',
-tr- C-50 I' ..w ," .. C-60
,""" .....,< 20
,,I- ,Z , ....W
, .., ..(,) , ",c:: , ..W ..C. ....
10 C-70 ......-- ..-- 10-50 ..
20152010200520001995199019S5O+-~~--r~~-r--r--",,-----''----r-~~r-~--,--~-,
19S0
YEAR
Figure Sa: Diesel Share of Road Transportation Fuels - "High"
w
"<IZW(,)c::wc.
40
30
20
10
-D- F-F
• C-F
-tr- C-50
-0- C-70
.. CoSO
-- ..-- 10-50
20152010200520001995199019S5O-t--~--r-~-r-~--,--~--r-~-r-~--.--~--,
19S0
YEAR
Figure 5b: Diesel Share of Road Transportation Fuels- "Low"
133
2015201020052000199519901985o+--~-,--~1980
50-0- F-F
• C-F40
-t:r- C-50WCl .. C-60<I- 30 -0-Z ColOW0 ----- 10-50a:W 20a-
10
YEAR
Figure 6a: Share of Light Sweet Crude Oil in Oil Supply - NHigh"
80
2015201020052000199519901985
-0- F-F
• C-F
-t:r- C-50
-0- ColO
to C-80
----- 10-50
o-t-~-,--~~=1980
20
W 60Cl
~zwo 40a:Wa-
YEAR
Figure 6b: Share of Light Sweet Crude Oil in Oil Supply - "Low"
134

20152010200520001995
YEAR
•\\\\\\\\
\\ ------- ...-----------..----
1990
800
r::c<Cw 600>--enwz -Q-z0 400.... • C-F0 ----f:s:- C-50...J
52 .. C-60200
-0- C-70
-- ..-- 10-50
01980 1985
Figure 7a: 502 Produced by the Copper Industry - "High"
600
r::c 500<Cw> -Q- F-F-- 400enW • C-FZZ 300 ----f:s:- C-500....
-0-0 C-70~-...J 200 ~~
~~
~ N C-80 ~~..."... ..-....----- 10-50 ~~
100
01980 1985 1990 1995 2000 2005 2010 2015
YEAR
Figure 7b: 502 Produced by the Copper Industry - "Low"
135
by further structural changes in the transportation sector. To correctly analyze reductions ofsuch severity, our model should be extended toinclude abatement technologies even in sectorsthat contribute small shares of total emissions.
Comparing scenarios C-50 and 10-50 yieldsinteresting results. While continuing the substitution of imported crude oil or imported gas, the10-50 scenario shows an increase in emissions ofSO, by the copper sector (Figure 7) and a decrease by boilers and furnaces (Figure 8). This isso because the alternative of an early switch togas and other fuels, although expensive, reducesemissions ofSO, and NOxsimultaneously. Otherimpacts of this scenario are different in the twoeconomic scenarios; in the "high" one, the modelmust act in the transportation sector (by increasing diesel and CNG cars) in spite of the high costof doing so, whereas in the "low" case, there isstill enough potential left in boilers and furnacesto achieve a good part of the desired reductionsin NOx through substitution of gas. These differences help explain the high cost differential observed.
4.2 Sectoral Analysis of the Two Economic Cases
INDUSTRIAL BOILERS AND FURNACES
Figure 8A shows a massive reduction of emissions by boilers and furnaces in the "high" casewhen NOxis limited to the 1985 level, caused byreplacement of heavy oil by gas, even in the C-Fscenario. Further reductions (scenarios C-F toC-50) occur through minor additional penetration of gas. Another significant reduction (scenarios C-70 and 10-50) is achieved by replacingheavy fuel oil by other fuels (wood, more gas)and conservation. In the long term, all reductionscenarios use the same amount of natural gas inthis sector, although scenarios C-70 and 10-50use more gas boilers in 1995 and 2000.
As shown in figure 8B, the decrease in emissions ofSO,by this subsector is more progressivein the "low" case, as the constraint on 502 istightened. The C-80 scenario induces near-zeroemissions, even as early as 1995. Another difference with the "high" case is that the long termemissions of SO, are different across the various
136
constraints on SO" whereas they are uniformlylow in the "high" case. This is because the lowerindustrial demands make it relatively easy tosatisfy the various constraints on SO" except inthe C-80 case.
REFINING SECTOR
The impact on refining of the fuel switchingobserved in the industrial boilers and furnaces isto decrease the competitiveness of heavy andsour crude in favour of light and sweet crude,with an ensuing restructuring of the refineries.The desulfurization capacity decreases up to1995 in both "high" and "low" scenarios according the same pattern because of use of sweetercrude and the switch to natural gas. In the unconstrained F-F scenarios,. the decrease is evenmore pronounced because of the absence of anyconstraint. After 1995, the requirement for constant emissions, combined with the large increase in useful demands, promotes additionalinvestments in desulfurization units.
Scenarios C-70 and C-80 in the "high" and"low" cases, respectively, are different. The C-70scenario induces a shift towardS more diesel accompanied by a marked shift towards desulfurization, whereas the C-80 induces a shift towardsmore gasoline, accompanied by increased imports of sweet and light crude and less desulfurization. Cracking units exhibit a similar (although less pronounced) decrease in capacityfrom the C-70 to the C-80 scenarios, whereasreforming increases, so as to allow the production of extra gasoline.
Finally, scenario 10-50 of the "high" case exhibits a stronger decline in desulfurization capacity. Although the use of heavy fuel oil continues to decrease, there is less need to upgrade theheavier cuts from the distillation units. Since gaspowered vehicles strongly penetrate this market(because natural gas emits less NOx than gasoline or diesel), there is less need for gasoline anddiesel in the transportation sector. The strongpenetration of diesel followed by a pronounceddecline after 2000, is explained by the lower 502
emissions from gasoline and CNG cars - theincreasing relative severity of the constraintforces such a switch towards these vehicles. Of

525--0- F-F
450 • C-FII:< -ts- C-50W>- 375 ..- C-60enw
-----0-z 300 C-70Z0 -----I- 2250..J
::.::: 150
75
01980 1985 1990 1995 2000 2005 2010 2015
YEAR
Figure 8a: S02 Emissions of Industrial Boilers and Furnaces - "High"
300 --0- F-F
• C-FII: 250< -ts-W C-50>-- 200enWZZ 1500I-0..J 100 -----0-::.::: C-70
II C-8050 ----- 10-50
01980 1985 1990 1995 2000 2005 2010 2015
YEAR
Figure 8b: S02 Emissions of Industrial Boilers and Furnaces - "Low"
137

course, the net result of this reduction in the useof oil products is a decrease in imported crudeoil in favour of natural gas as shown in Figure4A. In the "low" case, scenario 10-50 is not verymuch constrained because of the lower demands, and it follows the general pattern ofother scenarios. Note that the above detailedanalysis is made possible by the presence inMARKAL-QUl'bec of a detailed, accurate refiningmodule (Berger, 1985).
COPPER INDUSTRY
Major gains in emissions reductions areachieved in the copper sector as shown in Figure7. Technological changes occur according thefollowing sequence: in both economic cases, calcine smelting progressively disappears underscenarios with reduced emissions of 502, with asimultaneous increase inthe use of the Norandaautogenous reactor, with which important gainsin energy efficiency are achieved. In addition,concentrating the gases from a reverberatory furnace is more expensive than what is done automatically in the Noranda reactor, especiallywithincreased use of oxygen. This constitutes an additional advantage for a Noranda reactor coupled with a fluidized-bed acid plant to treat theconcentrated gases. In spite of this, the wetcharge reverberatory furnace continues to produce in all scenarios except the C-70 scenario,providing the necessary flexibility to treat dirtyconcentrates. It was already noted that scenario10-50 prefers a slightly less clean copper smelting(and thus a smaller penetration of the autogenous reactor) because simultaneous reductionsin emissions of SO, and NOx can be achievedmore cheaply through HFO replacement forboilers and furnaces.
Otherobservations on the copper industry are:the GCM hydrometallurgical process is notused (it would be competitive if fluidized bedacid plants were not permitted);hooding of the Pierce-Smith converters is implemented starting in 1995 for the treatmentof the 73% copper matte coming from theNoranda reactor;use of scrap copper increases from 10% to20% of copper contents in all scenarios;
138
• the maximum increase in the long term marginal production cost of refined copper(shadow price) occurs in the C-70 scenario in1995, and is close to 6%. In all scenarios, theincrease stabilizes around 4% in 2005 andlater; andup to one million tonnes of acid are producedin the C-70 scenario, and are neutralized inour model. Acid could be considered as auseful by-product or as an environmentalreject, dependingon the size of the market foracid and the production of acid by other regions or countries.
TRANSPORTATIONSECTOR
In both economic cases, three fuels compete inthe road transportation sector: gasoline, diesel,and CNG. Methanol-fuelled vehicles are notcompetitive, in spite of their technical attractiveness. The high cost of methanol comes from itsproduction process, which is based on biomassin our model. Other, possibly cheaper ways toproduce methanol might change this aspect ofour results but do not seem easily feasible inQuebec. Electric cars have not been included inour data base.
The fraction of diesel (Figures 5A and 5B) isshown in relation to total fuel consumption inthe road transportation subsector for all environmental scenarios. Diesel experiences a decreasewhen CNG becomes more competitive and thustakes its market share.
In the "high" case, the results are almost identical from scenarios C-F to C-70, showing that thesector is mainly sensitive to the constraint onemissions of NOx. The transportation sector responds to the constraint on NOx in two ways:
Catalytic converters are used to their full potential in the C-F and all subsequent scenarios.
• Diesel vehicles partially replace the gasolinefleet, reaching around 14% ofthe total fleet in2015 in all C-scenarios, and only 7% for the10-50scenario. Conversely, CNG vehicles appear in 2015 in all C-scenarios and muchearlier (1990) in the 10-50 scenario, reaching,in 2015, a 74% market share in the 10-50 versus only about 50% in all C-scenarios. It is

thus clear that the additional constraint onemissions of NOxinduces a different strategyin this sector, with fewer diesel and moregas-powered vehicles.
For scenarios C-F to C-50, and even 10-SO,diesel has a more vigorous, steadier penetrationin the "low" than in the "high" case, capturingalmost 40% of the market in 2015. This happensessentially to the detriment of CNG cars, whichcapture less market share in the "low" case (lessthan 10% in2015). This is so because the availablereduction potential in the copper sector eliminates the need to reduce emissions of 502 by thediesel cars. In contrast, the more severe reduction in emissions of 502 in the C-80 scenarioprovokes a marked reversal of the diesel "strategy," as is explained in the preceding discussionon the structure of refining: diesel captures a 7%market share in2015 versus 66% for gasoline cars(which emit less 502). In addition to the fuelswitching discussed above, catalytic convertersare used to their full potential in the C-F andsubsequent scenarios.
4.3 Shadow Prices ofConstraints on Emissions
In the "high" case, Tables 3 and 4 give theshadow prices of the constraints on emissions of502 and NOx, respectively, expressed in 1989undiscounted Canadian dollars, and Tables 5and 6 give them in the "low" case. The shadowprice of an emission constraint is the additionalcost incurred when the constraint is tightened byone unit; in other words, it is the marginal costof emission reduction. For example, in the"high" case, it would cost $0.27 to reduce emissions of 502 in 1995 by one additionalkilogramme per year (C-50 scenario).
In the "high" case, all shadow prices are lessthat $0.71 for scenarios C-F to C-60, but risesharply to the range $1.11 to $3.50 in scenarioC-70. This is in agreement with the shape of thecost!emission trade-off curve (Figure 3A). Notethe drop in shadow prices in the 10-50 scenario,caused by a stronger constraint on emissions ofNOx, that has a beneficial side-effect on emissions of 502• The shadow prices of constraints onemissions of NOx are generally high after 2000 in
all C-scenarios, and even higher in the 10-50scenario. This is especially true in 2005 and later.Before then, the effect of progressively strongerconstraints on 502 is to keep the shadow pricesof NOx constraints low (often zero) until theconstraint on 502, by itself, is no longer adequateto sufficiently reduce NOx emissions. The mosttypical example is scenario C-70, where the severe constraint on 502 emissions is enough tokeep NOx emissions below its own limit up tothe year 2000, and thus to keep its shadow priceat zero. The marked increase in shadow pricesobserved in all scenarios after 2000 is caused bythe difficulty of reducing emissions of NOxwhilethe fleet of vehicles is expanding. This side effectis a result of the combination of lower imports ofoil (and high imports of natural gas, see Figure4) and higher fraction of sweet crude, whichcharacterizes the C-80 and C-70 scenarios (Figure 6).
Compared to the "high" case, the shadowprices of 502 constraints in the "low" case aregenerally smaller, but of the same order of magnitude, and they exhibit similar patterns for comparable scenarios. The difficulty of reducingemissions of 502 by 80% is clearly confirmed bythe very high shadow prices of 502 in C-80,reaching $41 per kg in 2015. Except for C-80,shadow prices of constraints on emissions ofNOx are again larger than those of 502, just as inthe "high" case. The beneficial side-effect of reducing emissions of 502 on the shadow prices ofNOx is even more marked here than in the"high" case. Note how progressively stiffer constraints on 502 delay the time at which theshadow prices of NOx become positive; a case inpoint is the C-80 scenario, the shadow prices ofwhich are all zero because of the severe reduction in emissions of 502•
The information provided by the shadowprices can also be used to approximate the savings in cost that would follow from postponingthe imposition of the constraint on emissions of502 (or NOx) by one period. For example, in the"high" case, consider a modification of scenarioC-70 which postpones the constraint on emissions of 502 to 2000 (instead of 1995). Call thisscenario C-70-A. The theory of linear program-
139

Table 3: Shadow Price of 502 ($ CDN 1989) - "High" Table 5: Shadow Price of SO, ($ CDN 1989) - "Low"
Year C-F C-50 C-60 C-70 10-50 Year C-F C-SO C-70 C-80 10-SO
1995 0.00 0.27 0.49 1.11 0.17 1995 0.00 0.33 0.76 15.12 0.12
2000 0.00 0.15 0.71 1.28 0.09 2000 0.00 0.15 0.79 3.63 0.15
2005 0.00 0.08 0.08 1.44 0.09 2005 0.00 0.08 1.05 25.06 0.08
2010 0.00 0.11 0.09 2.01 0.09 2010 0.00 0.11 0.81 25.49 0.11
2015 0.00 0.11 0.12 3.50 0.11 2015 0.00 0.11 0.24 41.34 0.09
Table 4: Shadow Price of NOx ($ CDN 1989) - "High" Table 6: Shadow Price of NOx ($ CDN 1989) - "Low"
Year C-F C-50 C-60 C-70 10-50 Year C-F C-50 C-70 C-80 10-SO
1995 2.68 1.25 0.00 0.00 2.64 1995 0.00 0.00 0.00 0.00 2.31
2000 3.28 2.01 0.11 0.00 4.88 2000 0.00 0.00 0.00 0.00 I.SO
2005 8.68 8.68 7.58 6.75 13.98 2005 2.13 0.78 0.00 0.00 4.79
2010 12.54 11.78 11.51 10.44 13.73 2010 5.59 4.83 2.74 0.00 10.06
2015 12.25 11.84 12.40 10.81 14.46 2015 10.35 10.11 9.86 0.00 lQ.46
ming tells us that an upper bound of the costdifferential between scenarios C-70 and C-70-Acan be computed by using the shadow prices inTable 3, combined with the emissions of 502
achieved in scenarios C-70, C-60, C-50, and C-F.This estimate is $354,147,000 (undiscounted,1989 Canadian $). Details of the computation areomitted. Discounting to 1989 gives a sum of$230,000,000, which is a modest fraction of thereduction costs shown in Figure 3A. Therefore,there is not much point in delaying the SO, constraint by one period.
5. Conclusions
The preceding pages have presented an originalapplication of the MARKAL model to the simulation of the long-term impacts of acid gasesemission restrictions on the Quebec energy system under two alternate economic growth scenarios. The main impacts of the emission reductions may be summarized as follows, for the highgrowth scenario:
a) maintaining NOx emissions at their 1985
140
level (while leaving 502 emissions free) is costly,of the order of $3/kg NOx in the year 2000,climbing to $12/kg in 2015. This is achieved byreplacing fuel oil by natural gas in the industrialsector, by adding three-way catalytic converterson vehicles, and by partially replacing gasolinevehicles with diesel vehicles. Furthermore, theNOx constraint induces a significant joint reduction of 502 emissions, mainly due to the increased use of natural gas;
b) when 502 constraints are added, they entaila relatively moderate additional cost, of theorder of $0.27/kg SO, in 1995, decreasing to$O.l1/kg in 2015, for a 50% reduction constraint.The cost increases markedly when the constraintreaches 70% reduction of SO" but is still lowerthan initial NOx reduction costs. SO, emissionreductions are first achieved in the copper sectorby implementing the more efficient Noranda autogenous reactor, and condensing 502 in acidplants, as well as other process improvements incopper production. The higher 70% 502 reduction is achieved via a marked increase in importsof light, sweet crude oil and a corresponding

modification of the structure of the oil refiningindustry, explaining the higher cost; and
c) a simultaneous reduction of NOx by 10%and S02 by 50% is also very costly, mainly because of the additional NOx constraint. In thissituation, the cost per kilogramme of NOx reduced varies from $2.64 in 1995 to $14.46 in 2015,very imposing figures indeed, incurred mainlyin the transportation sector.
The conclusions for the low growth scenarioare somewhat parallel to the above ones, with,however, much lower reduction costs in mostcases, as well as occasional differences in thetechnological responses of the energy system.
This article demonstrates the usefulness of adetailed, multi-sectoral process model to investigate the impacts of atmospheric emission reductions. Only with such models can the systems effects be fully explored and quantified. Animportant discovery is that, although the twoeconomic scenarios are quite contrasted, theyelicit fairly similarqualitative responses from theenergy system (fuel and process changes, energyconservation measures, abatement technologies).
Another conclusion is that SO, reductions beyond 60% are much more expensive than moderate reductions. This may have important implications for establishing policy in this domain.The identification of the sectors and industrieswhere emission reductions can be achieved efficiently is aiso important if a regulatory approachis to be used for emission control. On the otherhand, if a pollution tax approach is favoured, anunderstanding of the shadow prices of the various emission levels is of paramount importancein fixing the tax rate.
A few improvements of the model's data basemay be suggested, such as allowing multiplesulfur contents in diesel, or modelling naturalgas penetration with additional detail, or imposingupper limits on the importation oflight sweetcrude oil. These are minor modifications, whichwould be useful if more extreme emission constraints were imposed. As it stands now, themodel gives a convincing picture of the sociallyefficient long-term response of the Quebec economy to the imposition of acidic gas emissions.
References
Baillard, D., C. Berger, A. Haurie, and R. Loulou(1987) Modetisalion des choix lechnologiques elenergetiques Industriels dans l'approche MARKAL,GERAD working paper (Montreal: Ecole desHEC).
Berger, C. (1985) La modelisation des ra!fineries dansMARKAL-Quebec, prepared for EMR Canadaunder contract 20ST-23218-4-0024. GERAD,(Montreal: Ecole des H.E.C.), Cahier du GERADG-85-26.
Berger, c., A. Haurie, and R. Loulou (1987) ModelingLong Range Energy/Technology Choices: TheMARKAL Approach, GERAD working paper(Montreal: Ecole des HEC).
Berger, c., A. Haurie" E. Lessard, R. Louloll, and A.Paskievici (1988) MARKAL: Developmenl ofMalerials, Financial and Multi-Regional Capability,GERAD working paper (Montreal: Ecole desHEC).
Environment Canada (1986) Emissions des principauxpolluants atmospheriques au Canada et tendances(1970 tl1980) (Ottawa: Ministere desApprovisionnements et Services) Rapport SPE7/AP/17.
-(1988) Canadian Molar Vehicle Oxides of Nitrogen(NOx! Composite Fleel Emissions Faclors (Grams PerMile) (Ottawa).
Fishbone, L.G. and H. Abilock(1981) 'MARKAL, ALinear-Programming Model for Energy SystemsAnalysis: Technical Description of the BNLVersion,' Energy Research 5:353-75.
Fishbone, L.G., G. Giesen, G. Goldstein, H.A.Hymmen, K.J. Stocks, H. Vos, D. Wilde, R.Zblcher, C. Balzer, and H. Abilock (1983) User'sGuide for MARKAL (BNUKFA Version 2.0) AMulti-Period, Linear-Programming Model for EnergySystems Analysis (Long Island, USA: BrookhavenNational Laboratory; and Juelich, Germany:Kernforschungsanlage).
Quebec Ministry of the Environment (May 10, 1989)'personal communication' of G. Houle, Quebec.
u.s. Environmental Protection Agency (1985)Compilation ofAir Pollutant Emission Factors (AnnArbor) Vol.II.
Wene, C-O., O. Bjorkqvist, J. Johnsson, I. Larsson,and B. Ryden (1988) 'Integrated Energy/EmissionControl Planning on a Municipal Level,' Froc. ofthe joint workshop EISAP (lEA) and Acid Rainsproject, International Institute for AppliedSystems Analysis, Laxenburg. Austria, 13-24.
141