

A COPE Study (2019): Exploring Publication Ethics Issues ...

Exploring your publication networkDemonstrating your standing in the scholarly community
Stefanie Haustein | @stefhaustein

Outline
2
→Research evaluation→Analyzing publication and citation behavior→Collecting bibliographic data→Cleaning bibliographic data→Normalizing citation data
→Social network analysis→Analyzing social networks→Exploring co-authorship networks→Developing collaboration strategies→Network indicators
→Conclusions

Research Evaluation

Research evaluation
4
Peer review vs. bibliometrics
→Peer review→Qualitative→Subjective→Small scale→Labor-intensive for experts
→Resource-intensive
→Bibliometrics→Quantitative→Objective→Large scale→Labor-intensive for
bibliometricians/data scientists→Moderate resources

Research evaluation
5
University rankings
timeshighereducation.com/student/best-universities/best-universities-Canada leidenranking.com/ranking/2019/list

Research evaluation
6
Citation cartels
http://dx.doi.org/10.1038/d41586-019-02725-y

Research evaluation
7
Analyzing publication and citation behaviorM
ike
Thel
wal
lVi
ncen
t Lar
iviè
reSt
efan
ie H
aust
ein
Subset of authors’ publications in JASIST, Scientometrics and Journal of Informetrics 2014-2018
Research evaluation
8
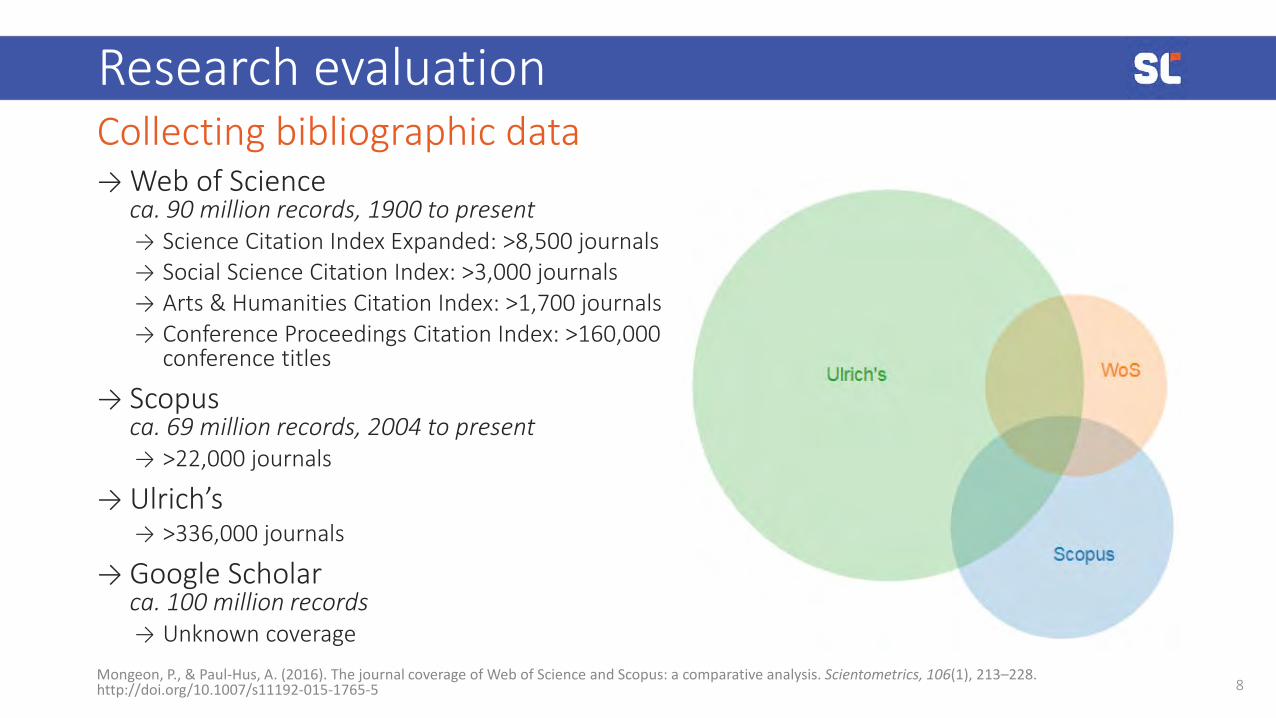
Collecting bibliographic data
Mongeon, P., & Paul-Hus, A. (2016). The journal coverage of Web of Science and Scopus: a comparative analysis. Scientometrics, 106(1), 213–228. http://doi.org/10.1007/s11192-015-1765-5
→ Web of Scienceca. 90 million records, 1900 to present→ Science Citation Index Expanded: >8,500 journals→ Social Science Citation Index: >3,000 journals→ Arts & Humanities Citation Index: >1,700 journals→ Conference Proceedings Citation Index: >160,000
conference titles
→ Scopusca. 69 million records, 2004 to present→ >22,000 journals
→ Ulrich’s→ >336,000 journals
→ Google Scholarca. 100 million records→ Unknown coverage

Research evaluation
9
Collecting bibliographic data
Visualization by Haustein, S. (2019) based on: Mongeon, P., & Paul-Hus, A. (2016). The journal coverage of Web of Science and Scopus: a comparative analysis. Scientometrics, 106(1), 213–228. http://doi.org/10.1007/s11192-015-1765-5
Biomedical Sciences
Natural Sciences and Engineering
Arts & Humanities
Social Sciences
All fields

Research evaluation
10
Collecting bibliographic data
apps.webofknowledge.com/WOS_AdvancedSearch.do

Research evaluation
11
Cleaning bibliographic data
… …

Research evaluation
12
Normalizing citation data
5citations
4.0citations
7.5citations
5.0/4.0=1.25
5.0/7.5=0.67
Expected citation rate(per field, year and document type)
5citations
Molecular Ecology Semiconducting Material
+25% -33%

Social network analysis

Social network analysis
14
Analyzing social networks
Moreno, J. L. (1934). Nervous and mental disease monograph series, no 58. Who shall survive?: A new approach to the problem of human interrelations. Washington, DC, US: Nervous and Mental Disease Publishing Co. http://dx.doi.org/10.1037/10648-000
→Analysis of connections between entities→Identification of structures of groups and clusters→Identification of positions of entities
Entities/actors = nodesConnections/relationships = arcs (directed) or edges (undirected)

Social network analysis
15
Analyzing social networks
Munzner, T. (2014). Visualization Analysis and Design. CRC Press.
→Networks→Data
→ Network→Encode
→ Point marks for nodes, connection marks for links
→ Task→ Explore topology, locate paths
→ Scale→ Nodes: dozens to thousands→ Links: hundreds

Social network analysis
16
Analyzing social networks
Moreno, J. L. (1953). Who Shall Survive? Foundations of Sociometry, Group Psychotherapy and Sociodrama. Beacon House.
→Network graphs (sociograms)“The proper placement of every individual and of all interrelations of individuals can be shown on a sociogram. It is at present the only available scheme which makes structural analysis of a community possible.”
→Matrices→Edge lists
Moreno, 1953, p. 96
A1
A2
A3
A4
A5
A6A7
A8
A9
Social network analysis
17
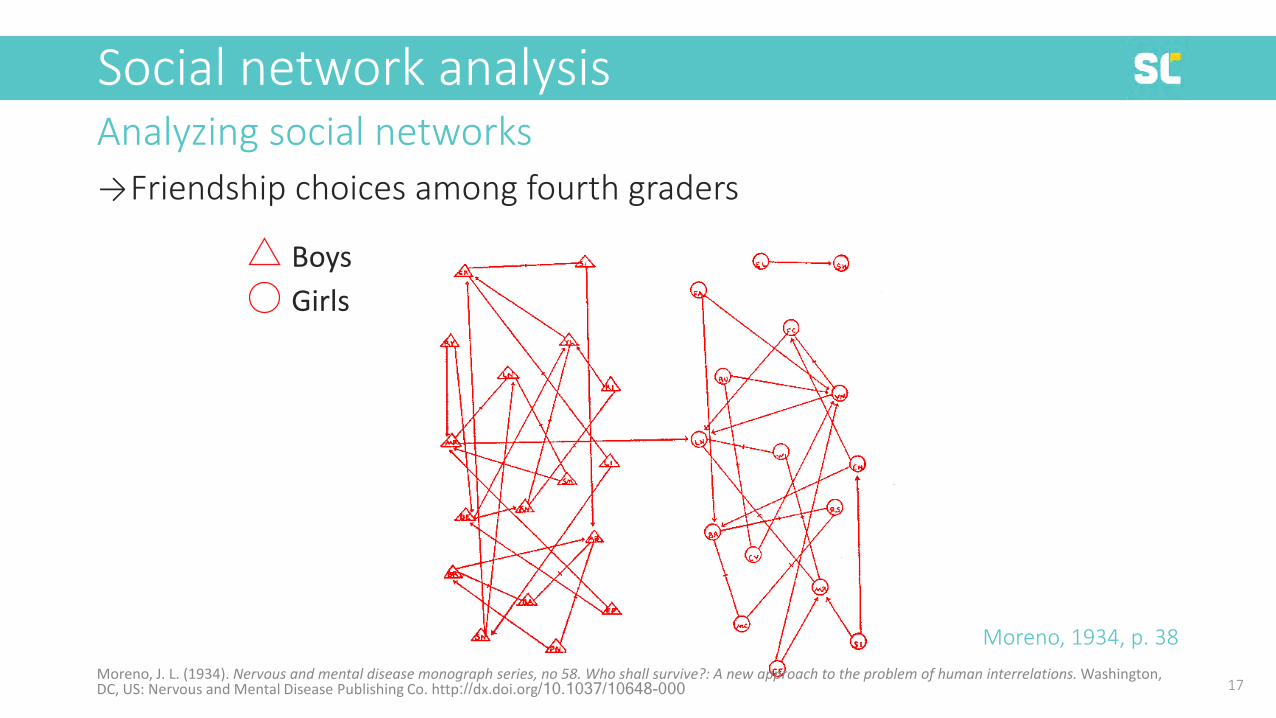
Analyzing social networks
Moreno, J. L. (1934). Nervous and mental disease monograph series, no 58. Who shall survive?: A new approach to the problem of human interrelations. Washington, DC, US: Nervous and Mental Disease Publishing Co. http://dx.doi.org/10.1037/10648-000
→Friendship choices among fourth graders
Moreno, 1934, p. 38
BoysGirls
Social network analysis
18
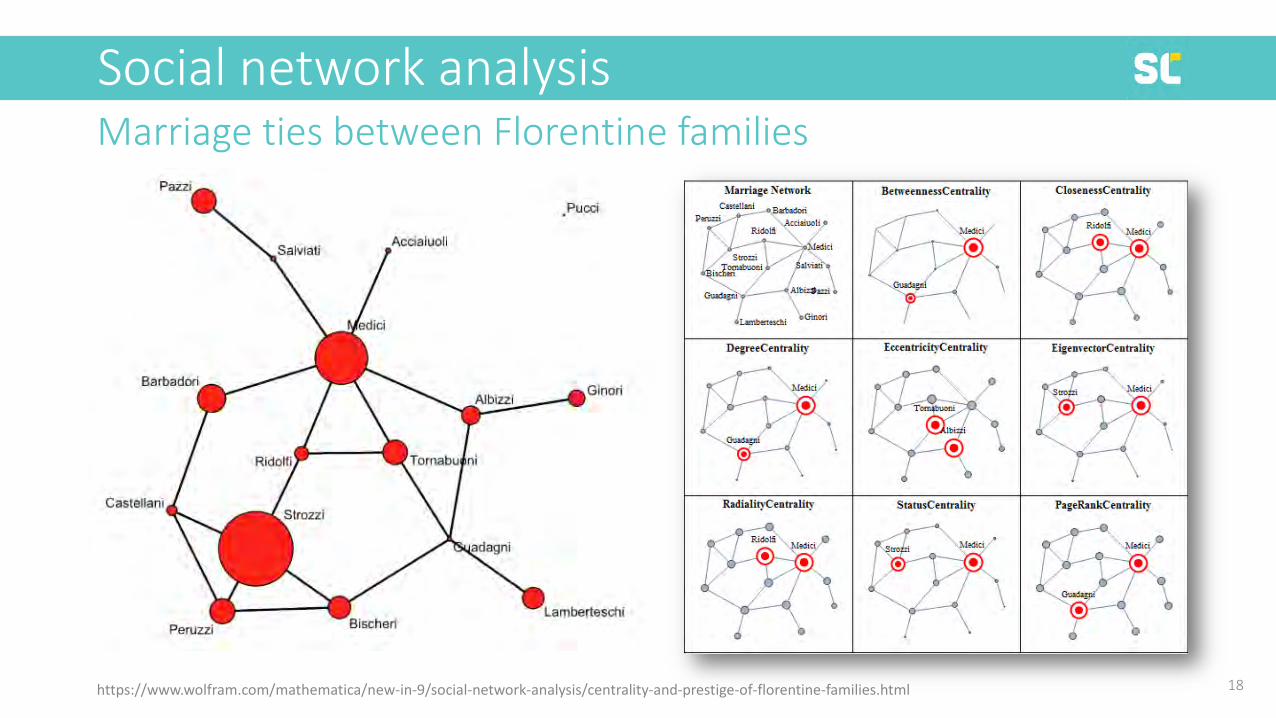
Marriage ties between Florentine families
https://www.wolfram.com/mathematica/new-in-9/social-network-analysis/centrality-and-prestige-of-florentine-families.html

Social network analysis
19
9/11 terrorist network
http://www.orgnet.com/tnet.html

Social network analysis
20
Twitter follower networks
http://allthingsgraphed.com/2014/11/02/twitter-friends-network/
Social network analysis
21
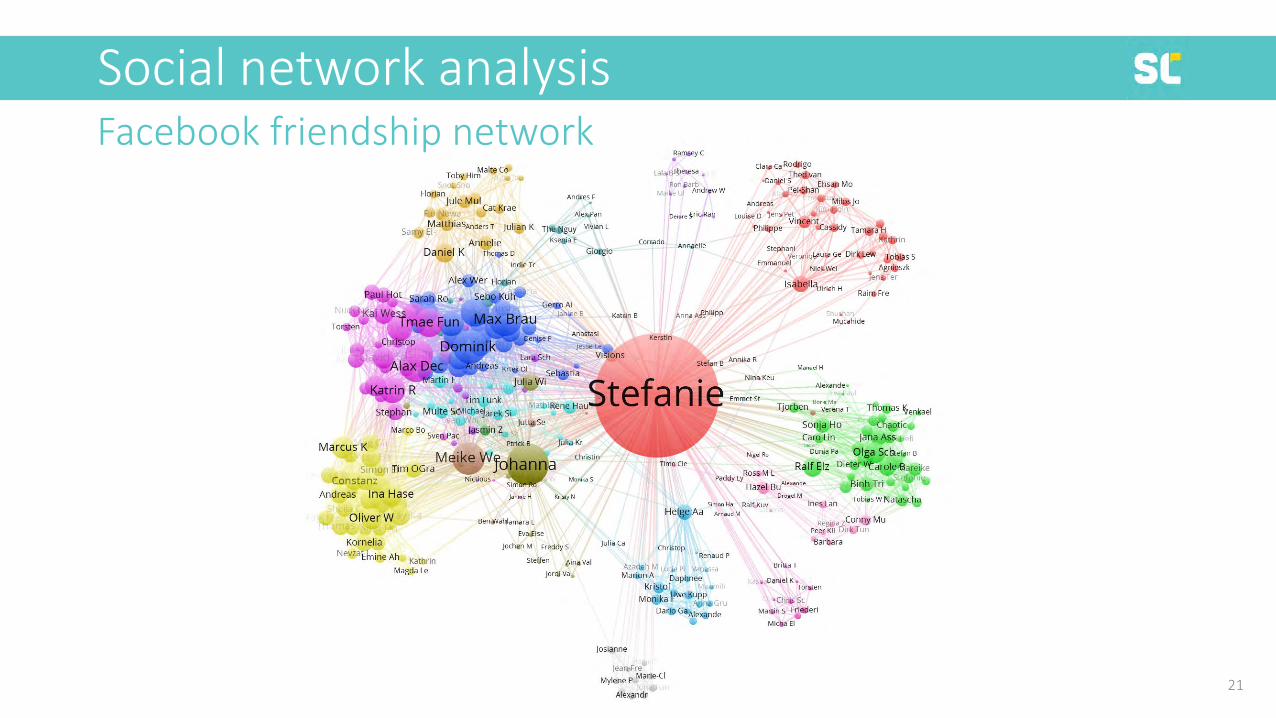
Facebook friendship network

Social network analysis
22
Bibliometric networks
Citation networkof publications
Co-authorship networkof authors or organizations
Co-citation network of publications, authors or journals
Bibliographic coupling network of publications, authors or journals
Co-occurrence networkof terms

Social network analysis
23
Exploring co-authorship networks

Social network analysis
24
Developing collaboration strategies
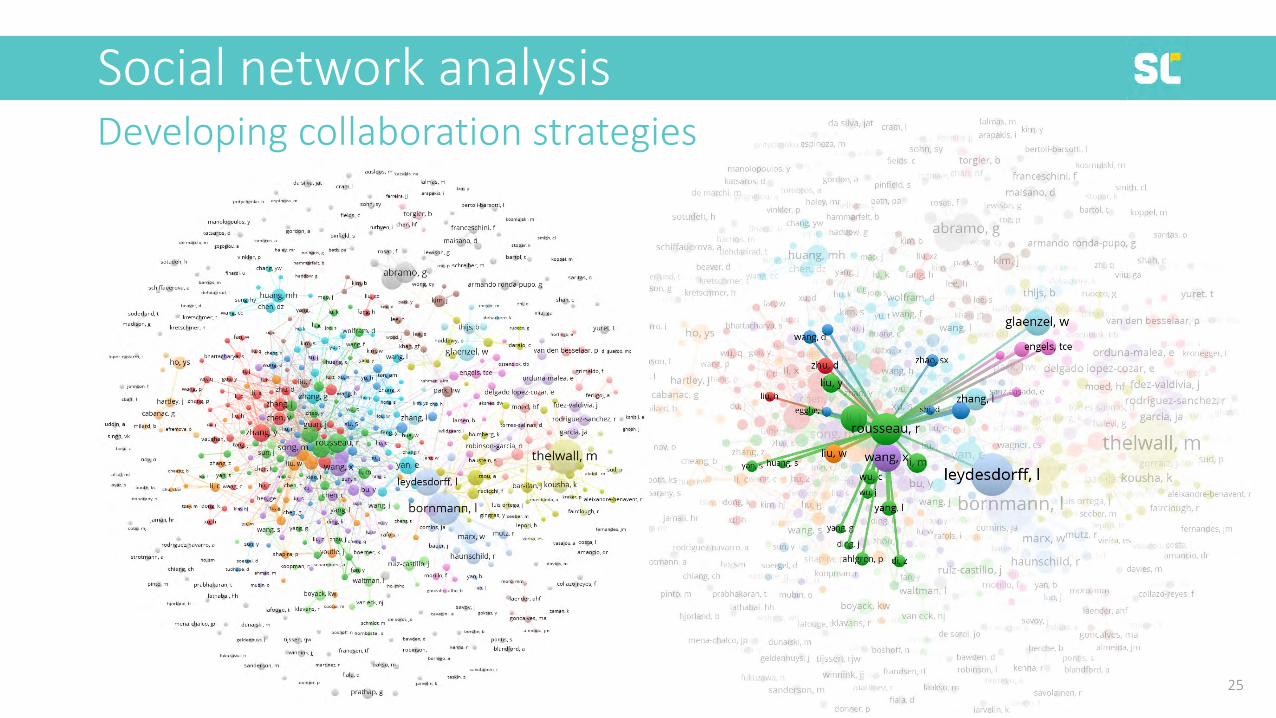
Social network analysis
25
Developing collaboration strategies
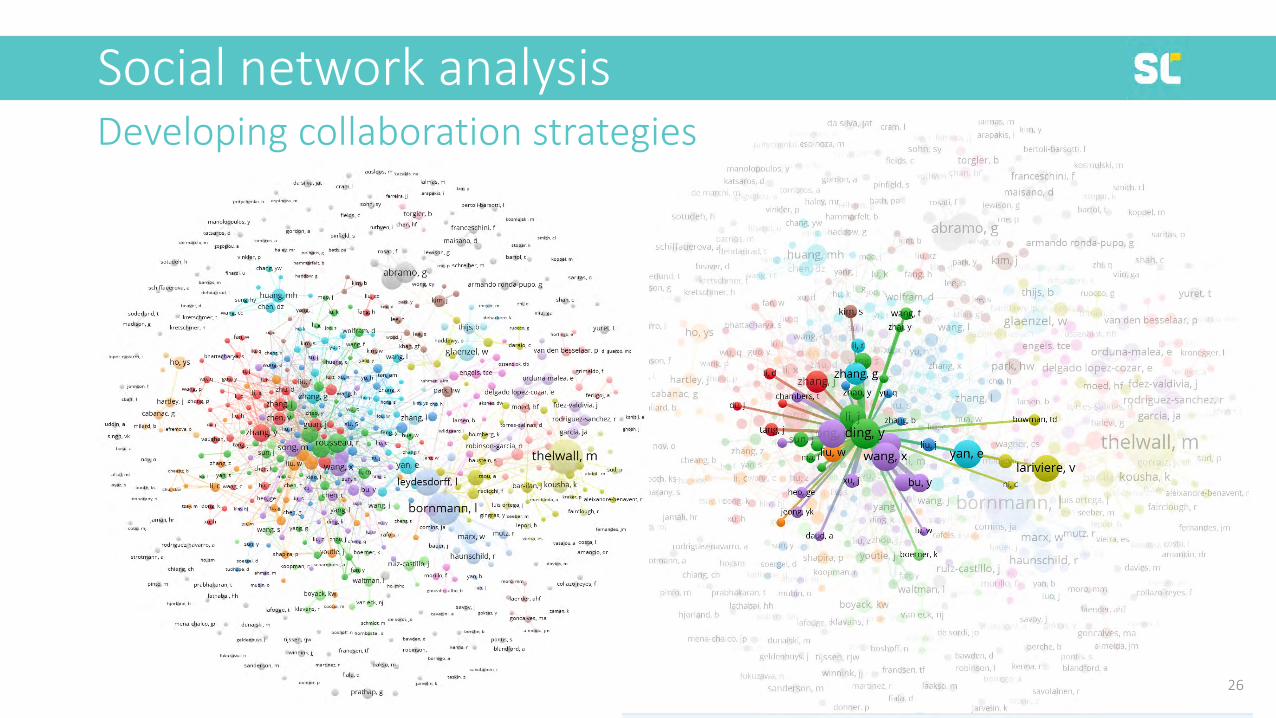
Social network analysis
26
Developing collaboration strategies

Social network analysis
27
Developing collaboration strategies

Social network analysis
28
Developing collaboration strategies

Social network analysis
29
Network indicatorsPurpose of SNA indicators →Comparing network components→Characterizing the network as a whole→ Improve network visualizations
Types of SNA indicators→Network indicators→Node indicators→Edge indicators

Social network analysis
30
Network indicatorsPurpose of SNA indicators →Comparing network components→Characterizing the network as a whole→ Improve network visualizations
Types of SNA indicators→Network indicators→Node indicators→Edge indicators
→Degree centrality→In-degree→Out-degree
→Closeness centrality→Betweenness centrality→Eigenvector centrality

Conclusions
Conclusions
32
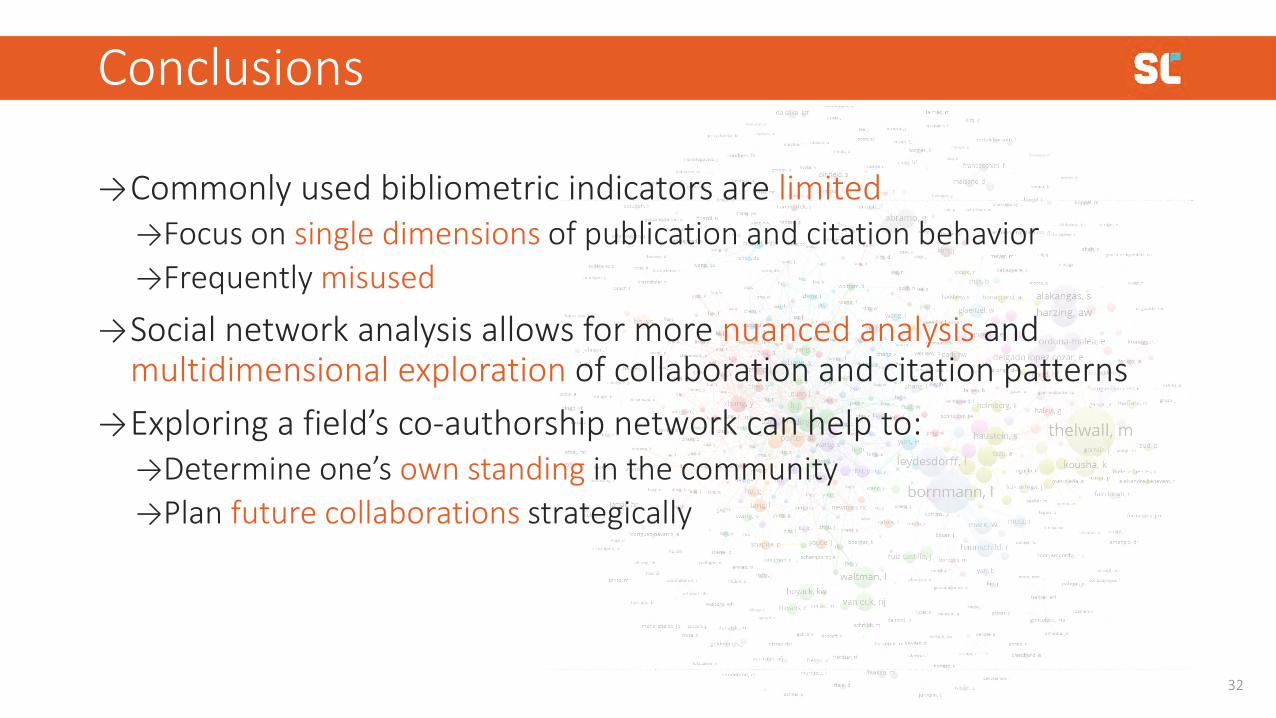
→Commonly used bibliometric indicators are limited→Focus on single dimensions of publication and citation behavior→Frequently misused
→Social network analysis allows for more nuanced analysis and multidimensional exploration of collaboration and citation patterns
→Exploring a field’s co-authorship network can help to:→Determine one’s own standing in the community→Plan future collaborations strategically


