
Exploring the UK s digital divide
24
Page 1 of 24 Next release: To be announced Release date: 4 March 2019 Contact: Paola Serafino [email protected] +44 (0)1633 651538 Article Exploring the UK’s digital divide The scale of digital exclusion in the UK; those who aren’t currently using the internet, how digital skills vary for different groups of the population and some of the barriers to digital inclusion. Table of contents 1. Introduction 2. The scale of digital exclusion in the UK 3. Why does digital exclusion matter? 4. What is the pattern of digital exclusion across the UK? 5. How does internet usage and digital exclusion vary for men and women? 6. How does digital exclusion vary with age? 7. What is the pattern of internet usage among disabled people? 8. How does internet usage vary for different ethnic groups? 9. What other patterns are there in internet usage? 10. What are the barriers to digital inclusion? 11. Annex 12. Sources
Transcript of Exploring the UK s digital divide

Page 1 of 24
Next release: To be announced
Release date: 4 March 2019
Contact: Paola Serafino [email protected] +44 (0)1633 651538
Article
Exploring the UK’s digital divideThe scale of digital exclusion in the UK; those who aren’t currently using the internet, how digital skills vary for different groups of the population and some of the barriers to digital inclusion.
Table of contents
1. Introduction
2. The scale of digital exclusion in the UK
3. Why does digital exclusion matter?
4. What is the pattern of digital exclusion across the UK?
5. How does internet usage and digital exclusion vary for men and women?
6. How does digital exclusion vary with age?
7. What is the pattern of internet usage among disabled people?
8. How does internet usage vary for different ethnic groups?
9. What other patterns are there in internet usage?
10. What are the barriers to digital inclusion?
11. Annex
12. Sources

Page 2 of 24
1.
2.
1 . Introduction
In an increasingly digital age, those who are not engaging effectively with the digital world are at risk of being left behind. Technological change means that digital skills are increasingly important for connecting with others, accessing information and services and meeting the changing demands of the workplace and economy. This is leading to a digital divide between those who have access to information and communications technology and those who do not, giving rise to inequalities in access to opportunities, knowledge, services and goods.
The importance of internet usage is reflected in the (SDGs) . The SDGs 1 Sustainable Development Goals 2
include an indicator for the proportion of individuals who have used the internet in the last three months ( Indicator ). However, it is important to recognise that digital skills are as important as internet usage. Users of the 17.8.1
internet can still be digitally excluded because they lack the skills to be able to confidently and safely navigate the digital world.
This article explores the scale of digital exclusion in the UK and its impact, the characteristics and circumstances of those who are not currently using the internet, how internet use and digital skills vary for different groups of the population and barriers to digital inclusion.
In this article, we use various data sources to explore the UK’s digital divide, as there is no single source that covers all aspects of digital exclusion. Small sample sizes in some cases mean that it is not always possible to achieve the level of granularity we would like, both in terms of the characteristics of different groups and for small groups of the population.
Notes for: Introduction
In this article, internet use refers to those who have used the internet in the last three months, internet access refers to those who are able to access the internet by whatever means (including via a smartphone or through a connection in their homes) and digital skills refers to those skills that are needed to safely and competently use the internet.
The SDGs are a set of 17 goals that are designed to save the planet, end hunger and ensure peace, described as a "to do list for the planet". Each goal focuses on a different part of life including: poverty, education, work, equality, the environment, innovation, justice, and the economy.
2 . The scale of digital exclusion in the UK
The number of adults who have either never used the internet or have not used it in the last three months, described as “internet non-users”, has been declining over recent years. Since 2011, this number has almost halved, but in 2018 there were still 5.3 million adults in the UK, or 10.0% of the adult UK population, in this situation (Figure 1).

Page 3 of 24
1.
1.
2.
3.
4.
5.
Figure 1: The number of internet non-users has declined over time
Number (millions) and percentage of adult internet non-users, UK, 2011 to 2018
Source: Office for National Statistics - Internet Users, Labour Force Survey (LFS)
Notes:
“Internet non-users” refers to those who have never used the internet or last used it more than 3 months ago.
The Tech Partnership Basic Digital Skills framework describes 1 five basic digital skills that can be used to and the activities someone should be able to do to demonstrate each measure digital inclusion (PDF, 3.16MB)
skill. These are:
managing information: using a search engine to look for information, finding a website visited before or downloading or saving a photo found online.
communicating: sending a personal message via email or online messaging service or carefully making comments and sharing information online.
transacting: buying items or services from a website or buying and installing apps on a device.
problem solving: verifying sources of information online or solving a problem with a device or digital service using online help.
creating: completing online application forms including personal details or creating something new from existing online images, music or video.

Page 4 of 24
1.
1.
2.
3.
4.
5.
To be considered to have a digital skill, respondents need to be able to do one of the activities listed under it.
The uses this framework to estimate the digital skills of Lloyds Bank UK Consumer Index 2018 (PDF, 3.16MB)the UK population (for details of the methodology, see “ ”). It estimates that the number of people in the UK Annexlacking basic digital skills is declining, but in 2018, 8% of people in the UK (4.3 million people) were estimated to have zero basic digital skills (are unable to do any of the activities described in the five basic digital skills). A further 12% (6.4 million adults) were estimated to only have limited abilities online (missing at least one of the basic digital skills). Although there is a pattern of declining numbers of people lacking digital skills over time, in 2015, the (CEBR) estimated that 7.9 million people will still lack Centre for Economics and Business Researchdigital skills in 2025 (see ).The economic impact of Basic Digital Skills and inclusion in the UK (PDF, 1.73MB)
Notes for: The scale of digital exclusion in the UK
This has now been replaced by the .Essential Digital Skills framework (PDF, 351KB)
3 . Why does digital exclusion matter?
The internet is being used increasingly across all areas of life. Digital technology offers a number of benefits to the individual, which those who are digitally excluded are missing out on.
The have identified Centre for Economics and Business Research (CEBR) five areas in which individuals who :acquire basic digital skills are able to benefit (PDF, 1.73MB)
earnings benefits: these relate to increased earnings of between 3% and 10% through acquiring digital skills.
employability benefits: this reflects the improved chances of finding work for someone who is unemployed and an increased likelihood that someone who is inactive will look for work.
retail transaction benefits: shopping online has been found to be 13% cheaper on average than shopping in-store.
communication benefits: basic digital skills can enable people to connect and communicate with family, friends and the community 14% more frequently.
time savings: these relate to the time saved by accessing government services and banking online rather than in person, estimated to be about 30 minutes per transaction.
In terms of earnings and employability benefits, the identified Artificial Industrial Strategy (PDF, 8.5MB)Intelligence and Data as an important challenge and opportunity for creating good quality jobs and driving economic growth. In 2016 it was estimated that within the next 10 to 20 years, 90% of jobs will require some sort
and in the Lloyds Bank research, of digital skills (PDF, 735KB) half of those online indicated that the internet had . This highlights that the digitally excluded will be increasingly at a helped them find a job (PDF,3.1 MB)
disadvantage in the employment market unless they are specifically catered for.
Figure 2 shows the main activities of all adult internet users in 2018. The top four activities undertaken were sending or receiving emails (84%), finding information about goods or services (77%), internet banking (69%) and social networking (65%), reflecting three of the benefits identified by the CEBR (retail transaction benefits, communication benefits and time savings).

Page 5 of 24
1.
2.
3.
Figure 2: The most popular activities of adult internet users were sending or receiving emails, finding out about goods or services, internet banking and social networking
Percentage of internet users by activity undertaken, Great Britain, 2018
Source: Office for National Statistics - Internet Access, Opinions and Lifestlye Survey (OPN)
Notes:
“Internet users” refers to those who have used the internet in the last 3 months.
(eg injury, disease, nutrition, improving health etc).
(eg Skype or Facebook).

Page 6 of 24
The communications benefits were also reflected in the results of the Lloyds Bank research. 40% of online respondents indicated that being online helps them feel less alone, a benefit that is felt even more strongly among disabled people online, who are 27% more likely to express this view than non-disabled people (PDF, 3.16
.MB)
The outlines the Government’s aim to become a world leader in serving its citizens UK Digital Strategy 2017online, using digital technology to improve services in the UK, and there is evidence of growing use of the internet to interact with public authorities or services (Figure 3).
Figure 3: The internet is increasingly being used to interact with public authorities or services
Percentage of internet users by type of interaction, Great Britain, 2018
Source: Office for National Statistics - Internet Access, Opinions and Lifestlye Survey (OPN)
The increasing use of the internet for these activities has implications for those who are not equipped to take advantage of this technology, or are unwilling to do so. The prevalence of internet banking and provision of government services online in particular raises questions about whether these services will continue to be made available to those wanting to engage with them in person and highlights the continuing need for this type of provision.

Page 7 of 24
1.
4 . What is the pattern of digital exclusion across the UK?
Patterns of internet usage vary across the UK regions. A decline in the percentage of internet non-users across all UK regions since 2012 has led to some narrowing of the gap in regional internet usage in 2018 (Figure 4), however a digital disparity persists across areas of the UK. London has the lowest proportion of internet non-users (7.0%) while Northern Ireland continues to have the highest proportion (14.2%), followed by the North East of England (12.1%).
Figure 4: The percentage of internet non-users in the different UK regions has declined since 2012 leading to some narrowing of the regional gap
Percentage population of internet non-users by region, UK, 2012 and 2018
Source: Office for National Statistics - Internet Users, Labour Force Survey (LFS)
Notes:
“Internet non-users” refers to those who have never used the internet or last used it more than 3 months ago.

Page 8 of 24
1.
Figure 5: Regional variation in the proportion of the population with the five basic digital skills
Percentage population by region, UK, 2018
Source: Lloyds Bank UK Consumer Digital Index, 2018
Notes:
Regional breakdowns are not available for Northern Ireland because the base is too small.

Page 9 of 24
1.
Figure 6: Regional variation in proportion of population with zero basic digital skills
Percentage population by region, UK, 2018
Source: Lloyds Bank UK Consumer Digital Index, 2018
Notes:
Regional breakdowns are not available for Northern Ireland because the base is too small.

Page 10 of 24
1.
There is also regional variation in basic digital skills (Figures 5 and 6). In 2018, Wales had the lowest proportion of people with all five basic digital skills (66%) and the highest proportion of those with zero basic digital skills (19%), while the reverse was true for the South East of England (86% and 5% respectively). The demographic composition of these areas may well play a part in this difference (see Sections 5, 6, 7 and 8 for differences by demographic characteristics).
5 . How does internet usage and digital exclusion vary for men and women?
Although the number of internet non-users has been declining, in 2018, 58% (3.1 million) of these were women, a proportion that has remained broadly consistent over time (Figure 7).
Figure 7: Women have consistently made up over half of internet non-users, although the overall number has declined over time
Number in millions by sex and percentage of women adult internet non-users, UK, 2011 to 2018
Source: Office for National Statistics - Internet Users, Labour Force Survey (LFS)
Notes:
“Internet non-users” refers to those who have never used the internet or last used it more than three months ago.
There is also a disparity between men and women in digital skills. Of those having zero basic digital skills in .2018, 61% were women (PDF, 3.16MB)

Page 11 of 24
1.
6 . How does digital exclusion vary with age?
In 2018, 12% of those aged between 11 and 18 years (700,000) reported having no internet access at home from , while a further 60,000 reported having no home internet access at all. Of a computer or tablet (PDF, 3.16MB)
those in this age group, 68% who did have home internet access reported that they would find it difficult to complete school work without it, suggesting that there may be educational implications for those without internet access.
Since 2011, adults over the age of 65 years have consistently made up the largest proportion of the adult internet non-users, and over half of all adult internet non-users were over the age of 75 years in 2018 (Figure 8). This reflects the pattern of the younger generations becoming more likely to be frequent internet users.
Figure 8: An increasing proportion of internet non-users are over the age of 65 years
Age composition of internet non-users, UK, 2011 to 2018
Source: Office for National Statistics - Internet Users, Labour Force Survey (LFS)
Notes:
“Internet non-users” refers to those who have never used the internet or last used it more than 3 months ago.
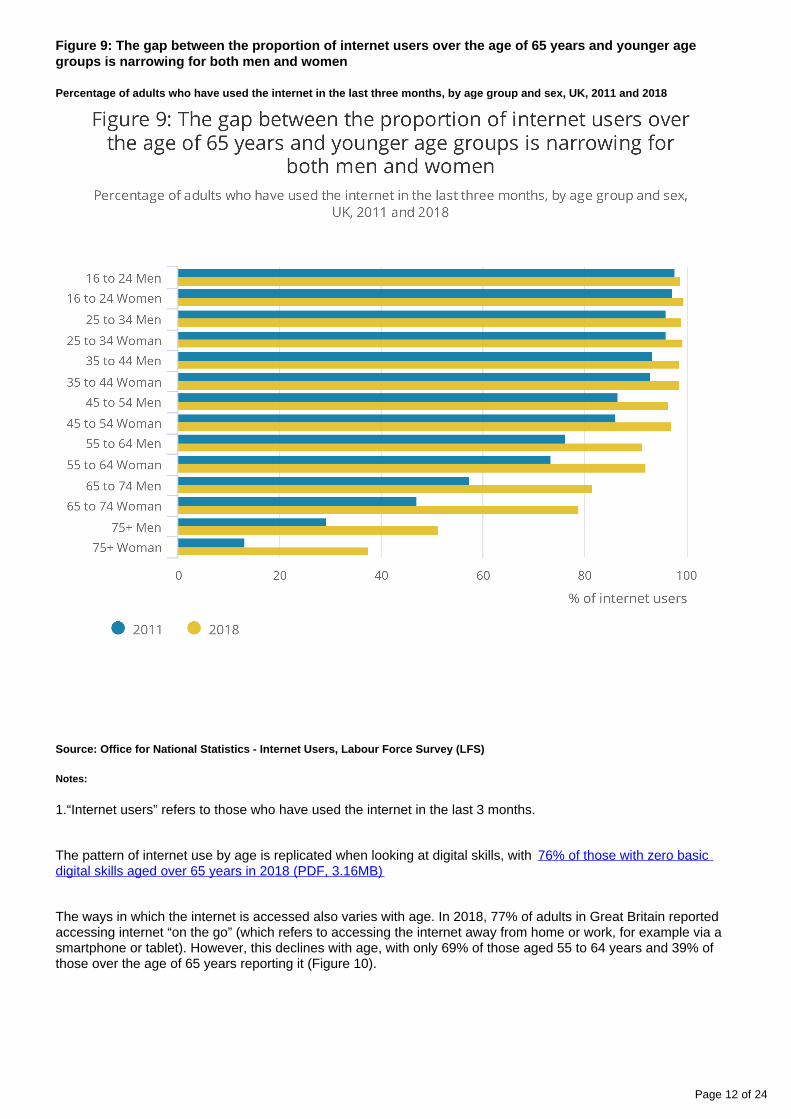
However, the generational divide in those using the internet regularly is narrowing (Figure 9), although women in the older age groups continue to lag behind men.
Page 12 of 24
Figure 9: The gap between the proportion of internet users over the age of 65 years and younger age groups is narrowing for both men and women
Percentage of adults who have used the internet in the last three months, by age group and sex, UK, 2011 and 2018
Source: Office for National Statistics - Internet Users, Labour Force Survey (LFS)
Notes:
1.“Internet users” refers to those who have used the internet in the last 3 months.
The pattern of internet use by age is replicated when looking at digital skills, with 76% of those with zero basic digital skills aged over 65 years in 2018 (PDF, 3.16MB)
The ways in which the internet is accessed also varies with age. In 2018, 77% of adults in Great Britain reported accessing internet “on the go” (which refers to accessing the internet away from home or work, for example via a smartphone or tablet). However, this declines with age, with only 69% of those aged 55 to 64 years and 39% of those over the age of 65 years reporting it (Figure 10).

Page 13 of 24
1.
Figure 10: Fewer adults report accessing internet “on the go” in the older age groups
Percentage adults accessing internet “on the go” by age group, Great Britain, 2018
Source: Office for National Statistics - Internet Access, Opinions and Lifestlye Survey (OPN)
Notes:
'On the go' refers to accessing the internet away from home or work.
The pattern of increasing internet usage among the older age groups is important given that the UK’s population is ageing (see ). However, it is difficult to know Living Longer: how our population is changing and why it mattershow this will affect the digital engagement of future generations. While those in the older age groups in the future will be part of a generation who are more digitally engaged than their predecessors, this may not persist as they age. For some, health problems as they age could lead to a decline in digital engagement, particularly if ageing impacts on cognitive ability. Technology may also change again so that the digital skills they have developed through their life will no longer be the skills that are needed. However, it is also possible that technology in the future may enable the older age groups to engage more easily than is currently the case. This can already be seen, for example, in the development of voice activated internet services that remove the need for specific skills. Part of the challenge will therefore involve ensuring that support is available to help the older generation make the best use of new technology.

Page 14 of 24
1.
2.
7 . What is the pattern of internet usage among disabled people?
Across all age groups, disabled adults make up a large proportion of adult internet non-users (Figure 11). In 2017, 56% of adult internet non-users were disabled, much higher than the proportion of disabled adults in the UK population as a whole, which in 2016 to 2017 was estimated to be 22% (see Family Resources Survey 2016
). For internet non-users aged between 16 and 24 years, 60% were disabled in 2017, a proportion that is the /17same as for those aged 75 years and older.
Figure 11: Across all age groups, a large proportion of adult internet non-users are disabled
Composition of adult internet non-users by disability and age group, UK, 2017
Source: Office for National Statistics - Internet Users, Labour Force Survey (LFS)
Notes:
“Internet non-users” refers to those who have never used the internet or last used it more than 3 months ago.
Disability is defined using the Government Statistical Service (GSS) harmonised definition for the Statistical Measures of Disability, as someone who has a current physical or mental health condition(s) or illness(es) lasting or expected to last 12 months or more and that limits their ability to carry out day-to-day activities.
Though the percentage of disabled adults not using the internet has been declining, in 2018, it was 23.3% compared with only 6.0% of those without a disability (Figure 12).

Page 15 of 24
1.
2.
Figure 12: The proportion of disabled adults who are internet non-users has been declining since 2014 but remains higher than for non-disabled adults
Percentage of disabled and non-disabled adults who are internet non-users, UK, 2014 to 2018
Source: Office for National Statistics - Internet Users, Labour Force Survey (LFS)
Notes:
“Internet non-users” refers to those who have never used the internet or last used it more than 3 months ago.
Disability is defined using the Government Statistical Service (GSS) harmonised definition for the Statistical Measures of Disability, as someone who has a current physical or mental health condition(s) or illness(es) lasting or expected to last 12 months or more and that limits their ability to carry out day-to-day activities.
There is also a difference in the percentage of disabled people accessing internet “on the go” compared with non-disabled people. In 2018, the figure was 59% for disabled people compared with 82% for those without a disability.
8 . How does internet usage vary for different ethnic groups?
Across the ethnic groups for which breakdowns were available, the proportion of people who have either never used the internet or have not used it in the last three months came down between 2011 and 2018 (Figure 13). In 2011, there were wide disparities in recent internet use among the different ethnic groups, however, in 2018, this gap had narrowed. This is particularly the case for adults of Bangladeshi ethnicity. In 2011, 31.4% of them were internet non-users, higher than the figure for UK adults overall (20.3%). In 2018, the figure for Bangladeshi internet non-users had dropped to 8.0%, a figure that is now lower than for the UK overall (10.0%).

Page 16 of 24
1.
Figure 13: The ethnicity gap in internet usage has narrowed over time as the proportion of internet non-users has declined
Percentage of internet non-users by ethnic group, UK, 2011 to 2018
Source: Office for National Statistics - Internet Users, Labour Force Survey (LFS)
Notes:
“Internet non-users” refers to those who have never used the internet or last used it more than three months ago.

Page 17 of 24
9 . What other patterns are there in internet usage?
Among those of working age, the economically inactive are the most likely to be internet non-users (Figure 14), particularly those adults on long-term sick leave or disabled, as might be expected given the patterns among disabled people.

Page 18 of 24
1.
2.
3.
Figure 14: Among working age adults, a higher proportion of the economically inactive are internet non-users than those with other economic activities
Percentage of working age adults who are internet non-users by economic activity status, UK, 2018
Source: Office for National Statistics
Notes:
“Internet non-users” refers to those who have never used the internet or last used it more than 3 months ago.
Economically inactive people are those of working age who are not in employment but do not meet the internationally accepted definition of unemployed because they have not been seeking work within the last four weeks and/or they are unable to start work within the next two weeks. It includes those looking after a home, students or family and temporarily sick and disabled people.
Long-term sick leave relates to health conditions that last 12 months or more.
There is also evidence to suggest that those on low incomes are less likely to have an internet connection in the home (Figure 15).

Page 19 of 24
Figure 15: The percentage of households with an internet connection increases with income
Percentage of households with internet connection by annual household income band, Scotland, 2014
Source: Carnegie Trust
Although the percentage of households without an internet connection has generally been declining, those who live alone are less likely to have an internet connection at home, than their peers (Figure 16). In 2018, 9% of households with a single adult aged between 16 and 64 years did not have an internet connection, compared with only 1% of households with two adults aged between 16 and 64 years. Similarly, 41% of households with a single adult aged 65 years and over had no household internet connection compared with 13% of households with two adults, at least one of whom was 65 years or older.

Page 20 of 24
Figure 16: A higher percentage of lone households with an adult aged 65 and over don't have an internet connection
Percentage of households without an internet connection, Great Britain, 2012 to 2018
Source: Office for National Statistics - Internet Access, Opinions and Lifestlye Survey (OPN)
It is important to note that these results do not include the non-private household population, which includes those living in caravans, communal establishments, temporary accommodation and homeless people. It is likely that many of these will not have an internet connection within the household, though may have access to the internet via smartphones and tablets.
10 . What are the barriers to digital inclusion?
Figure 17 shows the reasons given for not having internet access in the household in 2017. The most common reason given was that they didn’t need it (64%), followed by a lack of skills (20%), 2% also identified a physical or sensorial disability as a reason.

Page 21 of 24
Figure 17: The most common reason for not having internet access in the household is a perceived lack of need, followed by a lack of skills
Percentage of households by reason for not having household internet access, Great Britain, 2017
Source: Office for National Statistics - Internet Access, Opinions and Lifestlye Survey (OPN)
The barriers to digital inclusion can be seen most clearly when looking at the groups that have been identified as least likely to have used the internet in the last three months or those lacking digital skills. In line with the reasons given for not having internet access in the household, among these groups, a lack of inclination and a lack of skills are frequently reported as reasons for not having engaged with the digital world.
A lack of inclination is particularly prevalent among the older age groups. In 2018, 84% of those over the age of . Similarly, 38% of disabled people who are 60 years said that nothing could help them get online (PDF, 3.16MB)
not using the internet reported that . These views may in part the internet does not interest them (PDF, 3.16MB)reflect a lack of understanding of the benefits, for example, that they may be paying more for some goods and services.

Page 22 of 24
1.
Figure 18 shows the reasons given by disabled and non-disabled people when asked about their reasons for not buying goods or services online. A lower percentage of disabled people indicated that they prefer to shop in person (65% compared with 73% for non-disabled people). This suggests that some disabled people could benefit from shopping online by gaining access to a wider range of goods and services. A higher percentage of disabled people identified security or privacy concerns as a reason (28%) compared with non-disabled people. Almost double the percentage of disabled respondents identified a lack of skills or knowledge as a reason (29%) compared with non-disabled respondents (15%). The security or privacy concerns suggest that there may be some apprehension in using the internet for buying goods and services.
Figure 18: A higher percentage of disabled respondents reported a lack of skills or knowledge as a reason for not buying goods and services online than non-disabled respondents
Percentage of disabled and non-disabled adults by reason for not buying goods and services online, Great Britain, 2017
Source: Office for National Statistics - Internet Access, Opinions and Lifestlye Survey (OPN)
Notes:
Disability is defined using the Equality Act 2010 definition, as someone who has a current physical or mental health condition(s) or illness(es) lasting or expected to last 12 months or more and that limits their ability to carry out day-to-day activities.
A lack of skills has also been reported by many older people who express the feeling that it is simply too late in life for them to start learning digital skills, saying that since they have always managed perfectly well without a computer or internet access, they see no reason to start using them now ( , Ofcom, 2017 (PDF, 1.43MB) BT and
, and ) . This again suggests that they may not realise RNIB, 2012 (PDF, 1.48MB) Age UK, 2013 (PDF, 1002KB)the benefits that being online may offer although it may also reflect that they consider the benefits are insufficient to justify the effort.

Page 23 of 24
Accessibility can also be an issue for these groups. Lower rates of internet usage among the older age groups may in part reflect the fact that they are more affected by access issues associated with age, such as poor
. In 2018, 5% of those not using the internet also eyesight (PDF, 1.48MB) reported that their disability prevented .them from doing so (PDF, 3.16MB)
While digital inclusion has been increasing in recent years and there are some clear benefits for both the individual and wider society, some people remain digitally excluded. This is particularly the case among certain groups, including older people and disabled people as well as potentially those not living in private households and who are unlikely to be well reflected in this analysis. The barriers to digital inclusion suggest part of the education for digital skills may need to start by highlighting the benefits of being online and overcoming any apprehension to engagement. However, the fact that people remain digitally excluded also highlights the importance of ensuring that non-digital alternatives continue to be made available to enable everyone to participate fully in society.
11 . Annex
The Lloyds Bank uses a number of sources to produce its UK Consumer Digital Index 2018 (PDF, 3.16MB)estimates. Behavioural data comes from a UK representative sample of 1 million consumers aged 18 years and over based on 12 months of transactional behaviour, including a longitudinal element to understand changes in digital capability over the past year. 4,073 quantitative surveys were conducted by Ipsos MORI for basic digital skills for those aged 15 years and over and a further 1,006 on young people aged 11 to 18 years. More than 2,700 adults were followed up from the 1 million sample in a telephone interview to assess digital attitudes and capabilities.
12 . Sources
Age UK, (2013)Digital Inclusion Evidence Review
British Telecom and the Royal National Institute for the Blind, Tackling digital exclusion: Older blind and partially (2012)sighted people and the internet
Carnegie Trust and Ipsos MORI Scotland, (2016),The role of digital exclusion in social exclusion
Centre for Economics and Business Research (CEBR), The economic impact of Basic Digital Skills and inclusion (2015)in the UK
Department for Digital, Culture, Media and Sport, (2017)UK Digital Strategy
Department for Work and Pensions, (2018)Family Resources Survey 2016/17
HM Government, (2017)Industrial Strategy
Lloyds Bank (2018)UK Consumer Digital Index 2018
Ofcom, (2017),The Communications Market: UK [5. Internet and online content]
Office for National Statistics, (2018), Opinions and Lifestyle SurveyInternet Access
Office for National Statistics, (2018), Labour Force SurveyInternet Users

Page 24 of 24
Skills Funding Agency, (2016)Review of publicly funded digital skills qualifications


