Exploring the Relationship Between Intrinsic Motivation ...
66
Dartmouth College Dartmouth College Dartmouth Digital Commons Dartmouth Digital Commons Dartmouth College Undergraduate Theses Theses, Dissertations, and Graduate Essays Spring 6-1-2021 Exploring the Relationship Between Intrinsic Motivation and Exploring the Relationship Between Intrinsic Motivation and Receptivity to mHealth Interventions Receptivity to mHealth Interventions Sarah Hong [email protected] Follow this and additional works at: https://digitalcommons.dartmouth.edu/senior_theses Part of the Graphics and Human Computer Interfaces Commons Recommended Citation Recommended Citation Hong, Sarah, "Exploring the Relationship Between Intrinsic Motivation and Receptivity to mHealth Interventions" (2021). Dartmouth College Undergraduate Theses. 214. https://digitalcommons.dartmouth.edu/senior_theses/214 This Thesis (Undergraduate) is brought to you for free and open access by the Theses, Dissertations, and Graduate Essays at Dartmouth Digital Commons. It has been accepted for inclusion in Dartmouth College Undergraduate Theses by an authorized administrator of Dartmouth Digital Commons. For more information, please contact [email protected].
Transcript of Exploring the Relationship Between Intrinsic Motivation ...

Dartmouth College Dartmouth College
Dartmouth Digital Commons Dartmouth Digital Commons
Dartmouth College Undergraduate Theses Theses, Dissertations, and Graduate Essays
Spring 6-1-2021
Exploring the Relationship Between Intrinsic Motivation and Exploring the Relationship Between Intrinsic Motivation and
Receptivity to mHealth Interventions Receptivity to mHealth Interventions
Sarah Hong [email protected]
Follow this and additional works at: https://digitalcommons.dartmouth.edu/senior_theses
Part of the Graphics and Human Computer Interfaces Commons
Recommended Citation Recommended Citation Hong, Sarah, "Exploring the Relationship Between Intrinsic Motivation and Receptivity to mHealth Interventions" (2021). Dartmouth College Undergraduate Theses. 214. https://digitalcommons.dartmouth.edu/senior_theses/214
This Thesis (Undergraduate) is brought to you for free and open access by the Theses, Dissertations, and Graduate Essays at Dartmouth Digital Commons. It has been accepted for inclusion in Dartmouth College Undergraduate Theses by an authorized administrator of Dartmouth Digital Commons. For more information, please contact [email protected].

Exploring the Relationship Between Intrinsic Motivation andReceptivity to mHealth Interventions
Sarah HongUndergraduate Thesis in Computer Science
Dartmouth College
1 June 2021
Abstract
Recent research in mHealth has shown the promise of Just-in-Time Adaptive Interventions (JITAIs).JITAIs aim to deliver the right type and amount of support at the right time. Choosing the right deliverytime involves determining a user’s state of receptivity, that is, the degree to which a user is willing toaccept, process, and use the intervention provided.
Although past work on generic phone notifications has found evidence that users are more likely torespond to notifications with content they view as useful, there is no existing research on whether users’intrinsic motivation for the underlying topic of mHealth interventions affects their receptivity. In thiswork, we explore whether relationships exist between intrinsic motivation and receptivity across topicsand within topics for mHealth interventions. To this end, we conducted a study with 20 participants over3 weeks, where participants received interventions about mental health, COVID-19, physical activity,and diet & nutrition. The interventions were delivered by the chatbot-based iOS app called Elena+, andvia the MobileCoach platform.
Our exploratory analysis found that significant differences in mean intrinsic motivation scores acrosstopics were not associated with differences in mean receptivity metrics across topics. We also found thatpositive relationships exist between intrinsic motivation measures and receptivity for interventions abouta topic.
1 Introduction
The ubiquity of smartphones and wearables, coupled with advances in built-in sensor technology, has ledto a wide array of research opportunities and applications for mobile health (mHealth). mHealth aimsto use mobile and wireless technologies to deliver effective interventions that improve health outcomes.Researchers have designed various smartphone-based interventions to promote outcomes such as reducingsmoking, increasing physical activity, eating healthier, and improving mental health [31, 12, 22, 3].
Recent mHealth studies have used Just-In-Time Adaptive Interventions (JITAIs) to promote positivebehavioral changes. JITAIs provide the right type and amount of support, at the right time, depending onthe individual’s changing internal and contextual state [17]. For JITAIs to be delivered at the correct time,a person must receive an intervention when entering a state of vulnerability or opportunity, and when in astate of receptivity.
Recipients are in a state of vulnerability when they are susceptible to negative health outcomes, such assomeone suffering from an alcohol disorder experiencing an alcohol craving [17]. Designers of JITAIs canuse Ecological Momentary Assessments (EMAs) and sensor data to determine when someone enters a stateof vulnerability. For example, a mood assessment or GPS coordinates approaching a location associatedwith past alcohol abuse can indicate an alcohol craving. Conversely, recipients are in a state of opportunity
1

when they are susceptible to positive health behavior changes. SitCoach is a JITAI that identifies 30 min-utes of uninterrupted computer time as a teachable moment to inform a worker about his/her sedentarism.After detecting this state of opportunity, SitCoach delivers messages encouraging the worker to be moreactive [35]. The design of JITAIs assumes that a recipient will be more likely to interact with – and benefitfrom – interventions delivered during a state of vulnerability or opportunity [17].
Determining the right time to deliver a JITAI also involves discerning an individual’s state of receptivity,which is a person’s ability to receive, process, and use the intervention support [17]. For example, if a personignores an intervention prompt, he/she is not receptive. Receptivity may be determined by intrinsic factorssuch as age and personality, and contextual factors such as a person’s location, current activity, or stresslevel [12]. Delivering support when a person is not receptive could possibly reduce a person’s motivationto continue engaging with the intervention, by adding to a person’s intervention fatigue. Several studieshave shown that individuals use mHealth resources only a few times before abandoning them, decreasingthe effectiveness of such interventions [10]. Providing support when a recipient is receptive may decreaseintervention fatigue and increase intervention engagement, resulting in improved adherence to mHealthinterventions [17].
Previous research on generic phone notifications has demonstrated the relationship between individuals’perceptions of notification content and receptivity. People tend to be more receptive towards notificationswith content they view as important, urgent, or useful [16]. When people choose whether to process anotification, the content of the notification can outweigh the timing of the notification as a deciding factor [7].Modeling an individual’s past interest with notification content can improve the precision of predicting theengagement rate of notifications [20].
There is little existing research on whether an individual’s intrinsic motivation towards the content ofmHealth interventions affects receptivity, however. Intrinsic motivation, the most autonomous form of mo-tivation, involves doing an activity for the inherent satisfaction of the activity itself. Intrinsic motivation andgreater internalization of behavioral goals has been associated with better retention and behavioral healthoutcomes including greater adherence to medications [36], better long-term maintenance of weight lossamong obese patients [37], improved glucose control among diabetics [36], and greater attendance in analcohol addiction treatment program [30].
In the work reported herein, we study whether there are relationships between intrinsic motivation andreceptivity for mHealth interventions about various topics. We explore variation in intrinsic motivationacross topics, looking at whether individuals who express higher intrinsic motivation for a certain healthtopic on average have greater receptivity for digital interventions about that topic compared to other topics.Additionally, we will study within-topic variation in intrinsic motivation, to determine whether individualswho express high intrinsic motivation for a topic on average have greater receptivity compared to individualswho express low intrinsic motivation for that topic.
If either across-topic or within-topic relationships exist between intrinsic motivation and receptivity, de-signers of JITAIs could tailor intervention content to support the psychological needs that enhance intrinsicmotivation. According to the self-determination theory, social and contextual factors that support the threeinnate psychological needs of autonomy, competence, and relatedness can promote intrinsic motivation andwell-being [27]. Goal-setting [13] and motivational interviewing [24] can be incorporated into interventionsto increase intrinsic motivation and internalization of behavior [14].
We conducted a 21-day study in which participating volunteers received three digital coaching interven-tions a day, delivered at random times within a morning, afternoon, and evening time interval. The inter-ventions were delivered using an app and mobile system designed to detect moments of receptivity [12].We grouped the coaching sessions into four intervention topics, including mental health, COVID-19, phys-ical activity, and diet & nutrition. On a weekly basis, we surveyed participants with an Intrinsic Moti-vation Inventory containing the subscales of interest/enjoyment, perceived competence, perceived choice,and value/usefulness for each intervention topic. We then analyzed participants’ receptivity to interven-
2

tion initiating messages to explore the relationships between intrinsic motivation and receptivity to mHealthinterventions.
The metrics for evaluating participants’ receptivity to intervention messages include (1) overall responserate, i.e., the fraction of initiating messages a participant read and responded to, (2) just-in-time responserate, i.e., the fraction of initiating messages a participant read and responded to within ten minutes of de-livery, (3) conversation rate, i.e., the fraction of interventions a participant fully engaged in and completed,and (4) response delay, i.e., the length of time between when the message was sent and when the participantresponded [12]. We formulate the following hypotheses:
• H1: When a participant has a higher intrinsic motivation score for an intervention topic, the partici-pant’s average overall response rate to messages about that topic will be higher than for other topics.
• H2: When a participant has a higher intrinsic motivation score for an intervention topic, the partici-pant’s average response delay for interventions about that topic will be lower than for other topics.
• H3: The higher a participant’s intrinsic motivation score for a topic, the higher the likelihood that theparticipant responds to messages for that topic.
• H4: The higher a participant’s intrinsic motivation score for a topic, the lower the response delay forinterventions about that topic.
2 Background
In this section, we discuss the Self-Determination Theory, which defines intrinsic motivation and the socialcontextual factors that support it. We then describe the Intrinsic Motivation Inventory, a survey used inhealth studies to measure participants’ level of intrinsic motivation. Finally, we define the metrics used inour study to measure an individual’s state of receptivity.
2.1 Self-Determination Theory
Self-Determination Theory (SDT) is a broad framework for understanding human motivation and person-ality [27]. SDT defines intrinsic motivation as doing an activity for the inherent satisfaction of the activityitself, while extrinsic motivation involves performing an activity to attain some separable outcome [27]. Asan organismic theory, SDT assumes people are inherently intrinsically motivated, meaning they naturallystrive to learn, master new skills, and develop their sense of self [27].
These proactive tendencies are not automatic. SDT argues that individuals must satisfy three innate psy-chological needs – autonomy, competence, and relatedness – to enhance self-motivation and well-being [27].Autonomy involves having an internal perceived locus of causality, the idea that one’s behavior is self-determined. Competence refers to the feeling of mastery, the belief that one can develop and succeed.Relatedness entails feeling a sense of connection to others and belonging to a social group [28]. Thwartingany of these three psychological needs can hinder self-motivation, social functioning, and personal well-being [27].
Cognitive Evaluation Theory (CET) is a subtheory within SDT that interprets results from laboratoryexperiments testing whether external rewards affect intrinsic motivation [27, 8]. The principles of CET onlyapply to activities that individuals are intrinsically motivated to perform, such as activities that hold someintrinsic interest or appeal. CET suggests that social environments can increase or decrease intrinsic mo-tivation by supporting or thwarting people’s basic psychological needs [27]. Extrinsic rewards or pressurethat contribute to an external perceived locus of causality diminish intrinsic motivation [4]. In contrast,
3

opportunities for choice and self-direction that increase the feeling of autonomy were found to enhance in-trinsic motivation [4]. Additionally, feedback and rewards that contribute towards feelings of competenceduring an action enhance intrinsic motivation for that action, while negative performance feedback dimin-ishes it [4]. In studies of infants [9] and students [1], participants exhibited greater intrinsic motivation incontexts characterized by a sense of security and relatedness, compared to contexts where the participant isignored.
A subtheory within SDT, organismic integration theory (OIT), describes the different forms of extrinsicmotivation as falling along a continuum of self-determination, the degree that motivation emanates from theself [27]. The self-determination continuum increases from left to right, with amotivation on the far left,followed by four forms of extrinsic motivation, and intrinsic motivation on the far right [27]. When peopleare in a state of amotivation, they either do not act at all or act without intent. Amotivation stems fromnot valuing an activity, not feeling competent to perform it, or not expecting the activity to yield a desiredresult [27]. Intrinsic motivation involves people performing an activity because of interest and enjoyment,unlike actions characterized by extrinsic motivation that are performed because of a perceived sense ofvalue [28].
The least autonomous form of extrinsic motivation, external regulation, concerns behaviors driven byexternal rewards and punishments. Individuals experiencing externally regulated behavior typically inter-pret their actions as having an external perceived locus of causality [27]. Introjected regulation describesextrinsic motivation that has been partially internalized but not integrated. Internalization refers to “takingin” a value or regulation of behavior. Integration further transforms that regulation into part of one’s senseof self. So introjection involves taking in a regulation but not fully accepting it as part of one’s self [27]. Inthis stage, behavior is regulated by the internal rewards of self-esteem for success and avoidance of anxietyor guilt for failure. In identified regulation, the person consciously values a behavioral regulation, and ac-cepts the activity as personally important. In the most autonomous form of extrinsic motivation, integratedregulation, the person identifies with the value of the activity and brings it into alignment with one’s othercore interests and values. [28]. While actions characterized by integrated regulation share similarities withintrinsic motivation, integrated regulation is still considered extrinsic because such actions are performed toattain separable outcomes, and not out of pure enjoyment [28].
2.2 Intrinsic Motivation Inventory
The Intrinsic Motivation Inventory (IMI) is a multidimensional measure of participants’ subject experi-ence toward a particular activity, developed by Ryan and his colleagues [25, 26, 21]. The IMI deter-mines participants’ level of intrinsic motivation by adding together the scores of up to seven possible sub-scales: interest/enjoyment, perceived competence, effort/importance, pressure/tension, perceived choice,value/usefulness, and relatedness [23].
The interest/enjoyment subscale is considered the self-report measure of intrinsic motivation. The per-ceived choice and perceived competence subscales are theorized to be positive predictors of the self-reportof intrinsic motivation, and are related to the SDT psychological needs of autonomy and competence [23].Pressure/tension is theorized to be a negative predictor, as pressure or tension experienced while performingan activity can detract from enjoyment [23]. The effort/importance subscale measures the amount of effortparticipants spend on an activity, and the extent to which they found it worthwhile [21]. The value/usefulnesssubscale has been used in internalization studies, as SDT argues that people internalize and self-regulate ac-tivities they experience as useful or valuable to themselves [23].
Each subscale has five to seven statements, which individuals must rate using a Likert scale from 1 (notat all true), through 4 (somewhat true), to 7 (very true). The score for each subscale is the average rating forthe statements in the subscale. For negatively worded statements [23], the rating is replaced by 8 minus therating; thus, a scale of 1..7 on a negatively worded statement becomes a scale of 7..1, so a larger numeric
4

rating always represents a more-positive response.Past research has found negligible effects from changing the order of survey items, and from including or
excluding various subscales [5]. As a result, experimenters rarely use all items and instead pick the subscalesrelevant to their research questions [5]. Different versions of the IMI have been used and validated in variouscontexts including sports, education, and schizophrenia [5, 34, 2].
2.3 Receptivity Metrics
We use the following metrics for capturing the state-of-receptivity of an individual as defined by Kunzlerand Mishra, et al. [12]. The metrics are divided into two categories, metrics that capture the receptivity of aperson in-the-moment and metrics that capture the receptivity of a person over an extended period of time.
2.3.1 Metrics for in-the-moment receptivity
Paraphrasing from Kunzler and Mishra, et al. [12]:
• Just-in-time response: If the user views and replies to an initiating message within 10 minutes, weconclude the user was in a receptive state at the time of the intervention message delivery. The just-in-time response for that initiating message is set to true.
• Response: If the user responds to the initiating message at any time in the morning, afternoon, orevening interval in which it was delivered, the response for that initiating message is set to true.
• Response delay: The time in minutes between receiving an intervention based message (the initiatingmessage delivered as a notification) and replying to it. If the initiating message was delivered at timet and the participant replied at time t′, then the response delay is t′ − t.
• Conversation engagement: We define a participant as engaged in conversation with the chatbot if theparticipant completed the intervention following the initiating message. If the participant received thefinal intervention message before the end of the interval in which the initiating message was delivered,then the conversation engagement is set to true.
2.3.2 Metrics for receptivity over an extended period of time
Paraphrasing from Kunzler and Mishra, et al. [12]:
• Just-in-time response rate: The fraction of initiating messages for which the participant had a just-in-time response to over a given period.
• Overall response rate: The fraction of initiating messages a participant responded to (just-in-time ornot) over a given period.
• Conversation rate: The fraction of initiating messages for which the participant engaged in a conver-sation, over a given period.
• Average response delay: The mean response delay, over a given period.
3 Related work
In this section, we look at related work about the application of self-determination theory to health carecontexts.
5

3.1 Self-Determination Theory in Health Care
One of the greatest opportunities to improve population health and reduce premature deaths involves behav-ioral change [32]. Potentially controllable behaviors related to smoking, hygiene, diet, and physical activitycan greatly affect people’s health [29]. Additionally, the effectiveness of most health-care interventionsdepend on patients adhering to behaviors such as taking medications, performing self-examinations, andcorrecting habits [29].
Self-determination theory describes the processes through which a patient acquires the motivation toinitiate new health behaviors and maintain them over time [29]. SDT argues that the processes of internal-ization and integration are essential to self regulating and sustaining healthy behaviors [29]. Internalizationinvolves “taking in” the values of a behavior, while integration means bringing those values into alignmentwith one’s own values and sense of self [27]. Internalization and integration depend on the satisfaction ofthe psychological needs of autonomy, competence, and relatedness [27]. Thus, SDT predicts treatment envi-ronments that support patient autonomy, competence, and relatedness yield enhanced adherence and healthoutcomes [29]. An autonomy supportive environment provides opportunity for choice, information aboutthe problem, acknowledgement of patient emotions, and minimizes pressure for the patient to behave in acertain way [36].
Researchers have applied SDT to health-care contexts to study whether autonomous motivation and sat-isfaction of psychological needs is correlated with behavior change and positive health outcomes [18]. Au-tonomous motivation and perceived physicians’ autonomy support has been found to be strongly associatedwith patients’ adherence to long-term prescriptions [38]. Perceptions of providers as autonomy supportivesuccessfully predicted improved maintenance of blood-glucose regulation by diabetes patients [38]. Theperception of health-care staff as need-supportive had a significant correlation with autonomous reasons forengaging in exercise one year after the intervention ended, finding that internalization can influence long-term behavior [33]. In this same study, autonomous motivation was also correlated with a reduction in bodyweight, showing an improvement in health outcomes [33].
A meta-analytic review of 184 SDT based studies in health care observed moderate effects of autonomy-supportive health-care climates, basic needs satisfaction, and autonomous self regulation on various indica-tors of mental and physical health [18]. The overall pattern of these effects supported SDT, with autonomy-supportive health care positively predicting higher levels of patient autonomy, competence, and relatednessfor that health behavior domain. The three psychological needs predicted moderate to strong levels of patientwelfare. A few studies followed patients for up to 24 months after interventions ended, and found evidenceof long-term positive health outcomes [18].
4 Methods
In this section, we discuss our study goals and design, the smartphone app used to deliver interventions(Elena+), the study description, and the IMI we constructed. We then describe the data collected during thestudy, and our approach to data analysis.
4.1 Study Design
To deliver our interventions, we deployed a modified version of the Elena+ iOS app [19]. The Elena+ iOSapp is based on the MobileCoach platform, developed by Filler et al. [6, 11]. Elena+ is a chatbot-baseddigital coach that delivers 43 different educational interventions on 7 topics: COVID-19, physical activity,diet and nutrition, sleep, anxiety, mental resources, and loneliness. For more details on the Elena+ CoachingSession topics, see Appendix Figure 40.
6

At the end of each intervention, the digital coach asks the user to set goals to promote physical or mentalhealth. The original Elena+ app allows users to complete these interventions at their own pace over a periodof two months.
We modified the app so that users received a generic initiating push notification three times a day, at arandom time within a morning, afternoon, and evening interval. The intervals were from 8 am to 11 am,1 pm to 4 pm, and 6 pm to 9 pm EDT. The initiating push notification told the user it was time for acoaching session, but did not specify the topic of the intervention. See Appendix Figure 41 for an examplepush notification. The digital coach always delivered an intervention in a topic different from the topic inthe previous interval.
The interventions in our study were chat-based conversational messages from the digital coach, withsome messages requiring participants to answer by selecting from pre-defined answer options. We definedthe first message requiring a participant answer to be the initiating message of the conversation. Metrics forresponse, just-in-time response, and response delay were calculated based on participants’ response timesto initiating messages. See Appendix Figure 42 for an example initiating message.
If a user did not complete an intervention an hour before the next interval, we sent a push notificationreminding them to complete the coaching session. Reminder notifications were sent at 12 pm, 5 pm, and10 pm EDT. If the user still did not complete the session by the time the next interval began, it was deliveredagain within the next week. With these modifications, we estimated users would complete all 43 interven-tions over 15-21 days. The Elena+ app logged information about all messages sent to users. If Elena+logged that a participant received the last message of an intervention, we set the participant’s conversationengagement to true for that intervention.
We also modified the Elena+ app to collect smartphone sensor data, which was used to determine thecontext of the user. The sensor data included GPS location, physical activity, date and time, proximity to thephone, Wi-Fi connection status, the name and MAC addresses of nearby Bluetooth devices, ambient-lightlevel, battery percentage and charging status, whether the screen was on or off, noise levels and whether theuser was in conversation, daily call and SMS logs, the type of application used in the foreground, and a hashof the foreground application name.
In addition to the Elena+ iOS app, participants were required to install an app on their Macbook laptopto collect data about the participant’s interaction with their laptop. The laptop app collected CPU/RAMUsage, mouse clicks, mouse movement, mouse scroll events, and keyboard key-presses. The laptop appincluded an accompanying browser plug-in that collected data on tab changes, the type of website open, anda hash of the website name.
Participants were asked to keep both the iOS and laptop apps running throughout the duration of thestudy. For each participant, the monitoring lasted at most 21 days, the estimated amount of time for usersto complete all interventions. Monitoring ended earlier if a participant completed all interventions beforethe 21st day. Participants no longer received any new messages and were instructed to uninstall the appli-cations from their iPhone and Macbook. They also received an email message with a link to the post-studyusability survey, which contains questions about perceived disruptions from the notifications and the timingof message prompts. Upon completion of the survey, we sent the participants a USD$40 Amazon gift card,regardless of how many interventions they completed.
At the start of the study, participants were told that the Elena+ app is used to promote positive lifestyleoutcomes during the pandemic. We also explained to participants that we were collecting various sensordata from their iPhone and laptop to determine the effectiveness of the interventions. However, the truepurpose of the study was to understand how a participant’s intrinsic motivation relates with receptivity todigital health interventions. The sensor data was collected to determine how context influences receptivity.
The study’s main variable of interest was receptivity: how participants responded to and interacted withintervention messages. To avoid skewing the results, we did not tell participants our intention to observehow quickly they reacted to messages, as they might have reacted differently knowing they were observed.
7

Participants were instructed to treat the Elena+ app as any other app on their iPhone. We did not askparticipants to respond to initiating push notifications or to complete the interventions.
Since this study was concerned with how intrinsic motivation relates to receptivity, we designed thestudy compensation to avoid motivating participants to react to interventions. At the start of the study, weinformed participants that they would be compensated with an Amazon gift card for participation in thestudy. The consent form states that “participation includes completing the pre-study survey, installing theapp, interacting with the app for three weeks, and completing the post-study survey.” To ensure that thiswould not serve as an extrinsic reward for reacting to interventions, we did not specify what ‘interacting’with the app entails, and did not require participants to complete a certain number of interventions.
4.2 Enrollment and Data Collection
We advertised the study through emails, Facebook, and IRB-approved flyers placed around the DartmouthCollege campus. Thirty-eight college students filled out the consent form; eight did not meet the eligibilitycriteria (living in the Eastern time zone and owning an iPhone and Macbook). Five participants withdrewfrom the study before installing the iOS and laptop apps. Ultimately, 20 participants completed the study.Of the 20 participants, 13 were female and 7 were male. The median age of participants was 20.5 years.
After consenting to the study via the consent form, participants completed a pre-study questionnaireincluding a brief demographic survey, BFI-10 personality survey, Perceived Stress Scale survey, questionson interest and perceived competence for the seven coaching topics, and an Intrinsic Motivation Inventoryfor each of following the categories: COVID-19 guidelines, physical activity, diet and nutrition, and mentalhealth. To reduce respondent burden, we asked participants to fill out an IMI for each of these four topicsinstead of the seven Elena+ coaching session topics described in Appendix Figure 40.
At the end of every week in the study, we asked participants to complete the four Intrinsic MotivationInventory surveys based on their current motivational state. We also asked participants to rate their intereston a scale of 1 (not at all interested) to 5 (extremely interested) and their confidence in their ability toimprove on a scale from 1 (not at all confident) to 5 (completely confident) for each of the seven coachingtopics. Participants completed the four IMIs and interest and confidence questions for the coaching topicsa total of four times: the pre-study questionnaire, the end of week 1, the end of week 2, and the post-studyusability survey. Summary statistics about participant interaction with initating messages are presented inTable 1.
Table 1: Study Stats: Initiating messages are the first messages in the coaching session that require a par-ticipant reply, initial responses are the responses to the initiating messages, just-in-time response % is thesame as just-in-time response rate from Section 2.3.2, conversations engaged % is the same as conversationrate from Section 2.3.2, averaged across all participants.
Total PercentageInitiating Messages 1236Initial Responses 373 30.18%Just-in-time Responses 96 7.77%Conversations Engaged 207 16.75%
8

4.3 Our Version of the Intrinsic Motivation Inventory
In our experiment, we constructed an IMI using four subscales: interest/enjoyment, perceived competence,value/usefulness, and perceived choice. We included the interest/enjoyment subscale as it is considereda self-report of intrinsic motivation. Perceived choice and perceived competence are theorized to be pos-itive predictors of both self-report and behavioral measures of intrinsic motivation [23]. We chose thevalue/usefulness subscale because people tend to be more receptive towards notifications with content theyview as important, urgent, or useful [16], and because people internalize motivation for activities they per-ceive as having value [27]. Our aim is to determine whether receptivity or engagement is correlated withany of these subscale measurements of intrinsic motivation, and whether these measures change over time.Using these four subscales results in a 24-item version of the IMI.
For each intervention topic, we altered the IMI items to focus on the health goal promoted by Elena+interventions for that topic. For example, the mental health IMI focused on “working on improving mentalhealth,” while the IMI for COVID-19 focused on “following COVID-19 guidelines.” The specific items usedin each IMI are shown in Appendix Tables 13, 14, 15, and 16.
To test the internal consistency reliability of our constructed IMIs, we calculated the Cronbach’s alphacoefficient for the total IMI and subscales for each topic. The internal consistency measures for the totalIMIs were high. As shown in Table 2, mental health had α = 0.83, COVID-19 had α = 0.81, physicalactivity had α = 0.94, and diet & nutrition had α = 0.94. The internal consistency of the subscaleswere generally good, as interest/enjoyment and perceived competence, and value/usefulness had α > 0.80.Perceived choice had α < 0.70, ranging from questionable reliability for mental health, COVID-19, andphysical activity to poor reliability for diet & nutrition.
Table 2: Cronbach’s alpha coefficient (α) for the total IMI score and IMI subscale scores for each topic
Topic Total Interest/ Perceived Perceived Value/Enjoyment Choice Competence Usefulness
Mental Health 0.83 0.83 0.60 0.90 0.96COVID-19 0.81 0.83 0.62 0.86 0.94Physical Activity 0.94 0.94 0.63 0.88 0.97Diet & Nutrition 0.94 0.94 0.55 0.93 0.97
4.4 Data Analysis
In our analysis, we explored how intrinsic motivation inventory scores relate to receptivity towards mHealthinterventions both across-topics and within-topics.
To prepare for this analysis, we divided the 43 digital coach initiating messages into the four topicsused for the IMI surveys. COVID-19, physical activity, and diet & nutrition contained the messages fromthe similarly named Elena+ coaching session topics. Mental health included messages from the Elena+coaching session topics of mental resources, sleep, anxiety, and loneliness. As a result, the mental healthtopic included a little over half the total number of initiating messages, as shown in Table 3.
We formed two plans for data analysis, one procedure to answer H1 and H2 about intrinsic motivationscore variation across topics, and another to answer H3 and H4 about intrinsic motivation score varitionwithin topics. Formulated in Section 1, H1 and H2 predicted that a participant with a higher intrinsicmotivation score for a certain topic would have greater receptivity to initiating messages about that topiccompared to initiating messages about other topics. H1 specified greater receptivity as a higher average
9

Table 3: Division of Initiating Messages into Intervention Topics: Mental health contained initiating mes-sages from Elena+ coaching sessions on mental resources, sleep, anxiety, and loneliness. COVID-19 con-tained initiating messages from COVID-19 coaching sessions. Physical activity contained initiating mes-sages from physical activity coaching sessions. Diet & nutrition contained initiating messages from diet &nutrition coaching sessions.
Intervention Number of PercentageTopic Initiating Messages of TotalMental Health 22 51.16%COVID-19 10 23.26%Physical Activity 8 18.6%Diet & Nutrition 3 6.98%
overall response rate, while H2 specified greater receptivity as a lower average response delay. To answerH1 and H2, we created linear mixed effects models that compared the differences in mean receptivity overa given time period for the four topics. The metrics for receptivity over a given time period evaluated in ouranalysis included overall response rate, just-in-time response rate, conversation rate, and average responsedelay. We also created linear mixed effects models to compare the differences in the mean total IMI score andeach IMI subscale score for the four topics. For our post-hoc analysis, we ran Tukey’s honestly significantdifference (HSD) tests for each linear mixed effects model to find the statistical significance of the pairwisecomparisons.
H3 and H4 predicted that within a single topic, higher intrinsic motivation scores would be associatedwith greater receptivity towards initiating messages for that intervention topic. H3 specified greater recep-tivity as higher likelihood of response, while H4 specified greater receptivity as lower response delay. Toanswer H3 and H4, we constructed linear mixed effects models and generalized linear mixed effects modelsto calculate how different receptivity metrics in-the-moment and over a given time period varied with IMIsubscale scores.
To construct receptivity metrics over a given time period, we had to define the time periods for eachparticipant. During the study, participants took an IMI survey for each of the four topics a total of fourtimes: during the pre-study questionnaire, end of week one survey, end of week two survey, and the post-study usability survey. Ideally, participants would have completed the IMI surveys on the days they weresent, days 0, 7, 14, and 21 of the study. However some participants completed the survey a few days after itwas sent to them.
Our initial analysis set a time period as the number of days in-between two consecutive survey comple-tion dates, generally around a week. For the ideal example with surveys completed on days 0, 7, 14, and 21,the pre-study IMI scores applied to days 0-6, the end of week one IMI scores applied to days 7-13, and theend of week two IMI scores applied to days 14-21. One drawback of this method of defining time periodswas that the IMI scores collected in the post-study usability survey were not incorporated into the analysis.
We then devised a partial interpolation method to include all four sets of IMI scores into our analysis.We found the halfway points in between survey completion dates, and set the time period to be the numberof days between these halfway points. For the example of surveys completed on days 0, 7, 14, and 21, thepre-study IMI scores applied to days 0-3, the end of week one IMI scores applied to days 4-10, the end ofweek two IMI scores applied to days 11-17, and the post-study usability survey IMI scores applied to days18-21.
The metrics for receptivity over an extended period of time were then calculated over the time periods
10

set using the second method. For example, if a time period for a participant contained days 0-3, the responserate for that time period was the fraction of initiating messages that the participant responded to during days0-3 of the study.
5 Results
In this section, we present the results of our data analysis, and evaluate whether the results support or failedto support our hypotheses defined in Section 1.
First we show our results for the analysis performed to answer H1 and H2. This across-topics analysisdetermined whether a higher mean intrinsic motivation score for a topic was associated with greater meanreceptivity for that topic compared to others. We then present our results for the analysis conducted toanswer H3 and H4. For this within-topic analysis, we evaluated whether a higher intrinsic motivation scorewas associated with greater receptivity for interventions about that topic.
5.1 H1 and H2 – Exploring Whether a Relationship Exists Between Mean Intrinsic Moti-vation and Mean Receptivity Over a Given Time Period Across Topics
For the following analysis across intervention topics, we used linear fixed effects models to compare dif-ferences in mean receptivity across topics to the differences in mean IMI total score and subscale scoreacross topics. We then conducted Tukey’s HSD tests to find the significance of these pairwise comparisons.We evaluated metrics for receptivity over a given time period, including overall response rate, just-in-timeresponse rate, conversation rate, and average response delay.
5.1.1 Overall Response Rate
We defined the overall response rate as the fraction of initiating messages a participant responded to over agiven time period.
We began our overall response rate analysis by constructing a linear mixed effects model where theresponse variable was the overall response rate, and the fixed effect was the intervention topic. There were20 groups, for the number of participants who completed the study. Figure 1a plots four points representingthe mean overall response rate for each intervention topic. The whiskers show the 95% confidence intervalfor the mean overall response rate. The line connecting the four points does not represent any data, and wasincluded for easier comparison with Figure 1b.
Figure 1b was created from a linear mixed effects model where the response variable was set to theinterest/enjoyment subscale score, and the fixed effect was set to the intervention topic. There were 20groups, for the number of participants who completed the study. Figure 1b plots four points representing themean interest/enjoyment subscale score for each intervention topic. Similar to Figure 1a, the whiskers showthe 95% confidence interval, and the line connecting the four points does not represent any data points.
As evident in Figure 1b, the topics with the highest mean interest/enjoyment score were diet & nutritionand physical activity. However in Figure 1a, the mean overall response rates for diet & nutrition and physicalactivity were lower than the mean overall response rate for other topics. Conversely, COVID-19 had thelowest mean interest/enjoyment score among the topics, but had the highest mean overall response rate.These results did not support H1, that higher average interest/enjoyment subscale scores for a topic shouldcorrespond to higher average overall response rate for that topic compared to others.
For our post-hoc analysis, we ran a Tukey HSD test on the overall response rate linear mixed effectsmodel to determine whether the differences between mean overall response rates were significant. As shownin Table 4, there were no significant differences in mean overall response rates between topic pairs.
11

0.2
0.3
0.4
0.5
COVID−19 Diet & Nutrition Mental Health Physical ActivityTopic
Ove
rall
Res
pons
e R
ate
(a) Overall Response Rate by Topic
3
4
5
COVID−19 Diet & Nutrition Mental Health Physical ActivityTopic
Inte
rest
/Enj
oym
ent I
MI S
ubsc
ale
Sco
re
(b) Interest/Enjoyment Score by Topic
Figure 1: Comparing variation in overall response rate to variation in interest/enjoyment scores across topics
We also ran a Tukey HSD test on the interest/enjoyment linear mixed effects model to test whether thedifferences between the mean interest/enjoyment subscale scores were significant. As shown in Table 5,the difference in mean interest/enjoyment subscale scores for pairwise comparisons COVID-19 – diet &nutrition, COVID-19 – mental health, and COVID-19 – physical activity were all significant at p < .0001.The pairwise differences for diet & nutrition – mental health and mental health – physical activity weresignificant at p < .01.
Even though there were significant pairwise differences in mean interest/enjoyment scores, there wereno significant pairwise differences in mean overall response rates. As a result, we did not find evidence forH1, that a positive relationship exists between mean interest/enjoyment scores and mean overall responserate across topics.
Table 4: Pairwise comparisons of overall response rate across topics
Pairwise Comparisons Estimate Std. Error df t-ratio p-valueCOVID-19 – Diet & Nutrition 0.0867 0.0561 192 1.546 0.4120COVID-19 – Mental Health 0.0520 0.0536 192 0.971 0.7664COVID-19 – Physical Activity 0.1198 0.0546 192 2.194 0.1285Diet & Nutrition – Mental Health -0.0347 0.0551 192 -0.629 0.9225Diet & Nutrition – Physical Activity 0.0331 0.0561 193 0.590 0.9351Mental Health – Physical Activity 0.0678 0.0536 192 1.265 0.5863
Table 5: Pairwise comparisons of interest/enjoyment subscale scores across topics
Pairwise Comparisons Estimate Std. Error df t-ratio p-valueCOVID-19 – Diet & Nutrition -2.070 0.203 192 -10.217 <.0001COVID-19 – Mental Health -1.373 0.194 192 -7.087 <.0001COVID-19 – Physical Activity -2.197 0.197 192 -11.136 <.0001Diet & Nutrition – Mental Health 0.697 0.199 192 3.503 0.0032Diet & Nutrition – Physical Activity -0.127 0.203 193 -0.627 0.9234Mental Health – Physical Activity -0.825 0.194 192 -4.258 0.0002
12

To compare differences in mean overall response rate to differences in mean perceived choice subscalescores, we created a linear mixed effects model for perceived choice scores. We plot the mean perceivedchoice scores and 95% confidence intervals in Figure 2b.
The topic with the highest mean perceived choice score was physical activity, as seen in Figure 2b.However in Figure 2a, the mean overall response rate for physical activity was the lowest among all fourtopics. Conversely, COVID-19 had the lowest mean perceived choice score among the topics, but had thehighest mean overall response rate. These findings did not support H1, that higher average perceived choicesubscale scores for a topic should correspond to higher average overall response rate for that topic comparedto others.
From our post-hoc analysis, we found the difference in mean perceived choice subscale scores for pair-wise comparisons COVID-19 – diet & nutrition, COVID-19 – mental health, and COVID-19 – physicalactivity were all significant at p < .0001, as evident in Table 6.
Although there were significant pairwise differences in mean perceived choice scores, there were nosignificant pairwise differences in mean overall response rates as seen in Table 4. Thus, we did not findsupport for H1’s prediction of a positive relationship between mean perceived choice scores and mean overallresponse rate across topics.
Table 6: Pairwise comparisons of perceived choice subscale scores across topics
Pairwise Comparisons Estimate Std. Error df t-ratio p-valueCOVID-19 – Diet & Nutrition -1.0163 0.154 193 -6.578 <.0001COVID-19 – Mental Health -1.1564 0.148 192 -7.828 <.0001COVID-19 – Physical Activity -1.2029 0.150 192 -7.995 <.0001Diet & Nutrition – Mental Health -0.1401 0.152 193 -0.923 0.7928Diet & Nutrition – Physical Activity -0.1867 0.155 193 -1.207 0.6232Mental Health – Physical Activity -0.0466 0.148 192 -0.316 0.9891
0.2
0.3
0.4
0.5
COVID−19 Diet & Nutrition Mental Health Physical ActivityTopic
Ove
rall
Res
pons
e R
ate
(a) Overall Response Rate by Topic
3.0
3.5
4.0
4.5
COVID−19 Diet & Nutrition Mental Health Physical ActivityTopic
Per
ceiv
ed C
hoic
e IM
I Sub
scal
e S
core
(b) Perceived Choice Score by Topic
Figure 2: Comparing variation in overall response rate to variation in perceived choice scores across topics
13

For comparing differences in mean overall response rate to differences in mean perceived competencesubscale scores, we created a linear mixed effects model for perceived competence scores. We plot the meanperceived competence scores and 95% confidence intervals in Figure 3b.
As seen in Figure 3b, mental health had the lowest mean perceived competence score. But in Figure 3a,the overall response rate for mental health was not the lowest mean overall response rate among the fourtopics. These findings did not support our hypothesis following from H1, that lower average perceivedcompetence subscale scores for a topic should correspond to lower average overall response rate for thattopic in comparison to others.
For our post-hoc analysis, we ran a Tukey HSD test on the perceived competence linear mixed effectsmodel to test whether the differences between the perceived competence subscale scores were significant.As shown in 6, the difference in mean perceived competence subscale scores for the pairwise comparisonof COVID-19 – mental health was significant at p < .0001. The pairwise difference for diet & nutrition –mental health was significant at p < .01, while COVID-19 – physical activity and mental health – physicalactivity were both significant at p < .05.
Despite significant pairwise differences in mean perceived competence scores, there were no signifi-cant pairwise differences in mean overall response rate. These findings did not support H1, that a positiverelationship exists between mean perceived competence scores and mean overall response rate across topics.
Table 7: Pairwise comparisons of perceived competence subscale scores across topics
Pairwise Comparisons Estimate Std. Error df t-ratio p-valuePairwise Comparisons Estimate Std. Error df t-ratio p-valueCOVID-19 – Diet & Nutrition 0.463 0.205 192 2.256 0.1121COVID-19 – Mental Health 1.142 0.196 192 5.814 <.0001COVID-19 – Physical Activity 0.574 0.200 192 2.871 0.0234Diet & Nutrition – Mental Health 0.678 0.202 192 3.360 0.0052Diet & Nutrition – Physical Activity 0.111 0.206 193 0.539 0.9494Mental Health – Physical Activity -0.567 0.196 192 -2.891 0.0221
0.2
0.3
0.4
0.5
COVID−19 Diet & Nutrition Mental Health Physical ActivityTopic
Ove
rall
Res
pons
e R
ate
(a) Overall Response Rate by Topic
4.0
4.5
5.0
5.5
COVID−19 Diet & Nutrition Mental Health Physical ActivityTopic
Per
ceiv
ed C
ompe
tenc
e IM
I Sub
scal
e S
core
(b) Perceived Competence Score by Topic
Figure 3: Comparing variation in overall response rate to variation in perceived competence scores across topics
14
To compare differences in mean overall response rate to differences in mean value/usefulness subscalescores, we created a linear mixed effects model for value/usefulness subscale scores. Figure 4b plots themean value/usefulness subscale score and 95% confidence interval for each topic.
The two topics with the highest mean value/usefulness scores were diet & nutrition and physical activity,as seen in Figure 4b. In Figure 4a, the mean overall response rates for diet & nutrition and physical activitywere lower than the mean overall response rate for the other topics. Conversely, COVID-19 had the lowestmean value/usefulness score among the topics, but the highest mean overall response rate. These findingsdid not support H1, that higher average value/usefulness subscale scores for a topic should correspond tohigher average overall response rate for that topic compared to others.
Our Tukey test results in Table 6 found the differences in mean value/usefulness subscale scores forpairwise comparisons COVID-19 – diet & nutrition and COVID-19 – physical activity were significant atp < .0001. In addition, the pairwise difference for mental health – physical activity was significant atp < .05.
Because there were no significant differences in mean overall response rates, this evidence did notsupport H1’s prediction of a positive relationship between mean value/usefulness scores and mean overallresponse rate across topics.
Table 8: Pairwise comparisons of value/usefulness subscale scores across topics
Pairwise Comparisons Estimate Std. Error df t-ratio p-valueCOVID-19 – Diet & Nutrition -0.861 0.187 192 -4.614 <.0001COVID-19 – Mental Health -0.400 0.178 192 -2.242 0.1158COVID-19 – Physical Activity -0.888 0.182 192 -4.886 <.0001Diet & Nutrition – Mental Health 0.461 0.183 192 2.514 0.0609Diet & Nutrition – Physical Activity -0.027 0.187 193 -0.145 0.9989Mental Health – Physical Activity -0.488 0.178 192 -2.737 0.0340
0.2
0.3
0.4
0.5
COVID−19 Diet & Nutrition Mental Health Physical ActivityTopic
Ove
rall
Res
pons
e R
ate
(a) Overall Response Rate by Topic
5.0
5.5
6.0
6.5
COVID−19 Diet & Nutrition Mental Health Physical ActivityTopic
Val
ue/U
sefu
lnes
s IM
I Sub
scal
e S
core
(b) Value/Usefulness Score by Topic
Figure 4: Comparing variation in overall response rate to variation in value/usefulness scores across topics
15

In our final analysis for overall response rate, we created a linear mixed effects model for the total IMIscore. We plot the mean total IMI score for each topic in Figure 5a, along with the corresponding 95%confidence intervals.
The topics with the highest mean total IMI score were diet & nutrition and physical activity, as seen inFigure 5b. In Figure 5a, the mean overall response rates for diet & nutrition and physical activity were lowerthan the mean overall response rate for other topics. Conversely, COVID-19 had the lowest mean total IMIscore, but the highest mean overall response rate among the topics. These results do not support H1, that ahigher total IMI score for an intervention topic should correspond to a higher average overall response ratefor that topic compared to others.
As shown by our Tukey test results in Table 6, the differences in total IMI scores for pairwise compar-isons COVID-19 – diet & nutrition and COVID-19 – physical activity were significant at p < .0001. Thepairwise differences for COVID-19 – mental health, diet & nutrition – mental health, and mental health –physical activity were significant at p < .01.
Because there were no significant differences in mean overall response rates, this evidence did notsupport H1, that a positive relationship exists between mean total IMI scores and mean overall response rateacross topics.
To summarize our analyses of overall response rate, we found that differences in mean overall responserate were statistically insignificant, and did not reflect the significant pairwise differences in mean inter-est/enjoyment, perceived choice, perceived competence, and value/usefulness subscale scores. The differ-ences in mean overall response rate also did not reflect the significant pairwise differences in mean totalIMI scores. These results did not provide evidence for H1, that a positive relationship exists between meanintrinsic motivation measures and mean overall response rate across topics.
Table 9: Pairwise comparisons of total IMI scores across topics
Pairwise Comparisons Estimate Std. Error df t-ratio p-valueCOVID-19 – Diet & Nutrition -3.484 0.539 192 -6.468 <.0001COVID-19 – Mental Health -1.788 0.515 192 -3.471 0.0035COVID-19 – Physical Activity -3.713 0.525 192 -7.078 <.0001Diet & Nutrition – Mental Health 1.697 0.529 192 3.205 0.0085Diet & Nutrition – Physical Activity -0.229 0.539 193 -0.424 0.9743Mental Health – Physical Activity -1.925 0.515 192 -3.741 0.0014
0.2
0.3
0.4
0.5
COVID−19 Diet & Nutrition Mental Health Physical ActivityTopic
Ove
rall
Res
pons
e R
ate
(a) Overall Response Rate by Topic
16
18
20
22
COVID−19 Diet & Nutrition Mental Health Physical ActivityTopic
IMI T
otal
Sco
re
(b) Total IMI Score by Topic
Figure 5: Comparing variation in overall response rate to variation in total IMI scores across topics
16

5.1.2 Just-in-Time Response Rate
We defined just-in-time response rate as the fraction of initiating messages a participant responded to withinten minutes of delivery, over a given time period. Because we defined just-in-time response as a strictercondition than response, we extended H1 to predict that a positive relationship exists between mean intrinsicmotivation measures and just-in-time response rate across topics.
To compare differences in mean just-in-time response rates across topics to differences in mean IMIsubscale scores and total IMI scores across topics, we constructed a linear mixed effects model for just-in-time response rate. We plot the mean just-in-time response rates and corresponding 95% confidenceintervals in Figure 6a.
The pairwise differences in mean just-in-time response rate were small and statistically insignificant asshown by the Tukey test results in Table 10. In contrast, there were significant pairwise differences in meaninterest/enjoyment scores in Table 5, perceived choice scores in Table 6, perceived competence scores inTable 7, value/usefulness scores in Table 8, and total IMI scores in Table 9. Because the differences inmean just-in-time response rate were statistically insignificant and did not reflect the significant differencesin mean IMI subscale scores and total IMI scores, we did not find evidence for the hypothesis followingfrom H1, that a positive relationship exists between mean intrinsic motivation scores and mean just-in-timeresponse rate across topics.
To visualize this lack of relationship, we plotted the linear mixed effects model for just-in-time responserate in Figure 6a repeated next to the plotted linear mixed effects models for interest/enjoyment subscalescores in Figure 6b, perceived choice subscale scores in Figure 7b, perceived competence subscale scores inFigure 8b, value/usefulness subscale scores in Figure 9b, and total IMI scores in Figure 10b. As shown inthese figures, the mean just-in-time response rate did not differ much across topics, while the IMI subscalescores and total IMI scores vary significantly across topics.
Table 10: Pairwise comparisons of just-in-time response rate across topics
Pairwise Comparisons Estimate Std. Error df t-ratio p-valueCOVID-19 – Diet & Nutrition 0.01728 0.0359 193 0.481 0.9632COVID-19 – Mental Health 0.00746 0.0343 192 0.217 0.9964COVID-19 – Physical Activity 0.03951 0.0350 192 1.130 0.6715Diet & Nutrition – Mental Health -0.00982 0.0353 193 -0.278 0.9924Diet & Nutrition – Physical Activity 0.02223 0.0359 193 0.618 0.9261Mental Health – Physical Activity 0.03205 0.0343 192 0.934 0.7866
17

0.05
0.10
0.15
COVID−19 Diet & Nutrition Mental Health Physical ActivityTopic
Just
−In
−T
ime
Res
pons
e R
ate
(a) Just-in-Time Response Rate by Topic
3
4
5
COVID−19 Diet & Nutrition Mental Health Physical ActivityTopic
Inte
rest
/Enj
oym
ent I
MI S
ubsc
ale
Sco
re
(b) Interest/Enjoyment Score by Topic
Figure 6: Comparing variation in just-in-time response rate to variation in interest/enjoyment scores across topics
0.05
0.10
0.15
COVID−19 Diet & Nutrition Mental Health Physical ActivityTopic
Just
−In
−T
ime
Res
pons
e R
ate
(a) Just-in-Time Response Rate by Topic
3.0
3.5
4.0
4.5
COVID−19 Diet & Nutrition Mental Health Physical ActivityTopic
Per
ceiv
ed C
hoic
e IM
I Sub
scal
e S
core
(b) Perceived Choice Score by Topic
Figure 7: Comparing variation in just-in-time response rate to variation in perceived choice scores across topics
0.05
0.10
0.15
COVID−19 Diet & Nutrition Mental Health Physical ActivityTopic
Just
−In
−T
ime
Res
pons
e R
ate
(a) Just-in-Time Response Rate by Topic
4.0
4.5
5.0
5.5
COVID−19 Diet & Nutrition Mental Health Physical ActivityTopic
Per
ceiv
ed C
ompe
tenc
e IM
I Sub
scal
e S
core
(b) Perceived Competence Score by Topic
Figure 8: Comparing variation in just-in-time response rate to variation in perceived competence scores across topics
18

0.05
0.10
0.15
COVID−19 Diet & Nutrition Mental Health Physical ActivityTopic
Just
−In
−T
ime
Res
pons
e R
ate
(a) Just-in-Time Response Rate by Topic
5.0
5.5
6.0
6.5
COVID−19 Diet & Nutrition Mental Health Physical ActivityTopic
Val
ue/U
sefu
lnes
s IM
I Sub
scal
e S
core
(b) Value/Usefulness Score by Topic
Figure 9: Comparing variation in just-in-time response rate to variation in value/usefulness scores across topics
0.05
0.10
0.15
COVID−19 Diet & Nutrition Mental Health Physical ActivityTopic
Just
−In
−T
ime
Res
pons
e R
ate
(a) Just-in-Time Response Rate by Topic
16
18
20
22
COVID−19 Diet & Nutrition Mental Health Physical ActivityTopic
IMI T
otal
Sco
re
(b) Total IMI Score by Topic
Figure 10: Comparing variation in just-in-time response rate to variation in total IMI scores across topics
19

5.1.3 Conversation Rate
We defined the receptivity metric conversation rate as the fraction of initiating messages for which theparticipant engaged in a conversation and completed the intervention, over a given period. Because a higherconversation rate indicates greater receptivity, we extended H1 to predict that a positive relationship existsbetween mean intrinsic motivation measures and conversation rate across topics.
To compare differences in mean conversation rates across topics to differences in mean IMI subscalescores across topics, we constructed a linear mixed effects model for conversation rate. We plotted the meanconversation rate and accompanying 95% confidence intervals in Figure 11a.
The pairwise differences in mean conversation rate were mostly small and statistically insignificant asshown by the Tukey test results in Table 11. Only pairwise differences in conversation rate for COVID-19 –diet & nutrition and COVID-19 – physical activity were significant at p < .05. Both estimates were positive,with the estimated mean difference in conversation rate for COVID-19 – diet & nutrition equal to 0.143 andthe estimated mean difference in conversation rate for COVID-19 – physical activity equal to 0.138.
The same pairwise comparisons for COVID-19 – diet & nutrition and COVID-19 – physical activitywere significant and negative for mean interest/enjoyment scores in Table 5, perceived choice scores inTable 6, value/usefulness scores in Table 8, and total IMI scores in Table 9. These results show that astatistically significant lower mean total IMI, interest/enjoyment, perceived choice, and value/usefulnessscore for COVID-19 compared to diet & nutrition and physical activity was associated with a statisticallysignificant higher conversation rate for COVID-19 interventions compared to diet & nutrition and physicalactivity. These results failed to support the hypothesis following from H1, that a higher mean intrinsicmotivation score for a topic should be reflected in a higher mean conversation rate for that topic comparedto others.
To visualize these findings, we plotted the linear mixed effects model for conversation rate in Figure 11arepeated next to the plotted linear mixed effects models for interest/enjoyment scores in Figure 11b, per-ceived choice scores in Figure 12b, perceived competence scores in Figure 13b, value/usefulness scoresin Figure 14b, and total IMI scores in Figure 15b. As seen in Figures 11b, 12b, 14b, and 15b, across alltopics COVID-19 had the lowest, while diet & nutrition and physical activity had the two highest inter-est/enjoyment, perceived choice, value/usefulness, and total IMI scores. This illustrates the statisticallysignificant negative estimates for pairwise comparisons of IMI scores for COVID-19 – diet & nutrition andCOVID-19 – physical activity in Tables 5, 6, 8, and 9. But as seen in Figure 11b, COVID-19 had the high-est mean conversation rate, while diet & nutrition and physical activity had the lowest mean conversationrates among all four topics. This figure visualizes the statistically significant positive estimates for pairwisecomparisons of conversation rate for COVID-19 – diet & nutrition and COVID-19 – physical activity inTable 11. These results presented the opposite of the positive relationship predicted between IMI scores andconversation rate.
Table 11: Pairwise comparisons of conversation rate across topics
Pairwise Comparisons Estimate Std. Error df t-ratio p-valueCOVID-19 – Diet & Nutrition 0.14318 0.0501 192 2.856 0.0244COVID-19 – Mental Health 0.11642 0.0479 192 2.429 0.0750COVID-19 – Physical Activity 0.13774 0.0488 192 2.821 0.0269Diet & Nutrition – Mental Health -0.02676 0.0493 192 -0.543 0.9483Diet & Nutrition – Physical Activity -0.00544 0.0502 193 -0.108 0.9995Mental Health – Physical Activity 0.02133 0.0479 192 0.445 0.9705
20

0.1
0.2
0.3
0.4
COVID−19 Diet & Nutrition Mental Health Physical ActivityTopic
Con
vers
atio
n R
ate
(a) Conversation Rate by Topic
3
4
5
COVID−19 Diet & Nutrition Mental Health Physical ActivityTopic
Inte
rest
/Enj
oym
ent I
MI S
ubsc
ale
Sco
re
(b) Interest/Enjoyment Score by Topic
Figure 11: Comparing variation in conversation rate to variation in interest/enjoyment scores across topics
0.1
0.2
0.3
0.4
COVID−19 Diet & Nutrition Mental Health Physical ActivityTopic
Con
vers
atio
n R
ate
(a) Conversation Rate by Topic
3.0
3.5
4.0
4.5
COVID−19 Diet & Nutrition Mental Health Physical ActivityTopic
Per
ceiv
ed C
hoic
e IM
I Sub
scal
e S
core
(b) Perceived Choice Score by Topic
Figure 12: Comparing variation in conversation rate to variation in perceived choice scores across topics
0.1
0.2
0.3
0.4
COVID−19 Diet & Nutrition Mental Health Physical ActivityTopic
Con
vers
atio
n R
ate
(a) Conversation Rate by Topic
4.0
4.5
5.0
5.5
COVID−19 Diet & Nutrition Mental Health Physical ActivityTopic
Per
ceiv
ed C
ompe
tenc
e IM
I Sub
scal
e S
core
(b) Perceived Competence Score by Topic
Figure 13: Comparing variation in conversation rate to variation in perceived competence scores across topics
0.1
0.2
0.3
0.4
COVID−19 Diet & Nutrition Mental Health Physical ActivityTopic
Con
vers
atio
n R
ate
(a) Conversation Rate by Topic
5.0
5.5
6.0
6.5
COVID−19 Diet & Nutrition Mental Health Physical ActivityTopic
Val
ue/U
sefu
lnes
s IM
I Sub
scal
e S
core
(b) Value/Usefulness Score by Topic
Figure 14: Comparing variation in conversation rate to variation in value/usefulness scores across topics
21

0.1
0.2
0.3
0.4
COVID−19 Diet & Nutrition Mental Health Physical ActivityTopic
Con
vers
atio
n R
ate
(a) Conversation Rate by Topic
5.0
5.5
6.0
6.5
COVID−19 Diet & Nutrition Mental Health Physical ActivityTopic
Val
ue/U
sefu
lnes
s IM
I Sub
scal
e S
core
(b) Total IMI Score by Topic
Figure 15: Comparing variation in conversation rate to variation in total IMI scores across topics
5.1.4 Average Response Delay
We defined average response delay as the mean response delay over a given time period. We interpretedlower average response delay as indicating greater receptivity to an intervention. Thus H2 predicts that ahigher mean intrinsic motivation score for a topic should correspond to a lower mean average response delaycompared to other topics.
To compare differences in mean average response delay across topics to differences in mean IMI sub-scale scores across topics, we constructed a linear mixed effects model for average response delay. We plotthe mean average response delay and corresponding 95% confidence intervals in Figure 16a.
The pairwise differences in mean average response delay were small and statistically insignificant asshown by the Tukey test results in Table 12. In contrast, there were significant pairwise differences in meaninterest/enjoyment scores in Table 5, perceived choice scores in Table 6, perceived competence scores inTable 7, value/usefulness scores in Table 8, and total IMI scores in Table 9. These results failed to supportH2, which argues that significant differences in mean intrinsic motivation scores across topics should bereflected as differences in mean average response delay across topics.
We then plotted the linear mixed effects model for average response delay in Figure 16a repeated nextto the plotted linear mixed effects models for interest/enjoyment scores in Figure 16b, perceived choice inFigure 17b, perceived competence scores in Figure 18b, value/usefulness in Figure 19b, and total IMI scoresin Figure 20b. For the mean total IMI scores and mean subscale scores for interest/enjoyment, perceivedchoice, value/usefulness, COVID-19 was the lowest among all four topics. As seen in Figure 16, there wasa negative trend between mean interest/enjoyment scores and mean average response delay by topic. Therewas also a negative trend between mean perceived value scores and mean average response delay as seen inFigure 19, and a negative trend between mean total IMI scores and mean average response delay by topicas seen in Figure 20. Although the pairwise differences in mean average response delay were insignificant,with more data these negative trends might become significant and support H2’s prediction that a highermean intrinsic motivation score for a topic should be associated with lower mean average response delaycompared to other topics.
22

Table 12: Pairwise comparisons of average response delay across topics
Pairwise Comparisons Estimate Std. Error df t-ratio p-valueCOVID-19 – Diet & Nutrition 2.32e+03 1627 131 1.427 0.4850COVID-19 – Mental Health -5.99e-02 1383 125 0.000 1.0000COVID-19 – Physical Activity 8.74e+02 1600 126 0.547 0.9473Diet & Nutrition – Mental Health -2.32e+03 1564 127 -1.484 0.4499Diet & Nutrition – Physical Activity -1.45e+03 1756 126 -0.824 0.8430Mental Health – Physical Activity 8.74e+02 1543 126 0.567 0.9418
40
80
120
160
COVID−19 Diet & Nutrition Mental Health Physical ActivityTopic
Ave
rage
Res
pons
e D
elay
(m
inut
es)
(a) Average Response Delay by Topic (minutes)
3
4
5
COVID−19 Diet & Nutrition Mental Health Physical ActivityTopic
Inte
rest
/Enj
oym
ent I
MI S
ubsc
ale
Sco
re
(b) Interest/Enjoyment Score by Topic
Figure 16: Comparing variation in average response delay to variation in interest/enjoyment scores across topics
4000
6000
8000
COVID−19 Diet & Nutrition Mental Health Physical ActivityTopic
Ave
rage
Res
pons
e D
elay
(m
inut
es)
(a) Average Response Delay by Topic (minutes)
3.0
3.5
4.0
4.5
COVID−19 Diet & Nutrition Mental Health Physical ActivityTopic
Per
ceiv
ed C
hoic
e IM
I Sub
scal
e S
core
(b) Perceived Choice Score by Topic
Figure 17: Comparing variation in average response delay to variation in perceived choice scores across topics
40
80
120
160
COVID−19 Diet & Nutrition Mental Health Physical ActivityTopic
Ave
rage
Res
pons
e D
elay
(m
inut
es)
(a) Average Response Delay by Topic (minutes)
4.0
4.5
5.0
5.5
COVID−19 Diet & Nutrition Mental Health Physical ActivityTopic
Per
ceiv
ed C
ompe
tenc
e IM
I Sub
scal
e S
core
(b) Perceived Competence Score by Topic
Figure 18: Comparing variation in average response delay to variation in perceived competence scores across topics
23

4000
6000
8000
10000
COVID−19 Diet & Nutrition Mental Health Physical ActivityTopic
Ave
rage
Res
pons
e D
elay
(m
inut
es)
(a) Average Response Delay by Topic (minutes)
5.0
5.5
6.0
6.5
COVID−19 Diet & Nutrition Mental Health Physical ActivityTopic
Val
ue/U
sefu
lnes
s IM
I Sub
scal
e S
core
(b) Perceived Value Score by Topic
Figure 19: Comparing variation in average response delay to variation in value/usefulness scores across topics
4000
6000
8000
10000
COVID−19 Diet & Nutrition Mental Health Physical ActivityTopic
Ave
rage
Res
pons
e D
elay
(m
inut
es)
(a) Average Response Delay by Topic (minutes)
16
18
20
22
COVID−19 Diet & Nutrition Mental Health Physical ActivityTopic
IMI T
otal
Sco
re
(b) Total IMI Score by Topic
Figure 20: Comparing variation in average response delay to variation in total IMI scores across topics
24
5.2 H3 and H4 – Exploring Whether a Relationship Exists Between IMI Subscale Scoresand Receptivity In-the-Moment Within a Topic
In this section, we evaluate whether there was a relationship between IMI subscale scores and metrics forreceptivity in-the-moment, which include response, just-in-time response, conversation engagement, andresponse delay. For the binary variables response, just-in-time response, and conversation engagement, weused generalized linear mixed effects models. For the continuous variable response delay, we used linearmixed effects models. We set the fixed effects as IMI subscale scores for interest/enjoyment, perceivedchoice, perceived competence, and value/usefulness. There were 20 groups, the number of participants whocompleted the study.
5.2.1 Response
We defined response as a binary variable for whether a participant responded to an initiating message duringthe interval in which it was delivered.
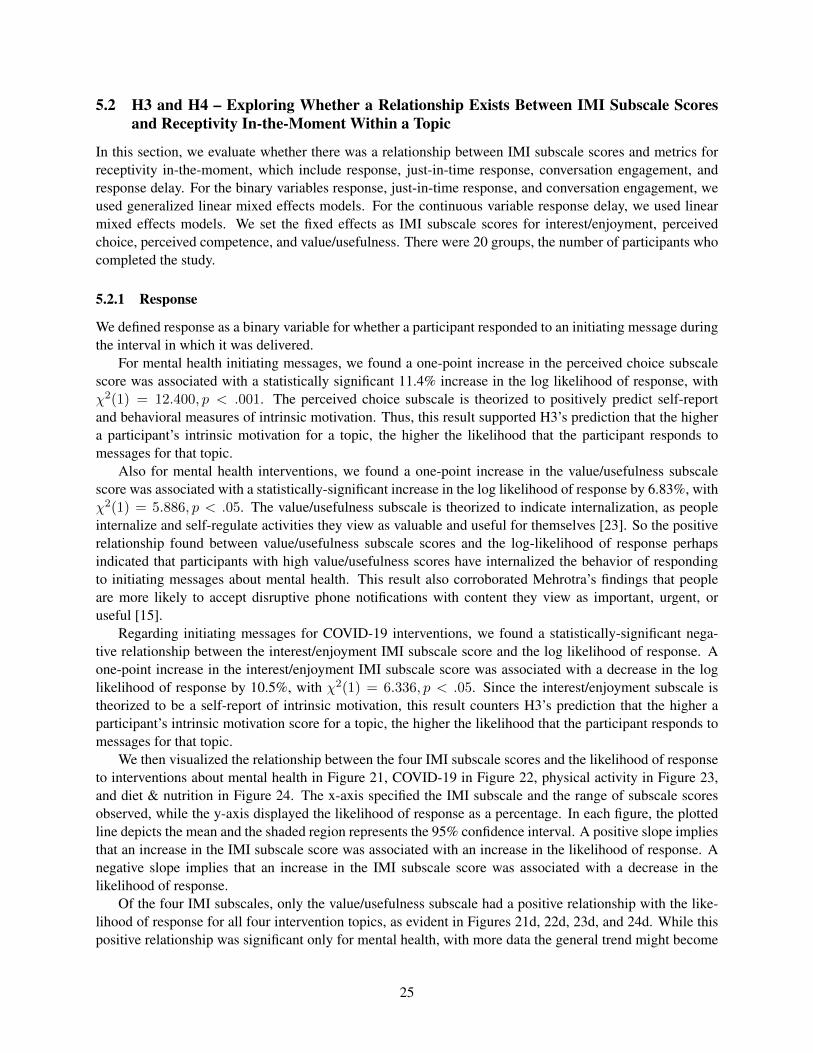
For mental health initiating messages, we found a one-point increase in the perceived choice subscalescore was associated with a statistically significant 11.4% increase in the log likelihood of response, withχ2(1) = 12.400, p < .001. The perceived choice subscale is theorized to positively predict self-reportand behavioral measures of intrinsic motivation. Thus, this result supported H3’s prediction that the highera participant’s intrinsic motivation for a topic, the higher the likelihood that the participant responds tomessages for that topic.
Also for mental health interventions, we found a one-point increase in the value/usefulness subscalescore was associated with a statistically-significant increase in the log likelihood of response by 6.83%, withχ2(1) = 5.886, p < .05. The value/usefulness subscale is theorized to indicate internalization, as peopleinternalize and self-regulate activities they view as valuable and useful for themselves [23]. So the positiverelationship found between value/usefulness subscale scores and the log-likelihood of response perhapsindicated that participants with high value/usefulness scores have internalized the behavior of respondingto initiating messages about mental health. This result also corroborated Mehrotra’s findings that peopleare more likely to accept disruptive phone notifications with content they view as important, urgent, oruseful [15].
Regarding initiating messages for COVID-19 interventions, we found a statistically-significant nega-tive relationship between the interest/enjoyment IMI subscale score and the log likelihood of response. Aone-point increase in the interest/enjoyment IMI subscale score was associated with a decrease in the loglikelihood of response by 10.5%, with χ2(1) = 6.336, p < .05. Since the interest/enjoyment subscale istheorized to be a self-report of intrinsic motivation, this result counters H3’s prediction that the higher aparticipant’s intrinsic motivation score for a topic, the higher the likelihood that the participant responds tomessages for that topic.
We then visualized the relationship between the four IMI subscale scores and the likelihood of responseto interventions about mental health in Figure 21, COVID-19 in Figure 22, physical activity in Figure 23,and diet & nutrition in Figure 24. The x-axis specified the IMI subscale and the range of subscale scoresobserved, while the y-axis displayed the likelihood of response as a percentage. In each figure, the plottedline depicts the mean and the shaded region represents the 95% confidence interval. A positive slope impliesthat an increase in the IMI subscale score was associated with an increase in the likelihood of response. Anegative slope implies that an increase in the IMI subscale score was associated with a decrease in thelikelihood of response.
Of the four IMI subscales, only the value/usefulness subscale had a positive relationship with the like-lihood of response for all four intervention topics, as evident in Figures 21d, 22d, 23d, and 24d. While thispositive relationship was significant only for mental health, with more data the general trend might become
25

significant and support H3, that a higher value/usefulness score for a topic should be associated with a higherlikelihood of response to interventions for that topic.
We also observed a negative relationship between the interest/enjoyment subscale and the likelihood ofresponse for mental health, COVID-19, and diet & nutrition (see Figures 21a, 22a, and 24a). This suggeststhat for these three topics, an increase in interest/enjoyment subscale scores was associated with a decreasein the likelihood of response. This negative relationship was only statistically significant for COVID-19.
For more details on the effects of all four IMI subscales on response to the four intervention topics,please view Appendix Tables 17, 18, 19, and 20.
26
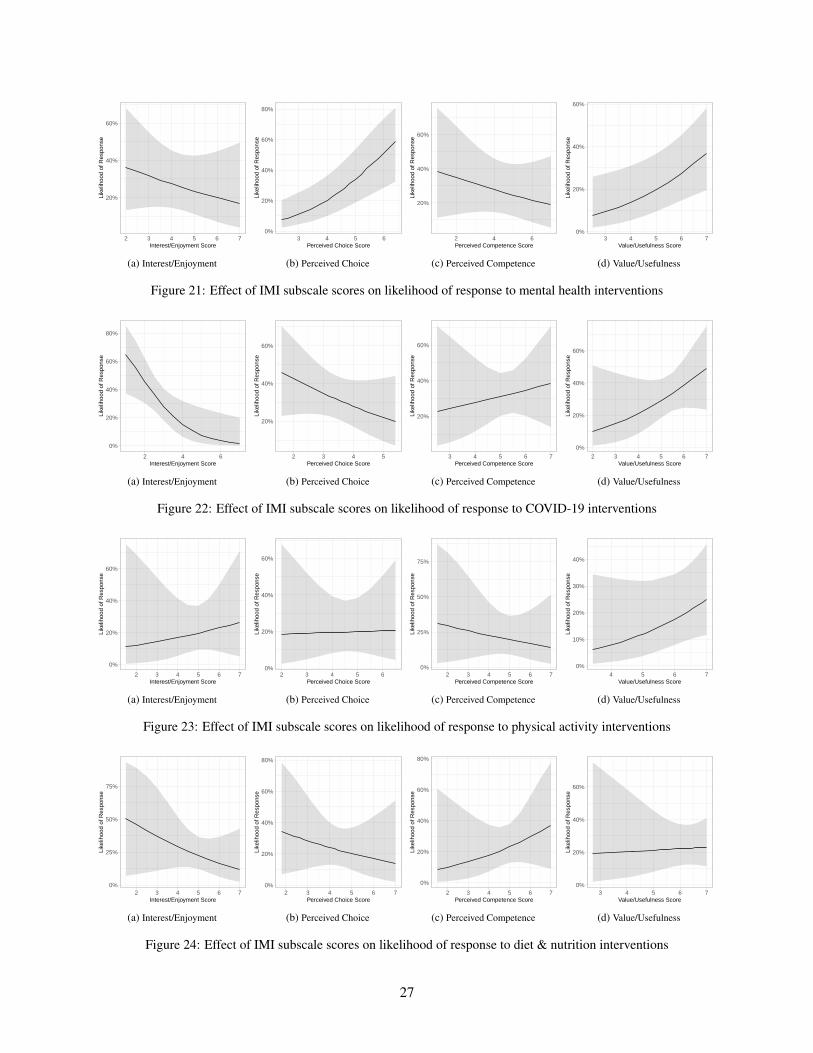
20%
40%
60%
2 3 4 5 6 7Interest/Enjoyment Score
Like
lihoo
d of
Res
pons
e
(a) Interest/Enjoyment
0%
20%
40%
60%
80%
3 4 5 6Perceived Choice Score
Like
lihoo
d of
Res
pons
e(b) Perceived Choice
20%
40%
60%
2 4 6Perceived Competence Score
Like
lihoo
d of
Res
pons
e
(c) Perceived Competence
0%
20%
40%
60%
3 4 5 6 7Value/Usefulness Score
Like
lihoo
d of
Res
pons
e
(d) Value/Usefulness
Figure 21: Effect of IMI subscale scores on likelihood of response to mental health interventions
0%
20%
40%
60%
80%
2 4 6Interest/Enjoyment Score
Like
lihoo
d of
Res
pons
e
(a) Interest/Enjoyment
20%
40%
60%
2 3 4 5Perceived Choice Score
Like
lihoo
d of
Res
pons
e
(b) Perceived Choice
20%
40%
60%
3 4 5 6 7Perceived Competence Score
Like
lihoo
d of
Res
pons
e
(c) Perceived Competence
0%
20%
40%
60%
2 3 4 5 6 7Value/Usefulness Score
Like
lihoo
d of
Res
pons
e
(d) Value/Usefulness
Figure 22: Effect of IMI subscale scores on likelihood of response to COVID-19 interventions
0%
20%
40%
60%
2 3 4 5 6 7Interest/Enjoyment Score
Like
lihoo
d of
Res
pons
e
(a) Interest/Enjoyment
0%
20%
40%
60%
2 3 4 5 6Perceived Choice Score
Like
lihoo
d of
Res
pons
e
(b) Perceived Choice
0%
25%
50%
75%
2 3 4 5 6 7Perceived Competence Score
Like
lihoo
d of
Res
pons
e
(c) Perceived Competence
0%
10%
20%
30%
40%
4 5 6 7Value/Usefulness Score
Like
lihoo
d of
Res
pons
e
(d) Value/Usefulness
Figure 23: Effect of IMI subscale scores on likelihood of response to physical activity interventions
0%
25%
50%
75%
2 3 4 5 6 7Interest/Enjoyment Score
Like
lihoo
d of
Res
pons
e
(a) Interest/Enjoyment
0%
20%
40%
60%
80%
2 3 4 5 6 7Perceived Choice Score
Like
lihoo
d of
Res
pons
e
(b) Perceived Choice
0%
20%
40%
60%
80%
2 3 4 5 6 7Perceived Competence Score
Like
lihoo
d of
Res
pons
e
(c) Perceived Competence
0%
20%
40%
60%
3 4 5 6 7Value/Usefulness Score
Like
lihoo
d of
Res
pons
e
(d) Value/Usefulness
Figure 24: Effect of IMI subscale scores on likelihood of response to diet & nutrition interventions
27

5.2.2 Just-in-Time Response
We recorded an instance of just-in-time response if a participant responded to an initiating message withinten minutes of when it was delivered. Because we defined just-in-time response as a stricter condition thanresponse, we extended H3 to predict that a higher intrinsic motivation score for a topic should be associatedwith a higher likelihood of the participant having just-in-time responses to interventions for that topic.
In our analysis, we were unable to find any significant relationships between IMI subscale scores andjust-in-time response. See Appendix Tables 17, 18, 19, and 20 for more details on the effects of all four IMIsubscales on just-in-time response to the four intervention topics.
We visualized the relationships between each IMI subscale score and the likelihood for just-in-timeresponse to interventions about mental health in Appendix Figure 43, COVID-19 in Appendix Figure 44,physical activity in Appendix Figure 45, and diet & nutrition in Appendix Figure 46. A positive slopeimplies that an increase in the IMI subscale score was associated with an increase in the likelihood of just-in-time response. A negative slope implies that an increase in the IMI subscale score was associated with adecrease in the likelihood of just-in-time response.
We found a statistically insignificant positive slope between value/usefulness subscale scores and thelikelihood of just-in-time response to interventions about mental health, COVID-19, and physical activity,as evident in Appendix Figures 43d, 44d, and 45d. With more data, these positive trends may becomesignificant and support the hypothesis following from H3, that a higher value/usefulness score for a topicshould be associated with a higher likelihood of the participant having just-in-time responses to interventionsfor that topic.
For all four intervention topics, there was a statistically insignificant negative slope for the relationshipbetween interest/enjoyment subscale scores and the likelihood of just-in-time response, as seen in AppendixFigures 43a, 44a, 45a, 46a.
5.2.3 Conversation Engagement
We defined conversation engagement as true if a participant completed the intervention in the time interval(morning, afternoon, evening) in which it was delivered. Because a higher conversation rate indicates greaterreceptivity, we extended H3 to predict that a higher intrinsic motivation score for a topic should be associatedwith a higher likelihood of conversation engagement for interventions about that topic.
Our analysis yielded no significant relationships between IMI subscale scores and conversation engage-ment. See Appendix Tables 17, 18, 19, and 20 for more details on the effects of all four IMI subscales onconversation engagement for the four intervention topics.
We plotted the relationships between each IMI subscale score and the conversation engagement withinterventions about mental health in Appendix Figure 47, COVID-19 in Appendix Figure 48, physical ac-tivity in Appendix Figure 49, and diet & nutrition in Appendix Figure 50. A positive slope implies that anincrease in the IMI subscale score was associated with an increase in the likelihood of conversation engage-ment. A negative slope implies that an increase in the IMI subscale score was associated with a decrease inthe likelihood of conversation engagement.
We found a statistically insignificant positive slope for the relationship between perceived competencesubscale scores and likelihood of conversation engagement for all four intervention topics, as shown inAppendix Figures 47c, 48c, 49c, and 50c. With more data, these positive trends may become significant andsupport the hypothesis following from H3, that having higher perceived competence for a topic increasesthe likelihood of a participant engaging with and completing interventions for that topic.
Similarly, we found a statistically insignificant positive slope for the relationship between value/usefulnesssubscale scores and the likelihood of conversation engagement with interventions about mental health,COVID-19, and physical activity, as evident in Appendix Figures 47d, 48d, and 49d. With more data,
28
these positive trends may become significant and support the hypothesis following from H3, that a highervalue/usefulness score for a topic should be associated with a higher likelihood of the participant engagingwith and completing interventions for that topic.
For all four topics, there was a statistically insignificant negative slope between interest/enjoyment sub-scale scores and the likelihood of conversation engagement, as seen in Appendix Figures 47a, 48a, 49a,and 50a.
5.2.4 Response Delay
We measured response delay as the number of minutes between when a participant responded to an initiatingmessage and when the initiating message was delivered. Any unanswered initiating messages were droppedfrom the data set. We interpreted lower response delay as indicating greater receptivity to an intervention.
We found that a one-point increase in the interest/enjoyment IMI subscale score was associated with anincrease in the response delay to mental health interventions by 31.01 minutes, with χ2(1) = 3.843, p < .05.This result counters H4, that the higher a participant’s intrinsic motivation for a topic, the lower the responsedelay for interventions about that topic. We were unable to find any other significant relationships betweenIMI subscale scores and response delay. For more details on the effects of all four IMI subscales on responsedelay for the four intervention topics, see Appendix Tables 17, 18, 19, and 20.
We visualized the relationships between each IMI subscale score and response delay for interventionsabout mental health in Figure 25, COVID-19 in Figure 26, physical activity in Figure 27, and diet & nutritionin Figure 28. A positive slope implies that an increase in the IMI subscale score was associated with anincrease in the response delay in minutes. A negative slope implies that an increase in the IMI subscale wasassociated with a decrease in the response delay in minutes.
For COVID-19, physical activity, and diet & nutrition, there was a statistically insignificant negativeslope for the relationship between value/usefulness subscale scores and likelihood of conversation engage-ment, as seen in Figures 26d, 27d, and 28d. With more data, these negative trends may become significantand support H4, that is, the higher a participant’s intrinsic motivation for a topic, the lower the responsedelay for interventions about that topic.
29

0
50
100
150
200
250
2 3 4 5 6Interest/Enjoyment Score
Res
pons
e D
elay
(in
min
utes
)
(a) Interest/Enjoyment
50
100
150
3 4 5 6Perceived Choice Score
Res
pons
e D
elay
(in
min
utes
)(b) Perceived Choice
0
50
100
150
200
2 4 6Perceived Competence Score
Res
pons
e D
elay
(in
min
utes
)
(c) Perceived Competence
50
100
150
200
3 4 5 6 7Value/Usefulness Score
Res
pons
e D
elay
(in
min
utes
)
(d) Value/Usefulness
Figure 25: Effect of IMI subscale scores on response delay for mental health interventions
50
100
150
200
1 2 3 4Interest/Enjoyment Score
Res
pons
e D
elay
(in
min
utes
)
(a) Interest/Enjoyment
0
50
100
150
200
2 3 4 5Perceived Choice Score
Res
pons
e D
elay
(in
min
utes
)
(b) Perceived Choice
0
100
200
4 5 6 7Perceived Competence Score
Res
pons
e D
elay
(in
min
utes
)
(c) Perceived Competence
0
100
200
300
400
3 4 5 6 7Value/Usefulness Score
Res
pons
e D
elay
(in
min
utes
)
(d) Value/Usefulness
Figure 26: Effect of IMI subscale scores on response delay for COVID-19 interventions
−100
0
100
200
300
400
3 4 5 6 7Interest/Enjoyment Score
Res
pons
e D
elay
(in
min
utes
)
(a) Interest/Enjoyment
0
50
100
150
200
250
3 4 5 6Perceived Choice Score
Res
pons
e D
elay
(in
min
utes
)
(b) Perceived Choice
−100
0
100
200
300
3 4 5 6 7Perceived Competence Score
Res
pons
e D
elay
(in
min
utes
)
(c) Perceived Competence
0
100
200
300
400
4 5 6 7Value/Usefulness Score
Res
pons
e D
elay
(in
min
utes
)
(d) Value/Usefulness
Figure 27: Effect of IMI subscale scores on response delay for physical activity interventions
0
100
200
2 3 4 5 6 7Interest/Enjoyment Score
Res
pons
e D
elay
(in
min
utes
)
(a) Interest/Enjoyment
−50
0
50
100
150
200
3 4 5Perceived Choice Score
Res
pons
e D
elay
(in
min
utes
)
(b) Perceived Choice
0
100
200
3 4 5 6 7Perceived Competence Score
Res
pons
e D
elay
(in
min
utes
)
(c) Perceived Competence
0
50
100
150
200
3 4 5 6 7Value/Usefulness Score
Res
pons
e D
elay
(in
min
utes
)
(d) Value/Usefulness
Figure 28: Effect of IMI subscale scores on response delay for diet & nutrition interventions
30

5.3 Exploring Whether a Relationship Exists Between Total IMI Scores and ReceptivityIn-the-Moment Within a Topic
In this section, we evaluate whether there was a relationship between total IMI scores and metrics forreceptivity in-the-moment, which include response, just-in-time response, conversation engagement, andresponse delay. Total IMI scores were calculated by adding together the four IMI subscale scores.
For the binary variables response, just-in-time response, and conversation engagement, we used gener-alized linear mixed effects models. For the continuous variable response delay, we used linear mixed effectsmodels. In both kinds of mixed effects models, we set the fixed effect as the total IMI score.
5.3.1 Response
We were unable to find a significant relationship between total IMI score and response for any of the fourintervention topics.
In Appendix Figure 51, we plotted the relationships between total IMI score and likelihood of responsefor each topic. A positive slope implies that an increase in the total IMI score was associated with an increasein the likelihood of response. A negative slope implies that an increase in the total IMI score was associatedwith a decrease in the likelihood of response.
There was a statistically insignificant positive slope for mental health, COVID-19, and physical activity,as evident in Appendix Figures 51a, 51b, and 51c. With more data, these positive trends may becomesignificant and support H3, that a higher total IMI score for a topic should be associated with an increasesin the likelihood of response to interventions for that topic.
5.3.2 Just-in-Time Response
We did not find a significant relationship between total IMI score and just-in-time response for any of thefour intervention topics.
In Appendix Figure 52, we visualized the relationships between total IMI score and likelihood of just-in-time response for each topic. A positive slope implies that an increase in the total IMI score was associatedwith an increase in the likelihood of just-in-time response. A negative slope implies that an increase in thetotal IMI score was associated with a decrease in the likelihood of just-in-time response.
For COVID-19 and physical activity, there was a statistically insignificant positive slope, as shown inAppendix Figures 52b and 52c. With more data, these positive trends may become significant and supportthe hypothesis following from H3, that a higher total IMI score for a topic should be associated with anincrease in the likelihood of the participant responding just-in-time to interventions for that topic.
5.3.3 Conversation Engagement
There was no significant relationship between total IMI score and conversation engagement for any of thefour intervention topics.
In Appendix Figure 53, we plotted the relationships between total IMI score and likelihood of con-versation engagement for each topic. A positive slope implies that an increase in the total IMI score wasassociated with an increase in the likelihood of conversation engagement. A negative slope implies that anincrease in the total IMI score was associated with a decrease in the likelihood of conversation engagement.
There was a statistically insignificant positive slope for the mental health and COVID-19 graphs, asseen in Appendix Figures 53a and 53b. With more data, these positive trends may become significant andsupport the hypothesis following from H3, that higher intrinsic motivation for a topic increases the likelihoodof conversation engagement for interventions about that topic.
31

0
100
200
12 16 20 24Total IMI Score
Res
pons
e D
elay
(in
min
utes
)
(a) Mental Health
0
100
200
300
10.0 12.5 15.0 17.5 20.0 22.5Total IMI Score
Res
pons
e D
elay
(in
min
utes
)(b) COVID-19
0
100
200
300
16 20 24Total IMI Score
Res
pons
e D
elay
(in
min
utes
)
(c) Physical Activity
0
100
200
10 15 20 25Total IMI Score
Res
pons
e D
elay
(in
min
utes
)
(d) Diet & Nutrition
Figure 29: Effect of total IMI scores on response delay for intervention topics
5.3.4 Response Delay
We found a significant positive relationship between total IMI scores and response delay. A one-pointincrease in the total IMI score was associated with an increase in the response delay by 12.39 minutes formental health interventions, χ2(1) = 7.009, p < .05. This counters H4, that higher intrinsic motivation fora topic decreases the response delay for that topic.
In Figure 29, we visualize the relationships between total IMI score and response delay for each topic.A positive slope implies that an increase in the the total IMI score was associated with an increase in theresponse delay. A negative slope implies that an increase in the total IMI score was associated with adecrease in the response delay.
There was a statistically insignificant negative slope for COVID-19 and physical activity, as evident inFigure 29b and Figure 29c. With more data, these negative trends may become significant and support H4,that higher intrinsic motivation for a topic decreases the response delay for that topic.
5.4 Exploring Whether a Relationship Exists Between IMI Subscale Scores and ReceptivityOver a Given Time Period Within a Topic
In this section, we evaluate whether there was a relationship between IMI subscale scores and metrics forreceptivity over a given time period, which include overall response rate, just-in-time response rate, con-versation rate, and average response delay. Because these were all defined as continuous variables, weused generalized linear mixed effects models. We set the fixed effects as IMI subscale scores for inter-est/enjoyment, perceived choice, perceived competence, and value/usefulness. There were 20 groups, thenumber of participants who completed the study.
5.4.1 Overall Response Rate
We defined overall response rate as the fraction of initiating messages that a participant responded to over atime period.
For mental health initiating messages, we found that a one-point increase in the perceived choice sub-scale score was associated with an increase in the overall response rate by 11.03%, with χ2(1) = 4.311, p <.05. Since the perceived choice subscale is theorized to positively predict self-report measures of intrinsicmotivation, this statistically-significant positive relationship supported H3, that is, the higher a participant’sintrinsic motivation for a topic, the higher the likelihood the participant will respond to initiating messagesfor that topic. This could also be explained in terms of Self-Determination Theory, which argues that greaterperceived autonomy enhances intrinsic motivation and self-regulation of behavior. Higher perceived choice
32

subscale scores perhaps indicated certain participants had begun self regulating their behavior of respondingto initiating messages about mental health.
We also found for mental health interventions that a one-point increase in the value/usefulness subscalescore was associated with an increase in the overall response rate by 8.02%, with χ2(1) = 4.114, p < .05.Similarly, for physical activity a one-point increase in the value/usefulness subscale score was associatedwith an increase in the overall response rate by 13.47%, with χ2(1) = 8.548, p < .01. Because thevalue/usefulness subscale is theorized to indicate internalization, the positive relationship found betweenvalue/usefulness scores and overall response rate for mental health and physical activity perhaps indicatedparticipants had internalized the value of responding to mental health and physical activity interventions.
For initiating messages about COVID-19, we found a statistically significant negative relationship be-tween the interest/enjoyment subscale score and the overall response rate. A one-point increase in theinterest/enjoyment subscale score was associated with a decrease in the overall response rate by 12.69%,with χ2(1) = 4.680, p < .05.
We then visualized the relationship between the four IMI subscale scores and the overall response rateto interventions about mental health in Figure 30, COVID-19 in Figure 31, physical activity in Figure 32,and diet & nutrition in Figure 33. A positive slope implies that an increase in the IMI subscale score wasassociated with an increase in the overall response rate. A negative slope implies that an increase in the IMIsubscale score was associated with a decrease in the overall response rate.
Of the four IMI subscales, only the value/usefulness subscale had a positive relationship with the like-lihood of response for all four intervention topics, as evident in Figures 30d, 31d, 32d, and 33d. Whilewe found this relationship to be significant for only mental health and physical activity, the general trendacross all topics aligns with H3, that a higher value/usefulness score for a topic should be associated withan increase in the overall response rate to interventions for that topic.
We also observed a negative relationship between the interest/enjoyment subscale and the overall re-sponse rate for all four topics (see Figures 30a, 31a, 32a, and 33a). This negative relationship was onlysignificant for COVID-19.
For more details on the effects of all four IMI subscales on response to the four intervention topics,please view Appendix Tables 25, 26, 27, and 28.
33

0.0
0.3
0.6
2 3 4 5 6 7Interest/Enjoyment Score
Ove
rall
Res
pons
e R
ate
(a) Interest/Enjoyment
0.0
0.2
0.4
0.6
0.8
3 4 5 6Perceived Choice Score
Ove
rall
Res
pons
e R
ate
(b) Perceived Choice
0.00
0.25
0.50
0.75
2 4 6Perceived Competence Score
Ove
rall
Res
pons
e R
ate
(c) Perceived Competence
−0.2
0.0
0.2
0.4
0.6
2 3 4 5 6 7Value/Usefulness Score
Ove
rall
Res
pons
e R
ate
(d) Value/Usefulness
Figure 30: Effect of IMI subscale scores on overall response rate for mental health interventions
−0.5
0.0
0.5
2 4 6Interest/Enjoyment Score
Ove
rall
Res
pons
e R
ate
(a) Interest/Enjoyment
0.2
0.4
0.6
0.8
2 3 4 5Perceived Choice Score
Ove
rall
Res
pons
e R
ate
(b) Perceived Choice
0.0
0.5
3 4 5 6 7Perceived Competence Score
Ove
rall
Res
pons
e R
ate
(c) Perceived Competence
0.00
0.25
0.50
0.75
2 3 4 5 6 7Value/Usefulness Score
Ove
rall
Res
pons
e R
ate
(d) Value/Usefulness
Figure 31: Effect of IMI subscale scores on overall response rate for COVID-19 interventions
0.0
0.4
0.8
2 3 4 5 6 7Interest/Enjoyment Score
Ove
rall
Res
pons
e R
ate
(a) Interest/Enjoyment
0.0
0.2
0.4
0.6
0.8
2 3 4 5 6Perceived Choice Score
Ove
rall
Res
pons
e R
ate
(b) Perceived Choice
0.00
0.25
0.50
0.75
2 3 4 5 6 7Perceived Competence Score
Ove
rall
Res
pons
e R
ate
(c) Perceived Competence
−0.6
−0.3
0.0
0.3
0.6
3 4 5 6 7Value/Usefulness Score
Ove
rall
Res
pons
e R
ate
(d) Value/Usefulness
Figure 32: Effect of IMI subscale scores on overall response rate for physical activity interventions
0.0
0.4
0.8
1.2
2 3 4 5 6 7Interest/Enjoyment Score
Ove
rall
Res
pons
e R
ate
(a) Interest/Enjoyment
0.0
0.2
0.4
0.6
2 3 4 5 6 7Perceived Choice Score
Ove
rall
Res
pons
e R
ate
(b) Perceived Choice
−0.25
0.00
0.25
0.50
0.75
2 3 4 5 6 7Perceived Competence Score
Ove
rall
Res
pons
e R
ate
(c) Perceived Competence
−0.4
0.0
0.4
3 4 5 6 7Value/Usefulness Score
Ove
rall
Res
pons
e R
ate
(d) Value/Usefulness
Figure 33: Effect of IMI subscale scores on overall response rate for diet & nutrition interventions
34

5.4.2 Just-in-Time Response Rate
We defined just-in-time response rate as the fraction of initiating messages that a participant respondedto within ten minutes of delivery, over a given time period. We did not find any significant relationshipsbetween IMI subscale scores and just-in-time response rate for any of the four intervention topics. SeeAppendix Tables 25, 26, 27, and 28 for more details on the effects of all four IMI subscales on just-in-timeresponse rate to the four intervention topics.
We visualized the relationships between each IMI subscale score and the just-in-time response rateto interventions about mental health in Appendix Figure 54, COVID-19 in Appendix Figure 55, physicalactivity in Appendix Figure 56, and diet & nutrition in Appendix Figure 57. A positive slope implies thatan increase in the IMI subscale score was associated with an increase in the just-in-time response rate. Anegative slope implies that an increase in the IMI subscale score was associated with a decrease in thejust-in-time response rate.
We found a statistically insignificant positive relationship between value/usefulness subscale scores andthe likelihood of just-in-time response to interventions about mental health, COVID-19, and physical activ-ity, as evident in Appendix Figures 54d, 55d, and 56d. With more data, these positive trends may becomesignificant and support the hypothesis following from H3, that a value/usefulness score for a topic should beassociated with a higher just-in-time response rate to interventions for that topic.
For all four intervention topics, there was a statistically insignificant negative slope for the relation-ship between interest/enjoyment subscale scores and the just-in-time response rate, as seen in AppendixFigures 54a, 55a, 56a, 57a.
5.4.3 Conversation Rate
We defined conversation rate as the fraction of initiating messages for which the participant completed theintervention, over a given time period. We were unable to find any significant relationships between IMIsubscale scores and conversation rate for any of the four intervention topics. For more details on the effectsof all four IMI subscales on conversation rate for the four intervention topics, see Appendix Tables 25, 26,27, and 28.
We visualized the relationships between each IMI subscale score and the conversation rate to interven-tions about mental health in Appendix Figure 58, COVID-19 in Appendix Figure 59, physical activity inAppendix Figure 60, and diet & nutrition in Appendix Figure 61. A positive slope implies that an increasein the IMI subscale score was associated with an increase in the conversation rate. A negative slope impliesthat an increase in the IMI subscale score was associated with a decrease in the conversation rate.
We found a statistically insignificant positive slope between value/usefulness subscale scores and theconversation rate for interventions about mental health, physical activity, and diet & nutrition, as evidentin Appendix Figures 58d, 60d, and 61d. With more data, these positive trends may become significantand support the hypothesis following from H3, that a higher value/usefulness score for a topic should beassociated with an increase in the participant’s conversation rate for interventions about that topic.
Similarly, we also found a statistically insignificant positive slope between perceived competence sub-scale scores and the conversation rate for interventions about COVID-19, physical activity, and diet & nu-trition, as evident in Appendix Figures 59d, 60d, and 61d. This positive trend aligns with the hypothesisfollowing from H3, that a higher perceived/competence score for a topic should be associated with an in-crease in the participant’s conversation rate for interventions about that topic.
For all four intervention topics, there was a statistically insignificant negative slope for the relationshipbetween interest/enjoyment subscale scores and the conversation rate, as seen in Appendix Figures 58a, 59a,60a, 61a.
35

5.4.4 Average Response Delay
We defined average response delay as the mean response delay over a given time period. We interpretedlower average response delay as indicating greater receptivity to an intervention. Thus H4 predicts that ahigher intrinsic motivation score for a topic should be associated with a lower average response delay forinterventions about that topic.
For physical activity initiating messages, we found a one-point increase in the perceived competencesubscale score was associated with a decrease in the average response delay by 54.04 minutes, with χ2(1) =4.075, p < .05. This result supported H4, that a higher perceived competence score for a topic should beassociated with a lower average response delay for interventions about that topic.
We also found evidence of a statistically significant positive relationship between interest/enjoymentsubscale scores and average response delay. For physical activity interventions, we found that a one-pointincrease in the interest/enjoyment subscale score was associated with an increase in the average responsedelay by 36.35 minutes, with χ2(1) = 4.034, p < .05. With regards to mental health interventions, wefound that a one-point increase in the interest/enjoyment subscale score was associated with an increase inthe average response delay by 40.54 minutes, with χ2(1) = 6.660, p < .01.
We visualized the relationships between each IMI subscale score and the average response delay tointerventions about mental health, COVID-19, and physical activity in Figures 34, 36, and 37. A positiveslope implies that an increase in the IMI subscale score was associated with an increase in the averageresponse delay. A negative slope implies that an increase in the IMI subscale score was associated with adecrease in the average response delay.
We found a statistically insignificant negative slope between perceived competence subscale scores andthe average response delay for interventions about mental health, COVID-19, and diet & nutrition, as evidentin Figures 34, 35, and 37. The only negative relationship with statistical significance was physical activity.With more data, these positive trends may become significant and support H4, that a higher perceivedcompetence score for a topic should be associated with an decrease in the participant’s average responsedelay for interventions about that topic.
For more details on the effects of all four IMI subscales on average response delay for the four interven-tion topics, please view Appendix Tables 25, 26, 27, and 28.
36

0
100
200
2 3 4 5 6Interest/Enjoyment Score
Ave
rage
Res
pons
e D
elay
(in
min
utes
)
(a) Interest/Enjoyment
100
150
200
3 4 5 6Perceived Choice Score
Ave
rage
Res
pons
e D
elay
(in
min
utes
)(b) Perceived Choice
50
100
150
200
2 4 6Perceived Competence Score
Ave
rage
Res
pons
e D
elay
(in
min
utes
)
(c) Perceived Competence
0
50
100
150
2 3 4 5 6 7Value/Usefulness Score
Ave
rage
Res
pons
e D
elay
(in
min
utes
)
(d) Value/Usefulness
Figure 34: Effect of IMI subscale scores on average response delay for mental health interventions
0
100
200
1 2 3 4Interest/Enjoyment Score
Ave
rage
Res
pons
e D
elay
(in
min
utes
)
(a) Interest/Enjoyment
0
100
200
2 3 4 5Perceived Choice Score
Ave
rage
Res
pons
e D
elay
(in
min
utes
)
(b) Perceived Choice
0
100
200
300
4 5 6 7Perceived Competence Score
Ave
rage
Res
pons
e D
elay
(in
min
utes
)
(c) Perceived Competence
0
100
200
300
3 4 5 6 7Value/Usefulness Score
Ave
rage
Res
pons
e D
elay
(in
min
utes
)
(d) Value/Usefulness
Figure 35: Effect of IMI subscale scores on average response delay for COVID-19 interventions
0
100
200
300
3 4 5 6 7Interest/Enjoyment Score
Ave
rage
Res
pons
e D
elay
(in
min
utes
)
(a) Interest/Enjoyment
0
50
100
150
200
2 3 4 5 6Perceived Choice Score
Ave
rage
Res
pons
e D
elay
(in
min
utes
)
(b) Perceived Choice
0
100
200
2 3 4 5 6 7Perceived Competence Score
Ave
rage
Res
pons
e D
elay
(in
min
utes
)
(c) Perceived Competence
100
200
300
4 5 6 7Value/Usefulness Score
Ave
rage
Res
pons
e D
elay
(in
min
utes
)
(d) Value/Usefulness
Figure 36: Effect of IMI subscale scores on average response delay for physical activity interventions
−100
0
100
200
2 3 4 5 6 7Interest/Enjoyment Score
Ave
rage
Res
pons
e D
elay
(in
min
utes
)
(a) Interest/Enjoyment
−50
0
50
100
150
3 4 5Perceived Choice Score
Ave
rage
Res
pons
e D
elay
(in
min
utes
)
(b) Perceived Choice
−100
0
100
200
300
3 4 5 6 7Perceived Competence Score
Ave
rage
Res
pons
e D
elay
(in
min
utes
)
(c) Perceived Competence
0
100
3 4 5 6 7Value/Usefulness Score
Ave
rage
Res
pons
e D
elay
(in
min
utes
)
(d) Value/Usefulness
Figure 37: Effect of IMI subscale scores on average response delay for diet & nutrition interventions
37

6 Discussion
In this section, we summarize our findings and evaluate whether our results supported or failed to supportour hypotheses. We also attempt to explain statistically significant results that countered our hypotheses, aswell as any limitations that may have affected our results.
6.1 H1 and H2 – No Relationship Found Between Mean Intrinsic Motivation and MeanReceptivity Over a Given Time Period Across Topics
In our first two hypotheses, we predicted that a positive relationship exists between mean intrinsic motivationscores and mean receptivity metrics across topics. H1 specified that a higher intrinsic motivation score foran intervention topic compared to other topics would be associated with a higher average overall responserate to messages about that topic compared to other topics. H2 specified that a higher intrinsic motivationscore for an intervention topic compared to other topics would be associated with a lower average responsedelay for messages about that topic compared to other topics.
In our across-topics analyses of mean receptivity metrics over a given period of time compared to meanintrinsic motivation measures, we found statistically significant pairwise differences in IMI subscale andtotal IMI scores across topics. However we were not able to find statistically significant pairwise differencesin overall response rate, just-in-time response rate, and average response delay. This lack of statisticallysignificant differences in receptivity metrics failed to support H1 and H2’s claim that a positive relationshipexists between intrinsic motivation scores and receptivity across topics.
The one receptivity metric for which we found statistically significant pairwise differences was conver-sation engagement. The pairwise comparisons included COVID-19 – diet & nutrition, and COVID-19 –physical activity, with positive estimates statistically significant at p < .05. The same pairwise differenceshad statistically significant negative estimates for interest/enjoyment, perceived choice, value/usefulness,and total IMI scores. Because the pairwise difference estimates were in opposing directions, this resultfailed to support the hypothesized positive relationship between intrinsic motivation scores and conversa-tion engagement across topics.
The statistically significant negative pairwise differences between COVID-19 – diet & nutrition, andCOVID-19 – physical activity for interest/enjoyment, perceived choice, value/usefulness, and total IMIscores suggested that participants (on average) perceived following COVID-19 guidelines as less enjoyable,less autonomous, less valuable, and less intrinsically motivated than eating well and maintaining a good diet,or keeping a physical activity routine. This observation might be explained by participants’ fatigue fromfollowing COVID-19 guidelines during a prolonged pandemic. This study was conducted from the start ofApril until the end of May 2021, as vaccinations became readily distributed around the United States, andthe CDC began relaxing social gathering and mask-wearing guidelines. As COVID-19 guidelines and risksfrom infection decreased over the course of the study, participants may have found COVID-19 guidelinesless interesting or useful compared to other topics. The mean COVID-19 perceived choice score beinglower than the mean perceived choice score for diet & nutrition and physical activity may be attributed toour participants being Dartmouth College students. 45% of our participants lived on-campus during thestudy, and were required to follow college COVID-19 guidelines to retain on-campus privileges. They werenot required by the college to maintain a good diet or physical activity routine, perhaps contributing to meanperceived choice scores for diet & nutrition and physical activity being higher than mean perceived choicescores for COVID-19.
In contrast, the statistically significant negative pairwise differences between COVID-19 – diet & nutri-tion, and COVID-19 – physical activity showed that participants had (on average) higher around 14% higherconversation engagement with COVID-19 interventions than diet & nutrition or physical activity interven-tions. One possible explanation for the higher conversation engagement with COVID-19 interventions is the
38

saliency of the COVID-19 topic. Even if participants did not feel intrinsically motivated to follow COVID-19 guidelines compared to other topics, because of the importance of COVID-19 in participants’ lives, theyengaged more with COVID-19 interventions.
6.2 H3 and H4 – Positive Relationships Found Between Intrinsic Motivation and Receptiv-ity Within Topics
In our third and fourth hypotheses, we argued that a positive relationship should exist between intrinsicmotivation scores and receptivity within topics.
H3 specifically stated that a higher intrinsic motivation score should be associated with a higher likeli-hood of response for initiating messages about that topic. We found several instances of statistically signif-icant positive relationships between intrinsic motivation scores and metrics related to response. For mentalhealth, we found a one-point increase in the perceived choice score was associated with an 11.4% increasein the log-likelihood of response (p < .001). We also found that a one-point increase in the value/usefulnessscore corresponded with a 6.83% increase in the log-likelihood of response to mental health interventions(p < .05).
Similarly, for mental health we found a one-point increase in the perceived choice score was associatedwith an increase in the overall response rate over a time period by 11.03% (p < .05). An increase in thevalue/usefulness score was associated with a 8.02% increase in the overall response rate for mental healthinterventions (p < .05). For physical activity interventions, we discovered that a one-point increase in thevalue/usefulness score corresponded with a 13.47% increase in overall response rate (p < .05). Regardingdiet & nutrition interventions, a one-point increase in the value/usefulness score was associated with anincrease in overall response rate of 15.01% (p < .05).
These statistically significant positive relationships found between perceived choice scores, value/usefulnessscores and response metrics provided support for H3. In addition, we found statistically insignificant positivetrends for value/usefulness scores and the likelihood of response, likelihood of just-in-time response, like-lihood of conversation engagement, overall response rate, just-in-time response rate, and conversation ratefor at least three of the four intervention topics. This consistent trend with our small sample size suggeststhat the value/usefulness scale may be a viable subscale to include in future studies. The value/usefulnesssubscale relates to the SDT concept of internalization, that people who take in the value of a behavior aremore likely to self-regulate that behavior. It also supports previous research findings on phone notificationsthat people are more likely to respond to notifications whose content they view as useful [16].
H4 specifies that a higher intrinsic motivation score should correspond to a lower response delay forinterventions about that topic. We found that for diet & nutrition interventions, a one-point increase inperceived competence score led to a decrease in the average response delay by 54.05 minutes (p < .05).This finding supported H4’s predicted negative relationship between intrinsic motivation and response delay.
6.3 H3 and H4 – Negative Relationships Found Between Intrinsic Motivation and Recep-tivity Within Topics
We found a couple of statistically significant negative relationships between intrinsic motivation scoresand response metrics. For COVID-19, we found a one-point increase in the interest/enjoyment score wasassociated with a decrease in the log-likelihood of response by 10.5% (p < .05). Similarly, a one-pointincrease in interest/enjoyment scores was associated with a 12.69% decrease in the overall response ratetowards COVID-19 interventions (p < .05).
One possible explanation for the negative relationship between interest/enjoyment scores and the loglikelihood of response is that our model did not take into account the temporal dynamics of interest/enjoymentscores and likelihood of response to COVID-19 interventions over the course of the study. The change in
39

0%
20%
40%
60%
80%
0 5 10 15 20Days Since Start of Trial
Like
lihoo
d of
Res
pons
e
(a) Likelihood of response to COVID-19 interven-tions over the course of the study
2.25
2.50
2.75
3.00
3.25
0 5 10 15 20Days Since Start of Trial
Inte
rest
/Enj
oym
ent S
core
(b) COVID-19 interest/enjoyment scores over thecourse of the study
Figure 38: Temporal dynamics for COVID-19 interest/enjoyment score and likelihood of response
mean likelihood of response over days since the start of the trial was shown to have a statistically significantdecrease in Figure 38a, with the shaded region for the 95% confidence interval. The mean interest/enjoymentscore was shown in Figure 38b to have increased slightly over the course of the trial, with the the shadedregion representing the 95% confidence interval.
As evident in Figure 38a, the log likelihood of response had a statistically significant decrease from amean of 67.4% to 7.8%. The Elena+ COVID-19 intervention content was meant for a global audience, soit contained generic versions of the World Health Organization’s COVID-19 guidelines. Because our studybegan in early April 2021 as the United States rolled out vaccinations and loosened CDC guidelines, partic-ipants may have found the (outdated) COVID-19 intervention content less interesting or useful, becomingless likely to respond as the trial continued.
Because Figure 38b shows the mean interest/enjoyment score only increased from 2.68 to 2.95, it’spossible that the increase in interest/enjoyment for COVID-19 does not fully explain the negative relation-ship with likelihood of response. More causal studies are needed to find out the extent to which inter-est/enjoyment scores contribute to the negative relationship with likelihood of response.
We also found statistically insignificant negative trends for interest/enjoyment scores and the likelihoodof response, likelihood of just-in-time response, likelihood of conversation engagement, overall responserate, just-in-time response rate, and conversation rate for at least three of the four intervention topics. Thisconsistent trend with our small sample size suggests that the there may be a disconnect between the inter-est/enjoyment for the topics measured by the IMIs and the interest/enjoyment participants had for the Elena+interventions.
When participants were asked in the post-study survey if “the content and messaging with Elena wasinteresting and engaging,” 19.05% of participants selected “Strongly disagree,” and 38.10% selected “Dis-agree,” showing that a majority of participants did not find the interventions interesting. 33.33% of partici-pants selected “Strongly agree” and 9.52% selected “Agree” when asked whether “for all types of notifica-tions, the content of the notification was important while deciding if you want to respond to the notification.”This suggests that while participants may have expressed high interest in the underlying intervention topics,a majority were disinterested in the intervention content, possibly influencing participants’ response andengagement with interventions.
There may also have been other context factors that outweighed any interest/enjoyment participantshad for that topic. 14.29% of participants selected “Strongly disagree” and 52.38% of participants selected“Disagree” for the statement that “the notifications from Elena were generated at times I was not busywith anything else,” showing that a majority of participants were engaged in some activity when receiving
40

initiating messages. The timing of interventions when participants were engaged with some activity mayhave decreased the likelihood of response and just-in-time response, as 33.33% of participants selected“Strongly agree” and 38.10% selected “Agree” when asked whether they “responded to notifications withElena only when I was free or not doing anything else.” Delivery when participants were busy may have alsodecreased the likelihood of conversation engagement, as 42.86% of participants selected “Strongly agree”and 25.57% selected “Agree” when asked whether they “engaged in chat-conversations with Elena onlywhen I was free or not doing anything else.”
In our analysis, we found a few examples of a statistically significant positive relationship betweenintrinsic motivation scores and response delay or average response delay. For mental health, we found aone point increase in interest/enjoyment score was associated with an increase in response delay by 31.01minutes (p < .05). Similarly, a one point increase in interest/enjoyment score corresponded to an increaseof 40.54 minutes in average response delay for mental health interventions (p < .01). For diet & nutritioninterventions, we found a one-point increase in interest/enjoyment was associated with an increase in averageresponse delay by 36.55 minutes (p < .05).
One possible explanation for the statistically significant positive relationship between interest/enjoymentscores and response delay for mental health is that our model did not take into account the temporal dynamicsof interest/enjoyment scores and response delay to mental health interventions over the course of the study.The response delay was shown to have a statistically significant increase from 87.29 minutes to 193.02minutes over the course of the trial in Figure 39a, with the shaded region for the 95% confidence interval.The mean interest/enjoyment score was shown in Figure 39b to have increased slightly from 2.68 to 2.95over the course of the trial, with the the shaded region representing the 95% confidence interval.
Perhaps participants’ interest/enjoyment for working on improving their mental health stayed constantor increased, however their interest/enjoyment for the mental health interventions decreased over the courseof the study. We speculate that a possible decrease in interest/enjoyment or value/usefulness for the inter-ventions could explain the increase in response delay and average response delay over the course of thestudy. In future studies, the IMIs could be changed to be about the interventions instead of the underlyinghealth goals the interventions are trying to promote. Such a change in study design would allow researchersto determine the relationship between interest/enjoyment for the intervention and receptivity toward suchinterventions.
100
200
0 5 10 15 20Days Since Start of Trial
Res
pons
e D
elay
(m
inut
es)
(a) Response delay to mental health interventions over the courseof the study
4.0
4.5
0 5 10 15 20Days Since Start of Trial
Inte
rest
/Enj
oym
ent S
core
(b) Mental health interest/enjoyment scores over the course of thestudy
Figure 39: Temporal dynamics for mental health interest/enjoyment score and response delay
41

6.4 Limitations
One limitation of our work was the small sample size of 20 participants. All our participants were Dart-mouth students, who may be more homogeneous than the general population. Dartmouth students may havesimilar intrinsic motivation levels for various topics due to campus culture or similar backgrounds. The gen-eral population likely has greater variation in intrinsic motivation both within and across topics. Thus themagnitude of the relationships we found between intrinsic motivation and receptivity could be understatedcompared to what might be found with a more diverse set of participants.
Another limitation of our study was that we did not create IMIs about the interventions themselves. Asdiscussed in the previous section, there may be disconnect between the interest/enjoyment participants havefor the underlying topic of interventions compared to the interest/enjoyment for the related interventionsthemselves.
A third limitation of our study could be the inclusion of COVID-19 as a topic. The relationships foundbetween intrinsic motivation and receptivity for COVID-19 interventions often were in the opposite directionthan expected. The topic saliency of COVID-19 may have affected participants’ IMI survey responses andreceptivity to COVID-19 interventions. In addition, the COVID-19 situation changed during the courseof the study, with vaccinations ramping up in New Hampshire and across the country, and COVID-19guidelines being rolled back. The evolving nature of the COVID-19 situation may have affected participants’intrinsic motivation toward following COVID-19 guidelines, and affected participants’ receptivity towardsCOVID-19 interventions.
7 Summary and Conclusion
In this study, we examined whether across-topic and within-topic relationships exist between measures ofintrinsic motivation for the underlying mHealth intervention topics and receptivity metrics. We conducteda study with 20 participants over 3 weeks at Dartmouth College. At a random time during three dailyintervals, participants received an mHealth intervention about one of four topics: mental health, COVID-19,physical activity, and diet & nutrition. To deliver our interventions, we deployed a modified version of theElena+ iOS app [19] and the MobileCoach platform [6, 11]. We measured receptivity in-the-moment usingresponse, just-in-time response, conversation engagement, and response delay, as well as receptivity over agiven period of time using response rate, just-in-time response rate, conversation rate, and average responsedelay.
Our exploratory analysis found that significant differences in mean intrinsic motivation scores acrosstopics were not associated with differences in mean receptivity metrics across topics. We also found thatpositive relationships exist between intrinsic motivation measures and likelihood of response for interven-tions about a topic.
The lack of relationship between mean intrinsic motivation scores and mean receptivity metrics acrosstopics suggests that differences in intrinsic motivation across various topics should not be used by JITAIsto choose what intervention topic to deliver to recipients. In general, recipients will be similarly receptiveacross topics.
The existence of a positive relationship between intrinsic motivation measures and receptivity for inter-ventions about a single topic suggest the potential for JITAIs that incorporate techniques to monitor and im-prove intrinsic motivation. Intrinsic motivation can be enhanced by goal-setting, motivational interviewing,and supporting a recipient’s sense of autonomy, competence or relatedness for a behavior. Self-regulationof behaviors can be promoted through internalization, the taking in of the value of a behavior. Since wefound both significant and insignificant positive relationships between value/usefulness IMI subscale scoresand receptivity, future researchers could periodically assess participants’ personal values and the value theyassign to the intervention. This information could then be used to tailor intervention content to better align
42

the value of a behavior with the participants’ own values, possibly contributing to an increase in response tointerventions.
A Appendix
Table 13: Intrinsic Motivation Inventory items about mental health
Subscale ItemPerceived Choice I feel it is my choice to work on improving my mental healthPerceived Competence I am satisfied with my performance at working on improving my mental healthPerceived Competence I think I am pretty good at working on improving my mental healthInterest/Enjoyment I find mental health information very interestingValue/Usefulness I think working on improving my mental health is an important activityPerceived Competence I think I do pretty well at working on improving my mental health,
compared to my peersInterest/Enjoyment Working on improving my mental health is funValue/Usefulness I believe working on improving my mental health could be beneficial to meInterest/Enjoyment When I work on improving my mental health, I think about how much I enjoy itInterest/Enjoyment I enjoy working on improving my mental health very muchPerceived Choice I don’t really have a choice about working on improving my mental healthInterest/Enjoyment I think mental health information is very boringValue/Usefulness I think working on improving my mental health could help meValue/Usefulness I think that working on improving my mental health is usefulPerceived Competence I feel pretty skilled at improving my mental healthValue/Usefulness I believe improving my mental health could be of some value to mePerceived Competence After working on improving my mental health for awhile, I felt pretty competentInterest/Enjoyment I think mental health information is very interestingPerceived Choice I feel like I have to improve my mental healthInterest/Enjoyment I would describe improving my mental health as very enjoyableValue/Usefulness I would be willing to work on improving my mental health again
because it has some value to meValue/Usefulness I think improving my mental health is important to doPerceived Choice I work on improving my mental health because I have no choicePerceived Choice I feel like I am doing what I want to do when I do work on
improving my mental health
43

Table 14: Intrinsic Motivation Inventory items about COVID-19 guidelines
Subscale ItemInterest/Enjoyment When I follow COVID-19 guidelines, I think about how much I enjoy itPerceived Choice I feel it is my choice to follow COVID-19 guidelinesValue/Usefulness I think following COVID-19 guidelines is an important activityPerceived Competence I think I am pretty good at following COVID-19 guidelinesInterest/Enjoyment I find COVID-19 health information very interestingPerceived Competence I think I do pretty well at following COVID-19 guidelines,
compared to my peersInterest/Enjoyment Following COVID-19 guidelines is funInterest/Enjoyment I enjoy following COVID-19 guidelines very muchPerceived Choice I don’t really have a choice about following COVID-19 guidelinesPerceived Competence I am satisfied with my performance at following COVID-19 guidelinesInterest/Enjoyment I think COVID-19 health information is very boringPerceived Choice I feel like I am doing what I want to do when I follow COVID-19 guidelinesValue/Usefulness I think following COVID-19 guidelines could help meValue/Usefulness I believe following COVID-19 guidelines could be beneficial to mePerceived Competence I feel pretty skilled at following COVID-19 guidelinesValue/Usefulness I believe following COVID-19 guidelines could be of some value to meInterest/Enjoyment I think COVID-19 health information is very interestingPerceived Choice I feel like I have to follow COVID-19 guidelinesInterest/Enjoyment I would describe following COVID-19 guidelines as very enjoyableValue/Usefulness I think following COVID-19 guidelines is important to doPerceived Choice I follow COVID-19 guidelines because I have no choicePerceived Competence After following COVID-19 guidelines for awhile, I felt pretty competentValue/Usefulness I think that following COVID-19 guidelines is usefulValue/Usefulness I would be willing to follow COVID-19 guidelines again
because it has some value to me
44

Table 15: Intrinsic Motivation Inventory items about physical activity
Subscale ItemPerceived Competence I think I am pretty good at keeping a physical activity routineInterest/Enjoyment I find physical activity very interestingPerceived Choice I feel it is my choice to do physical activityInterest/Enjoyment I enjoy doing physical activity very muchPerceived Choice I don’t really have a choice about doing physical activityInterest/Enjoyment When I do physical activity, I think about how much I enjoy itPerceived Competence I am satisfied with my performance at maintaining a physical activity routineInterest/Enjoyment I think physical activity is very boringPerceived Choice I feel like I am doing what I want to do when I do physical activityValue/Usefulness I think doing physical activity could help mePerceived Competence I think I do pretty well at physical activity, compared to my peersInterest/Enjoyment Doing physical activity is funPerceived Choice I do physical activity because I have no choiceValue/Usefulness I think physical activity is an important activityValue/Usefulness I believe doing physical activity could be beneficial to mePerceived Competence After doing physical activity for awhile, I felt pretty competentValue/Usefulness I think that doing physical activity is usefulValue/Usefulness I believe physical activity could be of some value to meInterest/Enjoyment I think physical activity is very interestingPerceived Choice I feel like I have to do physical activityValue/Usefulness I would be willing to do physical activity again because it has some value to mePerceived Competence I feel pretty skilled at physical activityInterest/Enjoyment I would describe physical activity as very enjoyableValue/Usefulness I think physical activity is important to do
45

Table 16: Intrinsic Motivation Inventory items about diet & nutrition
Subscale ItemPerceived Choice I feel it is my choice to eat well and maintain a good dietValue/Usefulness I think eating well and maintaining a good diet is an important activityInterest/Enjoyment When I eat well and maintain a good diet, I think about how much I enjoy itPerceived Competence I think I am pretty good at eating well and maintaining a good dietInterest/Enjoyment I find diet and nutrition information very interestingInterest/Enjoyment Eating well and maintaining a good diet is funPerceived Competence I think I do pretty well at maintaining a good diet, compared to my peersInterest/Enjoyment I enjoy eating well and maintaining a good diet very muchPerceived Choice I don’t really have a choice about eating well and maintaining a good dietInterest/Enjoyment I think diet and nutrition information is very boringPerceived Choice I feel like I am doing what I want to do when I eat well and maintain a good dietPerceived Competence I am satisfied with my performance at eating well and maintaining a good dietValue/Usefulness I think eating well and maintaining a good diet could help meValue/Usefulness I believe eating well and maintaining a good diet could be beneficial to mePerceived Competence I feel pretty skilled at eating well and maintaining a good dietValue/Usefulness I believe eating well and maintaining a good diet could be of some value to mePerceived Competence After eating well and maintaining a good diet for awhile, I felt pretty competentInterest/Enjoyment I think diet and nutrition information is very interestingPerceived Choice I feel like I have to eat well and maintain a good dietValue/Usefulness I think eating well and maintaining a good diet is important to doInterest/Enjoyment I would describe eating well and maintaining a good diet as very enjoyableValue/Usefulness I would be willing to eat well and maintain a good diet again
because it has some value to mePerceived Choice I eat well and maintain a good diet because I have no choiceValue/Usefulness I think that eating well and maintaining a good diet is useful
46

Figure 40: The Elena+ app can deliver 43 unique coaching sessions about loneliness, anxiety, mental resources, diet& nutrition, COVID-19, physical activity, and sleep.
Figure 41: Example of a generic push notification from Elena+. When a participant tapped the notification, they werenavigated to the Elena+ app to view an initiating message.
Figure 42: Example of an initiating message. An initiating message is the first message in an intervention that requiresthe participant to reply by selecting from provided answer options. Whether or not the participant replied, and whenthe participant replied was used to calculate receptivity metrics.
47

Table 17: Effect of IMI subscale scores on receptivity in-the-moment for mental health interventions
Response Just-in-time Conversation Response DelayResponse Engagement (minutes)
(Intercept) −5.19∗∗ −2.27 −0.46 −71.37(1.67) (2.18) (3.25) (114.52)
Interest/Enjoyment −0.21 −0.23 −0.35 31.01∗
(0.25) (0.36) (0.54) (15.82)Perceived Choice 0.72∗∗∗ 0.13 −0.03 6.75
(0.20) (0.28) (0.45) (15.54)Perceived Competence −0.17 −0.18 0.41 7.27
(0.21) (0.26) (0.41) (12.77)Value/Usefulness 0.43∗ 0.05 0.18 0.83
(0.18) (0.22) (0.41) (14.04)AIC 664.89 328.13 75.16 2542.60BIC 692.13 355.37 86.63 2565.62Log Likelihood −326.45 −158.07 −31.58 −1264.30Num. obs. 692 692 50 198Num. groups: uid 20 20 20 20Var: uid (Intercept) 2.95 1.58 0.87 638.18Var: Residual 24665.74∗∗∗p < 0.001; ∗∗p < 0.01; ∗p < 0.05
Table 18: Effect of IMI subscale scores on receptivity in-the-moment for COVID-19 interventions
Response Just-in-time Conversation Response DelayResponse Engagement (minutes)
(Intercept) −0.71 −1.64 −1.24 276.79∗
(1.64) (1.76) (2.03) (127.92)Interest/Enjoyment −0.78∗ −0.21 −0.31 0.69
(0.31) (0.32) (0.34) (31.09)Perceived Choice −0.32 −0.50 −0.37 −8.89
(0.26) (0.30) (0.44) (22.14)Perceived Competence 0.17 −0.27 0.32 19.25
(0.37) (0.40) (0.47) (33.35)Value/Usefulness 0.43 0.54 0.35 −43.29
(0.32) (0.30) (0.41) (26.11)AIC 254.74 135.93 78.69 935.87BIC 274.82 156.01 90.63 952.09Log Likelihood −121.37 −61.96 −33.35 −460.94Num. obs. 210 210 54 75Num. groups: uid 20 20 20 19Var: uid (Intercept) 0.84 0.00 0.04 1104.07Var: Residual 22434.93∗∗∗p < 0.001; ∗∗p < 0.01; ∗p < 0.05
48

Table 19: Effect of IMI subscale scores on receptivity in-the-moment for physical activity interventions
Response Just-in-time Conversation Response DelayResponse Engagement (minutes)
(Intercept) −4.46 −11.33 −1.81 357.29(2.72) (7.06) (4.49) (213.28)
Interest/Enjoyment 0.20 −0.81 −0.43 −46.99(0.45) (0.87) (0.82) (30.90)
Perceived Choice 0.03 −0.37 −0.30 12.57(0.40) (0.72) (0.69) (26.30)
Perceived Competence −0.18 1.06 0.19 32.17(0.39) (0.92) (0.73) (31.28)
Value/Usefulness 0.45 1.16 0.47 −33.09(0.32) (1.01) (0.58) (33.12)
AIC 189.90 80.23 69.97 569.88BIC 209.16 99.49 81.90 582.83Log Likelihood −88.95 −34.12 −28.98 −277.94Num. obs. 183 183 54 47Num. groups: uid 20 20 20 17Var: uid (Intercept) 2.85 4.83 5.91 0.00Var: Residual 21520.80∗∗∗p < 0.001; ∗∗p < 0.01; ∗p < 0.05
Table 20: Effect of IMI subscale scores on receptivity in-the-moment for diet & nutrition interventions
Response Just-in-time Conversation Response DelayResponse Engagement (minutes)
(Intercept) −0.36 −0.82 0.41 −45.62(2.04) (2.10) (1.93) (84.67)
Interest/Enjoyment −0.37 −0.37 −0.41 19.30(0.38) (0.38) (0.36) (16.97)
Perceived Choice −0.23 −0.12 −0.02 36.49(0.36) (0.37) (0.34) (18.63)
Perceived Competence 0.33 0.37 0.35 −21.64(0.40) (0.47) (0.43) (23.71)
Value/Usefulness 0.05 −0.19 −0.12 −2.14(0.34) (0.32) (0.33) (16.76)
AIC 167.05 93.05 73.34 405.42BIC 185.15 111.15 84.69 416.69Log Likelihood −77.52 −40.52 −30.67 −195.71Num. obs. 151 151 49 37Num. groups: uid 20 20 20 16Var: uid (Intercept) 1.45 0.12 0.00 0.00Var: Residual 7035.98∗∗∗p < 0.001; ∗∗p < 0.01; ∗p < 0.05
49

0%
10%
20%
2 3 4 5 6 7Interest/Enjoyment Score
Like
lihoo
d of
Jus
t−In
−T
ime
Res
pons
e
(a) Interest/Enjoyment
4%
8%
12%
16%
3 4 5 6Perceived Choice Score
Like
lihoo
d of
Jus
t−In
−T
ime
Res
pons
e(b) Perceived Choice
0%
10%
20%
30%
2 4 6Perceived Competence Score
Like
lihoo
d of
Jus
t−In
−T
ime
Res
pons
e
(c) Perceived Competence
0%
4%
8%
12%
3 4 5 6 7Value/Usefulness Score
Like
lihoo
d of
Jus
t−In
−T
ime
Res
pons
e
(d) Value/Usefulness
Figure 43: Effect of IMI subscale scores on likelihood of just-in-time response to mental health interventions
0%
10%
20%
30%
2 4 6Interest/Enjoyment Score
Like
lihoo
d of
Jus
t−In
−T
ime
Res
pons
e
(a) Interest/Enjoyment
0%
10%
20%
30%
2 3 4 5Perceived Choice Score
Like
lihoo
d of
Jus
t−In
−T
ime
Res
pons
e
(b) Perceived Choice
0%
20%
40%
60%
3 4 5 6 7Perceived Competence Score
Like
lihoo
d of
Jus
t−In
−T
ime
Res
pons
e
(c) Perceived Competence
0%
10%
20%
30%
2 3 4 5 6 7Value/Usefulness Score
Like
lihoo
d of
Jus
t−In
−T
ime
Res
pons
e
(d) Value/Usefulness
Figure 44: Effect of IMI subscale scores on likelihood of just-in-time response to COVID-19 interventions
0%
25%
50%
75%
100%
2 3 4 5 6 7Interest/Enjoyment Score
Like
lihoo
d of
Jus
t−In
−T
ime
Res
pons
e
(a) Interest/Enjoyment
0%
20%
40%
60%
2 3 4 5 6Perceived Choice Score
Like
lihoo
d of
Jus
t−In
−T
ime
Res
pons
e
(b) Perceived Choice
0%
20%
40%
60%
80%
2 3 4 5 6 7Perceived Competence Score
Like
lihoo
d of
Jus
t−In
−T
ime
Res
pons
e
(c) Perceived Competence
0%
10%
20%
30%
40%
4 5 6 7Value/Usefulness Score
Like
lihoo
d of
Jus
t−In
−T
ime
Res
pons
e
(d) Value/Usefulness
Figure 45: Effect of IMI subscale scores on likelihood of just-in-time response to physical activity interventions
0%
20%
40%
60%
80%
2 3 4 5 6 7Interest/Enjoyment Score
Like
lihoo
d of
Jus
t−In
−T
ime
Res
pons
e
(a) Interest/Enjoyment
0%
10%
20%
30%
40%
50%
2 3 4 5 6 7Perceived Choice Score
Like
lihoo
d of
Jus
t−In
−T
ime
Res
pons
e
(b) Perceived Choice
0%
20%
40%
60%
2 3 4 5 6 7Perceived Competence Score
Like
lihoo
d of
Jus
t−In
−T
ime
Res
pons
e
(c) Perceived Competence
0%
20%
40%
60%
3 4 5 6 7Value/Usefulness Score
Like
lihoo
d of
Jus
t−In
−T
ime
Res
pons
e
(d) Value/Usefulness
Figure 46: Effect of IMI subscale scores on likelihood of just-in-time response to diet & nutrition interventions
50

0%
25%
50%
75%
100%
2 3 4 5 6 7Interest/Enjoyment Score
Like
lihoo
d of
Con
vers
atio
n E
ngag
emen
t
(a) Interest/Enjoyment
20%
40%
60%
80%
3 4 5 6Perceived Choice Score
Like
lihoo
d of
Con
vers
atio
n E
ngag
emen
t(b) Perceived Choice
0%
25%
50%
75%
100%
2 4 6Perceived Competence Score
Like
lihoo
d of
Con
vers
atio
n E
ngag
emen
t
(c) Perceived Competence
25%
50%
75%
3 4 5 6 7Value/Usefulness Score
Like
lihoo
d of
Con
vers
atio
n E
ngag
emen
t
(d) Value/Usefulness
Figure 47: Effect of IMI subscale scores on likelihood of conversation engagement with mental health interventions
0%
25%
50%
75%
2 4 6Interest/Enjoyment Score
Like
lihoo
d of
Con
vers
atio
n E
ngag
emen
t
(a) Interest/Enjoyment
25%
50%
75%
2 3 4 5Perceived Choice Score
Like
lihoo
d of
Con
vers
atio
n E
ngag
emen
t
(b) Perceived Choice
0%
25%
50%
75%
3 4 5 6 7Perceived Competence Score
Like
lihoo
d of
Con
vers
atio
n E
ngag
emen
t
(c) Perceived Competence
0%
25%
50%
75%
2 3 4 5 6 7Value/Usefulness Score
Like
lihoo
d of
Con
vers
atio
n E
ngag
emen
t
(d) Value/Usefulness
Figure 48: Effect of IMI subscale scores on likelihood of conversation engagement with COVID-19 interventions
0%
25%
50%
75%
100%
2 3 4 5 6 7Interest/Enjoyment Score
Like
lihoo
d of
Con
vers
atio
n E
ngag
emen
t
(a) Interest/Enjoyment
0%
25%
50%
75%
100%
2 3 4 5 6Perceived Choice Score
Like
lihoo
d of
Con
vers
atio
n E
ngag
emen
t
(b) Perceived Choice
0%
25%
50%
75%
2 3 4 5 6 7Perceived Competence Score
Like
lihoo
d of
Con
vers
atio
n E
ngag
emen
t
(c) Perceived Competence
0%
20%
40%
60%
80%
3 4 5 6 7Value/Usefulness Score
Like
lihoo
d of
Con
vers
atio
n E
ngag
emen
t
(d) Value/Usefulness
Figure 49: Effect of IMI subscale scores on likelihood of conversation engagement with physical activity interventions
0%
25%
50%
75%
100%
2 3 4 5 6 7Interest/Enjoyment Score
Like
lihoo
d of
Con
vers
atio
n E
ngag
emen
t
(a) Interest/Enjoyment
20%
40%
60%
80%
2 3 4 5 6 7Perceived Choice Score
Like
lihoo
d of
Con
vers
atio
n E
ngag
emen
t
(b) Perceived Choice
0%
25%
50%
75%
2 3 4 5 6 7Perceived Competence Score
Like
lihoo
d of
Con
vers
atio
n E
ngag
emen
t
(c) Perceived Competence
25%
50%
75%
3 4 5 6 7Value/Usefulness Score
Like
lihoo
d of
Con
vers
atio
n E
ngag
emen
t
(d) Value/Usefulness
Figure 50: Effect of IMI subscale scores on likelihood of conversation engagement with diet & nutrition interventions
51

Table 21: Effect of total IMI scores on receptivity in-the-moment for mental health interventions
Response Just-in-time Conversation Response DelayResponse Engagement (minutes)
(Intercept) −3.66∗ −1.29 −0.72 −112.75(1.63) (2.15) (3.02) (89.70)
Total IMI Score 0.14 −0.10 0.10 12.39∗∗
(0.08) (0.11) (0.16) (4.68)
AIC 671.04 322.75 73.87 2561.57BIC 684.66 336.36 80.05 2574.72Log Likelihood −332.52 −158.37 −33.93 −1276.78Num. obs. 692 692 58 198Num. groups: uid 20 20 20 20Var: uid (Intercept) 3.40 1.85 3.30 949.64Var: Residual 24315.22∗∗∗p < 0.001; ∗∗p < 0.01; ∗p < 0.05
Table 22: Effect of total IMI scores on receptivity in-the-moment for COVID-19 interventions
Response Just-in-time Conversation Response DelayResponse Engagement (minutes)
(Intercept) −0.87 −2.77∗ −1.52 333.74∗∗
(1.39) (1.35) (1.65) (118.39)Total IMI Score 0.01 0.03 0.10 −13.00
(0.08) (0.08) (0.10) (7.01)
AIC 265.64 137.93 79.02 958.40BIC 275.68 147.97 84.98 967.67Log Likelihood −129.82 −65.96 −36.51 −475.20Num. obs. 210 210 54 75Num. groups: uid 20 20 20 19Var: uid (Intercept) 0.95 0.00 0.00 1436.62Var: Residual 21708.25∗∗∗p < 0.001; ∗∗p < 0.01; ∗p < 0.05
52

Table 23: Effect of total IMI scores on receptivity in-the-moment for physical activity interventions
Response Just-in-time Conversation Response DelayResponse Engagement (minutes)
(Intercept) −3.49 −7.93 −0.88 306.12∗
(2.13) (4.58) (3.46) (145.70)pa imi total 0.10 0.18 −0.03 −8.86
(0.10) (0.19) (0.16) (6.84)
AIC 185.94 77.57 65.26 594.74BIC 195.57 87.20 71.23 602.14Log Likelihood −89.97 −35.79 −29.63 −293.37Num. obs. 183 183 54 47Num. groups: uid 20 20 20 17Var: uid (Intercept) 2.75 3.95 5.85 0.00Var: Residual 21568.37∗∗∗p < 0.001; ∗∗p < 0.01; ∗p < 0.05
Table 24: Effect of total IMI scores on receptivity in-the-moment for diet & nutrition interventions
Response Just-in-time Conversation Response DelayResponse Engagement (minutes)
(Intercept) −0.25 −1.32 0.65 −44.46(1.64) (1.66) (1.45) (70.02)
diet imi total −0.05 −0.07 −0.06 6.45(0.08) (0.08) (0.07) (3.49)
AIC 162.06 87.95 68.45 427.82BIC 171.11 97.00 74.13 434.26Log Likelihood −78.03 −40.98 −31.23 −209.91Num. obs. 151 151 49 37Num. groups: uid 20 20 20 16Var: uid (Intercept) 1.66 0.59 0.00 555.36Var: Residual 6637.98∗∗∗p < 0.001; ∗∗p < 0.01; ∗p < 0.05
53

0%
20%
40%
60%
80%
12 16 20 24Total IMI Score
Like
lihoo
d of
Res
pons
e
(a) Mental Health
20%
40%
60%
10 15 20 25Total IMI Score
Like
lihoo
d of
Res
pons
e
(b) COVID-19
0%
20%
40%
60%
12 16 20 24Total IMI Score
Like
lihoo
d of
Res
pons
e
(c) Physical Activity
20%
40%
60%
10 15 20 25Total IMI Score
Like
lihoo
d of
Res
pons
e
(d) Diet & Nutrition
Figure 51: Effect of total IMI scores on likelihood of response to intervention topics
0%
10%
20%
30%
12 16 20 24Total IMI Score
Like
lihoo
d of
Jus
t−In
−T
ime
Res
pons
e
(a) Mental Health
10%
20%
30%
10 15 20 25Total IMI Score
Like
lihoo
d of
Jus
t−In
−T
ime
Res
pons
e
(b) COVID-19
0%
10%
20%
30%
12 16 20 24Total IMI Score
Like
lihoo
d of
Jus
t−In
−T
ime
Res
pons
e
(c) Physical Activity
0%
10%
20%
30%
40%
10 15 20 25Total IMI Score
Like
lihoo
d of
Jus
t−In
−T
ime
Res
pons
e
(d) Diet & Nutrition
Figure 52: Effect of total IMI scores on likelihood of just-in-time response to intervention topics
25%
50%
75%
100%
10 15 20 25Total IMI Score
Con
vers
atio
n E
ngag
emen
t
(a) Mental Health
25%
50%
75%
10 15 20Total IMI Score
Con
vers
atio
n E
ngag
emen
t
(b) COVID-19
0%
25%
50%
75%
12 16 20 24Total IMI Score
Con
vers
atio
n E
ngag
emen
t
(c) Physical Activity
20%
40%
60%
80%
10 15 20 25Total IMI Score
Con
vers
atio
n E
ngag
emen
t
(d) Diet & Nutrition
Figure 53: Effect of total IMI scores on likelihood of conversation engagement with intervention topics
54

Table 25: Effect of IMI subscale scores on receptivity over a given period for mental health interventions
Overall Just-in-time Conversation Average ResponseResponse Rate Response Rate Rate Delay (minutes)
(Intercept) −0.05 0.17 0.00 −51.90(0.36) (0.19) (0.00) (94.00)
Interest/Enjoyment −0.07 −0.03 −0.00 40.54∗∗
(0.06) (0.03) (0.00) (15.71)Perceived Choice 0.11∗ 0.03 0.00 −4.06
(0.05) (0.03) (0.00) (13.77)Perceived Competence −0.06 −0.04 −0.00 −7.21
(0.05) (0.03) (0.00) (11.83)Value/Usefulness 0.08∗ 0.02 0.00 9.76
(0.04) (0.02) (0.00) (11.47)AIC 58.09 −6.54 −411.18 518.40BIC 72.51 7.89 −396.75 531.35Log Likelihood −22.04 10.27 212.59 −252.20Num. obs. 58 58 58 47Num. groups: uid 20 20 20 20Var: uid (Intercept) 0.07 0.02 0.00 0.00Var: Residual 0.06 0.02 0.00 6136.14∗∗∗p < 0.001; ∗∗p < 0.01; ∗p < 0.05
Table 26: Effect of IMI subscale scores on receptivity over a given period for COVID-19 interventions
Overall Just-in-time Conversation Average ResponseResponse Rate Response Rate Rate Delay (minutes)
(Intercept) 0.40 0.21 0.00 327.58(0.35) (0.20) (0.01) (175.08)
Interest/Enjoyment −0.13∗ −0.01 −0.00 13.11(0.06) (0.03) (0.00) (39.74)
Perceived Choice −0.06 −0.05 −0.00 −20.20(0.06) (0.04) (0.00) (29.67)
Perceived Competence 0.10 −0.02 0.00 −27.97(0.08) (0.05) (0.00) (40.14)
Value/Usefulness 0.01 0.04 −0.00 −3.93(0.06) (0.04) (0.00) (31.22)
AIC 69.95 21.15 −326.62 468.02BIC 83.87 35.07 −312.69 479.66Log Likelihood −27.97 −3.57 170.31 −227.01Num. obs. 54 54 54 39Num. groups: uid 20 20 20 19Var: uid (Intercept) 0.02 0.00 0.00 0.00Var: Residual 0.11 0.05 0.00 22706.94∗∗∗p < 0.001; ∗∗p < 0.01; ∗p < 0.05
55

Table 27: Effect of IMI subscale scores on receptivity over a given period for physical activity interventions
Overall Just-in-time Conversation Average ResponseResponse Rate Response Rate Rate Delay (minutes)
(Intercept) 0.05 −0.25 −0.00 380.30∗
(0.42) (0.24) (0.01) (149.78)Interest/Enjoyment −0.08 −0.03 −0.00 −26.28
(0.07) (0.04) (0.00) (22.16)Perceived Choice −0.06 0.00 0.00 −3.67
(0.06) (0.04) (0.00) (19.55)Perceived Competence 0.01 0.04 0.00 15.37
(0.06) (0.04) (0.00) (20.57)Value/Usefulness 0.13∗∗ 0.04 0.00 −31.62
(0.05) (0.03) (0.00) (23.07)AIC 64.40 17.21 −357.90 291.35BIC 78.32 31.13 −343.98 300.42Log Likelihood −25.20 −1.60 185.95 −138.68Num. obs. 54 54 54 27Num. groups: uid 20 20 20 17Var: uid (Intercept) 0.10 0.02 0.00 0.00Var: Residual 0.06 0.03 0.00 8388.46∗∗∗p < 0.001; ∗∗p < 0.01; ∗p < 0.05
Table 28: Effect of IMI subscale scores on receptivity over a given period for diet & nutrition interventions
Overall Just-in-time Conversation Average ResponseResponse Rate Response Rate Rate Delay (minutes)
(Intercept) −0.29 0.17 0.00 −5.87(0.36) (0.24) (0.00) (96.26)
Interest/Enjoyment −0.10 −0.04 −0.00 36.35∗
(0.07) (0.04) (0.00) (18.10)Perceived Choice −0.01 0.01 −0.00 25.58
(0.06) (0.04) (0.00) (16.29)Perceived Competence 0.04 0.03 0.00 −54.04∗
(0.07) (0.05) (0.00) (26.77)Value/Usefulness 0.15∗ −0.01 0.00 11.92
(0.06) (0.04) (0.00) (17.70)AIC 63.05 28.76 −305.72 268.54BIC 76.29 42.00 −292.47 277.35Log Likelihood −24.53 −7.38 159.86 −127.27Num. obs. 49 49 49 26Num. groups: uid 20 20 20 16Var: uid (Intercept) 0.10 0.01 0.00 0.00Var: Residual 0.06 0.04 0.00 5162.10∗∗∗p < 0.001; ∗∗p < 0.01; ∗p < 0.05
56

−0.1
0.0
0.1
0.2
0.3
2 3 4 5 6 7Interest/Enjoyment Score
Just
−In
−T
ime
Res
pons
e R
ate
(a) Interest/Enjoyment
−0.1
0.0
0.1
0.2
0.3
3 4 5 6Perceived Choice Score
Just
−In
−T
ime
Res
pons
e R
ate
(b) Perceived Choice
−0.2
0.0
0.2
0.4
2 4 6Perceived Competence Score
Just
−In
−T
ime
Res
pons
e R
ate
(c) Perceived Competence
−0.1
0.0
0.1
0.2
2 3 4 5 6 7Value/Usefulness Score
Just
−In
−T
ime
Res
pons
e R
ate
(d) Value/Usefulness
Figure 54: Effect of IMI subscale scores on just-in-time response rate for mental health interventions
−0.2
0.0
0.2
2 4 6Interest/Enjoyment Score
Just
−In
−T
ime
Res
pons
e R
ate
(a) Interest/Enjoyment
−0.1
0.0
0.1
0.2
0.3
2 3 4 5Perceived Choice Score
Just
−In
−T
ime
Res
pons
e R
ate
(b) Perceived Choice
−0.1
0.0
0.1
0.2
0.3
0.4
3 4 5 6 7Perceived Competence Score
Just
−In
−T
ime
Res
pons
e R
ate
(c) Perceived Competence
−0.2
−0.1
0.0
0.1
0.2
0.3
2 3 4 5 6 7Value/Usefulness Score
Just
−In
−T
ime
Res
pons
e R
ate
(d) Value/Usefulness
Figure 55: Effect of IMI subscale scores on just-in-time response rate for COVID-19 interventions
−0.2
0.0
0.2
0.4
2 3 4 5 6 7Interest/Enjoyment Score
Just
−In
−T
ime
Res
pons
e R
ate
(a) Interest/Enjoyment
−0.1
0.0
0.1
0.2
2 3 4 5 6Perceived Choice Score
Just
−In
−T
ime
Res
pons
e R
ate
(b) Perceived Choice
−0.2
0.0
0.2
2 3 4 5 6 7Perceived Competence Score
Just
−In
−T
ime
Res
pons
e R
ate
(c) Perceived Competence
−0.3
−0.2
−0.1
0.0
0.1
0.2
3 4 5 6 7Value/Usefulness Score
Just
−In
−T
ime
Res
pons
e R
ate
(d) Value/Usefulness
Figure 56: Effect of IMI subscale scores on just-in-time response rate for physical activity interventions
−0.2
0.0
0.2
0.4
2 3 4 5 6 7Interest/Enjoyment Score
Just
−In
−T
ime
Res
pons
e R
ate
(a) Interest/Enjoyment
−0.2
−0.1
0.0
0.1
0.2
0.3
2 3 4 5 6 7Perceived Choice Score
Just
−In
−T
ime
Res
pons
e R
ate
(b) Perceived Choice
−0.2
0.0
0.2
0.4
2 3 4 5 6 7Perceived Competence Score
Just
−In
−T
ime
Res
pons
e R
ate
(c) Perceived Competence
0.0
0.2
0.4
3 4 5 6 7Value/Usefulness Score
Just
−In
−T
ime
Res
pons
e R
ate
(d) Value/Usefulness
Figure 57: Effect of IMI subscale scores on just-in-time response rate for diet & nutrition interventions
57

0.000
0.005
2 3 4 5 6 7Interest/Enjoyment Score
Con
vers
atio
n R
ate
(a) Interest/Enjoyment
0.000
0.002
0.004
0.006
3 4 5 6Perceived Choice Score
Con
vers
atio
n R
ate
(b) Perceived Choice
0.0000
0.0025
0.0050
0.0075
2 4 6Perceived Competence Score
Con
vers
atio
n R
ate
(c) Perceived Competence
−0.0025
0.0000
0.0025
0.0050
2 3 4 5 6 7Value/Usefulness Score
Con
vers
atio
n R
ate
(d) Value/Usefulness
Figure 58: Effect of IMI subscale scores on conversation rate for mental health interventions
−0.010
−0.005
0.000
0.005
0.010
2 4 6Interest/Enjoyment Score
Con
vers
atio
n R
ate
(a) Interest/Enjoyment
0.0025
0.0050
0.0075
0.0100
2 3 4 5Perceived Choice Score
Con
vers
atio
n R
ate
(b) Perceived Choice
−0.005
0.000
0.005
0.010
3 4 5 6 7Perceived Competence Score
Con
vers
atio
n R
ate
(c) Perceived Competence
0.000
0.005
0.010
2 3 4 5 6 7Value/Usefulness Score
Con
vers
atio
n R
ate
(d) Value/Usefulness
Figure 59: Effect of IMI subscale scores on conversation rate for COVID-19 interventions
0.000
0.005
0.010
2 3 4 5 6 7Interest/Enjoyment Score
Con
vers
atio
n R
ate
(a) Interest/Enjoyment
0.000
0.005
2 3 4 5 6Perceived Choice Score
Con
vers
atio
n R
ate
(b) Perceived Choice
−0.005
0.000
0.005
2 3 4 5 6 7Perceived Competence Score
Con
vers
atio
n R
ate
(c) Perceived Competence
−0.0025
0.0000
0.0025
0.0050
3 4 5 6 7Value/Usefulness Score
Con
vers
atio
n R
ate
(d) Value/Usefulness
Figure 60: Effect of IMI subscale scores on conversation rate for physical activity interventions
−0.005
0.000
0.005
0.010
0.015
2 3 4 5 6 7Interest/Enjoyment Score
Con
vers
atio
n R
ate
(a) Interest/Enjoyment
0.000
0.003
0.006
0.009
2 3 4 5 6 7Perceived Choice Score
Con
vers
atio
n R
ate
(b) Perceived Choice
−0.005
0.000
0.005
0.010
2 3 4 5 6 7Perceived Competence Score
Con
vers
atio
n R
ate
(c) Perceived Competence
−0.005
0.000
0.005
3 4 5 6 7Value/Usefulness Score
Con
vers
atio
n R
ate
(d) Value/Usefulness
Figure 61: Effect of IMI subscale scores on conversation rate for diet & nutrition interventions
58
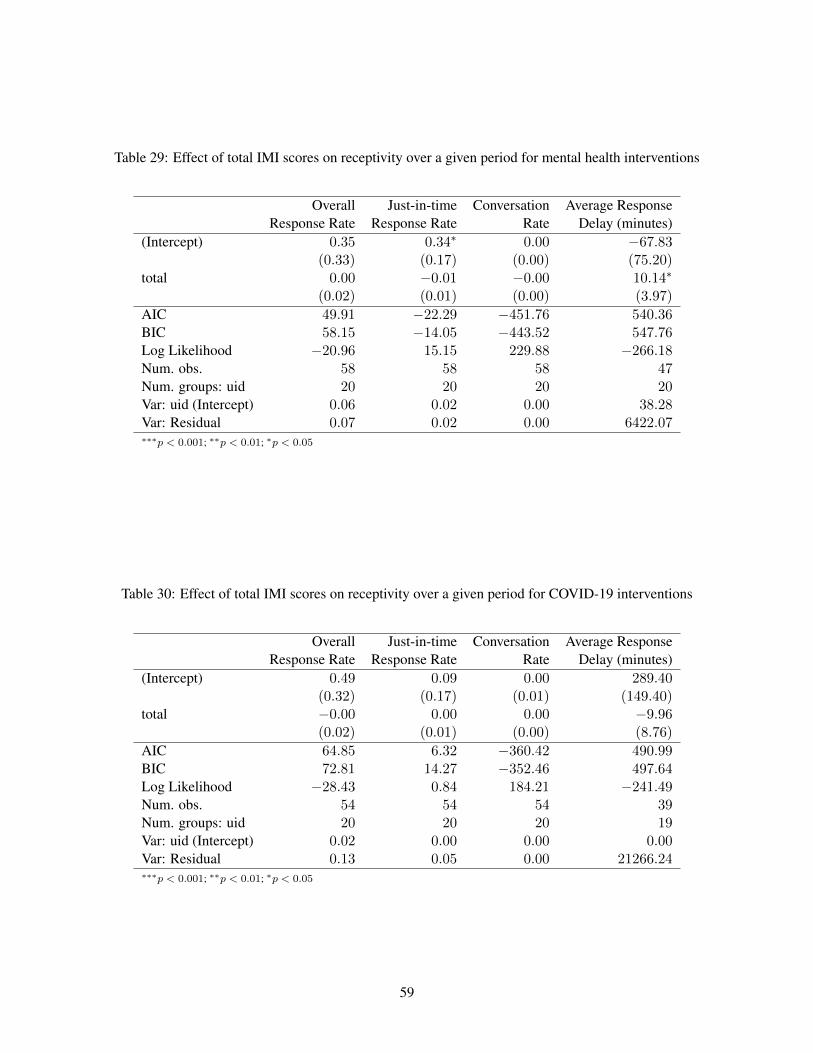
Table 29: Effect of total IMI scores on receptivity over a given period for mental health interventions
Overall Just-in-time Conversation Average ResponseResponse Rate Response Rate Rate Delay (minutes)
(Intercept) 0.35 0.34∗ 0.00 −67.83(0.33) (0.17) (0.00) (75.20)
total 0.00 −0.01 −0.00 10.14∗
(0.02) (0.01) (0.00) (3.97)
AIC 49.91 −22.29 −451.76 540.36BIC 58.15 −14.05 −443.52 547.76Log Likelihood −20.96 15.15 229.88 −266.18Num. obs. 58 58 58 47Num. groups: uid 20 20 20 20Var: uid (Intercept) 0.06 0.02 0.00 38.28Var: Residual 0.07 0.02 0.00 6422.07∗∗∗p < 0.001; ∗∗p < 0.01; ∗p < 0.05
Table 30: Effect of total IMI scores on receptivity over a given period for COVID-19 interventions
Overall Just-in-time Conversation Average ResponseResponse Rate Response Rate Rate Delay (minutes)
(Intercept) 0.49 0.09 0.00 289.40(0.32) (0.17) (0.01) (149.40)
total −0.00 0.00 0.00 −9.96(0.02) (0.01) (0.00) (8.76)
AIC 64.85 6.32 −360.42 490.99BIC 72.81 14.27 −352.46 497.64Log Likelihood −28.43 0.84 184.21 −241.49Num. obs. 54 54 54 39Num. groups: uid 20 20 20 19Var: uid (Intercept) 0.02 0.00 0.00 0.00Var: Residual 0.13 0.05 0.00 21266.24∗∗∗p < 0.001; ∗∗p < 0.01; ∗p < 0.05
59

Table 31: Effect of total IMI scores on receptivity over a given period for physical activity interventions
Overall Just-in-time Conversation Average ResponseResponse Rate Response Rate Rate Delay (minutes)
(Intercept) 0.30 −0.19 0.00 278.23∗∗
(0.34) (0.19) (0.00) (97.39)total −0.00 0.01 0.00 −8.34
(0.02) (0.01) (0.00) (4.66)
AIC 57.66 0.46 −398.59 313.48BIC 65.62 8.42 −390.63 318.66Log Likelihood −24.83 3.77 203.29 −152.74Num. obs. 54 54 54 27Num. groups: uid 20 20 20 17Var: uid (Intercept) 0.07 0.02 0.00 0.00Var: Residual 0.08 0.03 0.00 8200.92∗∗∗p < 0.001; ∗∗p < 0.01; ∗p < 0.05
Table 32: Effect of total IMI scores on receptivity over a given period for diet & nutrition interventions
Overall Just-in-time Conversation Average ResponseResponse Rate Response Rate Rate Delay (minutes)
(Intercept) 0.20 0.20 0.01∗ −18.36(0.31) (0.18) (0.00) (78.43)
total 0.01 −0.00 −0.00 5.17(0.01) (0.01) (0.00) (3.88)
AIC 53.81 12.11 −343.63 293.11BIC 61.38 19.67 −336.07 298.15Log Likelihood −22.90 −2.05 175.82 −142.56Num. obs. 49 49 49 26Num. groups: uid 20 20 20 16Var: uid (Intercept) 0.09 0.01 0.00 864.26Var: Residual 0.07 0.04 0.00 4980.16∗∗∗p < 0.001; ∗∗p < 0.01; ∗p < 0.05
60

0.0
0.2
0.4
0.6
10 15 20 25Total IMI Score
Ove
rall
Res
pons
e R
ate
(a) Mental Health
0.2
0.4
0.6
10 15 20Total IMI Score
Ove
rall
Res
pons
e R
ate
(b) COVID-19
0.0
0.2
0.4
0.6
12 16 20 24Total IMI Score
Ove
rall
Res
pons
e R
ate
(c) Physical Activity
0.00
0.25
0.50
10 15 20 25Total IMI Score
Ove
rall
Res
pons
e R
ate
(d) Diet & Nutrition
Figure 62: Effect of total IMI scores on the response rate for intervention topics
−0.1
0.0
0.1
0.2
0.3
0.4
10 15 20 25Total IMI Score
Just
−In
−T
ime
Res
pons
e R
ate
(a) Mental Health
0.0
0.1
0.2
0.3
10 15 20Total IMI Score
Just
−In
−T
ime
Res
pons
e R
ate
(b) COVID-19
−0.2
−0.1
0.0
0.1
0.2
0.3
12 16 20 24Total IMI Score
Just
−In
−T
ime
Res
pons
e R
ate
(c) Physical Activity
−0.1
0.0
0.1
0.2
0.3
10 15 20 25Total IMI Score
Just
−In
−T
ime
Res
pons
e R
ate
(d) Diet & Nutrition
Figure 63: Effect of total IMI scores on the just-in-time response rate for intervention topics
0.000
0.002
0.004
0.006
0.008
10 15 20 25Total IMI Score
Con
vers
atio
n R
ate
(a) Mental Health
0.000
0.003
0.006
0.009
10 15 20Total IMI Score
Con
vers
atio
n R
ate
(b) COVID-19
−0.0025
0.0000
0.0025
0.0050
0.0075
12 16 20 24Total IMI Score
Con
vers
atio
n R
ate
(c) Physical Activity
0.0000
0.0025
0.0050
0.0075
0.0100
10 15 20 25Total IMI Score
Con
vers
atio
n R
ate
(d) Diet & Nutrition
Figure 64: Effect of total IMI scores on the conversation rate for intervention topics
61

Acknowledgements
I would like to give special thanks to my primary thesis advisor, Professor David Kotz, and my thesis co-advisor, Ph.D. candidate Varun Mishra, for their guidance and feedback throughout my senior thesis project.I would also like to thank the staff and faculty in the Department of Computer Science for inspiring andencouraging me throughout my study of computer science. Additionally, I would like to thank my friendsand family for their constant support.
This research results from a research program at the Center for Technology and Behavioral Health atDartmouth College, supported by the NIH National Institute of Drug Abuse under award number NIH/NIDAP30DA029926. The views and conclusions contained in this document are those of the authors and shouldnot be interpreted as necessarily representing the official policies, either expressed or implied, of the spon-sors.
References
[1] Rosemarie Anderson, Sam T. Manoogian, and J. Steven Reznick. The undermining and enhancing ofintrinsic motivation in preschool children. Journal of Personality and Social Psychology, 34(5) pages915–922, 1976. DOI 10.1037/0022-3514.34.5.915.
[2] Jimmy Choi, Tamiko Mogami, and Alice Medalia. Intrinsic motivation inventory: An adapted measurefor schizophrenia research. Schizophrenia Bulletin, 36(5) pages 966–976, 2010. DOI 10.1093/schbul/sbp030.
[3] Courtney Crooks, Rachel Feinberg, Talia Ayala-Feliciangeli, Kunal Dhodapkar, Sonam Singh, andRosa Arriaga. Design and Evaluation of Mobile Mental Health Resources for First Responders. ACMInternational Conference Proceeding Series, pages 396–399, 2020. DOI 10.1145/3421937.3421968.
[4] Edward L. Deci, Richard M. Ryan, and Richard Koestner. A meta-analytic review of experimentsexamining the effects of extrinsic rewards on intrinsic motivation. Psychological Bulletin, 125(6)pages 627–668, 1999. DOI 10.1037/0033-2909.125.6.627.
[5] McAuley Edward, Terry Duncan, and Vance Tamman. Psychometric properties of the Intrinsic Mo-tivation Inventory in a competitive sport setting: a confirmatory factor analysis, 1989. Online athttps://pubmed.ncbi.nlm.nih.gov/2489825/.
[6] Andreas Filler, Tobias Kowatsch, Severin Haug, Fabian Wahle, Thorsten Staake, and Elgar Fleisch.MobileCoach: A novel open source platform for the design of evidence-based, scalable and low-costbehavioral health interventions: overview and preliminary evaluation in the public health context. InWireless Telecommunications Symposium (WTS), pages 1–6. IEEE, IEEE, 2015.
[7] Joel E Fischer, Chris Greenhalgh, and Steve Benford. Investigating episodes of mobile phone activ-ity as indicators of opportune moments to deliver notifications. In Proceedings of the InternationalConference on Human Computer Interaction with Mobile Devices and Services (MobileHCI), pages181–190. ACM, ACM, 2011.
[8] Cynthia D. Fisher. The effects of personal control, competence, and extrinsic reward systems onintrinsic motivation. Organizational Behavior and Human Performance, 21(3) pages 273–288, 1978.DOI 10.1016/0030-5073(78)90054-5.
62

[9] Ann Frodi, Lisa Bridges, and Wendy Grolnick. Correlates of Mastery-Related Behavior : A Short-Term Longitudinal Study of Infants in Their Second Year Author ( s ): Ann Frodi , Lisa Bridges andWendy Grolnick Published by : Wiley on behalf of the Society for Research in Child DevelopmentStable URL :. Child Development, 56(5) pages 1291–1298, 1985.
[10] Yoshimi Fukuoka, Caryl Gay, William Haskell, Shoshana Arai, and Eric Vittinghoff. IdentifyingFactors Associated with Dropout during Prerandomization Run-in Period from an mHealth PhysicalActivity Education Study: The mPED Trial. JMIR mHealth and uHealth, 3(2), 2015. DOI 10.2196/mhealth.3928.
[11] Tobias Kowatsch, Dirk Volland, Iris Shih, Dominik Ruegger, Florian Kunzler, Filipe Barata, AndreasFiller, Dirk Buchter, Bjorn Brogle, Katrin Heldt, and others. Design and Evaluation of a Mobile ChatApp for the Open Source Behavioral Health Intervention Platform MobileCoach. In InternationalConference on Design Science Research in Information Systems, pages 485–489. Springer, 2017.
[12] Florian Kunzler, Varun Mishra, Jan Niklas Kramer, David Kotz, Elgar Fleisch, and Tobias Kowatsch.Exploring the State-of-Receptivity for mHealth Interventions. Proceedings of the ACM on Interactive,Mobile, Wearable and Ubiquitous Technologies, 3(4), 2019. DOI 10.1145/3369805.
[13] Edwin A. Locke and Gary P. Latham. Building a practically useful theory of goal setting and taskmotivation: A 35-year odyssey. American Psychologist, 57(9) pages 705–717, 2002. DOI 10.1037/0003-066X.57.9.705.
[14] Andrew Macvean and Judy Robertson. Understanding exergame users’ physical activity, motivationand behavior over time. Conference on Human Factors in Computing Systems - Proceedings, pages1251–1260, 2013. DOI 10.1145/2470654.2466163.
[15] Abhinav Mehrotra, Sandrine R Muller, Gabriella M Harari, Samuel D Gosling, Cecilia Mascolo, MircoMusolesi, and Peter J Rentfrow. Understanding the Role of Places and Activities on Mobile PhoneInteraction and Usage Patterns. Proceedings of the ACM on Interactive, Mobile, Wearable and Ubiq-uitous Technologies (IMWUT), 1(3), 9 2017. DOI 10.1145/3131901.
[16] Abhinav Mehrotra, Veljko Pejovic, Jo Vermeulen, Robert Hendley, and Mirco Musolesi. My phoneand me: understanding people’s receptivity to mobile notifications. In Proceedings of the SIGCHIConference on Human Factors in Computing Systems (CHI), pages 1021–1032. ACM, ACM, 2016.
[17] Inbal Nahum-Shani, Shawna N. Smith, Bonnie J. Spring, Linda M. Collins, Katie Witkiewitz, AmbujTewari, and Susan A. Murphy. Just-in-time adaptive interventions (JITAIs) in mobile health: Keycomponents and design principles for ongoing health behavior support. Annals of Behavioral Medicine,52(6) pages 446–462, 2018. DOI 10.1007/s12160-016-9830-8.
[18] Johan Y.Y. Ng, Nikos Ntoumanis, Cecilie Thøgersen-Ntoumani, Edward L. Deci, Richard M. Ryan,Joan L. Duda, and Geoffrey C. Williams. Self-Determination Theory Applied to Health Contexts:A Meta-Analysis. Perspectives on Psychological Science, 7(4) pages 325–340, 2012. DOI 10.1177/1745691612447309.
[19] Joseph Ollier, Prabhakaran Santhanam, and Tobias Kowatsch. Face(book)ing the truth: Initial lessonslearned using facebook advertisements for the chatbot-delivered elena+ care for COVID-19 interven-tion. HEALTHINF 2021 - 14th International Conference on Health Informatics; Part of the 14th In-ternational Joint Conference on Biomedical Engineering Systems and Technologies, BIOSTEC 2021,5(Biostec) pages 781–788, 2021. DOI 10.5220/0010403707810788.
63

[20] Martin Pielot, Bruno Cardoso, Kleomenis Katevas, Joan Serra, Aleksandar Matic, and Nuria Oliver.Beyond Interruptibility. Proceedings of the ACM on Interactive, Mobile, Wearable and UbiquitousTechnologies, 1(3) pages 1–25, 2017. DOI 10.1145/3130956.
[21] Robert W. Plant and Richard M. Ryan. Intrinsic motivation and the effects of self-consciousness,self-awareness, and ego-involvement: An investigation of internally controlling styles. Journal ofPersonality, 53(3) pages 435–449, 1985. DOI 10.1111/j.1467-6494.1985.tb00375.x.
[22] Philips Kokoh Prasetyo, Palakorn Achananuparp, and Ee Peng Lim. Foodbot: A goal-oriented just-in-time healthy eating interventions chatbot. ACM International Conference Proceeding Series, pages436–439, 2020. DOI 10.1145/3421937.3421960.
[23] J. Lynn Reynolds. Measuring intrinsic motivations. Handbook of Research on Electronic Surveys andMeasurements, pages 170–173, 2006. DOI 10.4018/978-1-59140-792-8.ch018.
[24] Stephen Rollnick and William R Miller. What is motivational interviewing? Behavioral and CognitivePsychotherapy. Behavioral and Cognitive Psychotherapy, 23(1) pages 325–334, 1995.
[25] Richard M. Ryan. Control and information in the intrapersonal sphere: An extension of cognitiveevaluation theory. Journal of Personality and Social Psychology, 43(3) pages 450–461, 1982. DOI10.1037/0022-3514.43.3.450.
[26] Richard M. Ryan. Relation of Reward Contingency and Interpersonal Context to Intrinsic Motiva-tion: A Review and Test Using Cognitive Evaluation Theory. Article in Journal of Personality andSocial Psychology, 45(4) pages 736–750, 1983. Online at https://www.researchgate.net/publication/232554953.
[27] Richard M. Ryan and Edward L. Deci. Self-determination theory and the facilitation of intrinsicmotivation, social development, and well-being. American Psychologist, 55(1) pages 68–78, 2000.DOI 10.1007/978-94-024-1042-6 4.
[28] Richard M. Ryan and Edward L. Deci. Intrinsic and extrinsic motivation from a self-determinationtheory perspective: Definitions, theory, practices, and future directions. Contemporary EducationalPsychology, 61(April) page 101860, 2020. DOI 10.1016/j.cedpsych.2020.101860.
[29] Richard M Ryan, Heather Patrick, Edward L Deci, and Geoffrey C Williams. Facilitating health be-haviour change and its maintenance : Interventions based on Self-Determination Theory. The EuropeanHealth Psychologist, v.10 pages 2–5, 2008.
[30] Richard M. Ryan, Robert W. Plant, and Stephanie O’Malley. Initial motivations for alcohol treatment:Relations with patient characteristics, treatment involvement, and dropout. Addictive Behaviors, 20(3)pages 279–297, 1995. DOI 10.1016/0306-4603(94)00072-7.
[31] Nazir Saleheen, Amin Ahsan Ali, Syed Monowar Hossain, Hillol Sarker, Soujanya Chatterjee, Ben-jamin Marlin, Emre Ertin, Mustafa Al’Absi, and Santosh Kumar. PuffMarker: A multi-sensor ap-proach for pinpointing the timing of first lapse in smoking cessation. In UbiComp 2015 - Proceed-ings of the 2015 ACM International Joint Conference on Pervasive and Ubiquitous Computing, pages999–1010, New York, New York, USA, 9 2015. Association for Computing Machinery, Inc. DOI10.1145/2750858.2806897.
[32] Steven A Schroeder. We Can Do Better — Improving the Health of the American People. The NewEngland Journal of Medicine, v.357 pages 1221–1228, 2007. DOI 10.1056/NEJMsa073350.
64

[33] Marlene N. Silva, David Markland, Eliana V. CarraCa, Paulo N. Vieira, Sılvia R. Coutinho, Claudia S.Minderico, Margarida G. Matos, Luıs B. Sardinha, and Pedro J. Teixeira. Exercise autonomous moti-vation predicts 3-yr weight loss in women. Medicine and Science in Sports and Exercise, 43(4) pages728–737, 2011. DOI 10.1249/MSS.0b013e3181f3818f.
[34] Nikolaos Tsigilis and Argiris Theodosiou. Temporal Stability of the Intrinsic Motivation Inventory.Perceptual and Motor Skills, pages 271–280, 2003.
[35] Saskia Van Dantzig, Gijs Geleijnse, and Aart Tijmen Van Halteren. Toward a persuasive mobile ap-plication to reduce sedentary behavior. Personal and Ubiquitous Computing, 17(6) pages 1237–1246,2013. DOI 10.1007/s00779-012-0588-0.
[36] Geoffrey C. Williams, Zachary R. Freedman, and Edward L. Deci. Supporting autonomy to motivatepatients with diabetes for glucose control. Diabetes Care, 21(10) pages 1644–1651, 1998. DOI 10.2337/diacare.21.10.1644.
[37] Geoffrey C. Williams, Virginia M. Grow, Zachary R. Freedman, Richard M. Ryan, and Edward L.Deci. Motivational Predictors of Weight Loss and Weight-Loss Maintenance. Journal of Personalityand Social Psychology, 70(1) pages 115–126, 1996. DOI 10.1037/0022-3514.70.1.115.
[38] Geoffrey C. Williams, Richard M. Ryan, Gail C. Rodin, Wendy S. Grolnick, and Edward L. Deci.Autonomous regulation and long-term medication adherence in adult outpatients. Health Psychology,17(3) pages 269–276, 1998. DOI 10.1037/0278-6133.17.3.269.
65